Embed Size (px)
Citation preview

Examining Vertical Stability of Deep Rod Marks in Marshes
Philippe Hensel1, James Rassman2, Jordan Mora2, Chris Weidman2, James Lynch3, Christine Gallagher1, Jarir Saleh1 and Donald Cahoon4
1 NOAA National Geodetic Survey2 Massachusetts Department of Conservation and Recreation, Waquoit Bay National Estuarine Research Reserve3 National Park Service Northeast Region5 US Geological Survey, Patuxent Wildlife Research Center

Problem Statement 1
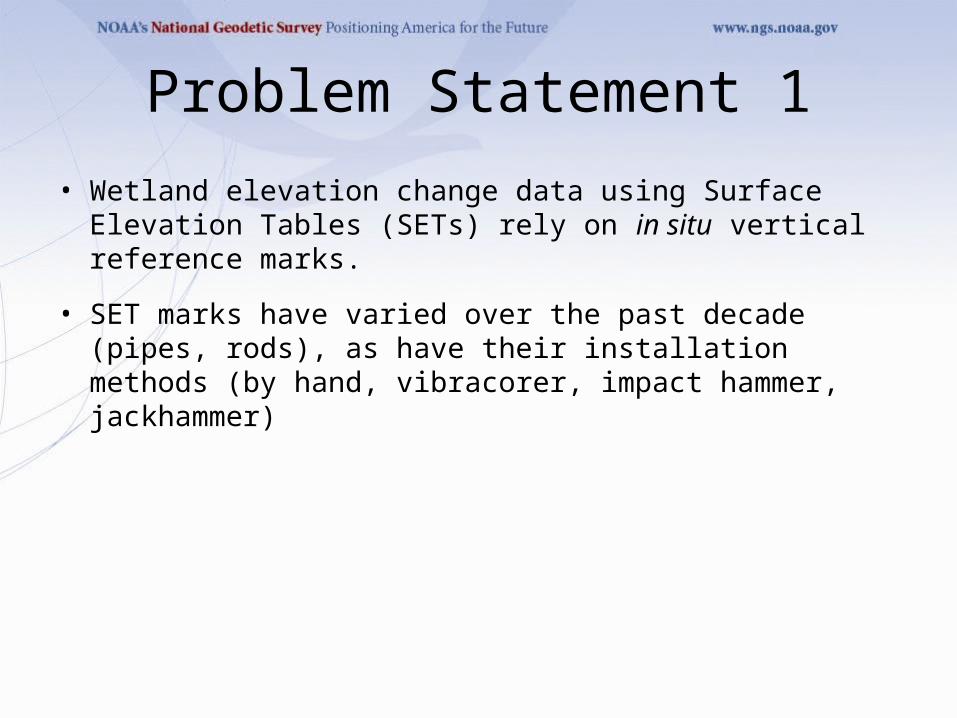
• Wetland elevation change data using Surface Elevation Tables (SETs) rely on in situ vertical reference marks.
Problem Statement 1
• Wetland elevation change data using Surface Elevation Tables (SETs) rely on in situ vertical reference marks.
• SET marks have varied over the past decade (pipes, rods), as have their installation methods (by hand, vibracorer, impact hammer, jackhammer)

Problem Statement 1
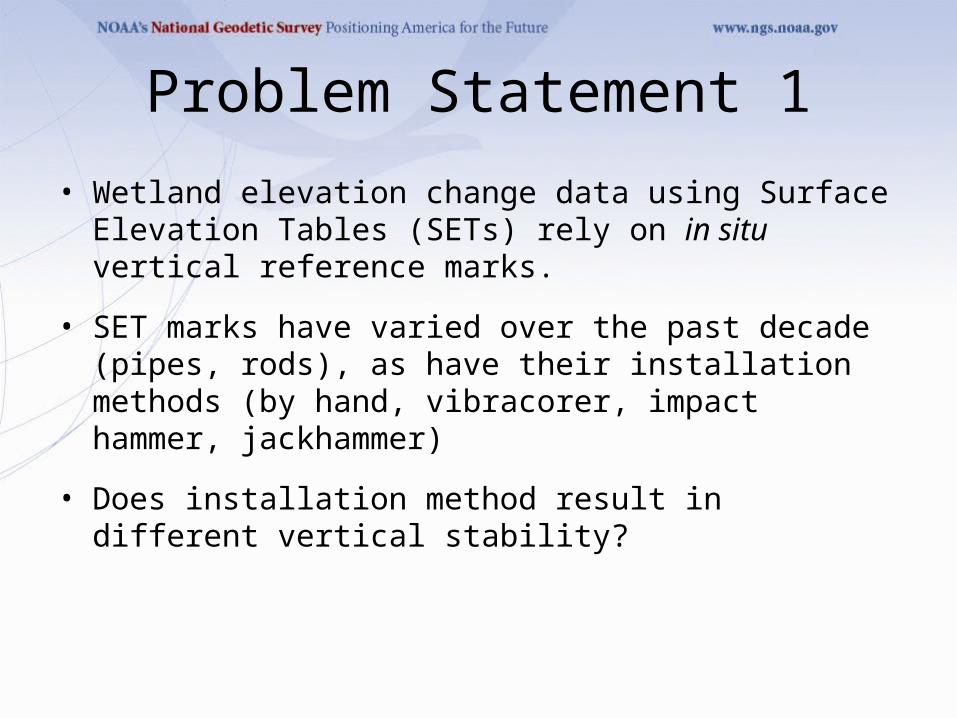
• Wetland elevation change data using Surface Elevation Tables (SETs) rely on in situ vertical reference marks.
• SET marks have varied over the past decade (pipes, rods), as have their installation methods (by hand, vibracorer, impact hammer, jackhammer)
• Does installation method result in different vertical stability?

Problem Statement 2
• Sea level change “Sentinel Sites” rely on a high accuracy local vertical control network
• Vertical control networks hard to find in marshes
Railroad Bed
NN
T3
T4
T5
T1
T2
Pat
uxe
nt
Riv
er
Railroad Bed
Railroad Bed
Low intertidal SETsHigh intertidal SETsTide station

Problem Statement 2
• Sea level change “Sentinel Sites” rely on a high accuracy local vertical control network
• Vertical control networks hard to find in marshes
Railroad Bed
NN
T3
T4
T5
T1
T2
Pat
uxe
nt
Riv
er
Railroad Bed
Railroad Bed
Low intertidal SETsHigh intertidal SETsTide station
But we have SET marks!
Can SET marks be used for vertical control?

Problem Statement 2
• Sea level change “Sentinel Sites” rely on a high accuracy local vertical control network
• Vertical control networks hard to find in marshes
• Wetland elevation change study sites contain SET marks
• Can SET marks be used as part of local vertical control networks?
• How often should one re-establish vertical connections to maintain network integrity?

A short history of the SET
• 1980’s – research into vertical wetland processes and rates focuses on vertical accretion
• 1990’s – Developed technique to include accretion and erosion: the SET

A short history of the SET
• 1980’s – research into vertical wetland processes and rates focuses on vertical accretion
• 1990’s – Developed technique to include accretion and erosion: the SET
• 2000 – Adopted sectional rod monument type for SET mark

A short history of the SET
• 1980’s – research into vertical wetland processes and rates focuses on vertical accretion
• 1990’s – Developed technique to include accretion and erosion: the SET
• 2000 – Adopted section rod monument type for SET mark
• 2010’s – NGS introduces modifications to SET instrument and reference mark

SETs and Sentinel Sites
• SETs are now being used to monitor elevation change at sentinel sites
• Can older SET technology be used in conjunction with sentinel site infrastructure?
• What is the effect of installation technique?
• Does installation technique lead to differential stability?

Waquoit Bay NERR
• Deep peat soils (300 feet?)
• Need to develop local vertical control network
• Local interest

Study Design I
• NGS 3D rod marks reference marks– Compare insertion lengths among three techniques
• Manual hand held pile driver
• Bosch 11316EVS-type electric demolition hammer
• Gasoline-powered jackhammer
– One 3D rod mark per wetland section (3)

Results
63.3’
92.8’
125.5’All methods significantly different at P 0.02
n = 3 n = 3 n = 3

Study Design II
• 3D rod marks driven to known insertion lengths in wetland soil– 20 feet
– 40 feet
– 60 feet
– 80 feet
• Perform high precision digital barcode leveling among all marks to monitor relative stability


Surveying in the MarshRep Date Cumulative Days
0 Dec. 8-10 2011
1 Dec. 14-16 2011 6 days
2 Dec. 27-28 2011 20 days
3 Jan. 9-10 2012 33 days
4 Feb. 9-10 2012 64 days
5 Mar. 12-14 2012 95 days
6a May 30 – Jun. 1 2012 174 days
6b* Jul. 2012 229 days
7 Dec. 4-6 2012 362 days* Connecting Sections 1 and 2 only

Leveling Statistics
• 90% of section misclosures 0.5 mm
• 70% of loop misclosures 0.5 mm

Results
Spurious data connecting 3060 to 3001?

Potentially spurious data connecting 3060 to 3001


Possible error in section 3060 – 3001 (seen earlier)

Possible data error 3060 – 3001 on 12/28/2011

NGS Mark 555

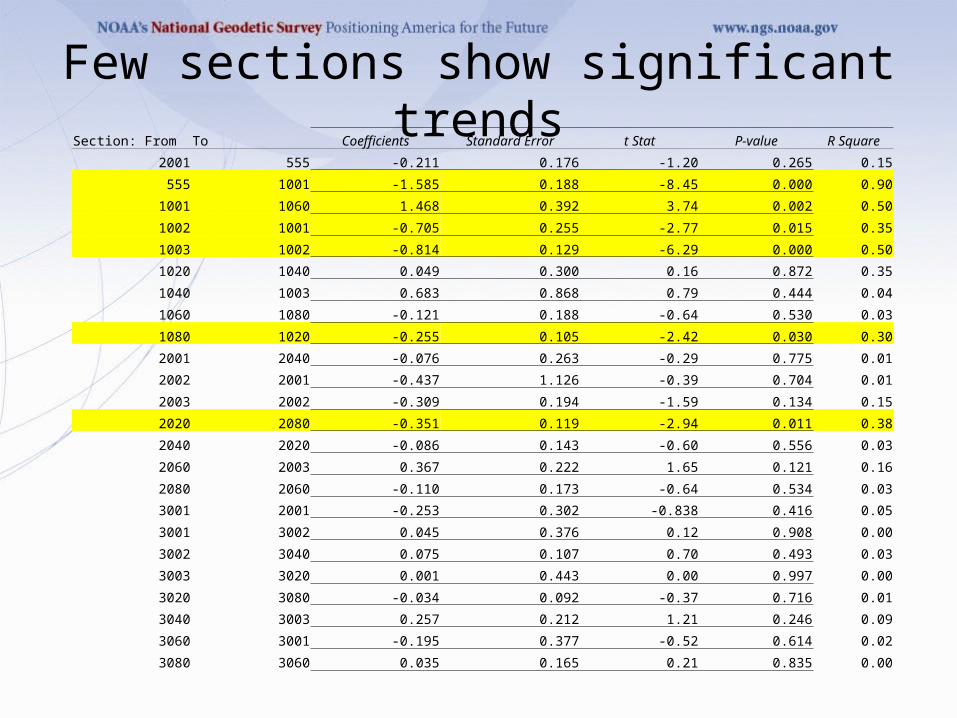
Few sections show significant trendsSection: From To Coefficients Standard Error t Stat P-value R Square
2001 555 -0.211 0.176 -1.20 0.265 0.15
555 1001 -1.585 0.188 -8.45 0.000 0.90
1001 1060 1.468 0.392 3.74 0.002 0.50
1002 1001 -0.705 0.255 -2.77 0.015 0.35
1003 1002 -0.814 0.129 -6.29 0.000 0.50
1020 1040 0.049 0.300 0.16 0.872 0.35
1040 1003 0.683 0.868 0.79 0.444 0.04
1060 1080 -0.121 0.188 -0.64 0.530 0.03
1080 1020 -0.255 0.105 -2.42 0.030 0.30
2001 2040 -0.076 0.263 -0.29 0.775 0.01
2002 2001 -0.437 1.126 -0.39 0.704 0.01
2003 2002 -0.309 0.194 -1.59 0.134 0.15
2020 2080 -0.351 0.119 -2.94 0.011 0.38
2040 2020 -0.086 0.143 -0.60 0.556 0.03
2060 2003 0.367 0.222 1.65 0.121 0.16
2080 2060 -0.110 0.173 -0.64 0.534 0.03
3001 2001 -0.253 0.302 -0.838 0.416 0.05
3001 3002 0.045 0.376 0.12 0.908 0.00
3002 3040 0.075 0.107 0.70 0.493 0.03
3003 3020 0.001 0.443 0.00 0.997 0.00
3020 3080 -0.034 0.092 -0.37 0.716 0.01
3040 3003 0.257 0.212 1.21 0.246 0.09
3060 3001 -0.195 0.377 -0.52 0.614 0.02
3080 3060 0.035 0.165 0.21 0.835 0.00

Preliminary Conclusions
• Different rod insertion techniques yield significantly different insertion lengths
• No clear evidence of initial settling
• No clear trend in (in)stability among insertion lengths
• Apparent movement of all marks within a section the result of site-specific movements or epoch-based measurement biases?