Embed Size (px)
Citation preview
Transportation Research Part A 46 (2012) 1343–1358
Contents lists available at SciVerse ScienceDirect
Transportation Research Part A
journal homepage: www.elsevier .com/locate / t ra
Examining the scaling effect and overlapping problemin logit-based stochastic user equilibrium models
Anthony Chen a,b,⇑, Surachet Pravinvongvuth c, Xiangdong Xu a,d, Seungkyu Ryu a,Piya Chootinan e
a Department of Civil and Environmental Engineering, Utah State University, Logan, UT 84322-4110, USAb Key Laboratory of Road and Traffic Engineering, Tongji University, Shanghai 201804, PR Chinac Expressway Authority of Thailand, Chatuchak, Bangkok 10900, Thailandd School of Transportation, Southeast University, Nanjing 210096, PR Chinae Bureau of Planning, Department of Highways, Bangkok 10400, Thailand
a r t i c l e i n f o
Article history:Received 29 June 2011Received in revised form 22 February 2012Accepted 18 April 2012
Keywords:Multinomial logitExtended logitRoute choice modelStochastic user equilibrium
0965-8564/$ - see front matter Published by Elseviehttp://dx.doi.org/10.1016/j.tra.2012.04.003
⇑ Corresponding author at: Department of Civil a7109; fax: +1 435 797 1185.
E-mail address: [email protected] (A. Chen
a b s t r a c t
The purpose of this paper is to examine the scaling effect and overlapping problem in aroute choice context using the logit-based stochastic user equilibrium (SUE) principle toexplicitly account for the congestion effect. Numerical experiments are performed on ninemodels: the deterministic user equilibrium model, the multinomial logit SUE model withand without scaling, the C-logit SUE model with and without scaling, the path-size logitSUE model with and without scaling, and the paired combinatorial logit SUE model withand without scaling. Sensitivity analysis is conducted to examine the effects of route sets,congestion levels, dispersion intensities, and network asymmetries. A real transportationnetwork in the City of Winnipeg, Canada is also used to compare the network equilibriumflow allocations of different SUE models. The results of the sensitivity analysis and the Win-nipeg network reveal that both scaling effect and overlapping problem can have a signifi-cant impact on the network equilibrium flow allocations.
Published by Elsevier Ltd.
1. Introduction
It is well known that the two major drawbacks in applying the multinomial logit (MNL) model to the route choice prob-lem are: (1) inability to account for overlapping (or correlation) among routes, and (2) inability to account for perceptionvariance with respect to trips of different lengths. These two drawbacks stem from the logit’s underlying assumptions thatthe random error terms are independently and identically distributed (IID) with the same, fixed variances (Sheffi, 1985).Recently, there has been a renewed interest in using advanced discrete choice models derived from random utility maximi-zation to improve the logit-based route choice model. Several modifications or generalizations of the logit structure havebeen proposed to relax the IID assumptions of the logit model. These extended logit models include the C-logit (Cascettaet al., 1996; Zhou et al., 2012), path-size logit (Ben-Akiva and Bierlaire, 1999), cross-nested logit (CNL) (Prashker and Bekhor,1998; Vovsha and Bekhor, 1998), paired combinatorial logit (PCL) (Bekhor and Prashker, 1999; Gliebe et al., 1999; Prashkerand Bekhor, 2000; Pravinvongvuth and Chen, 2005), generalized nested logit (GNL) (Bekhor and Prashker, 2001), and logitkernel (Bekhor et al., 2002). These extended logit models can be classified into three groups according to the modelstructures as suggested by Prashker and Bekhor (2004).
r Ltd.
nd Environmental Engineering, Utah State University, Logan, UT 84322-4110, USA. Tel.: +1 435 797
).
1344 A. Chen et al. / Transportation Research Part A 46 (2012) 1343–1358
1. Modifications of the MNL model: This group of models overcomes the overlapping problem by modifying the deterministic(or systematic) part of the utility function to account for the overlapping problem while still retaining the single-level treestructure of the MNL model. The models in this group include the C-logit and the path-size logit models. Both add a cor-rection term to the deterministic part of the utility function to adjust the choice probability. The C-logit model uses thecommonality factor to penalize the overlapping routes, while the path-size logit model uses a logarithmic correction termto account for different path sizes determined by the length of links within a path and the relative lengths of paths thatshare a link. Equivalent mathematical programming and variational inequality formulations for the length-based andcongestion-based C-logit stochastic user equilibrium (SUE) models were given by Zhou et al. (2012). Russo and Vitetta(2003) provided a stochastic link-based loading procedure for the length-based C-logit model, while Zhou et al. (2012)provided a path-based algorithm based on the projection method for solving both length-based and congestion-basedC-logit SUE models.
2. Generalized extreme value (GEV) models: The theory of GEV was proposed by McFadden et al. (1978). The models in thisgroup include the CNL, PCL, and GNL models. The GEV-type models capture the similarity effect through the error com-ponent of the utility function, allowing a more flexible error structure through a two-level tree structure. This flexibilityallows alternative (route) to belong to more than one nest (i.e., a nest here is a link in the CNL and GNL models or a routepair in the PCL model). The choice probability is calculated according to the two-level tree structure using the marginaland conditional probabilities. Equivalent mathematical programming formulations for all three models were given byBekhor and Prashker (1999, 2001). For solution algorithm, Chen et al. (2003) and Bekhor et al. (2008b) provided path-based algorithms for solving the PCL and CNL SUE models, respectively.
3. Mixed logit model: The mixed logit model, also known as logit kernel, random parameter logit, error component logit,and hybrid logit, is a highly flexible discrete choice model that is capable of approximating any random utility models(McFadden and Train, 2000). The logit kernel model captures the interdependencies among the alternatives throughanother probit-like error component in the utility function. Bekhor et al. (2002) adopted the factor analytic logitkernel model to capture the similarity among routes. The drawback of the logit kernel model is that the route choiceprobability expression does not exhibit generalized extreme values (i.e., no closed-form integral) and therefore,solving the route choice probabilities would require either Monte Carlo simulation or numerical integrationmethods.
For a more comprehensive review of the extended logit models used in the route choice problem, readers are directed tothe excellent reviews given by Prashker and Bekhor (2004) and Prato (2009).
Note that the extended logit models with closed-form solution discussed above were developed to address the indepen-dence assumption (i.e., route overlapping problem). However, each model has a unique mechanism to capture overlappingamong routes. For example, the PCL model handles the overlapping problem through the random error component, whileboth the C-logit and path-size logit models handle the overlapping problem by modifying the deterministic utility compo-nent. The impacts of these different overlapping handling mechanisms on the network equilibrium flow allocations have notbeen systematically explored, particularly in real networks.
In addition, these extended logit models still inherit the identically distributed assumption of the classical logit model. Inother words, the perception variance is fixed (or constant) with respect to trips of different lengths over all routes and allorigin–destination (O–D) pairs. From this viewpoint, none of the existing closed-form analytical route choice models is ableto handle the IID assumptions simultaneously. In the context of network equilibrium assignment, the identically distributedassumption seems unrealistic since it does not distinguish trip lengths of different O–D pairs. A practical approach of resolv-ing this assumption is to explicitly scale the perception variance by individual O–D pair. This individual O–D scaling consid-eration allows the perception variance to increase or decrease according to the travel distance of the O–D pair. Specifically,the systematic utility in the logit-based SUE models can be scaled appropriately to reflect different O–D trip lengths in a net-work by replacing the dispersion parameter with the total dispersion of an O–D pair. With this treatment, O–D pairs of dif-ferent trip lengths can be distinguished.
Motivated by the above two observations, this paper considers both the scaling effect and overlapping problem in aroute choice context using the logit-based SUE principle to explicitly account for the congestion effect. The contributionof this study lies in that we provide a systematic examination of the effects of both scaling effect and overlapping prob-lem on route choice probabilities and network equilibrium flow allocations. Specifically, we compare the results of ninemodels:
(1) the deterministic user equilibrium model (UE),(2) the multinomial logit model without scaling (MNL),(3) the multinomial logit model with scaling (MNLs),(4) the C-logit model without scaling (C-logit),(5) the C-logit model with scaling (C-logits),(6) the path-size logit model without scaling (PS-logit),(7) the path-size logit model with scaling (PS-logits),(8) the paired combinatorial logit model without scaling (PCL), and(9) the paired combinatorial logit model with scaling (PCLs).
A. Chen et al. / Transportation Research Part A 46 (2012) 1343–1358 1345
To set up a fair comparison, we also provide a path-based algorithm based on the partial linearization method for solvingall eight logit-based SUE models. In addition, sensitivity analysis is conducted to examine the effects of route sets, congestionlevels, dispersion intensities, and network asymmetries. A real network in the City of Winnipeg, Canada, is also used to com-pare the network equilibrium flow allocations of different SUE models.
The remainder of this paper is organized as follows. In Section 2, we review and compare several logit-based SUE formu-lations and discuss the use of an O–D specific scaling factor to scale O–D specific trip lengths for network assignment. Section3 presents a path-based algorithm for solving the SUE models. Numerical results are presented in Section 4, and conclusionsand future research are provided in Section 5.
2. Logit-based stochastic user equilibrium models
In this section, we review several entropy-type mathematical programming (MP) formulations for the logit-based sto-chastic user equilibrium (SUE) models. Specifically, we discuss the classical multinomial logit (MNL) model, approachesfor handling the overlapping problem, differences among the logit-based SUE models, and O–D specific scaling factor.
2.1. Multinomial logit model (MNL)
Fisk (1980) gave the first logit-type equivalent MP formulation for the SUE problem. The MNL SUE model is stated asfollows:
min ZMNL ¼ Z1 þ Z2 ¼Xa2A
Z xa¼Xrs2RS
Xk2Krs
f rsk
drska
0taðwÞdwþ 1
h
Xrs2RS
Xk2Krs
f rsk ln f rs
k ; ð1Þ
subject to:
Xk2Krsf rsk ¼ qrs; 8rs 2 RS; ð2Þ
f rsk P 0; 8k 2 Krs; rs 2 RS; ð3Þ
where A is the set of links; RS is the set of O–D pairs; Krs is the set of routes between O–D pair rs; h is the dispersion param-eter; xa is the flow on link a; ta(w) is the travel time on link a; f rs
k is the flow on route k between O–D pair rs; drska is equal to 1
for link a on route k between O–D pair rs and 0 otherwise; qrs is the demand between O–D pair rs.Fisk (1980) showed that the solution to the above MP formulation gives the well-known MNL probability:
Prsk ¼
e�hcrskP
l2Krse�hcrs
l; 8k 2 Krs; rs 2 RS; ð4Þ
where Prsk is the probability of selecting route k between O–D pair rs; crs
k is the cost on route k between O–D pair rs. In thisMNL SUE model, each traveler is assumed to have some perception of the route travel times in the network, and minimizesthe perceived value of the route travel times. The perception errors are assumed to be IID Gumbel distributions, which giverise to the two drawbacks (i.e., inability to account for overlapping among routes and inability to account for perception var-iance with respect to trips of different lengths) if the routes do not satisfy the IID assumptions. The biggest advantage of theMNL SUE model is that it has a closed-form logit probability expression enabling efficient computation for the equilibriumsolution. Both path enumeration techniques (Ben-Akiva et al., 1984; Cascetta et al., 1997, 2002) and column (or path) gen-eration techniques (Chen and Alfa, 1991; Bell et al., 1993, 1997; Damberg et al., 1996; Leurent, 1997; Huang and Bell, 1998;Maher, 1998; Bekhor and Toledo, 2005; Chen et al., 2005, 2009, 2010; Chootinan et al., 2005) have been developed for solvingFisk’s MP formulation. Column generation techniques for the logit-based SUE model can be implemented in the link- or path-based domains. The link-based algorithms (Chen and Alfa, 1991; Bell et al., 1993; Leurent, 1997; Huang and Bell, 1998;Maher, 1998) do not require path storage and often use Dial’s STOCH algorithm (Dial, 1971) or Bell’s alternative (1995) asthe stochastic loading step, while the path-based algorithms (Damberg et al., 1996; Bell et al., 1997; Bekhor and Toledo,2005; Chen et al., 2005, 2009, 2010; Chootinan et al., 2005) require explicit path storage in order to directly compute thelogit route choice probabilities.
2.2. Approaches for handling the overlapping problem
To overcome the deficiencies of the MNL route choice model, some analytical closed-form extensions have been proposedrecently. In this section, we focus on the C-logit and path-size logit models in group 1 (modifications of the MNL model) andthe PCL model in group 2 (GEV models). Both C-logit and path-size logit models have been widely adopted in the routechoice problem due to its simplicity in resolving the overlapping problem (e.g., Cascetta et al., 1996; Ben-Akiva and Bierlaire,1999, 2003; Hoogendoorn-Lanser et al., 2005; Frejinger and Bierlaire, 2007; Hoogendoorn-Lanser and Bovy, 2007; Bovy et al.,2008; Zhou et al., 2012; Ben-Akiva et al., 2011). As for the GEV-type models (CNL, PCL, and GNL), the PCL model is considered
1346 A. Chen et al. / Transportation Research Part A 46 (2012) 1343–1358
more suitable for adaptation to the route choice problem to resolve the overlapping problem while keeping the analyticaltractability of the logit choice probability expression. In the PCL model, each pair of alternatives can have a similarity rela-tionship that is completely independent of the similarity relationship of other pairs of alternatives. Bekhor and Prashker(1999) argued that this feature is highly desirable for route choice models, since each pair of routes may have different sim-ilarities. Gliebe et al. (1999) demonstrated with binomial and trinomial choice examples to show that the PCL model could bescaled to account for perception variance with respect to different trip lengths. Both features are useful in addressing thewell-known ‘‘independence of irrelevant alternatives’’ (IIA) property inherited in the MNL model. In both studies, only simpleexamples (i.e., two routes in a two-link network, three routes in the loop-hole network, or six routes in a nine-node grid net-work) with limited number of routes were provided to illustrate the flexibility of PCL’s hierarchical tree structure in over-coming the drawbacks of the MNL model. Implementation issues of the PCL network assignment were discussed, but nosolution algorithm was provided. Chen et al. (2003) provided a solution algorithm based on the partial linearization method,which is a descent algorithm for convex optimization problems (Patriksson, 1994). Numerical experiments were performedto examine how the PCL model handles the overlapping problem through the similarity index using its hierarchical treestructure. However, the effect of scaling PCL to account for perception variance of different trip lengths in the context of net-work equilibrium assignment was not examined. In this paper, both the scaling effect and overlapping problem are fullyexamined in the PCL SUE model.
2.2.1. C-logit modelCascetta et al. (1996) provided one of the early approaches for handling the overlapping problem by introducing a com-
monality factor to correct the deterministic (or systematic) part of the utility function while still retaining the single-levelstructure of the MNL model. One possible functional form of the commonality factor suggested by Cascetta et al. (1996) is:
CFrsk ¼ b0 ln
Xl2Krs
Lrsklffiffiffiffiffiffiffiffiffiffiffiffiffiffi
Lrsk � L
rsl
q0B@
1CA
c
; 8k 2 Krs; rs 2 RS; ð5Þ
where b0 and c are the parameters; Lrskl is the common length of routes k and l between O–D pair rs; Lrs
k and Lrsl are the lengths
of route k and route l between O–D pair rs, respectively.Zhou et al. (2012) provided an equivalent MP formulation for the C-logit SUE model as follows:
min ZC-logit ¼ Z1 þ Z2 ¼Xa2A
Z xa¼Xrs2RS
Xk2Krs
f rsk
drska
0taðwÞdwþ 1
h
Xrs2RS
Xk2Krs
f rsk ln f rs
k þXrs2RS
Xk2Krs
f rsk CFrs
k ; ð6Þ
subject to Eqs. (2) and (3). The above MP formulation can be regarded as an extension of Fisk’s (1980) logit-based MP for-mulation. An additional term (i.e., the third term) is introduced in the objective function (6) to capture the similarities amongthe routes. Since the objective function is strictly convex with respect to the route flows, and the constraints are all linear, theC-logit MP formulation has a unique route-flow solution. In addition, the solution gives the C-logit probability expression:
Prsk ¼
e�h�ðcrskþCFrs
k ÞPl2Krs
e�h�ðcrslþCFrs
l Þ; 8k 2 Krs; rs 2 RS: ð7Þ
Though an analytical closed-form solution is available, the IIA property is generally violated due to the commonality factors.Depending on the functional form used to model the commonality factors, a link-based algorithm (Russo and Vitetta, 2003)or a path-based algorithm (Zhou et al., 2012) could be used to solve the C-logit MP formulation.
2.2.2. Path-size logit (PS-logit) modelBen-Akiva and Bierlaire (1999) proposed the PS-logit model as an alternative to alleviate the overlapping problem. Unlike
the C-logit model that uses the commonality factor to penalize the overlapping routes, the PS-logit model uses a logarithmiccorrection term to modify route utility. This logarithmic correction term accounts for different path sizes determined by thelength of links within a path and the relative lengths of paths that share a link. This correction term is given by:
PSrsk ¼
Xa on k
la
Lrsk
� �� 1P
l2Krsdrs
la
!; 8k 2 Krs; rs 2 RS: ð8Þ
where la is the length of link a.An equivalent MP formulation can be written as follows:
min ZPS�logit ¼ Z1 þ Z2 ¼Xa2A
Z xa¼Xrs2RS
Xk2Krs
f rsk
drska
0taðwÞdwþ 1
h
Xrs2RS
Xk2Krs
f rsk ln f rs
k �1h
Xrs2RS
Xk2Krs
f rsk ln PSrs
k ; ð9Þ
subject to Eqs. (2) and (3). Similar to the C-logit MP formulation, an additional flow-independent term (i.e., the third term) isintroduced in the objective function (9) to capture the length/size of the routes in order to correct the calculated choice
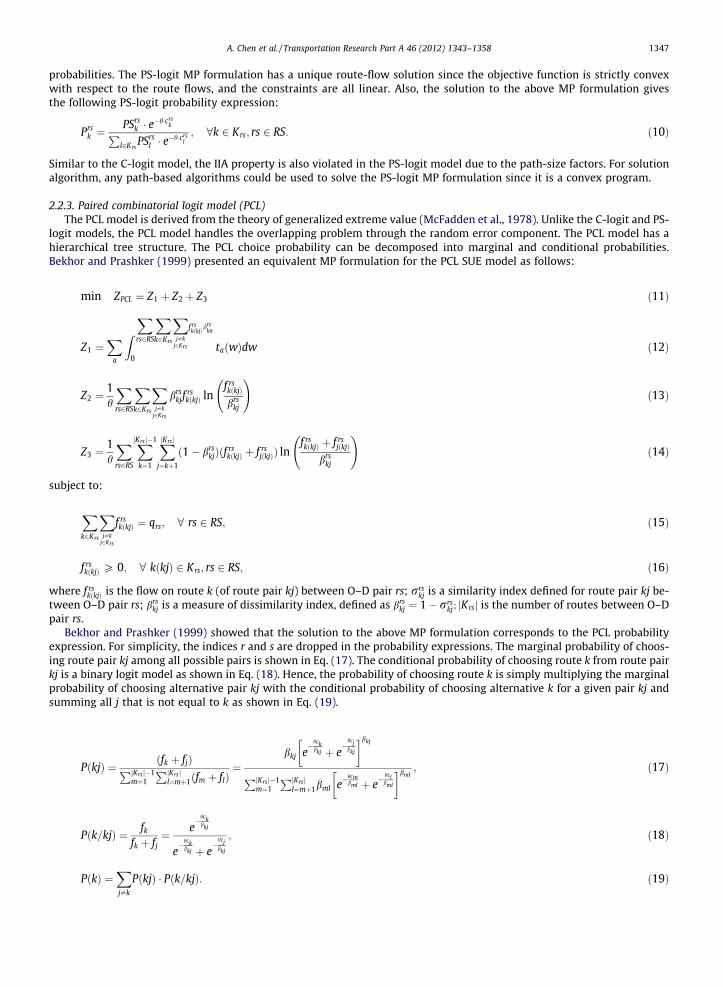
A. Chen et al. / Transportation Research Part A 46 (2012) 1343–1358 1347
probabilities. The PS-logit MP formulation has a unique route-flow solution since the objective function is strictly convexwith respect to the route flows, and the constraints are all linear. Also, the solution to the above MP formulation givesthe following PS-logit probability expression:
Prsk ¼
PSrsk � e�h�crs
kPl2Krs
PSrsl � e�h�crs
l; 8k 2 Krs; rs 2 RS: ð10Þ
Similar to the C-logit model, the IIA property is also violated in the PS-logit model due to the path-size factors. For solutionalgorithm, any path-based algorithms could be used to solve the PS-logit MP formulation since it is a convex program.
2.2.3. Paired combinatorial logit model (PCL)The PCL model is derived from the theory of generalized extreme value (McFadden et al., 1978). Unlike the C-logit and PS-
logit models, the PCL model handles the overlapping problem through the random error component. The PCL model has ahierarchical tree structure. The PCL choice probability can be decomposed into marginal and conditional probabilities.Bekhor and Prashker (1999) presented an equivalent MP formulation for the PCL SUE model as follows:
min ZPCL ¼ Z1 þ Z2 þ Z3 ð11Þ
Z1 ¼X
a
ZXrs2RS
Xk2Krs
Xj–k
j2Krs
f rskðkjÞd
rska
0taðwÞdw ð12Þ
Z2 ¼1h
Xrs2RS
Xk2Krs
Xj–k
j2Krs
brskjf
rskðkjÞ ln
f rskðkjÞ
brskj
!ð13Þ
Z3 ¼1h
Xrs2RS
XjKrs j�1
k¼1
XjKrs j
j¼kþ1
ð1� brskjÞðf rs
kðkjÞ þ f rsjðkjÞÞ ln
f rskðkjÞ þ f rs
jðkjÞ
brskj
!ð14Þ
subject to:
Xk2Krs
Xj–k
j2Krs
f rskðkjÞ ¼ qrs; 8 rs 2 RS; ð15Þ
f rskðkjÞ P 0; 8 kðkjÞ 2 Krs; rs 2 RS; ð16Þ
where f rskðkjÞ is the flow on route k (of route pair kj) between O–D pair rs; rrs
kj is a similarity index defined for route pair kj be-tween O–D pair rs; brs
kj is a measure of dissimilarity index, defined as brskj ¼ 1� rrs
kj; jKrsj is the number of routes between O–Dpair rs.
Bekhor and Prashker (1999) showed that the solution to the above MP formulation corresponds to the PCL probabilityexpression. For simplicity, the indices r and s are dropped in the probability expressions. The marginal probability of choos-ing route pair kj among all possible pairs is shown in Eq. (17). The conditional probability of choosing route k from route pairkj is a binary logit model as shown in Eq. (18). Hence, the probability of choosing route k is simply multiplying the marginalprobability of choosing alternative pair kj with the conditional probability of choosing alternative k for a given pair kj andsumming all j that is not equal to k as shown in Eq. (19).
PðkjÞ ¼ ðfk þ fjÞPjKrs j�1m¼1
PjKrs jl¼mþ1ðfm þ flÞ
¼bkj e
�hckbkj þ e
�hcjbkj
� �bkj
PjKrs j�1m¼1
PjKrs jl¼mþ1bml e�
hcmbml þ e�
hclbml
� �bml; ð17Þ
Pðk=kjÞ ¼ fk
fk þ fj¼ e
�hckbkj
e�hck
bkj þ e�
hcjbkj
; ð18Þ
PðkÞ ¼Xj–k
PðkjÞ � Pðk=kjÞ: ð19Þ
1348 A. Chen et al. / Transportation Research Part A 46 (2012) 1343–1358
2.3. Comparison among the logit-based SUE models
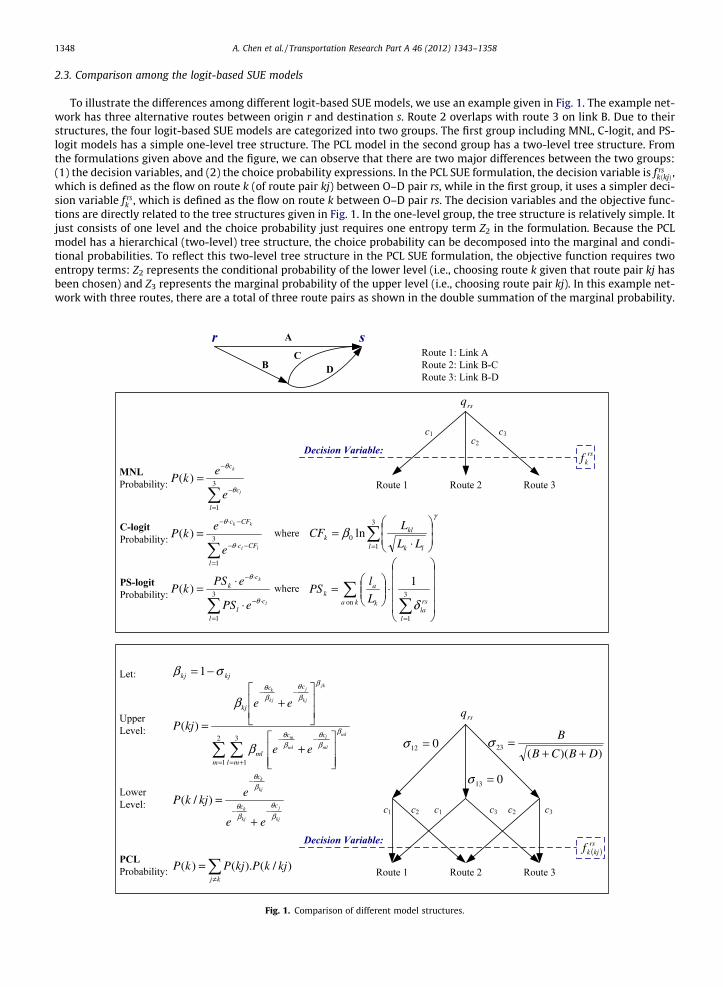
To illustrate the differences among different logit-based SUE models, we use an example given in Fig. 1. The example net-work has three alternative routes between origin r and destination s. Route 2 overlaps with route 3 on link B. Due to theirstructures, the four logit-based SUE models are categorized into two groups. The first group including MNL, C-logit, and PS-logit models has a simple one-level tree structure. The PCL model in the second group has a two-level tree structure. Fromthe formulations given above and the figure, we can observe that there are two major differences between the two groups:(1) the decision variables, and (2) the choice probability expressions. In the PCL SUE formulation, the decision variable is f rs
kðkjÞ,which is defined as the flow on route k (of route pair kj) between O–D pair rs, while in the first group, it uses a simpler deci-sion variable f rs
k , which is defined as the flow on route k between O–D pair rs. The decision variables and the objective func-tions are directly related to the tree structures given in Fig. 1. In the one-level group, the tree structure is relatively simple. Itjust consists of one level and the choice probability just requires one entropy term Z2 in the formulation. Because the PCLmodel has a hierarchical (two-level) tree structure, the choice probability can be decomposed into the marginal and condi-tional probabilities. To reflect this two-level tree structure in the PCL SUE formulation, the objective function requires twoentropy terms: Z2 represents the conditional probability of the lower level (i.e., choosing route k given that route pair kj hasbeen chosen) and Z3 represents the marginal probability of the upper level (i.e., choosing route pair kj). In this example net-work with three routes, there are a total of three route pairs as shown in the double summation of the marginal probability.
Fig. 1. Comparison of different model structures.
A. Chen et al. / Transportation Research Part A 46 (2012) 1343–1358 1349
The similarity index (rkj) is used to account for the overlapping portion of each route pair. Z2 is a modification of Fisk’s en-tropy term by including the dissimilarity index (bkj = 1 � rkj), and Z3 is the additional entropy term included to reflect thehigher choice level. It can be shown that if rkj is equal to zero for all kj pairs, the PCL model reduces to the MNL model(Koppelman and Wen, 2000).
2.4. Origin–destination specific scaling factor
The MNL model has the independence of irrelevant alternatives (IIA) property, which is a consequence of the independentlyand identically distributed (IID) assumptions inherited in using the Gumbel distributed error term. The independence assump-tion in the context of route choice refers to the overlapping problem. To a certain extent, this can be overcome by using theextended logit models (e.g., C-logit, PS-logit, and PCL). The identically distributed assumption refers to the fixed (or constant)perception variance with respect to trips of different lengths over all routes and all O–D pairs. In the context of network assign-ment, this assumption seems unrealistic since it does not distinguish trip lengths of different O–D pairs. The variance of theGumbel error term that underlies in the logit-based SUE models is scaled by individual O–D pair as follows.
Varðersk Þ ¼
p2
6l02rs; 8k 2 Krs; rs 2 RS; ð20Þ
where l0rs is a scaling parameter for O–D pair rs. It is important to note that all routes between O–D pair rs are assumed tohave the same variance, because scaling each individual route with a different scaling factor would violate the logit-basedSUE models’ assumption of an identical variance across routes. Following Gliebe et al. (1999), the variance of the perceivedroute travel times can be obtained by summing the perceived travel times on all links comprising it as shown in Eq. (21),where g is the proportionality constant. Hence, the O–D specific scaling factor can be computed as shown in Eq. (22).
Varðersk Þ ¼
Xa2A
g � tfa � d
rska; 8k 2 Krs; rs 2 RS; ð21Þ
l0rs ¼pffiffiffiffiffiffiffiffiffiffiffiffiffiffiffiffiffiffiffiffiffiffiffiffiffiffiffiffiffiffiffi
6P
a2Agtfad
rs�ka
� �q ; 8rs 2 RS; ð22Þ
where tfa is the distance (or free-flow travel time) of link a, �k is the shortest route for O–D pair rs. This individual O–D scaling
factor allows the perception variance to increase or decrease according to the travel distance of the O–D pair. Using the O–Dspecific scaling factor defined in Eq. (22), the systematic utility in the logit-based SUE models can be scaled appropriately toreflect different O–D trip lengths in a network by replacing the dispersion parameter (h) with the total dispersion (lrs) of anO–D pair rs, where lrs ¼ hl0rs. Note that the presence of the O–D specific scaling factor l0rs cannot be estimated apart from thedispersion parameter h. Typically, the scaling factor is arbitrarily set to one for convenience to maintain the assumption ofhomoscedastic disturbances (Ben-Akiva and Lerman, 1985). However, for traffic assignment purposes where there are manyO–D pairs in a network, the O–D specific scaling factor (l0rs) will be useful in distinguishing O–D pairs of different triplengths. Instead of setting the scaling factor equal to one, we set the dispersion parameter to one.
3. Solution algorithm
In this section, we present a path-based algorithm based on the partial linearization method for solving all eight logit-based SUE models. This method is a descent algorithm for solving convex optimization problems (Patriksson, 1994). The par-tial linearization algorithm iterates between the search direction and line search until some convergence criterion is reached.The search direction is obtained by solving a first-order approximation of an additive part (Z1) of the original objective func-tion. For the line search step, we use the classical generalized Armijo rule (Bertsekas, 1976) to find an approximate stepsize.The general procedure of the partial linearization algorithm for solving the logit-based SUE models is as follows:
Step 0 Initialization: Set an initial feasible solution f(0) and let n = 0.Step 1 Search Direction: Update route costs c(n) based on f(n) and then solve a partially linearized subproblem to obtain
an auxiliary solution h(n). The resultant search direction is h(n) � f(n).Step 2 Line Search: Solve aðnÞ ¼ arg min
06a61Z½fðnÞ þ aðhðnÞ � fðnÞÞ�.
Step 3 Update: Let fðnþ 1Þ ¼ fðnÞ þ aðnÞ � ½hðnÞ � fðnÞ�.Step 4 Termination Criterion: If some termination criterion is satisfied, then terminate; otherwise, set n :¼ nþ 1 and go
to Step 1.
For different logit-based SUE models, there are three main different specifications in the above procedure:
(1) Solution variable: in the MNL(s), C-logit(s), and PS-logit(s) models, the solution variables are route flows f rsk ; whereas in
the PCL(s) model, the solution variables are f rskðkjÞ, i.e., flow on route k (of route pair kj) between O–D pair rs.
1350 A. Chen et al. / Transportation Research Part A 46 (2012) 1343–1358
(2) Search direction: the search direction is the difference between the current solution f(n) and the auxiliary solution h(n).For different SUE models, we use different stochastic loadings to obtain the auxiliary solution h(n):
� MNL(s) model: use Eq. (4) to obtain Prsk ðcðnÞÞ and hrsk ðnÞ ¼ qrs � P
rsk ðcðnÞÞ.
� C-logit(s) model: use Eq. (7) to obtain Prsk ðcðnÞÞ and hrs
k ðnÞ ¼ qrs � Prsk ðcðnÞÞ.
� PS-logit(s) model: use Eq. (10) to obtain Prsk ðcðnÞÞ and hrs
k ðnÞ ¼ qrs � Prsk ðcðnÞÞ.
� PCL(s) model: use Eq. (19) to obtain Prsk ðcðnÞÞ and hrs
k ðnÞ ¼ qrs � Prsk ðcðnÞÞ.
(3) Scaling factor calculation: for the scaled models, we need to calculate the O–D specific scaling factor (l0rs) according toEq. (22).
For the user equilibrium (UE) problem, we use the well-known Frank-Wolfe algorithm to solve it (Sheffi, 1985).
4. Numerical results
In this section, we present two numerical examples. Example 1 is a nine-node network. This simple network allows us toexamine the scaling effect and the overlapping problem in details. Example 2 is the Winnipeg network used as a real casestudy to examine the effect of different route choice models on network equilibrium flow allocations. In both examples, wecompare the results of nine models including the user equilibrium (UE), MNL, MNLs, C-logit, C-logits, PS-logit, PS-logits, PCL,and PCLs models, where ‘‘s’’ denotes the scaled model. The default parameters are set as follows: the dispersion parameter(h) and the proportionality constant (g) for scaling factor are assumed to be 1.0; b0 and c for calculating CFk are assumed to be0.1 and 1.0, respectively.
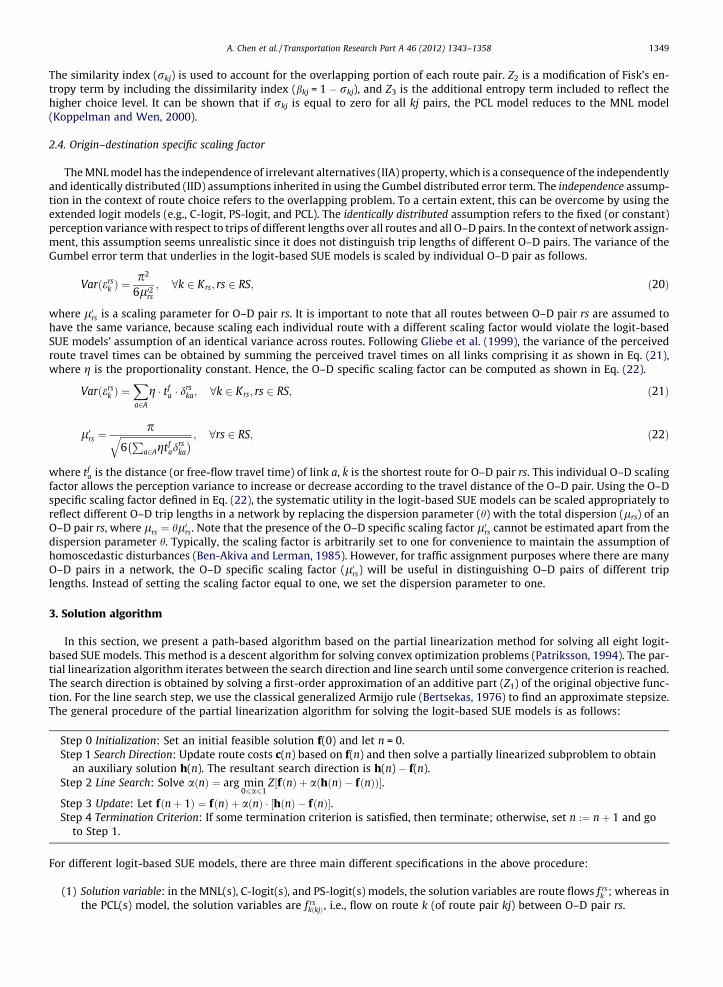
4.1. Example 1: nine-node network
The topology of the simple network used in Example 1 is given in Fig. 2. It consists of 9 nodes, 14 links, and one O–D pair(1 ? 9) with a demand of 600 vph. The standard Bureau of Public Road (BPR) link cost function as shown in Eq. (23) isadopted in the analysis.
taðxÞ ¼ tfa 1þ 0:15
xa
ca
� �4" #
; ð23Þ
where tfa is the free-flow travel time on link a; ca is the capacity on link a. Free-flow travel time (minutes) and capacity (vehi-
cle per hour) of all links in the network are provided in Fig. 2.
4.1.1. Three-route scenarioWe start with a simple scenario which consists of three independent routes (routes 1–3 in Fig. 2). The purpose of this
scenario is to test how the models perform when the IID assumptions are satisfied. The objective values and total traveltimes of the three independent routes are tabulated in Table 1. As expected, since this scenario has no overlapping amongthe three routes, all stochastic models perform exactly the same as the MNL model. The scaled models give the same resultsas the non-scaled models because all three routes have equal route costs (see Z1 and total travel time under the three-route
Fig. 2. Test network in example 1 (9-node network).
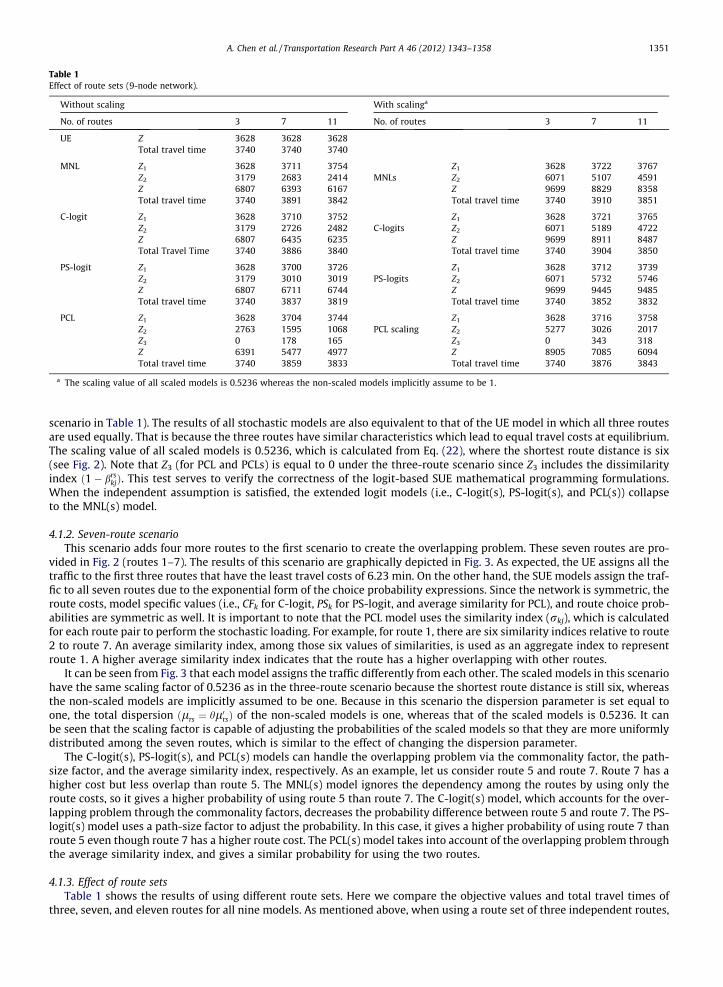
Table 1Effect of route sets (9-node network).
Without scaling With scalinga
No. of routes 3 7 11 No. of routes 3 7 11
UE Z 3628 3628 3628Total travel time 3740 3740 3740
MNL Z1 3628 3711 3754 Z1 3628 3722 3767Z2 3179 2683 2414 MNLs Z2 6071 5107 4591Z 6807 6393 6167 Z 9699 8829 8358Total travel time 3740 3891 3842 Total travel time 3740 3910 3851
C-logit Z1 3628 3710 3752 Z1 3628 3721 3765Z2 3179 2726 2482 C-logits Z2 6071 5189 4722Z 6807 6435 6235 Z 9699 8911 8487Total Travel Time 3740 3886 3840 Total travel time 3740 3904 3850
PS-logit Z1 3628 3700 3726 Z1 3628 3712 3739Z2 3179 3010 3019 PS-logits Z2 6071 5732 5746Z 6807 6711 6744 Z 9699 9445 9485Total travel time 3740 3837 3819 Total travel time 3740 3852 3832
PCL Z1 3628 3704 3744 Z1 3628 3716 3758Z2 2763 1595 1068 PCL scaling Z2 5277 3026 2017Z3 0 178 165 Z3 0 343 318Z 6391 5477 4977 Z 8905 7085 6094Total travel time 3740 3859 3833 Total travel time 3740 3876 3843
a The scaling value of all scaled models is 0.5236 whereas the non-scaled models implicitly assume to be 1.
A. Chen et al. / Transportation Research Part A 46 (2012) 1343–1358 1351
scenario in Table 1). The results of all stochastic models are also equivalent to that of the UE model in which all three routesare used equally. That is because the three routes have similar characteristics which lead to equal travel costs at equilibrium.The scaling value of all scaled models is 0.5236, which is calculated from Eq. (22), where the shortest route distance is six(see Fig. 2). Note that Z3 (for PCL and PCLs) is equal to 0 under the three-route scenario since Z3 includes the dissimilarityindex ð1� brs
kjÞ. This test serves to verify the correctness of the logit-based SUE mathematical programming formulations.When the independent assumption is satisfied, the extended logit models (i.e., C-logit(s), PS-logit(s), and PCL(s)) collapseto the MNL(s) model.
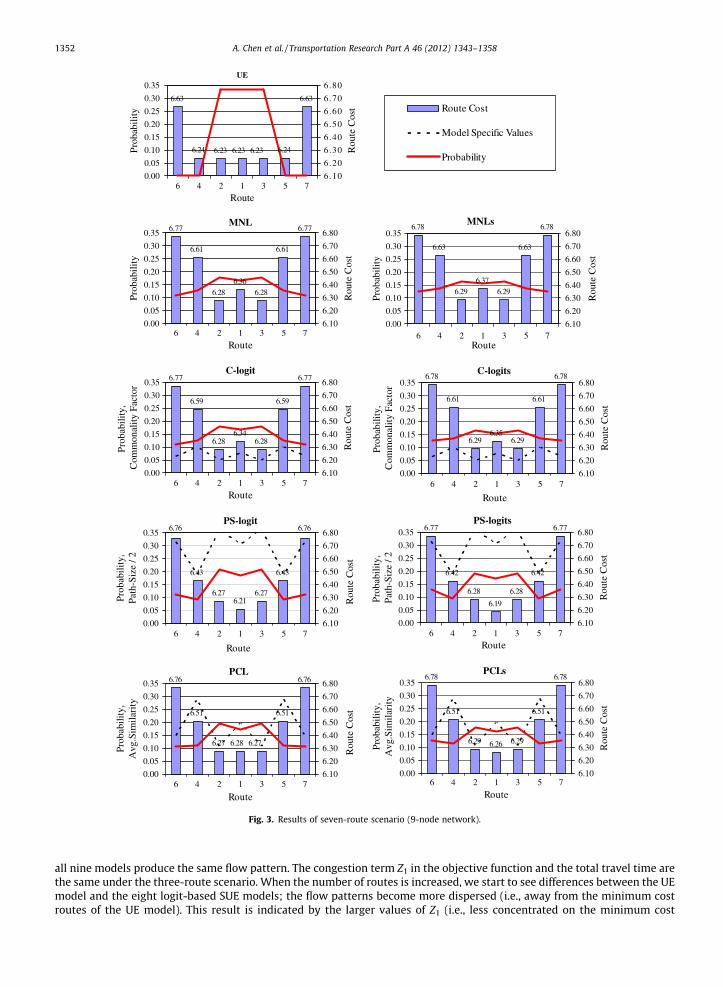
4.1.2. Seven-route scenarioThis scenario adds four more routes to the first scenario to create the overlapping problem. These seven routes are pro-
vided in Fig. 2 (routes 1–7). The results of this scenario are graphically depicted in Fig. 3. As expected, the UE assigns all thetraffic to the first three routes that have the least travel costs of 6.23 min. On the other hand, the SUE models assign the traf-fic to all seven routes due to the exponential form of the choice probability expressions. Since the network is symmetric, theroute costs, model specific values (i.e., CFk for C-logit, PSk for PS-logit, and average similarity for PCL), and route choice prob-abilities are symmetric as well. It is important to note that the PCL model uses the similarity index (rkj), which is calculatedfor each route pair to perform the stochastic loading. For example, for route 1, there are six similarity indices relative to route2 to route 7. An average similarity index, among those six values of similarities, is used as an aggregate index to representroute 1. A higher average similarity index indicates that the route has a higher overlapping with other routes.
It can be seen from Fig. 3 that each model assigns the traffic differently from each other. The scaled models in this scenariohave the same scaling factor of 0.5236 as in the three-route scenario because the shortest route distance is still six, whereasthe non-scaled models are implicitly assumed to be one. Because in this scenario the dispersion parameter is set equal toone, the total dispersion ðlrs ¼ hl0rsÞ of the non-scaled models is one, whereas that of the scaled models is 0.5236. It canbe seen that the scaling factor is capable of adjusting the probabilities of the scaled models so that they are more uniformlydistributed among the seven routes, which is similar to the effect of changing the dispersion parameter.
The C-logit(s), PS-logit(s), and PCL(s) models can handle the overlapping problem via the commonality factor, the path-size factor, and the average similarity index, respectively. As an example, let us consider route 5 and route 7. Route 7 has ahigher cost but less overlap than route 5. The MNL(s) model ignores the dependency among the routes by using only theroute costs, so it gives a higher probability of using route 5 than route 7. The C-logit(s) model, which accounts for the over-lapping problem through the commonality factors, decreases the probability difference between route 5 and route 7. The PS-logit(s) model uses a path-size factor to adjust the probability. In this case, it gives a higher probability of using route 7 thanroute 5 even though route 7 has a higher route cost. The PCL(s) model takes into account of the overlapping problem throughthe average similarity index, and gives a similar probability for using the two routes.
4.1.3. Effect of route setsTable 1 shows the results of using different route sets. Here we compare the objective values and total travel times of
three, seven, and eleven routes for all nine models. As mentioned above, when using a route set of three independent routes,
Route Cost
Model Specific Values
Probability
C-logit6.77
6.59
6.286.34
6.28
6.59
6.77
Route
Prob
abili
ty,
Com
mon
ality
Fac
tor
0.00
0.05
0.10
0.15
0.20
0.25
0.30
0.35
6 4 2 1 3 5 76.10
6.20
6.30
6.40
6.50
6.60
6.70
6.80
Rou
te C
ost
Prob
abili
ty,
Com
mon
ality
Fac
tor
C-logits6.78
6.61
6.296.35
6.29
6.61
6.78
Route
0.00
0.05
0.10
0.15
0.20
0.25
0.30
0.35
6 4 2 1 3 5 76.10
6.20
6.30
6.40
6.50
6.60
6.70
6.80
Rou
te C
ost
Prob
abili
ty,
Path
-Siz
e / 2
PS-logit6.76
6.43
6.276.21
6.27
6.43
6.76
Route
0.00
0.05
0.10
0.15
0.20
0.25
0.30
0.35
6 4 2 1 3 5 76.10
6.20
6.30
6.40
6.50
6.60
6.70
6.80
Rou
te C
ost
Prob
abili
ty,
Path
-Siz
e / 2
PS-logits6.77
6.42
6.28
6.19
6.28
6.42
6.77
Route
0.00
0.05
0.10
0.15
0.20
0.25
0.30
0.35
6 4 2 1 3 5 76.10
6.20
6.30
6.40
6.50
6.60
6.70
6.80
Rou
te C
ost
Prob
abili
ty,
Avg
.Sim
ilari
ty
PCL6.76
6.51
6.27 6.28 6.27
6.51
6.76
Route
0.00
0.05
0.10
0.15
0.20
0.25
0.30
0.35
6 4 2 1 3 5 76.10
6.20
6.30
6.40
6.50
6.60
6.70
6.80
Rou
te C
ost
Prob
abili
ty,
Avg
.Sim
ilari
ty
PCLs6.78
6.51
6.29 6.26 6.29
6.51
6.78
Route
0.00
0.05
0.10
0.15
0.20
0.25
0.30
0.35
6 4 2 1 3 5 76.10
6.20
6.30
6.40
6.50
6.60
6.70
6.80
Rou
te C
ost
UE
6.63
6.24 6.23 6.23 6.23 6.24
6.63
0.35
0.00
0.05
0.10
0.15
0.20
0.25
0.30
6 4 2 1 3 5 7
Route
6.10
6.20
6.30
6.40
6.50
6.60
6.70
6.80
Rou
te C
ost
Prob
abili
ty
MNL6.77
6.61
6.286.36
6.28
6.61
6.77
Route
0.00
0.05
0.10
0.15
0.20
0.25
0.30
0.35
6 4 2 1 3 5 76.10
6.20
6.30
6.40
6.50
6.60
6.70
6.80
Rou
te C
ost
Prob
abili
ty
MNLs6.78
6.63
6.296.37
6.29
6.63
6.78
Route
0.00
0.05
0.10
0.15
0.20
0.25
0.30
0.35
6 4 2 1 3 5 76.10
6.20
6.30
6.40
6.50
6.60
6.70
6.80
Rou
te C
ost
Prob
abili
ty
Fig. 3. Results of seven-route scenario (9-node network).
1352 A. Chen et al. / Transportation Research Part A 46 (2012) 1343–1358
all nine models produce the same flow pattern. The congestion term Z1 in the objective function and the total travel time arethe same under the three-route scenario. When the number of routes is increased, we start to see differences between the UEmodel and the eight logit-based SUE models; the flow patterns become more dispersed (i.e., away from the minimum costroutes of the UE model). This result is indicated by the larger values of Z1 (i.e., less concentrated on the minimum cost
A. Chen et al. / Transportation Research Part A 46 (2012) 1343–1358 1353
routes), smaller values of Z2 and/or Z3 (i.e., more dispersed or smaller entropy), and higher values of total travel times. Be-tween the scaled and non-scaled models, the scaled models give results that are slightly more dispersed compared to thoseof the non-scaled models since the scaling value from Eq. (22) is 0.5236 which is smaller than the assumed value of 1.0 in thenon-scaled models.
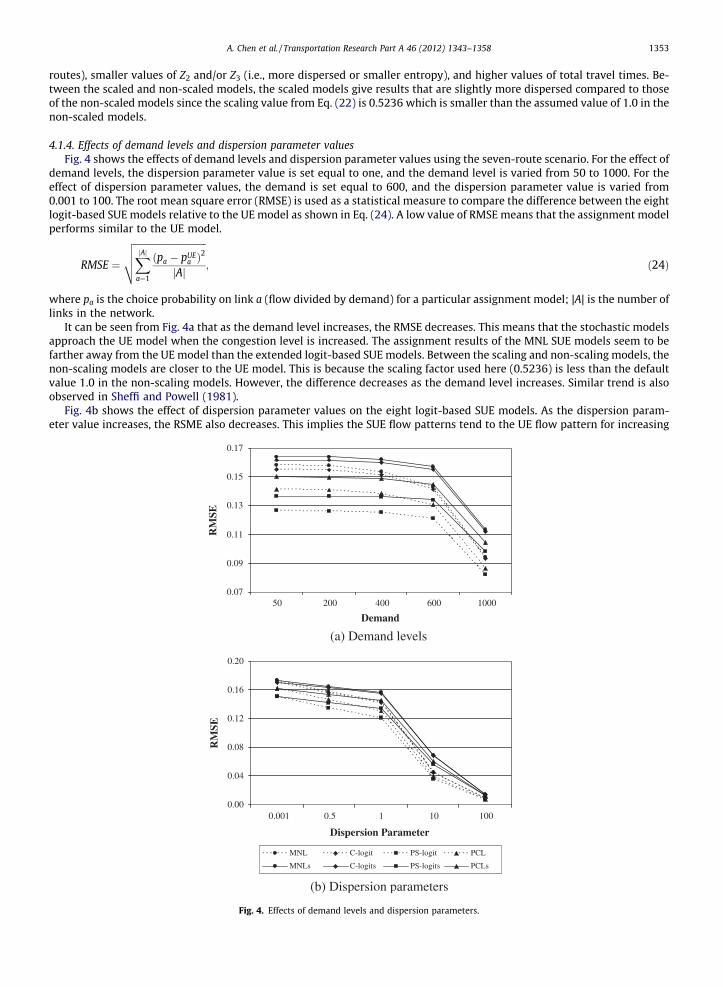
4.1.4. Effects of demand levels and dispersion parameter valuesFig. 4 shows the effects of demand levels and dispersion parameter values using the seven-route scenario. For the effect of
demand levels, the dispersion parameter value is set equal to one, and the demand level is varied from 50 to 1000. For theeffect of dispersion parameter values, the demand is set equal to 600, and the dispersion parameter value is varied from0.001 to 100. The root mean square error (RMSE) is used as a statistical measure to compare the difference between the eightlogit-based SUE models relative to the UE model as shown in Eq. (24). A low value of RMSE means that the assignment modelperforms similar to the UE model.
RMSE ¼
ffiffiffiffiffiffiffiffiffiffiffiffiffiffiffiffiffiffiffiffiffiffiffiffiffiffiffiffiffiffiffiXjAja¼1
ðpa � pUEa Þ
2
jAj
vuut ; ð24Þ
where pa is the choice probability on link a (flow divided by demand) for a particular assignment model; |A| is the number oflinks in the network.
It can be seen from Fig. 4a that as the demand level increases, the RMSE decreases. This means that the stochastic modelsapproach the UE model when the congestion level is increased. The assignment results of the MNL SUE models seem to befarther away from the UE model than the extended logit-based SUE models. Between the scaling and non-scaling models, thenon-scaling models are closer to the UE model. This is because the scaling factor used here (0.5236) is less than the defaultvalue 1.0 in the non-scaling models. However, the difference decreases as the demand level increases. Similar trend is alsoobserved in Sheffi and Powell (1981).
Fig. 4b shows the effect of dispersion parameter values on the eight logit-based SUE models. As the dispersion param-eter value increases, the RSME also decreases. This implies the SUE flow patterns tend to the UE flow pattern for increasing
0.07
0.09
0.11
0.13
0.15
0.17
50 200 400 600 1000
Demand
RM
SE
(a) Demand levels
0.00
0.04
0.08
0.12
0.16
0.20
0.001 0.5 1 10 100
Dispersion Parameter
RM
SE
MNL C-logit PS-logit PCL
MNLs C-logits PS-logits PCLs
(b) Dispersion parameters
Fig. 4. Effects of demand levels and dispersion parameters.
1354 A. Chen et al. / Transportation Research Part A 46 (2012) 1343–1358
values of the dispersion parameter. This suggests that as the perception error decreases, demand is more concentrated onthe minimum cost routes. Similar to the effect of demand levels, the assignment results of the extended logit-based SUEmodels are closer to that of the UE model for all dispersion parameter values. It is interesting to point out that at the twoextreme ends (i.e., dispersion parameter of 0.001 and 100) the non-scaled models give the same results as the scaled mod-els. That is because the total dispersion is the multiplication of dispersion parameter and the scaling factor ðlrs ¼ hl0rsÞ.Due to the exponential function, there is not much difference between using the total dispersion of 0.001 and0.0005236 or of 100 and 52.36.
4.1.5. Effect of asymmetric networkIn the above tests, a symmetrical network is used, which results in symmetrical flow patterns for all nine models. In this
test, we modify the capacity of some links in the network to induce an asymmetric network. This test is used to illustrate theability of the extended logit models to account for both route cost and overlapping in assigning the traffic. In order to do so,the capacity of links 1, 4, 5, 6, 9, and 12 is increased by 20% and links 2, 7, 8, 10, 13, and 14 decreased by 20%. The averagesimilarity index is not affected since it does not depend on link capacities. The same demand of 600 vph is used in this asym-metric network. The results from eleven routes of the PCL model without scaling are observed as follows:
� Route cost: 3 < 1 < 5 < 2 < 4 < 9 < 8 < 7 < 10 < 11 < 6.� Average similarity: 2 = 3 < 1 < 4 = 5 < 8 = 9 < 6 = 7 = 10 = 11.� Probability: 3 > 1 > 2 > 5 > 4 > 9 > 8 > 7 > 10 > 11 > 6.
Route 3 has the highest probability since it has the lowest route cost and the lowest average similarity. The second high-est probability is route 1, because it has the second lowest route cost with a slightly higher average similarity than route 2.The next route in the choice set is route 2, which has the lowest average similarity (tie with route 3) but a higher route costthan route 5, and so on. In general, we can observe that the PCL model considers both route cost and average similarity indetermining the choice probability. However, when there are ties in one of the attributes (e.g., routes 6, 7, 10, and 11 havethe same average similarity), PCL will undoubtedly use route costs to determine the probabilities as shown above for the lastfour lowest probability routes.
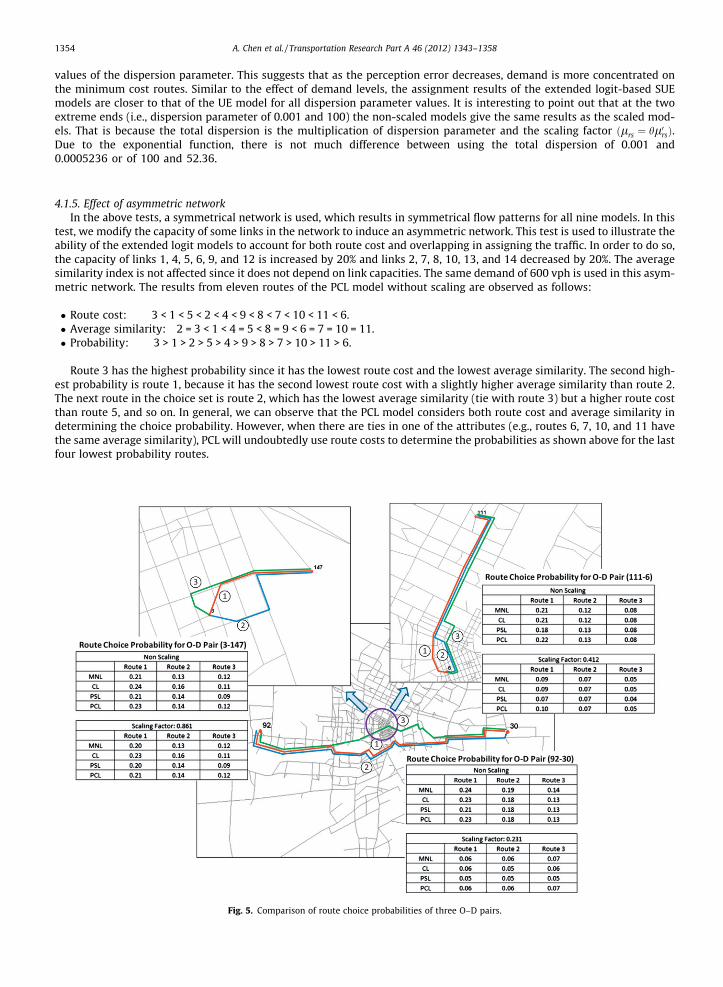
Fig. 5. Comparison of route choice probabilities of three O–D pairs.
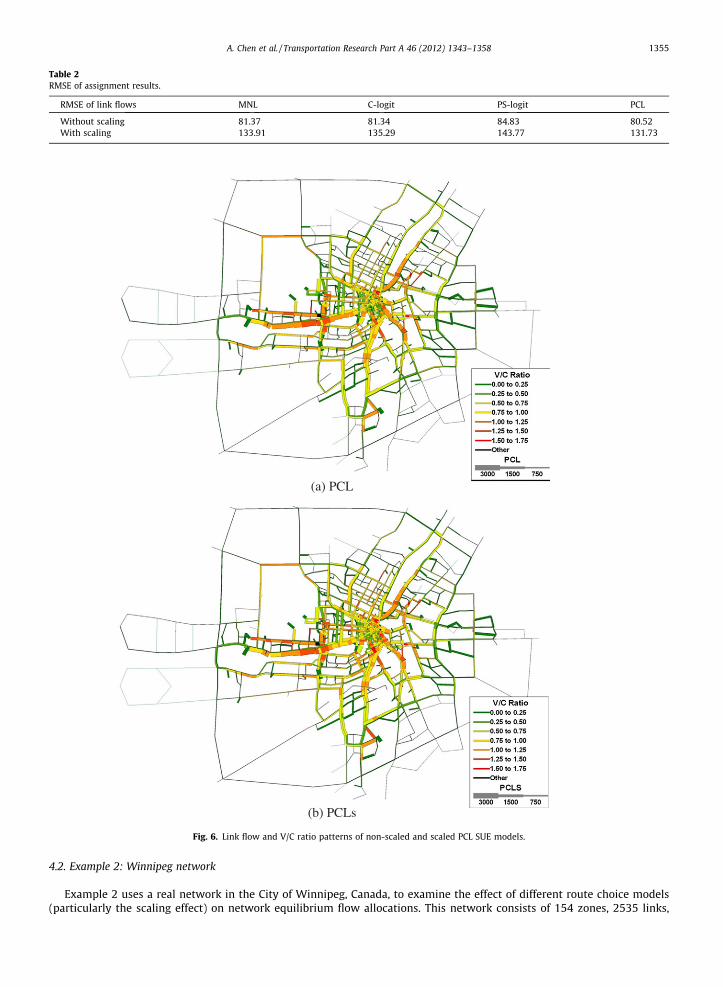
Table 2RMSE of assignment results.
RMSE of link flows MNL C-logit PS-logit PCL
Without scaling 81.37 81.34 84.83 80.52With scaling 133.91 135.29 143.77 131.73
(a) PCL
(b) PCLs
Fig. 6. Link flow and V/C ratio patterns of non-scaled and scaled PCL SUE models.
A. Chen et al. / Transportation Research Part A 46 (2012) 1343–1358 1355
4.2. Example 2: Winnipeg network
Example 2 uses a real network in the City of Winnipeg, Canada, to examine the effect of different route choice models(particularly the scaling effect) on network equilibrium flow allocations. This network consists of 154 zones, 2535 links,
0.2 0.3 0.4 0.5 0.6 0.7 0.8 0.9 10
200
400
600
800
1000
1200
1400
1600
O-D Specific Scaling Factor
Fre
quen
cy
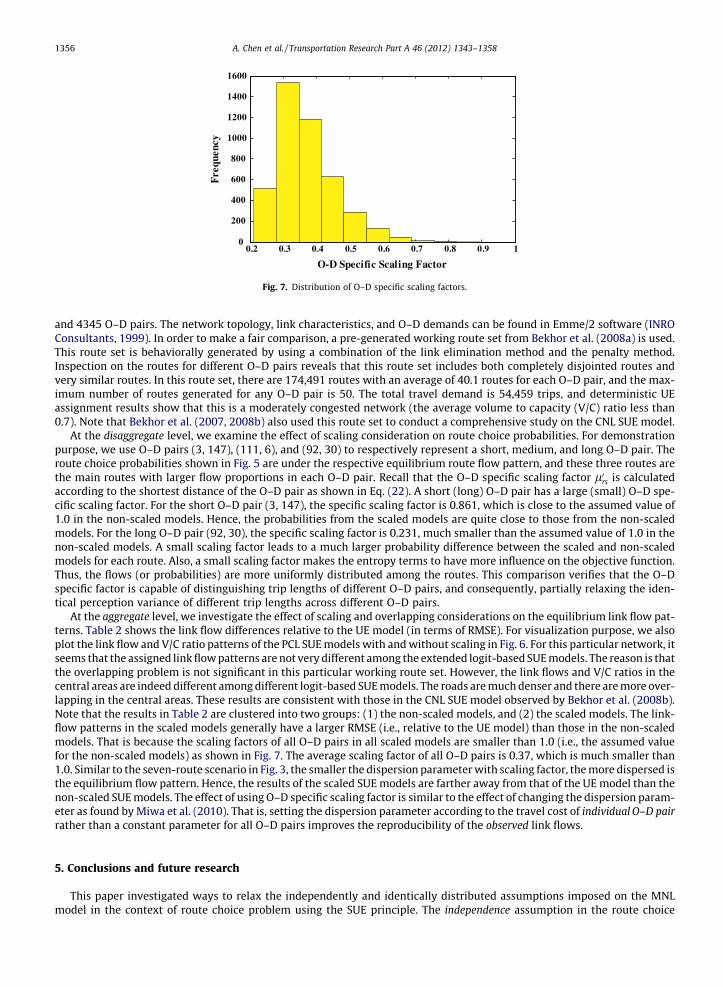
Fig. 7. Distribution of O–D specific scaling factors.
1356 A. Chen et al. / Transportation Research Part A 46 (2012) 1343–1358
and 4345 O–D pairs. The network topology, link characteristics, and O–D demands can be found in Emme/2 software (INROConsultants, 1999). In order to make a fair comparison, a pre-generated working route set from Bekhor et al. (2008a) is used.This route set is behaviorally generated by using a combination of the link elimination method and the penalty method.Inspection on the routes for different O–D pairs reveals that this route set includes both completely disjointed routes andvery similar routes. In this route set, there are 174,491 routes with an average of 40.1 routes for each O–D pair, and the max-imum number of routes generated for any O–D pair is 50. The total travel demand is 54,459 trips, and deterministic UEassignment results show that this is a moderately congested network (the average volume to capacity (V/C) ratio less than0.7). Note that Bekhor et al. (2007, 2008b) also used this route set to conduct a comprehensive study on the CNL SUE model.
At the disaggregate level, we examine the effect of scaling consideration on route choice probabilities. For demonstrationpurpose, we use O–D pairs (3, 147), (111, 6), and (92, 30) to respectively represent a short, medium, and long O–D pair. Theroute choice probabilities shown in Fig. 5 are under the respective equilibrium route flow pattern, and these three routes arethe main routes with larger flow proportions in each O–D pair. Recall that the O–D specific scaling factor l0rs is calculatedaccording to the shortest distance of the O–D pair as shown in Eq. (22). A short (long) O–D pair has a large (small) O–D spe-cific scaling factor. For the short O–D pair (3, 147), the specific scaling factor is 0.861, which is close to the assumed value of1.0 in the non-scaled models. Hence, the probabilities from the scaled models are quite close to those from the non-scaledmodels. For the long O–D pair (92, 30), the specific scaling factor is 0.231, much smaller than the assumed value of 1.0 in thenon-scaled models. A small scaling factor leads to a much larger probability difference between the scaled and non-scaledmodels for each route. Also, a small scaling factor makes the entropy terms to have more influence on the objective function.Thus, the flows (or probabilities) are more uniformly distributed among the routes. This comparison verifies that the O–Dspecific factor is capable of distinguishing trip lengths of different O–D pairs, and consequently, partially relaxing the iden-tical perception variance of different trip lengths across different O–D pairs.
At the aggregate level, we investigate the effect of scaling and overlapping considerations on the equilibrium link flow pat-terns. Table 2 shows the link flow differences relative to the UE model (in terms of RMSE). For visualization purpose, we alsoplot the link flow and V/C ratio patterns of the PCL SUE models with and without scaling in Fig. 6. For this particular network, itseems that the assigned link flow patterns are not very different among the extended logit-based SUE models. The reason is thatthe overlapping problem is not significant in this particular working route set. However, the link flows and V/C ratios in thecentral areas are indeed different among different logit-based SUE models. The roads are much denser and there are more over-lapping in the central areas. These results are consistent with those in the CNL SUE model observed by Bekhor et al. (2008b).Note that the results in Table 2 are clustered into two groups: (1) the non-scaled models, and (2) the scaled models. The link-flow patterns in the scaled models generally have a larger RMSE (i.e., relative to the UE model) than those in the non-scaledmodels. That is because the scaling factors of all O–D pairs in all scaled models are smaller than 1.0 (i.e., the assumed valuefor the non-scaled models) as shown in Fig. 7. The average scaling factor of all O–D pairs is 0.37, which is much smaller than1.0. Similar to the seven-route scenario in Fig. 3, the smaller the dispersion parameter with scaling factor, the more dispersed isthe equilibrium flow pattern. Hence, the results of the scaled SUE models are farther away from that of the UE model than thenon-scaled SUE models. The effect of using O–D specific scaling factor is similar to the effect of changing the dispersion param-eter as found by Miwa et al. (2010). That is, setting the dispersion parameter according to the travel cost of individual O–D pairrather than a constant parameter for all O–D pairs improves the reproducibility of the observed link flows.
5. Conclusions and future research
This paper investigated ways to relax the independently and identically distributed assumptions imposed on the MNLmodel in the context of route choice problem using the SUE principle. The independence assumption in the route choice
A. Chen et al. / Transportation Research Part A 46 (2012) 1343–1358 1357
context refers to the overlapping problem. It is handled using the extended logit models including the C-logit, PS-logit, andPCL models. The identically distributed assumption is related to the fixed (or constant) perception variance with respect totrips of different lengths over all routes for all O–D pairs. In the context of network assignment, this assumption seems unre-alistic since it does not distinguish trip lengths of different O–D pairs. By partially relaxing these two assumptions, we exam-ined how it affects route choice probabilities and network flow allocations.
Through the numerical results and Winnipeg network studies, we observed that the scaled extended logit models arecapable of handling the overlapping problem and partially relaxing the identical trip length variance problem for differentO–D pairs (but not individual routes within the same O–D pair). (1) The C-logit and PS-logit models alleviate the overlappingproblem by using the commonality factor and the path-size correction factor, respectively, to modify the deterministic part ofthe utility function while retaining the single-level tree structure of the MNL model. The PCL model, on the other hand, cap-tures the similarity between a pair of routes and penalizes the overlapping routes through the random error component. Themodel therefore has a hierarchical logit structure. This two-level tree structure can correct the overlapping problem byassigning less flow to a route with significant coupling with other routes. (2) By introducing the O–D specific scaling factor,the inability to account for perception variance of trips of different lengths is partially resolved across different O–D pairs.This is very useful in network equilibrium assignment when there are many O–D pairs in the network. However, it is impor-tant to note that it is not possible to scale individual routes of the same O–D pair since it would violate the SUE models’assumption of an equal variance across the routes within the same O–D pair.
More specifically, we have the following main observations from the numerical analyses:(1) When the independence assumption is satisfied (i.e., no overlapping among routes between an O–D pair for all O–D
pairs), all extended logit models perform exactly the same as the MNL model. Further, if all routes have equal costs, thescaled models give the same results as the non-scaled models.
(2) When the network is symmetric, route choice probabilities are also symmetric. As for asymmetrical networks, theanalysis showed that the extended logit models are capable of accounting for both route cost and overlapping inassigning traffic to the network.
(3) The O–D specific scaling factor can distinguish trip lengths of different O–D pairs, and consequently, partially relax theidentical perception variance across different O–D pairs. A small scaling factor leads to a much larger probability dif-ference between the scaled and non-scaled models. Hence, a smaller dispersion parameter with scaling factor wouldproduce a more dispersed equilibrium flow pattern.
(4) As the demand level and dispersion parameter increase, the SUE flow patterns tend to the UE flow pattern. The assign-ment results of the MNL SUE models seem to be farther away from the UE model than the extended logit-based SUEmodels. Compared to the scaled models, the non-scaled models are closer to the UE model. However, the differencedecreases as the demand level increases.
For future research, we will consider other random error distributions, and perform parameter calibration for the ex-tended logit models under the SUE principle. It is also worth noting that the Weibull model of Castillo et al. (2008) is a recentdevelopment in the field of route choice modeling. It was developed mainly to address the identical perception varianceassumption of the logit model by assuming that the route costs follow independent Weibull distributions. This novel modelhas not been explored in the literature. We plan to investigate ways to relax the independence assumption in the Weibull-based route choice model so that both heterogeneous perception variance and route overlapping problems can be handledsimultaneously. Further, equivalent mathematical programming formulation for the Weibull-based SUE model under con-gested networks should be developed for large-scale applications.
Acknowledgments
The authors are grateful to Professor Debbie Niemeier (editor-in-chief) and two referees for providing useful commentsand suggestions for improving the quality and clarity of the paper.
This research was partly supported by the NSF Grant CMS-0134161 in the United States and by the Oriental Scholar Pro-fessorship Program sponsored by the Shanghai Ministry of Education in China. These supports are gratefully acknowledged.
References
Bekhor, S., Prashker, J.N., 1999. Formulations of extended logit stochastic user equilibrium assignments. In: Proceedings of the 14th InternationalSymposium on Transportation and Traffic Theory, Jerusalem, Israel, pp. 351–372.
Bekhor, S., Prashker, J.N., 2001. Stochastic user equilibrium formulation for the generalized nested logit model. Transportation Research Record 1752, 84–90.Bekhor, S., Toledo, T., 2005. Investigating path-based solution algorithms to the stochastic user equilibrium problem. Transportation Research Part B 39 (3),
279–295.Bekhor, S., Ben-Akiva, M.E., Ramming, M.S., 2002. Adaptation of logit kernel to route choice situation. Transportation Research Record 1805, 78–85.Bekhor, S., Reznikova, L., Toledo, T., 2007. Application of cross-nested logit rout choice model in stochastic user equilibrium traffic assignment.
Transportation Research Record 2003, 41–49.Bekhor, S., Toledo, T., Prashker, J.N., 2008a. Effects of choice set size and route choice models on path-based traffic assignment. Transportmetrica 4 (2), 117–
133.Bekhor, S., Toledo, T., Reznikova, L., 2008b. A path-based algorithm for the cross-nested logit stochastic user equilibrium. Computer-Aided Civil and
Infrastructure Engineering 24 (1), 15–25.Bell, M.G.H., 1995. Alternatives to Dial’s logit assignment algorithm. Transportation Research Part B 29 (4), 287–295.
1358 A. Chen et al. / Transportation Research Part A 46 (2012) 1343–1358
Bell, M.G.H., Lam, W.H.K., Poss, G., Inaudi, D., 1993. Stochastic user equilibrium assignment and iterative balancing. In: Proceedings of the 12th InternationalSymposium on Transportation and Traffic Theory, pp. 427–439.
Bell, M.G.H., Shield, C.M., Busch, F., Kruse, G., 1997. A stochastic user equilibrium path flow estimator. Transportation Research Part C 5 (3–4), 197–210.Ben-Akiva, M., Bierlaire, M., 1999. Discrete choice methods and their applications to short term travel decisions. In: Hall, R.W. (Ed.), Handbook of
Transportation Science. Kluwer Publishers.Ben-Akiva, M., Bierlaire, M., 2003. Discrete Choice Models with Applications to Departure Time and Route Choice. Handbook of Transportation Science,
second ed. Kluwer Academic Publishers, Boston.Ben-Akiva, M., Lerman, S.R., 1985. Discrete Choice Analysis: Theory and Application to Travel Demand. The MIT Press, Cambridge, Massachusetts.Ben-Akiva, M., Bergman, M., Daly, A., Ramaswamy, R., 1984. Modeling inter-urban route choice behavior. In: Proceedings of the 9th International
Symposium on Transportation and Traffic Theory, pp. 299–330.Ben-Akiva, M.E., Gao, S., Wei, Z., Wen, Y., 2011. A dynamic traffic assignment model for highly congested urban networks. In: Presented at the 90th Annual
Meeting of Transportation Research Board, Washington, DC.Bertsekas, D.R., 1976. On the Goldstein–Levitin–Polyak gradient projection method. IEEE Transactions on Automatic Control 21 (2), 174–184.Bovy, P., Bekhor, S., Prato, C., 2008. The factor of the revisited path size: alternative derivation. Transportation Research Record 2076, 132–140.Cascetta, E., Nuzzolo, A., Russo, F., Vitetta, A., 1996. A modified logit route choice model overcoming path overlapping problems: specification and some
calibration results for interurban networks. In: Proceedings of the 13th International Symposium on Transportation and Traffic Theory, Leon, France, pp.697–711.
Cascetta, E., Russo, F., Vitetta, A., 1997. Stochastic user equilibrium assignment with explicit path enumeration: comparison of models and algorithms. In:Proceedings of International Federation of Automatic Control Transportation Systems, Chania, Greece, pp. 1078–1084.
Cascetta, E., Russo, F., Viola, F.A., Vitetta, A., 2002. A model of route perception in urban road networks. Transportation Research Part B 36 (7), 577–592.Castillo, E., Menendez, J.M., Jimenez, P., Rivas, A., 2008. Closed form expressions for choice probabilities in the Weibull case. Transportation Research Part B
42 (4), 373–380.Chen, M., Alfa, A.S., 1991. Algorithms for solving Fisk’s stochastic traffic assignment model. Transportation Research Part B 25 (6), 405–412.Chen, A., Kasikitwiwat, P., Ji, Z., 2003. Solving the overlapping problem in route choice with paired combinatorial logit model. Transportation Research
Record 1857, 65–73.Chen, A., Chootinan, P., Recker, W., 2005. Examining the quality of synthetic origin–destination trip table estimated by path flow estimator. Journal of
Transportation Engineering 131 (7), 506–513.Chen, A., Chootinan, P., Recker, W., 2009. Norm approximation method for handling traffic count inconsistencies in path flow estimator. Transportation
Research Part B 43 (8), 852–872.Chen, A., Ryu, S., Chootinan, P., 2010. L-infinity norm for handling traffic count inconsistencies in path flow estimator: formulation and solution algorithm.
Journal of Transportation Engineering 136 (6), 565–575.Chootinan, P., Chen, A., Recker, W., 2005. Improved path flow estimator for estimating origin–destination trip tables. Transportation Research Record 1923,
9–17.Damberg, O., Lundgren, J.T., Patriksson, M., 1996. An algorithm for the stochastic user equilibrium problem. Transportation Research Part B 30 (2), 115–131.Dial, R., 1971. A probabilistic multipath traffic assignment model which obviates path enumeration. Transportation Research 5 (2), 83–111.Fisk, C., 1980. Some developments in equilibrium traffic assignment. Transportation Research Part B 14 (3), 243–255.Frejinger, E., Bierlaire, M., 2007. Capturing correlation with subnetworks in route choice models. Transportation Research Part B 41 (3), 363–378.Gliebe, J.P., Koppleman, F.S., Ziliaskopoulos, A., 1999. Route choice using a paired combinatorial logit model. In: Presented at the 78th Annual Meeting of the
Transportation Research Board, Washington, DC.Hoogendoorn-Lanser, S., Bovy, P.H.L., 2007. Modeling overlap in multimodal route choice by including trip part-specific path size factors. Transportation
Research Record 2003, 74–83.Hoogendoorn-Lanser, S., van Nes, R., Bovy, P.H.L., 2005. Path size and overlap in multi-modal transport networks, a new interpretation. In: Proceedings of
the 16th International Symposium on Transportation and Traffic Theory, pp. 63–84.Huang, H.J., Bell, M.G.H., 1998. A study on logit assignment which excludes all cycles flows. Transportation Research Part B 32 (6), 401–412.INRO Consultants, 1999. Emme/2 User’s Manual: Release 9.2. Montréal.Koppelman, F.S., Wen, C.H., 2000. The paired combinatorial logit model: properties, estimation and application. Transportation Research Part B 34 (2), 75–
89.Leurent, F.M., 1997. Curbing the computational difficulty of the logit equilibrium assignment model. Transportation Research Part B 31 (4), 315–326.Maher, M., 1998. Algorithms for logit-based stochastic user equilibrium assignment. Transportation Research Part B 32 (8), 539–549.McFadden, D., Train, K., 2000. Mixed MNL models for discrete response. Journal of Applied Econometrics 15 (5), 447–470.McFadden, D., 1978. Modelling the choice of residential location. In: Karlquist, A. et al. (Eds.), Spatial Interaction Theory and Residential Location. North-
Holland, Amsterdam, pp. 75–96.Miwa, T., Okada, Y., Morikawa, T., 2010. Applying a structured dispersion parameter to multiclass stochastic user equilibrium assignment model.
Transportation Research Record 2196, 142–149.Patriksson, M., 1994. The Traffic Assignment Problem: Models and Methods. VSP, Utrecht, The Netherlands.Prashker, J.N., Bekhor, S., 1998. Investigation of stochastic network loading procedures. Transportation Research Record 1645, 94–102.Prashker, J.N., Bekhor, S., 2000. Congestion, stochastic and similarity effects in stochastic user equilibrium models. Transportation Research Record 1733,
80–87.Prashker, J.N., Bekhor, S., 2004. Route choice models used in the stochastic user equilibrium problem: a review. Transport Reviews 24, 437–463.Prato, C.G., 2009. Route choice modeling: past, present and future research directions. Journal of Choice Modelling 2 (1), 65–100.Pravinvongvuth, S., Chen, A., 2005. Adaptation of the paired combinatorial logit model to the route choice problem. Transportmetrica 1 (3), 223–240.Russo, F., Vitetta, A., 2003. An assignment model with modified logit, which obviates enumeration and overlapping problems. Transportation 30 (2), 177–
201.Sheffi, Y., 1985. Urban transportation networks: equilibrium analysis with mathematical programming methods. Prentice Hall, England Cliffs, New Jersey.Sheffi, Y., Powell, W., 1981. A comparison of stochastic and deterministic traffic assignment over congested networks. Transportation Research Part B 15 (1),
53–64.Vovsha, P., Bekhor, S., 1998. The link nested logit model: overcoming the route overlapping problem. Transportation Research Record 1645, 133–142.Zhou, Z., Chen, A., Bekhor, S., 2012. C-logit stochastic user equilibrium model: formulations and solution algorithm. Transportmetrica 8 (1), 17–41.