Embed Size (px)
Citation preview

Examining the role of chromatinised
PKCβ in regulating key immune
response genes in B cells
Christopher Ray Sutton
B.Med.Sc (UC)
Centre for Research in Therapeutic Solutions
(CResTS)
University of Canberra ACT 2601
A thesis submitted in partial fulfillment of the requirements
for the degree of Bachelor of Applied Science (Honours) at
the University of Canberra
December 2013
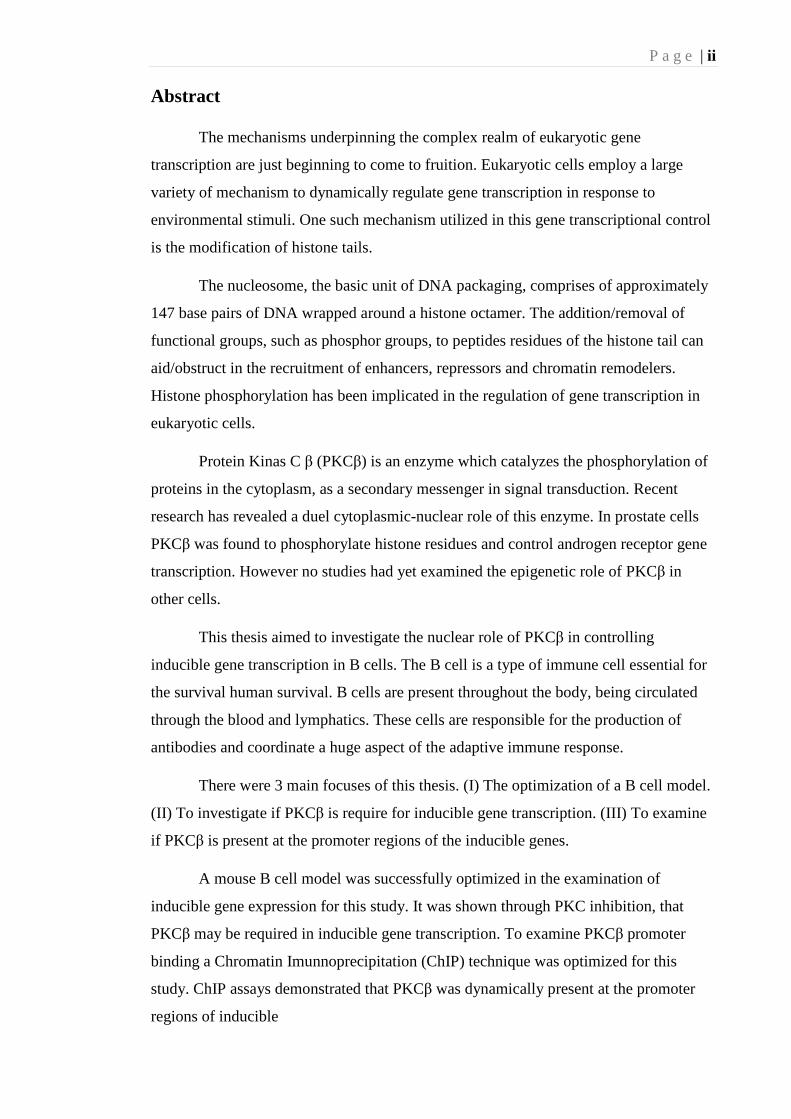
P a g e | ii Abstract
The mechanisms underpinning the complex realm of eukaryotic gene
transcription are just beginning to come to fruition. Eukaryotic cells employ a large
variety of mechanism to dynamically regulate gene transcription in response to
environmental stimuli. One such mechanism utilized in this gene transcriptional control
is the modification of histone tails.
The nucleosome, the basic unit of DNA packaging, comprises of approximately
147 base pairs of DNA wrapped around a histone octamer. The addition/removal of
functional groups, such as phosphor groups, to peptides residues of the histone tail can
aid/obstruct in the recruitment of enhancers, repressors and chromatin remodelers.
Histone phosphorylation has been implicated in the regulation of gene transcription in
eukaryotic cells.
Protein Kinas C β (PKCβ) is an enzyme which catalyzes the phosphorylation of
proteins in the cytoplasm, as a secondary messenger in signal transduction. Recent
research has revealed a duel cytoplasmic-nuclear role of this enzyme. In prostate cells
PKCβ was found to phosphorylate histone residues and control androgen receptor gene
transcription. However no studies had yet examined the epigenetic role of PKCβ in
other cells.
This thesis aimed to investigate the nuclear role of PKCβ in controlling
inducible gene transcription in B cells. The B cell is a type of immune cell essential for
the survival human survival. B cells are present throughout the body, being circulated
through the blood and lymphatics. These cells are responsible for the production of
antibodies and coordinate a huge aspect of the adaptive immune response.
There were 3 main focuses of this thesis. (I) The optimization of a B cell model.
(II) To investigate if PKCβ is require for inducible gene transcription. (III) To examine
if PKCβ is present at the promoter regions of the inducible genes.
A mouse B cell model was successfully optimized in the examination of
inducible gene expression for this study. It was shown through PKC inhibition, that
PKCβ may be required in inducible gene transcription. To examine PKCβ promoter
binding a Chromatin Imunnoprecipitation (ChIP) technique was optimized for this
study. ChIP assays demonstrated that PKCβ was dynamically present at the promoter
regions of inducible
P a g e | iii genes during B cell activation. PKCβ enrichment at these promoter regions also
coincided with an associated histone phosphorylation, histone H3 threonine 6,
enrichment at the same promoters.
In summary, this thesis has examined a possible epigenetic role of PKCβ in
regulating inducible gene expression in B cells. The findings of this thesis contribute to
the current knowledge of the nuclear roles of protein kinases in immune cells.
P a g e | v Acknowledgements
There are so many people without whom the completion of this thesis would not
have been possible. The generosity and assistants of all these people will not be
forgotten. This thesis is as much theirs as it is mine!
Firstly I would like to thank my supervisors. Dr. Sudha Rao, my primary
supervisor, whose insightful intellect saw many possibilities where I could not, and
whose tireless work, even when sick, lead to the competition of this piece of work. Dr.
Chloe Lim, my secondary supervisor, whose absolute selflessness and unwavering
dedication saw me through many thesis drafts and my lab infancy, involving many late
nights. Thank you both for your efforts and approachability throughout this project.
This thesis would not have been able to been possible without the influence of
Dr. Anjum Zafar and Dr. Kristine Hardy. Your comments and suggestions on all the
work I gave you was much appreciated.
My fellow honours students, Tara Boulding, Jennifer Dunn, Cindy Karouta and
Rebecca Madden. Your kindness, support and company made this challenging journey
an enjoyable one.
To all the staff in the biomedical laboratory at the University of Canberra. Thank
you for your continued help and support on all laboratory matters for which I gratefully
received.
Last, but certainly not least, I would like to thank my family and friends. Your
endless support, despite never knowing what I was talking about, has seen me through
this year.
P a g e | vi Table of contents
CHAPTER 1: INTRODUCTION. ................................................................................. 1
1.1. THE IMMUNE SYSTEM .................................................................................................... 2
1.2. EPIGENETIC REGULATION OF INDUCIBLE GENE EXPRESSION. ......................................... 7
1.3. THE ROLE OF HISTONE PHOSPHORYLATION AND CHROMATIN IN GENE
TRANSCRIPTION. ....................................................................................................................... 7
1.4. SIGNAL TRANSDUCTION ............................................................................................... 10
1.5. PROTEIN KINASES ....................................................................................................... 10
1.6. PROTEIN KINASE C ..................................................................................................... 13
1.7. PROTEIN KINASE C BETA ............................................................................................. 15
1.8. PKCΒ AS A HISTONE MODIFIER AND EPIGENETIC ENZYME. ........................................... 16
1.9. AIMS OF THIS THESIS................................................................................................... 18
CHAPTER 2: MATERIALS AND METHODS ........................................................ 19
2.1. MATERIALS ............................................................................................................... 20
2.1.1. Cell culture ........................................................................................................... 20
2.1.2. Antibodies ............................................................................................................. 20
2.1.3. ChIP Buffers ......................................................................................................... 20
2.1.4. Miscellaneous ....................................................................................................... 21
2.1.5. Primer sequences ................................................................................................. 21
2.2 METHODS ........................................................................................................................ 21
2.2.1. Cell culture ....................................................................................................... 21
2.2.2 RNA extraction ..................................................................................................... 21
2.2.3.DNAse treatment and cDNA synthesis. ................................................................... 24
2.2.4. Chromatin Imunnoprecipitation (ChIP) ................................................................ 24
2.2.5. Quantitative real-time PCR. ................................................................................ 26
CHAPTER 3: RESULTS .............................................................................................. 27
3.1. OPTIMIZATION OF THE MOUSE A20 B CELL LINE TO STUDY INDUCIBLE GENE
EXPRESSION........................................................................................................................... 28
3.1.1. Gene expression levels during B cell activation is stimulus dependent. .............. 28
3.1.2. PMA/I concentration affects IL2 and CD69 expression but not CD25 and
CD86 expression. ............................................................................................................. 29
3.1.3. A20 B cell stimulation time course optimization. .................................................. 36
3.1.4. Verification of inducible gene expression profiles in A20 B cells. ........................ 39
P a g e | vii
3.2. THE EFFECTS OF PKC INHIBITION ON B CELL INDUCIBLE GENE EXPRESSION. ................. 42
3.3. PKCΒ AND H3T6P ARE PRESENT AT THE PROMOTER REGIONS OF INDUCIBLE
IMMUNE GENES IN B CELLS. .................................................................................................. 46
3.3.1. Optimization of ChIP antibodies. ........................................................................... 46
3.5.2. PKCβI and H3T6p are both enriched at gene promoter regions. .......................... 54
CHAPTER 4: DISCUSSION ....................................................................................... 62
4.1. OVERVIEW ..................................................................................................................... 63
4.2. ESTABLISHMENT OF AN INDUCIBLE B CELL MODEL TO STUDY TRANSCRIPTION
REGULATION OF INDUCIBLE IMMUNE GENES. ......................................................................... 63
4.2.1. Gene expression during B cell activation is stimulus dependent. .......................... 64
4.2.2. The inducible genes display distinct transcription kinetic patterns. ...................... 65
4.4. PKC IS REQUIRED FOR INDUCIBLE GENE EXPRESSION IN B CELLS ................................... 67
4.5. PKCΒ ENRICHMENT ON PROXIMAL PROMOTER REGIONS ................................................ 69
4.6. CONCLUSIONS ................................................................................................................ 70
REFERENCES .............................................................................................................. 71

P a g e | viii List of tables
2.1. Exon promoter primer sequences………………………………………………22
2.2. Proximal promoter primer sequences………………………………………….23
3.2. Gene expression levels of target genes after stimulation with various B cell
stimuli………………………………………………………………………………….30
P a g e | ix List of Figures
1.1. Overview of the immune cells found in the blood and lymphatics…………….4
1.2. Overview of PKCβ as a cytoplasmic signal transductor in B cell activation….6
1.3. The dynamic state of chromatin…………………………………………………8
1.4. General schematic overview of signal transduction pathways………….……11
1.5. Classical PKC activation overview……………………………………………..12
1.6. PKC subfamily classification…………………………………………………....16
2.1. Overview of Chromatin Imunnoprecipitation (ChIP)………………………...25
3.1. Inducible gene expression levels during B cell activation is stimulus
dependent……………………………………………………………………………..31
3.2. PMA/I concentration influence gene expression levels………………………..34
3.3. Different genes have different inducible expression kinetics in B cells………37
3.4. Time course of inducible gene expression in B cells………………………...…40
3.5. Inducible gene expression is inhibited by BIS treatment……………………...44
3.6. Comparison of H3K9ac antibodies in their ability to bind DNA in ChIP…...47
3.7. H3K9ac enrichment at inducible gene promoter regions……………………..50
3.8. ChIP of PKCβ and H3T6p on the CD25 proximal promoter…………………52
3.9. ChIP using two PKCβI concentrations………………………………………….55
3.10. PKCβI is enriched on inducible gene promoters……………………………..57
3.11. H3T6p is enriched on inducible gene promoters……………………………..59

P a g e | 1
Chapter 1: Introduction.
P a g e | 2
The immune system maintains homeostasis by separating a multicellular organism
from its external environment and helping to regulate the cells which make up the
organism (Vallabhapurapu et al. 2009). To do this, vast amounts of immune cells are
employed throughout the organism, which themselves will only express genes required
for immune function upon receiving signals from the environment. Protein kinase C
beta (PKCβ) is a signaling molecule present in the cytoplasm of most cells in the human
body, and is a key factor in regulating cell function (Nelson et al. 2008; Spitaler et al.
2004). However new research has implicated PKCβ playing a role in the nucleus of
cells as well (Metzger et al. 2010). Histone phosphorylation by PKCβ was associated
with activation of gene expression, implicating PKCβ as an epigenetic enzyme (Metzger
et al. 2010).
1.1. The immune system
An active and properly functioning immune system is crucial for the survival of
all multicellular eukaryotic organisms. The role of the immune system is to effectively
separate the organism from the outside environment to help maintain an internal
homeostasis, as well as the annihilation of any disease causing organisms (pathogens)
which manage to invade the host organism (Goering et al. 2008; Kindt et al. 2007). In
humans, the immune system is a multi-complemented system employing the
coordinated activity of specialized cells throughout the body. In order to efficiently
defend the body from the outside environment and rapidly evolving pathogens vast
amounts of specialized cells are utilized. Depending on the functions, each of these cells
can be classified as an aspect of the “innate” arm of the immune system or the
“adaptive” arm of the immune system (Kindt et al. 2007).
The innate arm of the immune system is the body’s response to potential
homeostatic threats through non-antigen specific processes. The innate arm forms the
first line of defense for the body and its processes are not pathogen specific. It separates
the internal environment from the external environment primarily through the use of
both physical and chemical barriers, such as through the use of the epidermis and
bactericidal substances e.g. lysozyme (Goering et al. 2008; Kindt et al. 2007). If a
pathogen manages to evade these physical and chemical barriers then the phagocytic
P a g e | 3 cells located in the blood and lymphatic’s, such as neutrophils and macrophages (Figure
1.1), or site specific phagocytes, such as glial cells in the central nervous system, are
deployed in an attempt to destroy the pathogen from the body by phagocytosis (Sriram
2011).
The second line of the body’s immune defense is the activation of the adaptive
arm of the immune system. Unlike the innate immune system which can only recognize
a pathogen in a generally, the receptors employed by the adaptive immune system are
more antigens-specific. Another difference between the adaptive and innate arms of the
immune system is the use of immunological memory in the adaptive arm, rendering a
quicker and more robust response on secondary exposure to an antigen (Goering et al.
2008; Kindt et al. 2007).
While the innate arm is composed of a wide variety of cells, some of which
function in other systems of the body, the adaptive arm of the immune system employs
fewer types of cells in its immune activity. The two main cell types of the adaptive
immune arm are T cells (T lymphocytes) and B cells (B lymphocytes), each with their
own subclasses of cells (Figure 1.1). Both these cell types demonstrate interplay with
each other, with the activation of one helping lead to the activation of the other (Kindt et
al. 2007; Willey et al. 2011).
T cells are leukocytes defined by the presence of a T cell receptor located on the
surface of the cells. The subclasses of T cells are defined by the glycoprotein co-
receptor they display, the major classes being CD4+ T cells (T helper cells, Th cells)
and CD8+ T cells (cytotoxic T cells, Tc cells) (Kindt et al. 2007). Th cells recognize
major histocompatibility complexes class II (MHC class II) displayed by antigen
presenting cells of the innate immune system, which functions to activate the adaptive
immune system in this way. Once activated by its T cell receptor, Th cells differentiate
into into Th effector and memory cells, activating Tc cells, B cells and further innate
immune cells. Tc cells recognize MHC class I and once activated will conjugate on a
pathogen or viral effected cell and initiate apoptosis (Kindt et al. 2007).
P a g e | 4
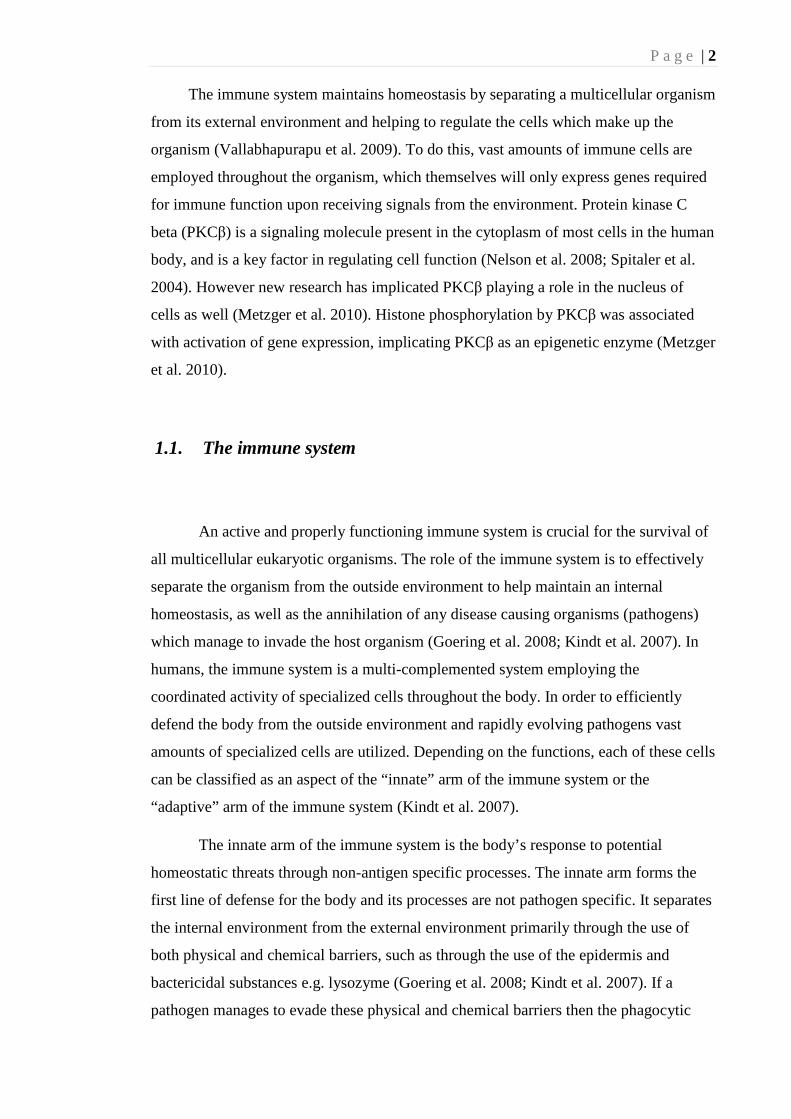
Figure 1.1. Overview of the immune cells found in the blood and lymphatics.
A variety types of immune cells found in the blood and lymphatics (leukocytes) with emphasis on adaptive immune cells (highlighted. Adapted from: http://sph.bu.edu/otlt/MPH-Modules/EH/EH_Immunity_B/EH_Immunity_B4.html).

P a g e | 5
B cells form the other major aspect of the adaptive immune system arm. When
activated by substrate binding on the B cell receptor either by Th dependent or Th
independent mechanisms, signal transduction pathways are activated to lead to the
expression of key cytokine genes important for eliminating foreign pathogens. B cells
differentiated to form B plasma and B memory cells. Plasma B cells secrete antibodies
(immunoglobulins) which can destroy a pathogen either by binding to the pathogen,
directly inhibiting the pathogen from binding to anything else, or by activation of the
complement system leading to the pathogens death by opsonization, chemotaxis or cell
lysis (Kindt et al. 2007).
B cell activation is initiated by binding of a substrate to its corresponding
receptor on the B cell membrane. Different substrates can be recognized by different
types of receptors, not all of which are unique to B cells. For example, B cells are
uniquely activated by binding of a ligand to its B cell receptor (BCR; composed of
immunoglobulin and Igα/β), but can also be activated by binding of a
lipopolysaccharide to Toll-like receptor 4 (TLR4) (Okkenhaug et al. 2003). While the
BCR is only expressed by B cells, TLR4 is expressed by almost all immune cells.
The activation of B cells is dependent upon the activity of PKCβ (Néron et al.
2006). PKCβ is a cytoplasmic signaling kinase utilized in B cell activation
(Mecklenbräuker et al. 2004). Once a B cell receptor is bound by antigen, the resulting
aggregation leads to the activation of Syk, Lyn and Btk kinases. Btk then
phosphorylates Phospholipase C-γ (PLC-γ) which generates the diacylglycerol and
calcium needed for PKCβ activation. PKCβ then recruits caspase recruitment domain-
containing protein 11 (CARMA), B-cell lymphoma 10 (BCL-10) and Mucosa-
associated lymphoid tissue lymphoma translocation protein 1(MALT1) proteins which
activates Inhibitor of κB (IκB) kinase leading to the degradation of the IκB and the
activation of nuclear factor-κB (NF-κB) (Figure 1.2). NF-κB then translocate to the
nucleus where it then activates the transcription of genes needed for B cell function
(Guo et al. 2004; Kawakami et al. 2002; Kindt et al. 2007; Néron et al. 2006; Patke et
al. 2006). Thus genes induced by B cell activation are also epigenetically regulated
(Barneda-Zahonero et al. 2012).

P a g e | 6
Figure 1.2. Overview of PKCβ as a cytoplasmic signal transductor in B cell activation.
The B cell receptor binding leads to the activation of Syk, Lyn and Btk kinases. Btk then phosphorylates PLC γ which in turn activates PKCβ, leading to the recruitmend of CARMA, BCL-10 and MALT1 proteins (not shown) activating kB kinase leading to the degradation of the IκB and the activation of NF-kB and B cell activation associated gene transcription (Adapted fromKawakami et al. 2002).
P a g e | 7
1.2. Epigenetic regulation of inducible gene expression.
Epigenetics could be loosely defined as the nuclear regulation of gene
expression that is not directly associated with changes in DNA sequence (Bird 2007). In
another perspective, epigenetic could be seen as the intermediate step between signal
transduction and gene transcription. Both eukaryotic and prokaryotic organisms utilize
complex epigenetics mechanism and apparatuses to tightly control gene expression.
Inducible genes are genes which are normally silenced but expression is induced
in response to environmental signals. B cells display a vast variety of inducible immune
associated genes which are expressed after exposure to an antigen/during activation.
E.g. after B cell exposure to the antigen lipopolysaccharide, Interleukin 4, a gene
associated with B cell proliferation, is induced to rise from very low basal expression to
higher expression within 48 hours (Jin et al. 2006).
The expression of inducible genes transcription is tightly controlled as
constitutive expression or complete silencing of these genes may be deleterious to the
organism. To achieve this controlled gene transcription, epigenetic mechanisms and
enzymes are used to act either upon the DNA itself, or the histones, to change the
chromatin structure and composition (Figure 1.3).
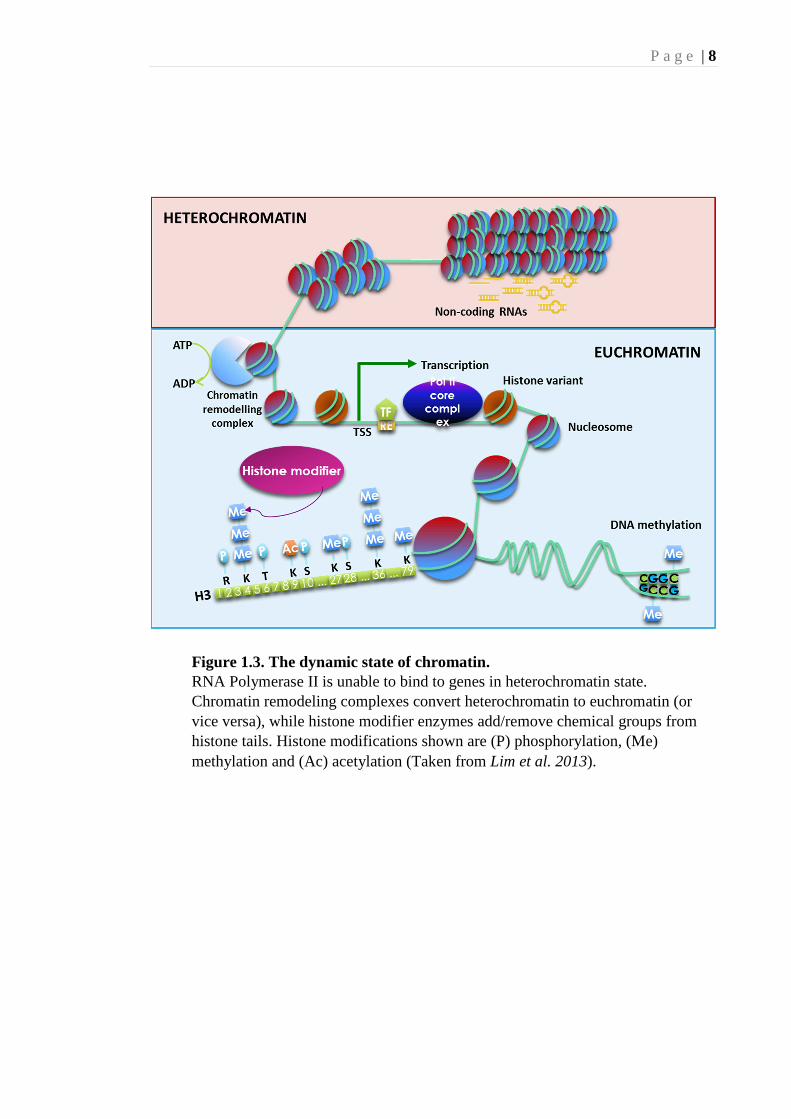
1.3. The role of histone phosphorylation and chromatin in gene
transcription.
The dynamic state of chromatin will determine whether transcription of
surrounding genes can occur. Transcription factors are unable to bind to the DNA
regions held within the tightly compact chromatin (heterochromatin), resulting in the
inability to recruit and bind RNA polymerase II, thus silencing the genes held within
heterochromatin. In contrast, loosely held chromatin (euchromatin) is able to bind
transcription factors and RNA polymerase II (Figure 1.3.) (Inche et al. 2006;
Kouzarides 2007; Lodish et al. 2013; Sawicka et al. 2012). Although, in general for a
gene to be transcribed it must be in the euchromatin state, not all genes in this state are
expressed (Croken et al. 2012).
P a g e | 8
Figure 1.3. The dynamic state of chromatin. RNA Polymerase II is unable to bind to genes in heterochromatin state. Chromatin remodeling complexes convert heterochromatin to euchromatin (or vice versa), while histone modifier enzymes add/remove chemical groups from histone tails. Histone modifications shown are (P) phosphorylation, (Me) methylation and (Ac) acetylation (Taken from Lim et al. 2013).
P a g e | 9
The basic unit of DNA packaging within chromatin is the nucleosome. The
nucleosome is composed of approximately 147 base pairs of DNA wrapped around an
octamer of histone proteins, 2 copies of each, H2A, H2B, H3 and H4 (Luger et al.
1997). Each histone has an N-terminal tail constituting about 30% of the entire histone
mass. These histone tails are the site of many histone posttranslational modifications
(Zheng et al. 2003).
Histone posttranslational modifications (also known as “histone modifications”)
is a part of the epigenetic regulatory mechanism, a process that may result in a change
in the associated chromatin state, or to recruit/abrogate the binding of transcription
factors; thereby regulating gene transcription (Banerjee et al. 2011; Fuchs et al. 2011;
Sawicka et al. 2012; Scharf et al. 2011). Histones are able to undergo a vast amount of
modifications at over 60 sites which have been currently identified (Kouzarides 2007)
(Figure 1.3.). These modifications include ubiquitination, methylation, acetylation and
phosphorylation which involves recruitment of histone modifying enzymes.
Histone phosphorylation is a histone modification which has been implicated as
a key epigenetic process. (Li et al. 2007). The phosphorylation of histones residues has
been implicated in the regulation of gene transcription events (Baek 2011).
Phosphorylation of histone residues appears to be a step in initiating the recruitment of
other epigenetic enzymes, or to repress the recruitment of epigenetic enzymes, leading
to gene transcription or gene silencing (Banerjee et al. 2011; Metzger et al. 2010;
Metzger et al. 2008; Pérez-Cadahia et al. 2009). Histone phosphorylation involves the
addition of a phosphate group to an amino acid residue which forms part of a histone
(Sawicka et al. 2012). Currently phosphorylation of serine, threonine, tyrosine and
histidine residues on histones which make up the core histone octamer of the
nucleosome (histones H2A, H2B, H3 and H4), while the role of phosphorylation on
histone H1 remains currently unreported (Banerjee et al. 2011; Li et al. 2007). 24
kinases are identified as being histone kinases, including 3 Protein Kinase C’s (α, β and
d), which phosphorylated residues on histone H3 (Baek 2011). Undoubtedly, more
kinases implicated in histone phosphorylation will continue to be uncovered.
P a g e | 10 1.4. Signal transduction
Epigenetic changes occur in response to environmental signals conveyed to the
nucleus by signal transduction pathways. The capability of a cell to survive in any
environment is dependent upon the cells’ ability to adapt to the environmental stresses
encountered. The constant, dynamic interplay between extracellular signal and cellular
response to manage such an environmental stress is a highly complicated, multi factorial
system of processes in which signal transduction plays an integrated role (Cooper et al.
2009; Nelson et al. 2008). Signal transduction is the process by which a cytoplasmic
and/or nuclear response is generated when an extracellular signal molecule, known as a
“ligand”, binds to a cell receptor. The resulting response is indirectly responsible for
alterations in gene expression (Cooper et al. 2009; Hug et al. 1993; Nelson et al. 2008).
Thus signal transduction is the intermediate process between an extracellular signal and
a cellular response.
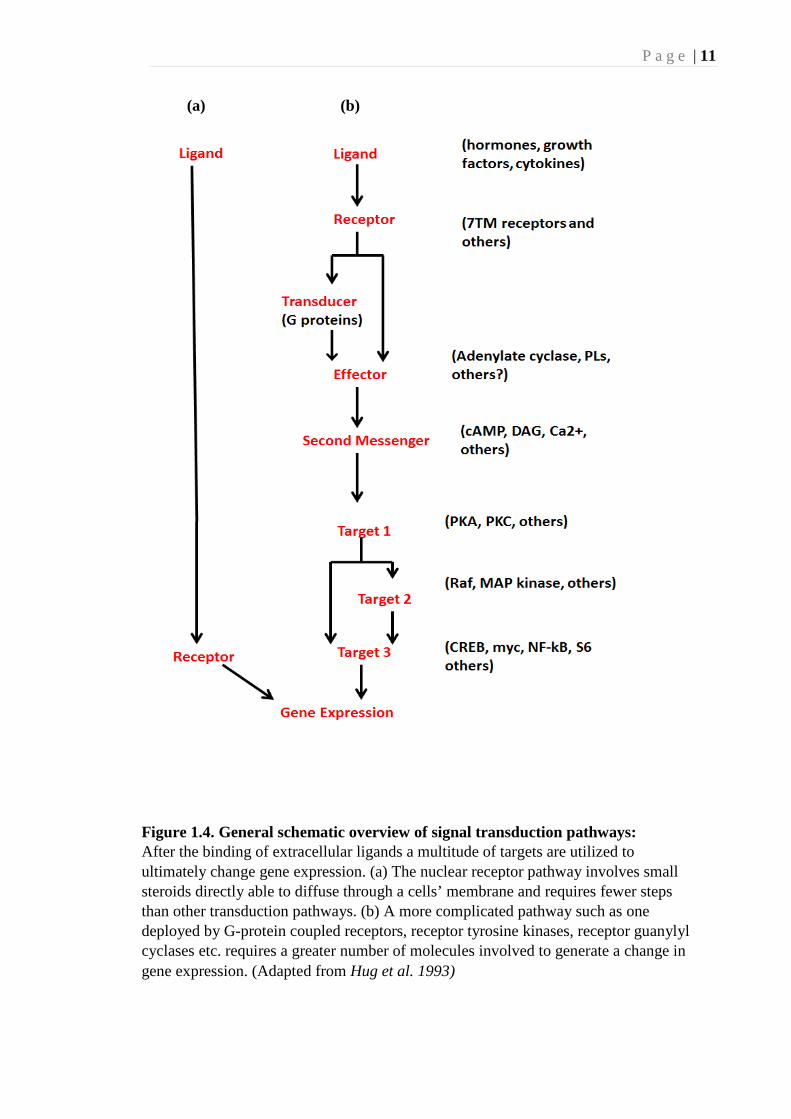
Signal transduction pathways are unique to each type of extracellular signal as in
turn each cellular response is unique to that signal. Generally, the currently defined
different types of signal transduction can be loosely categorized in accordance to the
type of receptor the extracellular ligand binds to (Nelson et al. 2008). Although the final
product of gene alteration will differ in the categories, many of the signal transduction
process remain conserved, allowing this categorization (Figure 1.4). (Hug et al. 1993).
1.5. Protein kinases
Protein kinases (PKs) form an integral part of the signal transduction networks,
with nearly all eukaryotic signal transduction pathways incorporating the function of a
kinase at some point (Lodish et al. 2013; Spitaler et al. 2004). By definition protein
kinases are enzymes which phosphorylate other proteins. In a biological sense it is this
phosphorylation of a protein which causes a cascade of more intracellular reactions. The
vast majority of signal transduction pathways will use protein kinases at some point
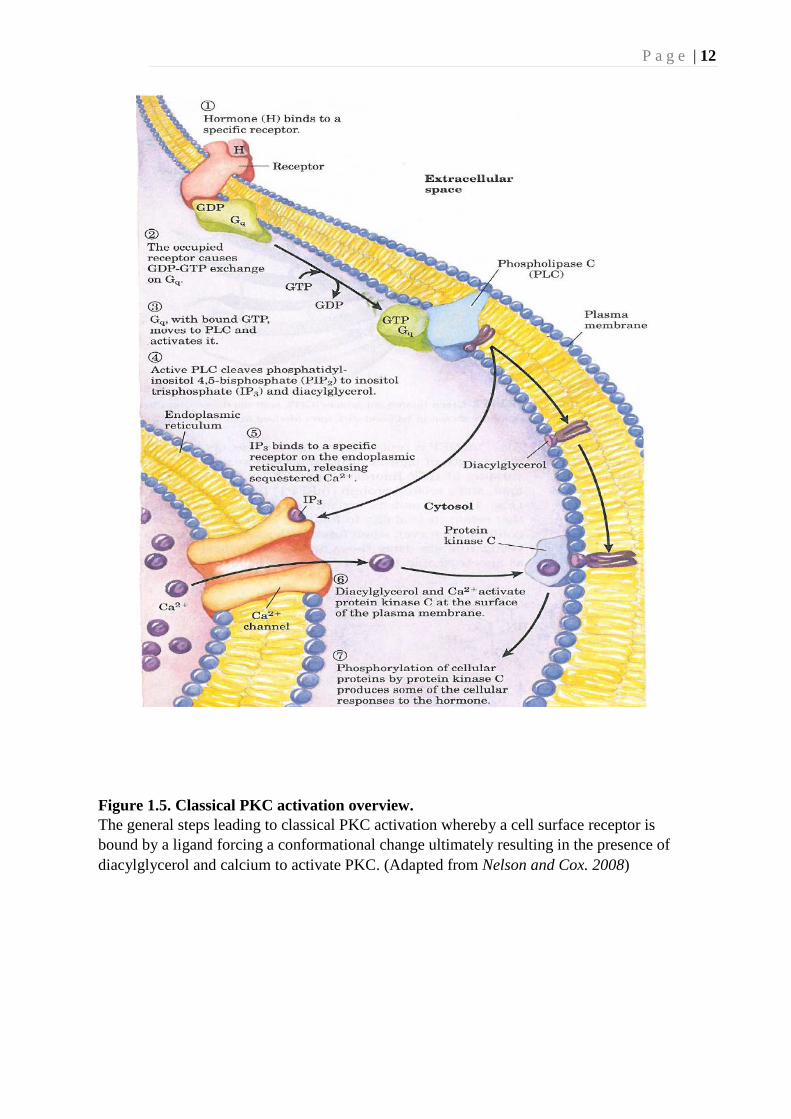
(Cooper et al. 2009; Lodish et al. 2013). Protein kinases are often cytosolic target
molecules which are active in the transduction between cell surface receptor and a target
capable of altering gene expression (Figure 1.5.).
P a g e | 11
Figure 1.4. General schematic overview of signal transduction pathways: After the binding of extracellular ligands a multitude of targets are utilized to ultimately change gene expression. (a) The nuclear receptor pathway involves small steroids directly able to diffuse through a cells’ membrane and requires fewer steps than other transduction pathways. (b) A more complicated pathway such as one deployed by G-protein coupled receptors, receptor tyrosine kinases, receptor guanylyl cyclases etc. requires a greater number of molecules involved to generate a change in gene expression. (Adapted from Hug et al. 1993)
(a) (b)
P a g e | 12
Figure 1.5. Classical PKC activation overview. The general steps leading to classical PKC activation whereby a cell surface receptor is bound by a ligand forcing a conformational change ultimately resulting in the presence of diacylglycerol and calcium to activate PKC. (Adapted from Nelson and Cox. 2008)

P a g e | 13
The vast functions of PKs in molecular signaling are evident from the large
amount of PKs present in mammalian cells. Between 518 to 575 PK genes have been
identified in the human genome, potentially comprising 1.7% of all human genes
(Lander et al. 2001). Of these 518 to 575 PK genes 71 PK are considered undocumented
and yet to be studied (Lander et al. 2001; Manning et al. 2002).
A major family of the PK conglomerate is the protein kinase A, protein kinase G
and protein kinase C serine-threonine kinases (AGC kinases). The study by Manning et
al has presented that there are 63 AGC kinases present in the human genome, making it
the fourth largest PK family (Manning et al. 2002; Peterson et al. 1999).
1.6. Protein kinase C
Protein kinase C (PKC) is a subfamily of AGC kinases comprising of at least 10
isoforms, which are classified according to their dependence on calcium and
diacylglycerol as an enzymatic activity regulator. Classical/conventional PKC isoforms
(α, βI, βII and γ) are activated by calcium, diacylglycerol and phorbol esters (Figure
1.6); novel PKC isoforms (δ, ε, η and θ) are activated by diacylglycerol and phorbol
ester but not calcium; and atypical PKC isoforms (ζ and λ/ι) which are not activated by
calcium, diacylglycerol nor phorbol esters (Figure 1.6. ) (Geraldes et al. 2010; Peterson
et al. 1999; Spitaler et al. 2004). For the purpose of this thesis, the focus will be on
PKCβ.

P a g e | 14
Figure 1.6. PKC subfamily classification. PKC subfamilies are classified based on their structure into classical (c), novel (n) or atypical (a) PKC isoforms (Adapted from Spitaler & Cantell. 2004)
P a g e | 15 1.7. Protein kinase C beta
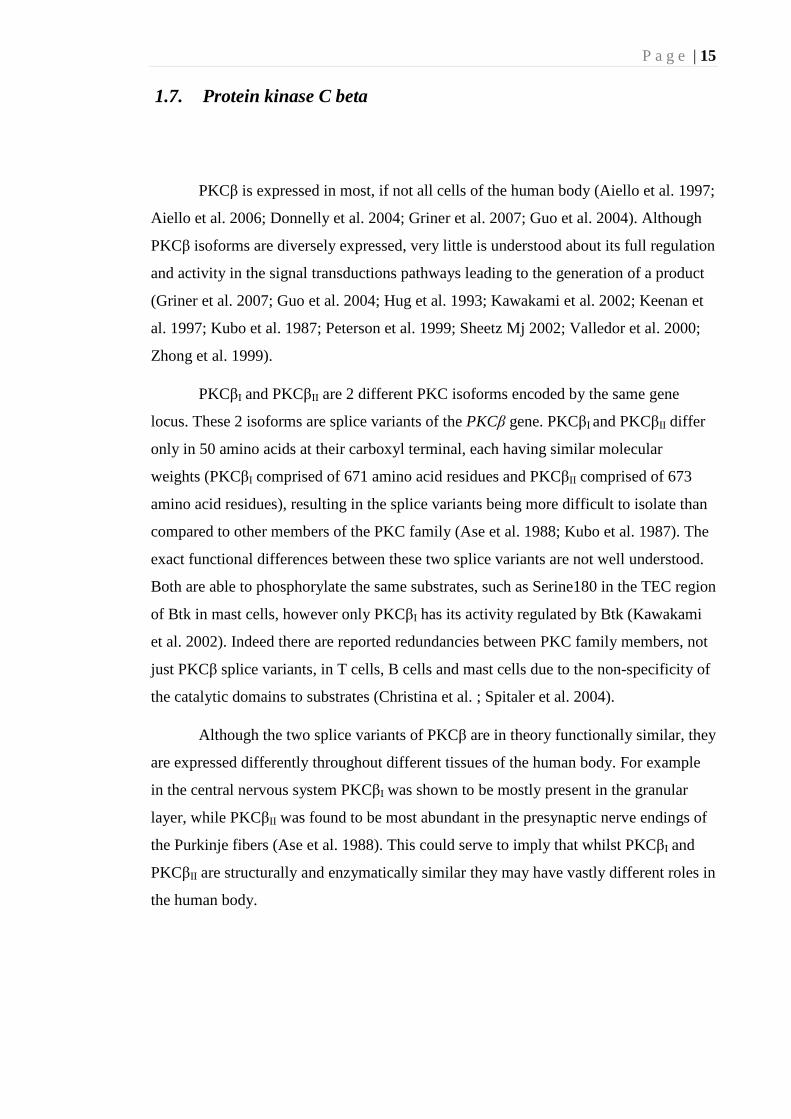
PKCβ is expressed in most, if not all cells of the human body (Aiello et al. 1997;
Aiello et al. 2006; Donnelly et al. 2004; Griner et al. 2007; Guo et al. 2004). Although
PKCβ isoforms are diversely expressed, very little is understood about its full regulation
and activity in the signal transductions pathways leading to the generation of a product
(Griner et al. 2007; Guo et al. 2004; Hug et al. 1993; Kawakami et al. 2002; Keenan et
al. 1997; Kubo et al. 1987; Peterson et al. 1999; Sheetz Mj 2002; Valledor et al. 2000;
Zhong et al. 1999).
PKCβI and PKCβII are 2 different PKC isoforms encoded by the same gene
locus. These 2 isoforms are splice variants of the PKCβ gene. PKCβI and PKCβII differ
only in 50 amino acids at their carboxyl terminal, each having similar molecular
weights (PKCβI comprised of 671 amino acid residues and PKCβII comprised of 673
amino acid residues), resulting in the splice variants being more difficult to isolate than
compared to other members of the PKC family (Ase et al. 1988; Kubo et al. 1987). The
exact functional differences between these two splice variants are not well understood.
Both are able to phosphorylate the same substrates, such as Serine180 in the TEC region
of Btk in mast cells, however only PKCβI has its activity regulated by Btk (Kawakami
et al. 2002). Indeed there are reported redundancies between PKC family members, not
just PKCβ splice variants, in T cells, B cells and mast cells due to the non-specificity of
the catalytic domains to substrates (Christina et al. ; Spitaler et al. 2004).
Although the two splice variants of PKCβ are in theory functionally similar, they
are expressed differently throughout different tissues of the human body. For example
in the central nervous system PKCβI was shown to be mostly present in the granular
layer, while PKCβII was found to be most abundant in the presynaptic nerve endings of
the Purkinje fibers (Ase et al. 1988). This could serve to imply that whilst PKCβI and
PKCβII are structurally and enzymatically similar they may have vastly different roles in
the human body.

P a g e | 16 1.8. PKCβ as a histone modifier and epigenetic enzyme.
The role of PKC isoforms in cellular process is not exclusively as a cytoplasmic
intermediate in signal transduction pathways. DeVires et al first postulated that PKCδ
was trans-located to the nucleus in events surrounding apoptosis (DeVries et al. 2002).
Other studies have strengthened to confirm PKCδ nuclear presence and activity as an
epigenetic enzyme (Mecklenbräuker et al. 2004; Patke et al. 2006). More recent studies
have also postulated that PKCβI is an epigenetic enzyme (Baek 2011; Metzger et al.
2010).
Metzger et al postulated that PKCβI activity on histone H3 threonine 6 (H3T6)
regulates androgen receptor-activated gene expression (Metzger et al. 2010). The
expression of androgen receptor related genes such as KLK2, FKBP5, and TMPRSS2
were observed to be activate in the presence of PKCβI. To explain this Metzger et al
have concluded that active PKCβI abrogates the activity of lysine specific demethylase
1(LSD1) which is needed in androgen receptor related gene repression. PKCβI is
recruited to H3T6 by Protein Related Kinase 1 (PRK1) where PKCβI phosphorylates
H3T6 preventing the demethylation of histone H3 lysine residue 4 (H3K4) by LSD1.
Thus this study has demonstrated for the first time that PKCβI is an active epigenetic
enzyme.
The study further demonstrated that increased expression of PKCβI correlated
with higher Gleason scores of prostate carcinomas and that in vitro PKCβI inhibitor
repressed androgen receptor induced cell proliferation (Metzger et al. 2010). This could
open the possibility of PKCβI as a future therapeutic target. Clinically, several kinases
involved in histone phosphorylation have been identified as therapeutic targets
(Copeland et al. 2010). E.g. inhibitors of Aurora kinases, histone 3 serine 10 kinase
linked to cell cycle progression and cancers, have entered phase II clinical trials as
possible anti-cancer drugs (Zhao et al. 2008).
The role of protein kinases in the cells which comprise the immune system is an
area undergoing research (Christina et al. ; Dawson et al. 2009; Guo et al. 2004;
Montecino-Rodriguez et al. 2012), and the role of PKCβI as an epigenetic enzyme in
immune cells is completely undefined. However, it was discovered that another member
of the PKC family, PKCϴ is an epigenetic enzyme in immune cells (SutcliffeBunting et
al. 2011). PKCϴ is implicated in the regulation of T cell immune activation genes by

P a g e | 17 physically associating with promoter regions (SutcliffeBunting et al. 2011). In addition,
PKCβI was shown to translocate to the nucleus of B cells upon B cell activation
(Mecklenbräuker et al. 2004), possibly implying that PKCβI may have a nuclear
function in B cells. Preliminary results have also shown PKCβ knockout mice have an
effect on inducible gene expression in B cells (Lim et al. unpublished data). This
suggests that PKCβ may have an epigenetic function in B cells as it does in prostate
cells (Metzger et al. 2010). While the role of PKCβI as an epigenetic enzyme has been
uncovered in prostate cancer cells, the epigenetic role of PKCβ in immune cells has yet
to be discovered.
P a g e | 18 1.9. Aims of this thesis
The objective of this project is to investigate the role that PKCβ may play as an
epigenetic enzyme in regulating the inducible gene expression in B cells. The
hypothesis of this thesis is that PKCβ is involved in the epigenetic regulation of the B
cell inducible gene expression through a chromatin-associated mechanism.
The aims of this thesis are:
1. Optimize a model system through which inducible gene expression during B cell
activation can be analyzed.
2. To examine if PKCβ is required for inducible immune gene expression.
3. Determine if the PKCβ is associated to the chromatin in mouse B cells.
On a broader scale, this thesis will help to illuminate the epigenetic mechanisms
of B cell activation. Results obtained will contribute to the understanding of the role of
PKCβ in the activation of inducible immune genes in B cells. This thesis will also
highlight and investigate the nuclear role of PKCβ in the immune system.

P a g e | 19
Chapter 2: Materials and Methods

P a g e | 20
2.1. Materials
2.1.1. Cell culture Dulbeccos Modified Eagles Medium (DMEM) with 4.0 mM L-Glutamine and 100mg
sodium pyruvate (Hyclone SH30021.01).
Fetal calf serum (FCS, sigma 12003).
Penicillin and streptomycin (Gibco 15140).
Phorbol 12-myristate 13-acetate (PMA, Sigma-Aldrich, P8139)
Ionomycin (Sigma-Aldrich, 5609-81)
2.1.2. Antibodies Anti-histone phosphorylated H3T6 rabbit polyclonal (Abcam, ab14102)
Anti-histone acetylated H3K9 rabbit polyclonal (Upstate Biotech, 07-352)
Anti-PKCβI rabbit polyclonal (Santa Cruz, sc-209)
Anti-PKCβII rabbit polyclonal (Santa Cruz, sc-210)
Anti-histone acetylated H3K9 (Millipore, 06-942)
Anti-IgM Goat F(ab’)2 (Jackson Immunoresearch Laboratories, 115-001-026)
2.1.3. ChIP Buffers SDS Lysis buffer (Millipore, 20-163)
ChIP Dilution buffer (Millipore, 20-153)
High salt wash buffer (Millipore, 20-154)
Low salt wash buffer (Millipore, 20-157)
LiCl immune complex was buffer (Millipore, 20-156)
TE buffer (Millipore, 20-155)
P a g e | 21 2.1.4. Miscellaneous Power SYBR® Green PCR Master Mix (Applied Biosystems, 4367659)
Lipopolysaccharides from Escherichia coli (LPS, Sigma-Aldrich, 0111)
2.1.5. Primer sequences
Exon promoter primer sequences are shown in Table 2.1 and proximal promoter
primer sequences are shown in Table 2.2.
2.2 Methods
2.2.1. Cell culture
Mouse A20 B cells (ATCC, TIB-208) were cultured in Dulbeccos Modified
Eagles Medium (DMEM) with 4.0 mM L-Glutamine, 100mg sodium pyruvate
(Hyclone), 0.5mM β-mercaptoethanol, 10% FCS (Sigma) and 100U/mL penicillin and
100 u/mL streptomycin (Gibco), at 37°C 5%CO2. The cells were stimulated at a density
of 1 x 10⁶ cells/ml with either 10ng/ml PMA and 100ng/ml ionomycin, 5ng/ml PMA
and 50ng/ml ionomycin, 10ng/ml PMA, 2µg/ml LPS, 100ng/ml ionomycin and 1µg/ml
or 10µg/ml anti-IgM or left non-stimulated. Stimulation lasted for either 0.5, 1, 2, 4, 8,
and 16 hours
2.2.2 RNA extraction
Mouse A20 B cells suspension was harvested and centrifuged at 1500rpm for 5
minutes and supernatant was removed. Cells were resuspended with 1ml TRI reagent
(Sigma) and left to incubate at room temperature for 10 minutes. After incubation 200µl
of chloroform was added to each sample, incubated on ice for 15 minutes and
centrifuged at 1200rpm for 15mins at 4°C to separate phases. The aqueous phase was
isolated and incubated with equal volume isopropanol at -80°C, overnight. Samples
were thawed and centrifuged at 14000rpm for 15 minutes, 4°C before removal of
supernatant. DNA was precipitated with the addition of 80% ethanol, centrifuged at
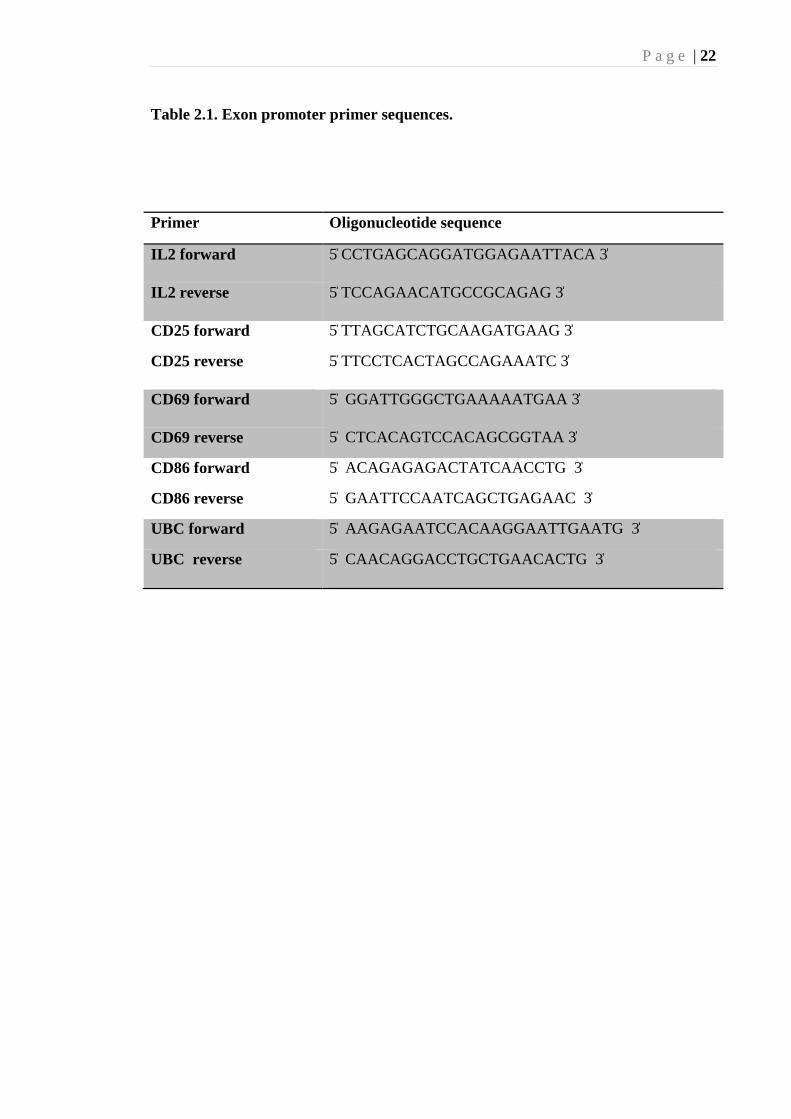
P a g e | 22 Table 2.1. Exon promoter primer sequences.
Primer Oligonucleotide sequence
IL2 forward 5̍ CCTGAGCAGGATGGAGAATTACA 3̍
IL2 reverse 5̍ TCCAGAACATGCCGCAGAG 3̍
CD25 forward 5̍ TTAGCATCTGCAAGATGAAG 3̍
CD25 reverse 5̍ TTCCTCACTAGCCAGAAATC 3̍
CD69 forward 5̍ GGATTGGGCTGAAAAATGAA 3̍
CD69 reverse 5̍ CTCACAGTCCACAGCGGTAA 3̍
CD86 forward 5̍ ACAGAGAGACTATCAACCTG 3̍
CD86 reverse 5̍ GAATTCCAATCAGCTGAGAAC 3̍
UBC forward 5̍ AAGAGAATCCACAAGGAATTGAATG 3̍
UBC reverse 5̍ CAACAGGACCTGCTGAACACTG 3̍

P a g e | 23
Table 2.2. Proximal promoter primer sequences.
Primer Oligonucleotide sequence
IL2 forward 5̍ CACAGGTAGACTCTTTGAAAATATGTGTAA 3̍
IL2 reverse 5̍ CATGGGAGGCAATTTATACTGTTAATG 3̍
CD25 forward 5̍ TCCCCCTAGAGGACTCAGTTT 3̍
CD25 reverse 5̍ TGTACAAGGAAAGGGGGATTC 3̍
CD69 forward 5̍ TCCAGTGCTTTTCCATGTCA 3̍
CD69 reverse 5̍ TCCCAGAATCGAAGACATCC 3̍
P a g e | 24 14000rpm for 15 minutes, 4°C. After the supernatant was removed RNA was then
resuspended in 20µl DEPC H2O.
2.2.3.DNAse treatment and cDNA synthesis.
1µg of isolated RNA was suspended in a volume of 12.5µl of DEPC H2O. RNA
underwent DNAse treatment by the addition of DNAse I (1/10 diluted stock) and 10x
incubation buffer (Roche diagnostics), incubated in a thermocycler at 37°C for 30
minutes, and then inactivated by incubation at 75 °C for 5 minutes. DNAse treated RNA
samples underwent cDNA synthesis using Maxima Enzyme Mix and 5x reaction buffer
(Thermo Scientific), incubating in a thermocyler for; 25°C for 10 minutes, 50°C for 30
minutes, 85°C for 5 minutes. cDNA was further diluted 1/20 for use in real-time
polymerase chain reaction (RT-PCR)
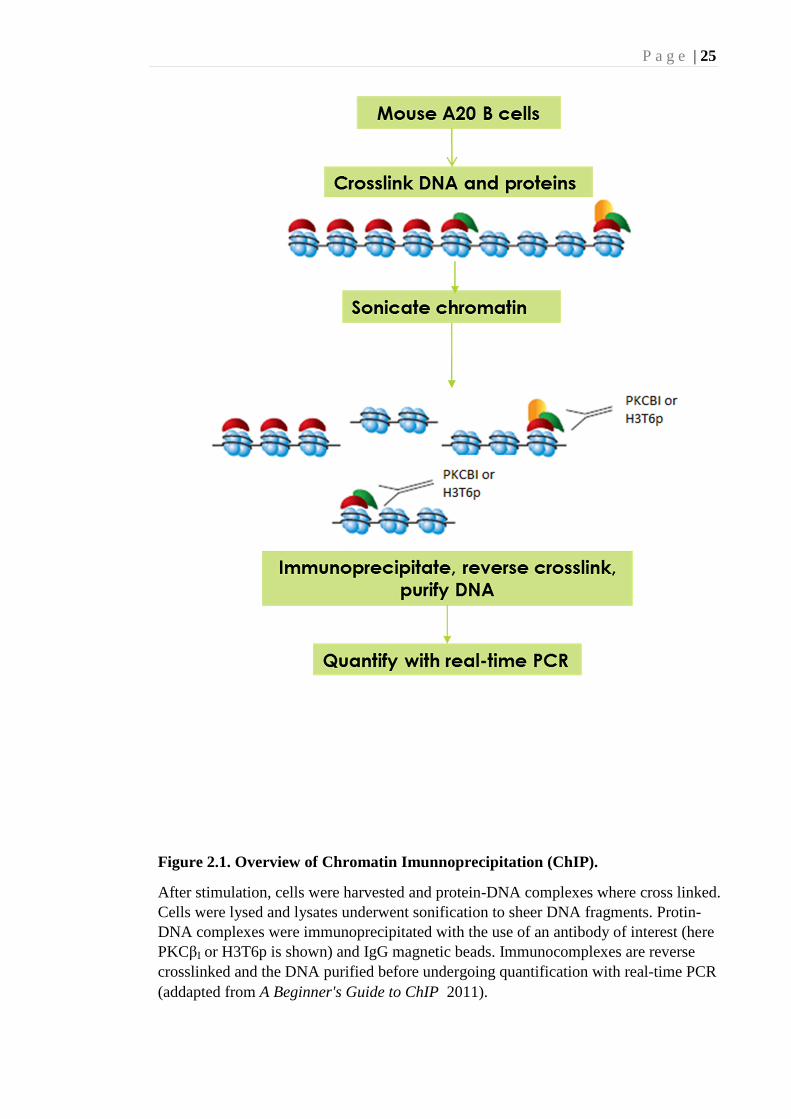
2.2.4. Chromatin Imunnoprecipitation (ChIP)
The basic overview of the ChIP process is given in Figure 2.1. The remaining
cells were cross-linked with formaldehyde on a wheel for 10 minutes at room
temperature. 0.125M glycine was added to quench crosslinking and samples were
rotated for 10 minutes a room temperature. Cells were pelleted by centrifugation,
1200rpm for 10 minutes and washed three times with PBS and stored at -70°C until
further use.
Cells were resuspended in 250µl SDS Lysis buffer and lysates were sonicated to
shear DNA fragments, for; 15minutes with these conditions; pulse on 5 seconds; off 15
seconds; watt 90 ~ 100. Sonicated samples were spun down at 14000rpm, 5 minutes,
4°C to remove cell debris. The supernatant was diluted (1/10) with ChIP dilution buffer
to a volume of 2.5ml. 100µl of the dilution was collected as the total input (TI) and
stored at -80°C. The remaining suspension was divided among the designated IP for that
solution, with the addition of the appropriate amount of antibody (Section 3.3.) and
magnetic beads (Life technologies) and left to immunoprecipiate on a rotating wheel at
4°C overnight. Immunocomplexes were washed with the wash buffers (in the order of
High salt, Low salt, LiCl and TE buffer) by using a magnetic rack to separate complex
from and aspirating the solution, adding 500µl of wash buffer and leaving incubate on a
wheel, 4°C for 5 minutes. The immunoprecipitated complexes weere eluted from the
Protein G magnetic beads by incubating samples with 400µl elution buffer (10%SDS,
0.1M NaHCO3) on a wheel, at room temperature for 30 minutes.
P a g e | 25
Figure 2.1. Overview of Chromatin Imunnoprecipitation (ChIP).
After stimulation, cells were harvested and protein-DNA complexes where cross linked. Cells were lysed and lysates underwent sonification to sheer DNA fragments. Protin-DNA complexes were immunoprecipitated with the use of an antibody of interest (here PKCβI or H3T6p is shown) and IgG magnetic beads. Immunocomplexes are reverse crosslinked and the DNA purified before undergoing quantification with real-time PCR (addapted from A Beginner's Guide to ChIP 2011).

P a g e | 26 Elutes and TI underwent reverse crosslinking by incubating with 5M NaCl
(4µl/100µl, Sigma) at 65°C overnight. The samples were then treated with 1µl
Proteinase K (Sigma), at 45°C for 60 minutes.
Immunoprecipitated DNA was purified by Phenol/Chloroform and Ethanol
precipitation. Equal volumes of phenol/choloform/isoamyl (25:24:1,Fisher Scientific),
then votexed and centrifuged at 12 000rpm, at room temperature for 20 minutes. The
aqueous phase was collected and DNA precipitated by treatment with 2.5 x volume
100% ethanol (Fisher Scientific), 1/10 volume 3m sodium acetate (Sigma) and 1µl
glycogen (Roche), and left to incubate at -80°C overnight. DNA was pelleted by
centrifugation at 12 000rpm, 4°C, for 30 minutes. The supernatant removed by
aspiration and the DNA pellet was washed by suspending in 80% cold ethanol. DNA
was pelleted by centrifugation at 12 000rpm, 40°C, 30 minutes. Supernatant was
removed and DNA was suspended in 20µl of DEPC H2O (Fisher Bioreagents). TI was
further diluted 1/20 before use in real-time PCR, IPs were not.
2.2.5. Quantitative real-time PCR.
SYBR Green real-time PCR was performed in 384 well-plates (Applied
Biosystems) using a ViiA7 real-time PCR system (Life Technologies) with samples ran
in duplicate wells. The reaction was made of 2µl DNA (cDNA or genomic DNA), 1µl
of diluted forward and reverse primer mix (1/20 dilution), 5µl Power SYBR® Green
PCR Master Mix (Applied Biosystems) and 2µl DEPC H2O. Non-template controls
where used with DNA being replaced by H2O in these samples. The reactions were
performed as follows: 50°C for 2 minutes, 95°C for 10 minutes, 40 cycles of; 95°C for
15 minutes, 60 °C for 1 minute. A melt curve was performed at the end with: 95°C for
15 minutes, 60°C for 1 minute and 95°C for 15 minutes. Baseline and threshold was set
by the VIIA7 Software with no modifications. Any samples which had an undetectable
Ct were given the Ct value of 40.
Analysis was carried out similar to that described by Juelic et al, in which Ct
values are converted to arbitrary copy values (Juelich et al. 2009). Ct values where
converted to arbitrary copy values by using the formula: arbitrary copy value = 105/(2(Ct
value 17)), with a Ct of 17 is set to have an 105 arbitrary copies. Arbitrary copy values
were then normalized to those generated by the housekeeping gene Ubiquitin C.

P a g e | 27
Chapter 3: Results
P a g e | 28 3.1. Optimization of the Mouse A20 B cell line to study inducible gene
expression.
B cell expression of immune genes is a highly transient and tightly modulated
event (Néron et al. 2006). As our lab has not established a working inducible model
system for mouse A20 B cells, a couple of key parameters such as the type of stimulus
and the stimulus incubation time needed to be optimized.
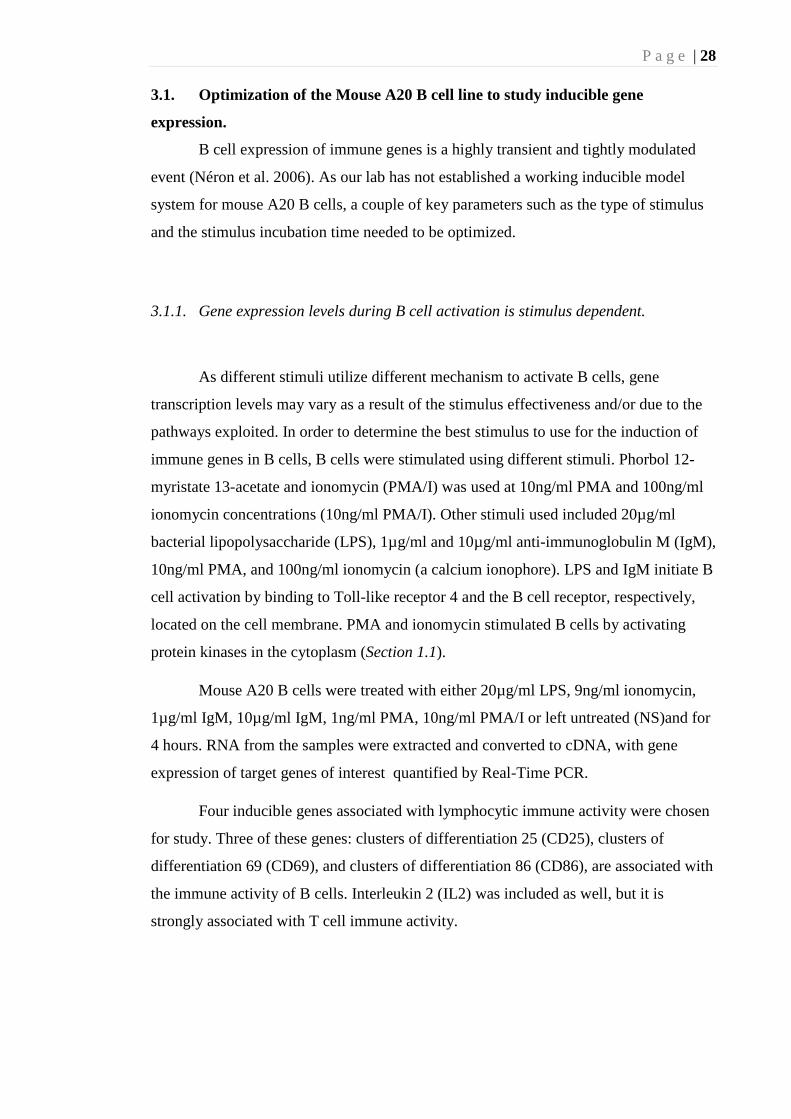
3.1.1. Gene expression levels during B cell activation is stimulus dependent.
As different stimuli utilize different mechanism to activate B cells, gene
transcription levels may vary as a result of the stimulus effectiveness and/or due to the
pathways exploited. In order to determine the best stimulus to use for the induction of
immune genes in B cells, B cells were stimulated using different stimuli. Phorbol 12-
myristate 13-acetate and ionomycin (PMA/I) was used at 10ng/ml PMA and 100ng/ml
ionomycin concentrations (10ng/ml PMA/I). Other stimuli used included 20µg/ml
bacterial lipopolysaccharide (LPS), 1µg/ml and 10µg/ml anti-immunoglobulin M (IgM),
10ng/ml PMA, and 100ng/ml ionomycin (a calcium ionophore). LPS and IgM initiate B
cell activation by binding to Toll-like receptor 4 and the B cell receptor, respectively,
located on the cell membrane. PMA and ionomycin stimulated B cells by activating
protein kinases in the cytoplasm (Section 1.1).
Mouse A20 B cells were treated with either 20µg/ml LPS, 9ng/ml ionomycin,
1µg/ml IgM, 10µg/ml IgM, 1ng/ml PMA, 10ng/ml PMA/I or left untreated (NS)and for
4 hours. RNA from the samples were extracted and converted to cDNA, with gene
expression of target genes of interest quantified by Real-Time PCR.
Four inducible genes associated with lymphocytic immune activity were chosen
for study. Three of these genes: clusters of differentiation 25 (CD25), clusters of
differentiation 69 (CD69), and clusters of differentiation 86 (CD86), are associated with
the immune activity of B cells. Interleukin 2 (IL2) was included as well, but it is
strongly associated with T cell immune activity.
P a g e | 29
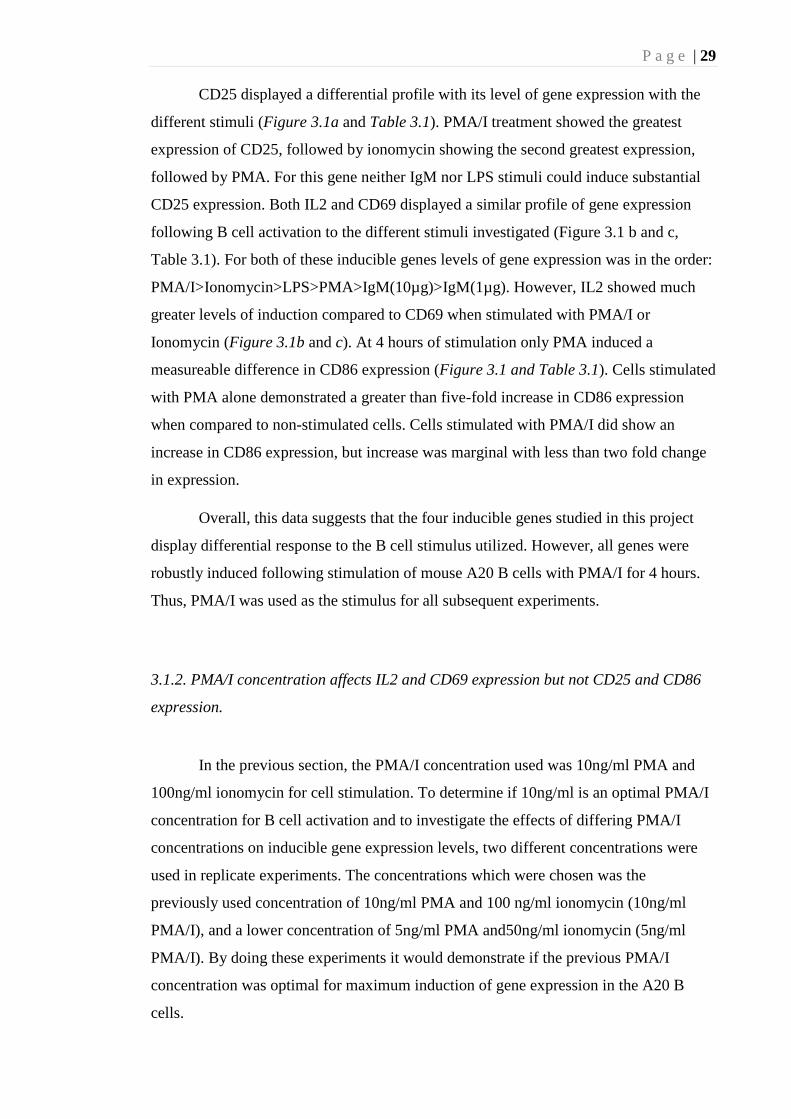
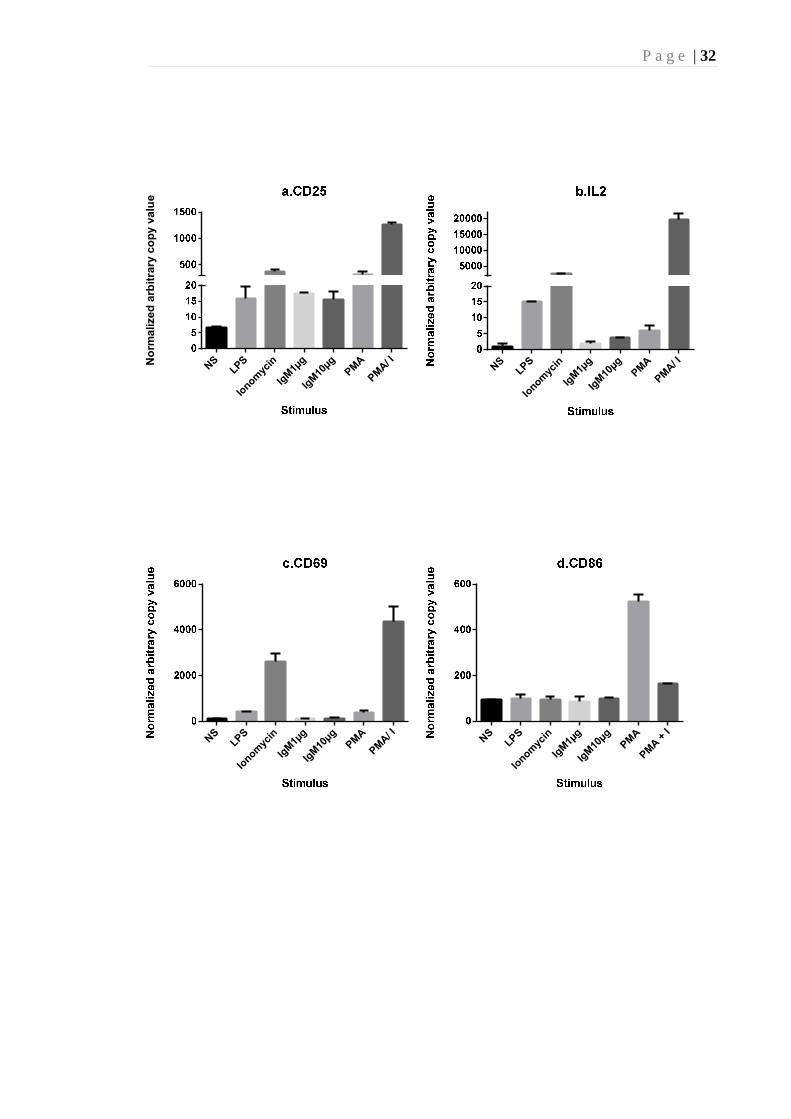
CD25 displayed a differential profile with its level of gene expression with the
different stimuli (Figure 3.1a and Table 3.1). PMA/I treatment showed the greatest
expression of CD25, followed by ionomycin showing the second greatest expression,
followed by PMA. For this gene neither IgM nor LPS stimuli could induce substantial
CD25 expression. Both IL2 and CD69 displayed a similar profile of gene expression
following B cell activation to the different stimuli investigated (Figure 3.1 b and c,
Table 3.1). For both of these inducible genes levels of gene expression was in the order:
PMA/I>Ionomycin>LPS>PMA>IgM(10µg)>IgM(1µg). However, IL2 showed much
greater levels of induction compared to CD69 when stimulated with PMA/I or
Ionomycin (Figure 3.1b and c). At 4 hours of stimulation only PMA induced a
measureable difference in CD86 expression (Figure 3.1 and Table 3.1). Cells stimulated
with PMA alone demonstrated a greater than five-fold increase in CD86 expression
when compared to non-stimulated cells. Cells stimulated with PMA/I did show an
increase in CD86 expression, but increase was marginal with less than two fold change
in expression.
Overall, this data suggests that the four inducible genes studied in this project
display differential response to the B cell stimulus utilized. However, all genes were
robustly induced following stimulation of mouse A20 B cells with PMA/I for 4 hours.
Thus, PMA/I was used as the stimulus for all subsequent experiments.
3.1.2. PMA/I concentration affects IL2 and CD69 expression but not CD25 and CD86
expression.
In the previous section, the PMA/I concentration used was 10ng/ml PMA and
100ng/ml ionomycin for cell stimulation. To determine if 10ng/ml is an optimal PMA/I
concentration for B cell activation and to investigate the effects of differing PMA/I
concentrations on inducible gene expression levels, two different concentrations were
used in replicate experiments. The concentrations which were chosen was the
previously used concentration of 10ng/ml PMA and 100 ng/ml ionomycin (10ng/ml
PMA/I), and a lower concentration of 5ng/ml PMA and50ng/ml ionomycin (5ng/ml
PMA/I). By doing these experiments it would demonstrate if the previous PMA/I
concentration was optimal for maximum induction of gene expression in the A20 B
cells.
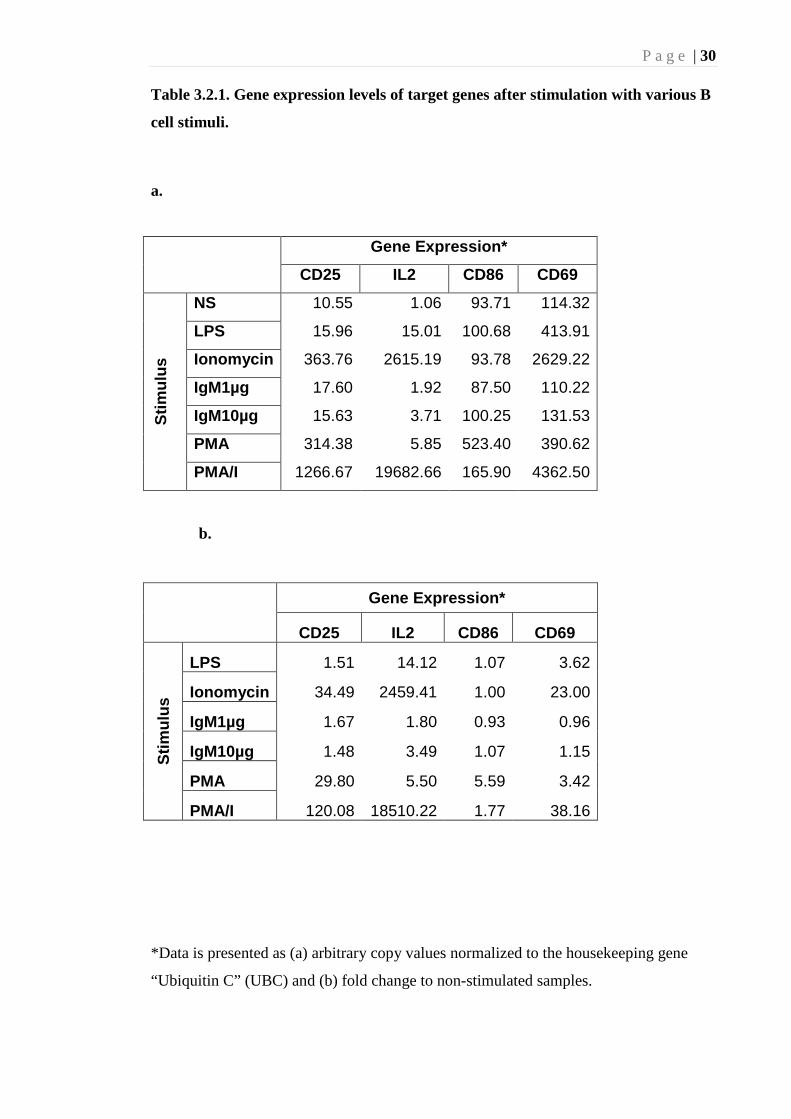
P a g e | 30 Table 3.2.1. Gene expression levels of target genes after stimulation with various B
cell stimuli.
a.
b.
*Data is presented as (a) arbitrary copy values normalized to the housekeeping gene
“Ubiquitin C” (UBC) and (b) fold change to non-stimulated samples.
Gene Expression*
CD25 IL2 CD86 CD69
Stim
ulus
NS 10.55 1.06 93.71 114.32
LPS 15.96 15.01 100.68 413.91
Ionomycin 363.76 2615.19 93.78 2629.22
IgM1µg 17.60 1.92 87.50 110.22
IgM10µg 15.63 3.71 100.25 131.53
PMA 314.38 5.85 523.40 390.62
PMA/I 1266.67 19682.66 165.90 4362.50
Gene Expression*
CD25 IL2 CD86 CD69
Stim
ulus
LPS 1.51 14.12 1.07 3.62
Ionomycin 34.49 2459.41 1.00 23.00
IgM1µg 1.67 1.80 0.93 0.96
IgM10µg 1.48 3.49 1.07 1.15
PMA 29.80 5.50 5.59 3.42
PMA/I 120.08 18510.22 1.77 38.16
P a g e | 31
Figure 3.1. Inducible gene expression levels during B cell activation is stimulus dependent. Mouse A20 B cells were stimulated with either 20µg/ml lipopolysaccharide (LPS), 9ng/ml ionomycin, 1µg/ml anti-immunoglobulin M (IgM), 10µg/ml IgM, 1ng/ml phorbol 12-myristate 13-acetate (PMA), 10ng/ml PMA/I or left untreated (NS), for 4 hours. RNA from the samples were extracted and converted to cDNA, then gene expression was quantified by Real-Time PCR. Gene expression of (a) CD25, (b) IL2, (c) CD69 and (d) CD86 was assessed. Data is presented as arbitrary copy values normalized to the housekeeping gene “Ubiquitin C” (UBC). N=2. Error bars = SEM.
P a g e | 32
NS
LPS
Ionom
ycin
IgM
1µg
IgM
10µg
PM
A
PM
A/ IN
orm
alized
arb
itra
ry c
op
y v
alu
e
NS
LPS
Ionom
ycin
IgM
1µg
IgM
10µg
PM
A
PMA/ I
NS
LPS
Ionom
ycin
IgM
1µg
IgM
10µg
PM
A
PM
A/ I N
SLP
S
Ionom
ycin
IgM
1µg
IgM
10µg
PM
A
PM
A +
I
P a g e | 33
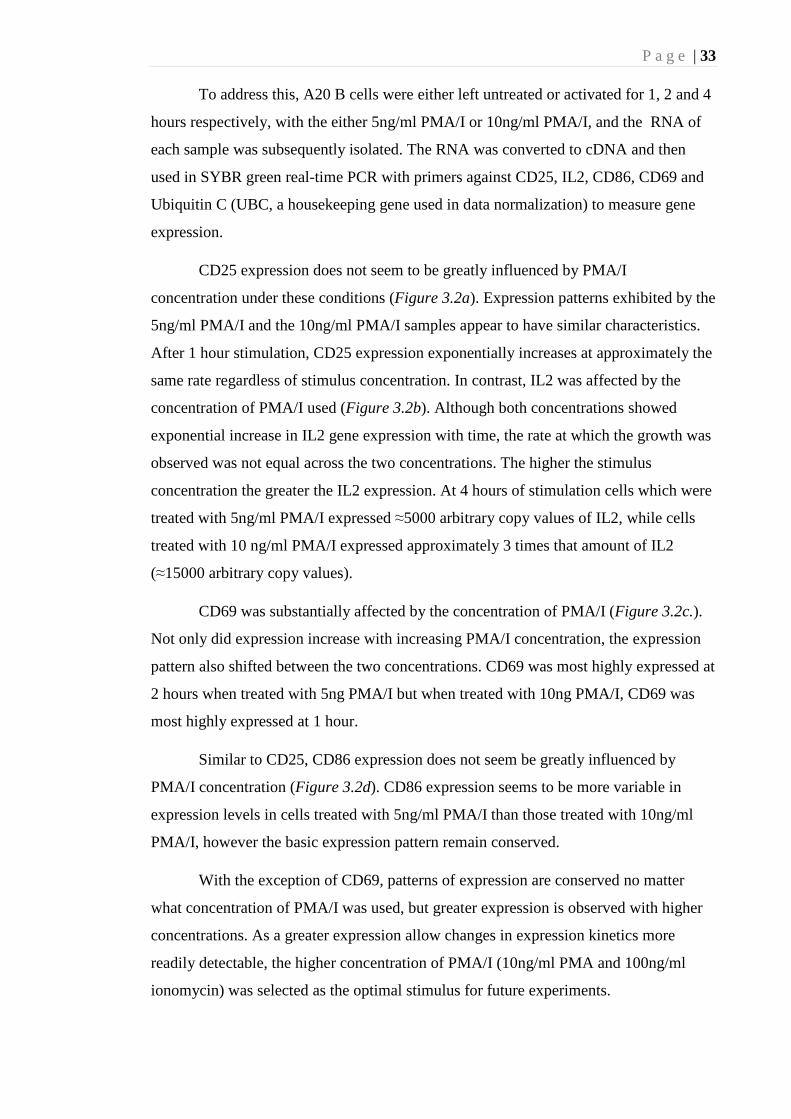
To address this, A20 B cells were either left untreated or activated for 1, 2 and 4
hours respectively, with the either 5ng/ml PMA/I or 10ng/ml PMA/I, and the RNA of
each sample was subsequently isolated. The RNA was converted to cDNA and then
used in SYBR green real-time PCR with primers against CD25, IL2, CD86, CD69 and
Ubiquitin C (UBC, a housekeeping gene used in data normalization) to measure gene
expression.
CD25 expression does not seem to be greatly influenced by PMA/I
concentration under these conditions (Figure 3.2a). Expression patterns exhibited by the
5ng/ml PMA/I and the 10ng/ml PMA/I samples appear to have similar characteristics.
After 1 hour stimulation, CD25 expression exponentially increases at approximately the
same rate regardless of stimulus concentration. In contrast, IL2 was affected by the
concentration of PMA/I used (Figure 3.2b). Although both concentrations showed
exponential increase in IL2 gene expression with time, the rate at which the growth was
observed was not equal across the two concentrations. The higher the stimulus
concentration the greater the IL2 expression. At 4 hours of stimulation cells which were
treated with 5ng/ml PMA/I expressed ≈5000 arbitrary copy values of IL2, while cells
treated with 10 ng/ml PMA/I expressed approximately 3 times that amount of IL2
(≈15000 arbitrary copy values).
CD69 was substantially affected by the concentration of PMA/I (Figure 3.2c.).
Not only did expression increase with increasing PMA/I concentration, the expression
pattern also shifted between the two concentrations. CD69 was most highly expressed at
2 hours when treated with 5ng PMA/I but when treated with 10ng PMA/I, CD69 was
most highly expressed at 1 hour.
Similar to CD25, CD86 expression does not seem be greatly influenced by
PMA/I concentration (Figure 3.2d). CD86 expression seems to be more variable in
expression levels in cells treated with 5ng/ml PMA/I than those treated with 10ng/ml
PMA/I, however the basic expression pattern remain conserved.
With the exception of CD69, patterns of expression are conserved no matter
what concentration of PMA/I was used, but greater expression is observed with higher
concentrations. As a greater expression allow changes in expression kinetics more
readily detectable, the higher concentration of PMA/I (10ng/ml PMA and 100ng/ml
ionomycin) was selected as the optimal stimulus for future experiments.
P a g e | 34
Figure 3.2. PMA/I concentration influence gene expression levels. A20 B cells were stimulated with 2 different concentrations of PMA/I, 5ng/ml or 10ng/ml, or left non-stimulated (harvested at 4 hour time point). Cells were then harvested at designated time points, RNA extracted and converted to cDNA. Gene expression of (a) CD25, (b) IL2, (c) CD86 and (d) CD69 was assessed. Data is presented average arbitrary copy values normalized to UBC.

P a g e | 35

P a g e | 36
3.1.3. A20 B cell stimulation time course optimization.
To determine an appropriate post stimulation time course at which substantial
inducible gene transcription level changes could be observed, mouse A20 B cells were
stimulated with PMA/I for several time points: 0.5, 1, 2, 4, 8 and 16 hours respectively.
It should be noted that non-stimulated controls of 4, 8 and 16 hours were also included,
to determine if basal expression of the inducible genes was constant. The concentrations
of PMA and Ionomycin used in this experiment (10ng/ml and 100ng/ml, respectively)
have been optimized in the previous section (Section 3.1.2.), and extensively utilized by
researchers in the lymphocyte field and in our laboratory.
Cells were harvested after each stimulation time point, with RNA isolated and
converted to cDNA. The expression levels of CD25, CD86, CD69 and IL2 was
analyzed by SYBR green real-time PCR with primers against the genes of interest as
well as the housekeeping gene UBC. The resulting cycle threshold (Ct) values were
converted to arbitrary copy number values and normalized to UBC expression. CD25
(Figure 3.3a) and IL2 (Figure 3.3b) have similar expression patterns across the 16
hours stimulation time course, although IL2 is more highly expressed during
stimulation. All non-stimulated samples expressed low levels of CD25 (20 to 24
arbitrary copy values) and IL2 (˂ 1 arbitrary copy values) before exponentially
increasing in expression to peak at 8 hours stimulation (CD25 ≈ 4500 arbitrary copy
values, IL2 ≈ 14000 arbitrary copy values). Both CD25 and IL2 expression then fell
slightly at 16 hours (CD25 ≈ 3500 arbitrary copy values, IL2 ≈ 1500 arbitrary copy
values), with IL2 dropping more dramatically, almost 1/10th of its 8 hours expression
level.
CD69 peak expression was observed earlier than any of the other genes studied
(Figure 3.3c). Low CD69 expression was observed in the non-stimulated samples (≈4
arbitrary copy values) but quickly rose after stimulation to peak at 628 arbitrary copy
values at 1 hour post stimulation. By 4 hours expression, CD69 levels fell to 72
arbitrary copy values. However expression of CD69 slowly began to rise again,
reaching 147 arbitrary copy values by 16 hours.
P a g e | 37
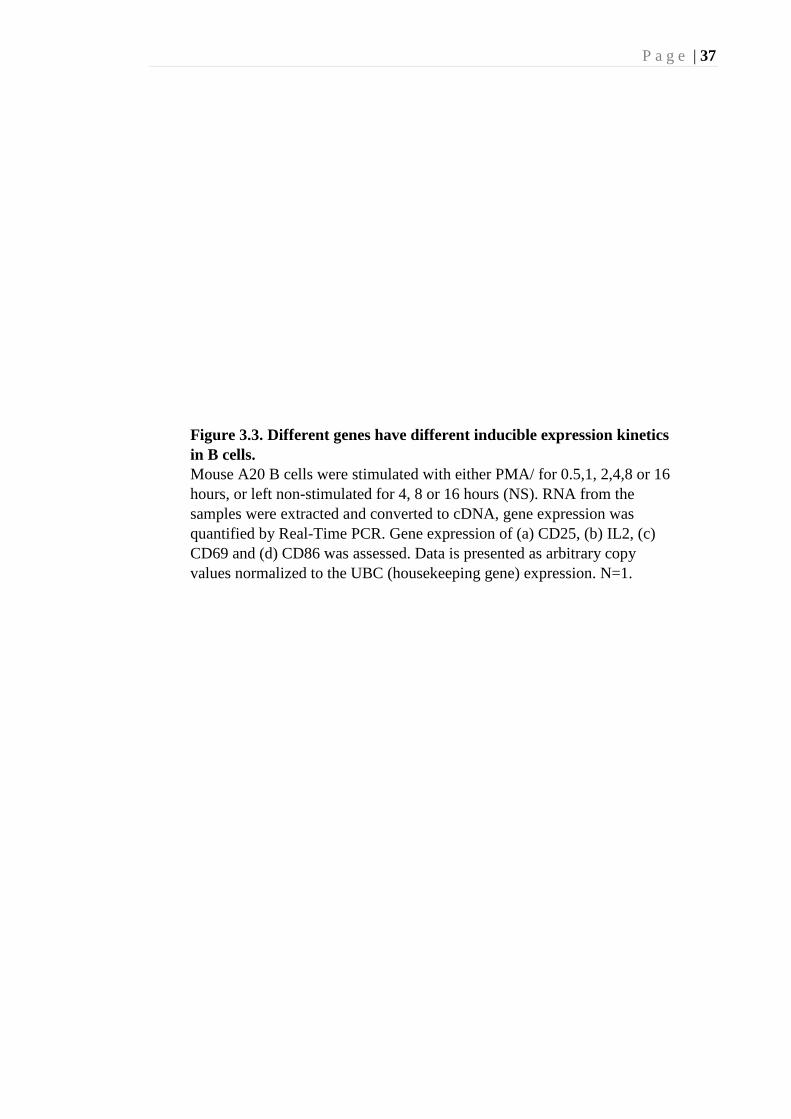
Figure 3.3. Different genes have different inducible expression kinetics in B cells. Mouse A20 B cells were stimulated with either PMA/ for 0.5,1, 2,4,8 or 16 hours, or left non-stimulated for 4, 8 or 16 hours (NS). RNA from the samples were extracted and converted to cDNA, gene expression was quantified by Real-Time PCR. Gene expression of (a) CD25, (b) IL2, (c) CD69 and (d) CD86 was assessed. Data is presented as arbitrary copy values normalized to the UBC (housekeeping gene) expression. N=1.

P a g e | 38
P a g e | 39
CD86 (Figure 3.3d) expression kinetics across the 16 hour stimulation appear to
be variable. The non-stimulated sample demonstrated this variability with over a
twofold change in expression being observed between the non-stimulated 8 hour and the
non-stimulated 16 hour samples (160 and 71 arbitrary copy values respectively), with
the non-stimulated 4 hour sample expressing a value somewhere in between. CD86 was
the least expressed of the genes studied, with expression rising after stimulation and
peaking (342 arbitrary copy values) at the 2 hour time point before falling back to basal
levels by 8 hours (94 arbitrary copy values).
For all the genes of interest, 4 hours of stimulation was sufficient to induce
expression above basal levels. Both CD25 and IL2 expression peaked at 8 hours but at 4
hours, expression is still much higher than non-stimulated samples. As for CD86 and
CD69, there were increased expressions for both genes by 4 hours stimulation, with
maximal expression already taken place. Thus, the 1, 2 and 4 hours stimulation time
course is able to provide a good measure of expression kinetics of the inducible genes.
3.1.4. Verification of inducible gene expression profiles in A20 B cells.
Next, the gene expression experiments were repeated under the optimized
PMA/I conditions and time course to verify the gene expression profile obtained in the
optimization experiments. As before, mouse A20 B cells were stimulated with PMA/I
for 1, 2, or 4 hours, or left non-stimulated. RNA was isolated and converted to cDNA.
The expression of CD25, IL2, CD86, CD69 and UBC in each sample was analyzed by
real-time PCR.
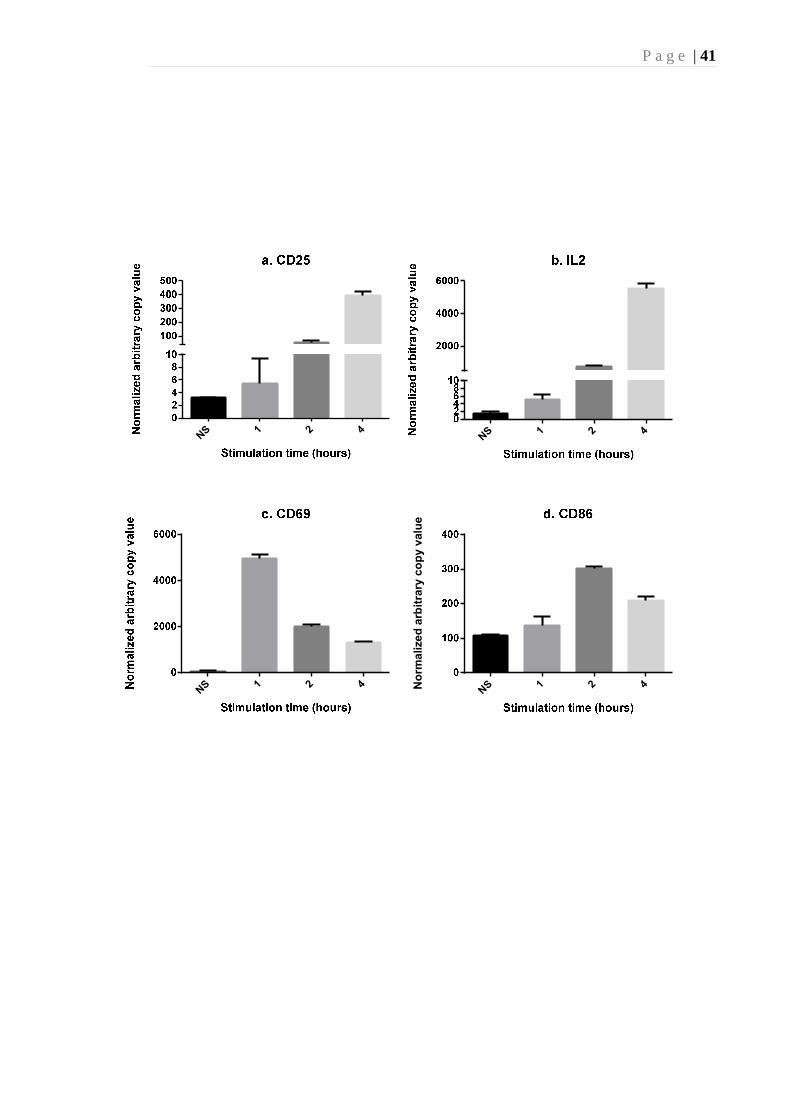
During the 4 hours stimulation, CD25 (Figure 3.4a) and IL2 (Figure 3.4b) gene
expression rose exponentially. Both genes had very low levels of expression during
non-stimulation (arbitrary copy values less than 5) but by the 4 hour time point rose into
the mid-hundreds (CD25) or mid-thousands (IL2). As expected, out of the 4 genes, IL2
appears to be the most highly expressed during stimulation.
P a g e | 40
Figure 3.4. Time course of inducible gene expression in B cells. Mouse A20 B cells were stimulated with either PMA/I for either 1, 2 or 4 hours, or left non-stimulated (NS). RNA from the samples were extracted and converted to cDNA, with gene expression quantified by Real-Time PCR. Gene expression of (a) CD25, (b) IL2, (c) CD69 and (d) CD86 was assessed. Data is presented as arbitrary copy values normalized to UBC (housekeeping gene) expression. N=7. Error bars = SEM
P a g e | 41
NS 1 2 4
NS 1 2 4
NS 1 2 4N
orm
alized
arb
itra
ry c
op
y v
alu
e
NS 1 2 4

P a g e | 42
Both CD69 (Figure 3.4c) and CD86 (Figure 3.4d) gene expression peaks before
the end of the 4 hour stimulation. CD69 has low expression in the non-stimulated state
and peaks at 1 hour followed by a gradual decrease in expression. CD86 has the
smallest increase in expression and peaks at 2 hours before decreasing at 4 hours. Both
CD69 and CD86 expression at 2 hours is still at least 2 fold higher than that of the non-
stimulated samples.
Overall a reproducible system to study gene expression of A20 B cell activation
was set up. For the rest of the experiments the 10 ng/ml PMA/I will be used over a
stimulation time of 1, 2 and 4 hours.
3.2. The effects of PKC inhibition on B cell inducible gene expression.
While Protein Kinase C beta (PKCβ) is well-established as a cytoplasmic
secondary messenger molecule in B cells, we hypothesize that PKCβ also has a role as
an epigenetic regulator of B cell gene induction(Guo et al. 2004). To investigate
whether PKCβ have a regulatory role in immune gene activation in B cells, a PKCβ
inhibitor was used to study the effect of PKCβ inhibition on inducible gene expression.
One of the most widely used inhibitors of PKC is Bisindolylmaleimide (BIS). At
lower concentrations (0.1µM), BIS has been used as a PKCβ specific inhibitor in a
prostate cancer cell study (Metzger et al. 2010). As BIS has not been used in mouse
A20 B cells, a series of titrations will be performed to determine the optimal
concentration for the inhibition of each gene.
To investigate this, mouse A20 B cells were incubated with BIS before
undergoing stimulation with PMA/I for 4 hours. RNA was isolated, converted to cDNA
before being quantified in real-time PCR with CD25, CD69, CD86, and IL2 expression
primers. BIS concentrations used for these experiments ranged from 0.5µM to 4µM.
The 4 hour time point was chosen as all genes would have been induced by that time
point (see Section 3.1).
P a g e | 43
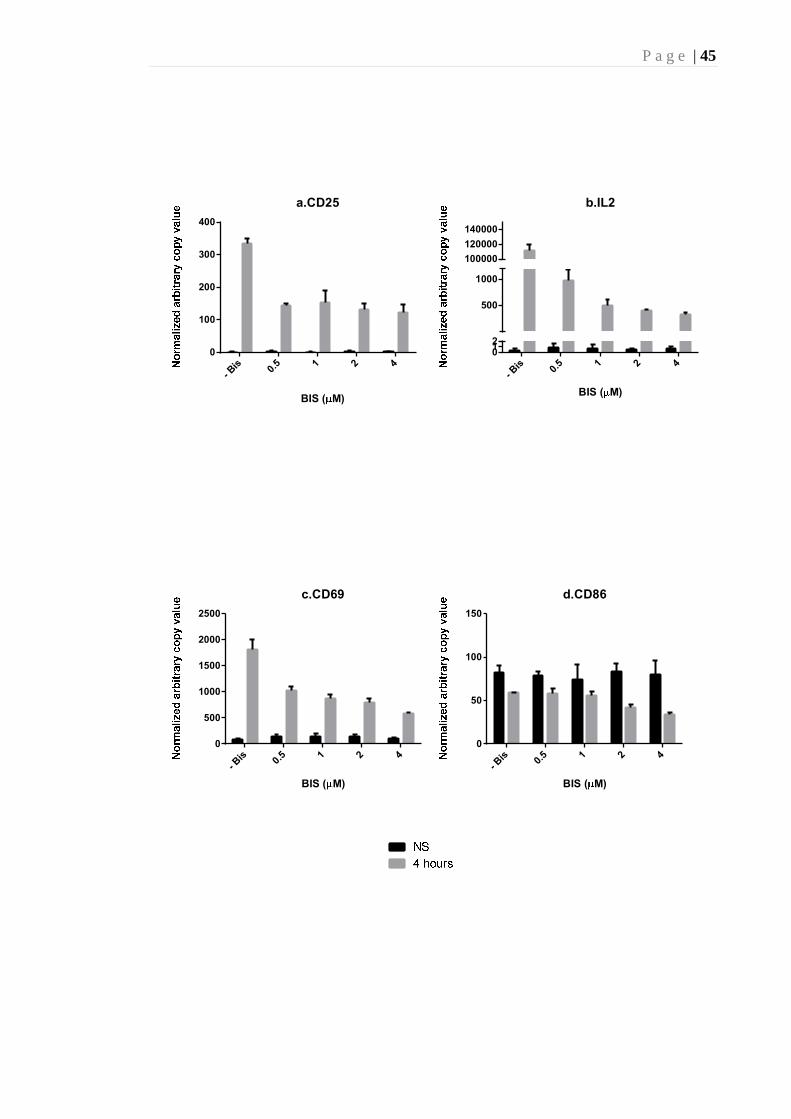
For all the genes, BIS treatment did not affect the non-stimulated cells with
expression levels staying constant regardless of the BIS concentrations used (Figure
3.5). However, an inhibitory effect can be seen upon PMA/I stimulation for all genes
except CD86 (Figure 3.5). The induction of CD25 expression was substantially
inhibited at low BIS concentrations upon 4 hour stimulation (Figure 3.5a). At the
lowest BIS concentration (0.5µM), cells displayed just over 50% inhibition of CD25
expression at 4 hours post stimulation. However increasing BIS concentrations did not
appear to have affect CD25 expression differently, but stayed constant at around 50% to
60% inhibition.
Similarly, the induction of IL2 expression at 4 hours was greatly inhibited at
lowest BIS concentration used (Figure 3.5b). IL2 expression was inhibited by over a
99% when treated with 0.5 µM BIS. Although IL2 expression decreased with increasing
BIS concentration, there was only a slight change compared to the large inhibition at the
lowest concentration.
Induction of CD69 expression was only partially inhibited (≈ 44% inhibition) at
the lowest BIS concentration and increasing BIS concentration only inhibited CD69
expression slightly (Figure 3.5c). However CD69 was substantially inhibited (˃50%) by
the higher BIS treatments (1 and 2µM).
At 4 hours post stimulation, CD86 expression was not inhibited by even the
highest BIS concentration (Figure 3.5d.). Although there does seem to be a gradual
decrease in CD86 expression as BIS concentrations increase, it did not reach substantial
inhibition through the course of this experiment. As a result, CD86 was removed from
further study.
Treatment with the PKC inhibitor BIS lead to inhibition of PMA/I induced
CD25, CD69 and IL2 expression at 4 hours post stimulation in A20 B cells. This
suggests a possible role for PKCβ in B cell activation.
P a g e | 44
Figure 3.5. Inducible gene expression is inhibited by BIS treatment. Mouse A20 B cells were treated with varying concentrations of Bisindolymalimde (BIS), ranging from 0.5µM to 4µM BIS with no BIS DMSO controls (-). Samples were either stimulated by PMA/I for 4 hours, or were harvested at time 0. RNA was isolated, converted to cDNA and quantified by real-time PCR. Gene expression for (a) CD25, (b) IL2, (c) CD69 and (d) CD86 was assessed. Data is presented as arbitrary copy values normalized to UBC expression. NS, non-stimulated is presented. N= 2. Error bars = SEM.
P a g e | 45
- Bis 0.
5 1 2 4
0
100
200
300
400
a.CD25
BIS ( M)
- Bis 0.
5 1 2 4
012
500
1000
100000
120000
140000
b.IL2
BIS ( M)
- Bis 0.
5 1 2 4
0
500
1000
1500
2000
2500
c.CD69
BIS ( M)
- Bis 0.
5 1 2 4
0
50
100
150
d.CD86
BIS ( M)
P a g e | 46 3.3. PKCβ and H3T6p are present at the promoter regions of inducible
immune genes in B cells.
The inhibitor studies described previously (Section 3.2) demonstrate that PKCβ
may be involved in the regulation of inducible gene expression during B cell activation.
A recent study showed that PKCβI can regulate gene expression in prostate cancer cells
by phosphorylating histone H3 on Threonine residue 6 (H3T6) (Metzger et al. 2010).
Thus it may be hypothesized that PKCβ may regulate gene expression in B cells
through H3T6 phosphorylation (H3T6p) as well. To investigate PKCβ and H3T6p
binding on promoter regions of inducible genes in B cells, Chromatin
Imunnoprecipitation (ChIP) assay will be performed (described in Section 2.2.)
3.3.1. Optimization of ChIP antibodies.
• Histone H3 lysine acetylation (H3K9ac)
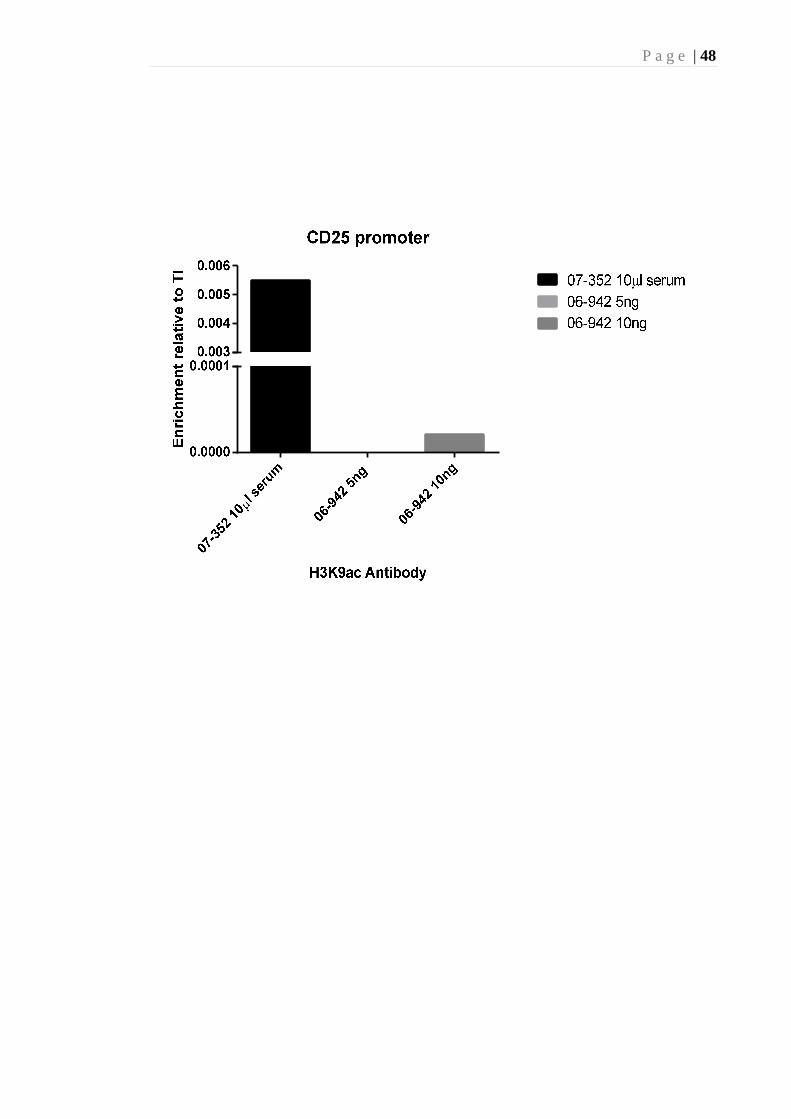
As ChIP had not been performed in our lab on mouse A20 B cells, the ChIP
assay needed to be optimized for this cell line. As a control to make sure that the ChIP
assay could be performed reproducibly in B cells, the antibody against the histone
modification of Histone H3 lysine residue 9 acetylation (H3K9ac) was used. H3K9ac is
an active transcription mark, that is implicated in gene expression regulation, and has
been used routinely in our lab as a positive control for a working ChIP assay (Du et al.
2013). In order to determine a good H3K9ac antibody to work with two H3K9ac
antibodies, 07-352(Millipore) and 06-942(Millipore), were tested. While antibody 07-
352 is a serum which has been used in our lab routinely for ChIP on T cells, both 07-
352 and 06-942 antibodies were tested as neither of these antibodies has been tested in
B cells. In this ChIP assay, mouse A20 B cells were stimulated with PMA/I for 2 hours
and cross-linked upon harvesting. DNA-protein complexes were immunoprecipitated
with either 10µl 07-352, 5ng or 10ng 06-942. Isolated DNA was quantified for CD25
proximal promoter enrichment through of target protein binding SYBR green real-time
PCR with a CD25 proximal promoter primer. The results demonstrate that the antibody
07-352 was able immunoprecipitate more H3K9ac than the antibody 06-942 (Figure
3.6). Antibody 07-352 showed over 10 times greater enrichment at the CD25 proximal
P a g e | 47
Figure 3.6. Comparison of H3K9ac antibodies in their ability to bind DNA in ChIP. Mouse A20 B cells were stimulated with PMA/I for 2 hours. ChIP was performed using antibodies against H3K9ac. Samples underwent precipitation with either 10µl 07-352 (Millipore), 5ng or 10ng 06-942 (Millipore) H3K9ac antibodies. Isolated DNA was quantified by real-time PCR with CD25 proximal promoter primer. Data is presented as enrichment of H3K9ac relative to total input. N=1; TI, total input.
P a g e | 48

P a g e | 49 promoter that compared to antibody 06-942. As a result, 07-352 was chosen as the
optimal H3K9ac antibody for use in future experiments. Furthermore, there were good
levels of enrichment of H3K9ac , which shows that the ChIP assay conditions used are
suitable for mouse B cells and the same conditions could be applied for other antibodies
of interest.
As the H3K9ac antibody itself has been optimized, it was investigated if
reproducible results could be obtained over a time course of stimulation. Mouse A20 B
cells were either stimulated with PMA/I for 1, 2 or 4 hours, or left non-stimulated. Cells
were then cross-linked and ChIP was performed with the H3K9ac antibody. Isolated
DNA was analyzed by real-time PCR with CD25, IL2 and CD69 proximal promoter
primers. H3K9ac enrichment kinetics of the CD69, IL2 and CD69 proximal promoter
regions showed high variability across different biological replicate experiments (N=4.
Figure 3.7). For CD25, there was high variability in the levels of H3K9ac enrichment at
the non-stimulated and 1 hour stimulated time points followed by very little enrichment
at 2 and 4 hours stimulation (Figure 3.7a). IL2 and CD69 both show low H3K9ac
enrichment at the non-stimulated, which increased at 1 hour.However, there was very
little enrichment at 2 and 4 hours stimulation. While H3K9ac was able to be
immunoprecipated at a detectable level, the variability in enrichment suggests that the
ChIP with H3K9ac over a time course requires more biological replicates in order to
obtain a clear result.
• Protein Kinase C beta (PKCβ) and H3T6p
To preliminarily assess the presence of PKCβ as nuclear factors in regulating B
cell gene expression, A20 B cells where stimulated for 1, 2 or 4 hours, or left non-
stimulated and ChIP was performed with antibodies against PKCβI, PKCβII and H3T6p.
The immunoprecipitated DNA fragments were analysed by real-time PCR with CD25
promoter primers to determine the abundance of PKCβ and H3T6p on the CD25
proximal promoter in B cells across a 4 hour time course (Figure 3.8).
These results indicate the successful precipitation of H3T6p using the ChIP
assay (Figure 3.8.). Basal H3T6 enrichment produced a Ct value ≈27, enrichment levels
raised to its highest level at 1 hour stimulation (Ct≈25) before failing again (Ct≈29 at 4
hours stimulation). These Ct values were substantially below that of the no-antibody
control (≈35 throughout time course, denoting background noise). In comparison,
PKCβI appeared at much lower levels of enrichment with Ct values ranging from 30 to

P a g e | 50
Figure 3.7. H3K9ac enrichment at inducible gene promoter regions. Mouse A20 B cells were stimulated with PMA/I for 1, 2 or 4 hours, or left non-stimulated. ChIP was performed using antibodies against H3K9ac. Isolated DNA was quantified by real-time PCR with (a) CD25, (b) IL2 or (c) CD69 proximal promoter primer. Data is presented as enrichment of H3K9ac relative to total input. N=4; TI, total input. NS, non-stimulated. TI, total input.
P a g e | 51
NS 1 2 4
0.00000
0.00005
0.00010
0.00015
a.CD25
Stimulation time (hours)
En
rich
men
t re
lati
ve t
o T
I
NS 1 2 4
En
rich
me
nt
rela
tive t
o T
I
NS 1 2 4
En
rich
me
nt
rela
tive t
o T
I
P a g e | 52
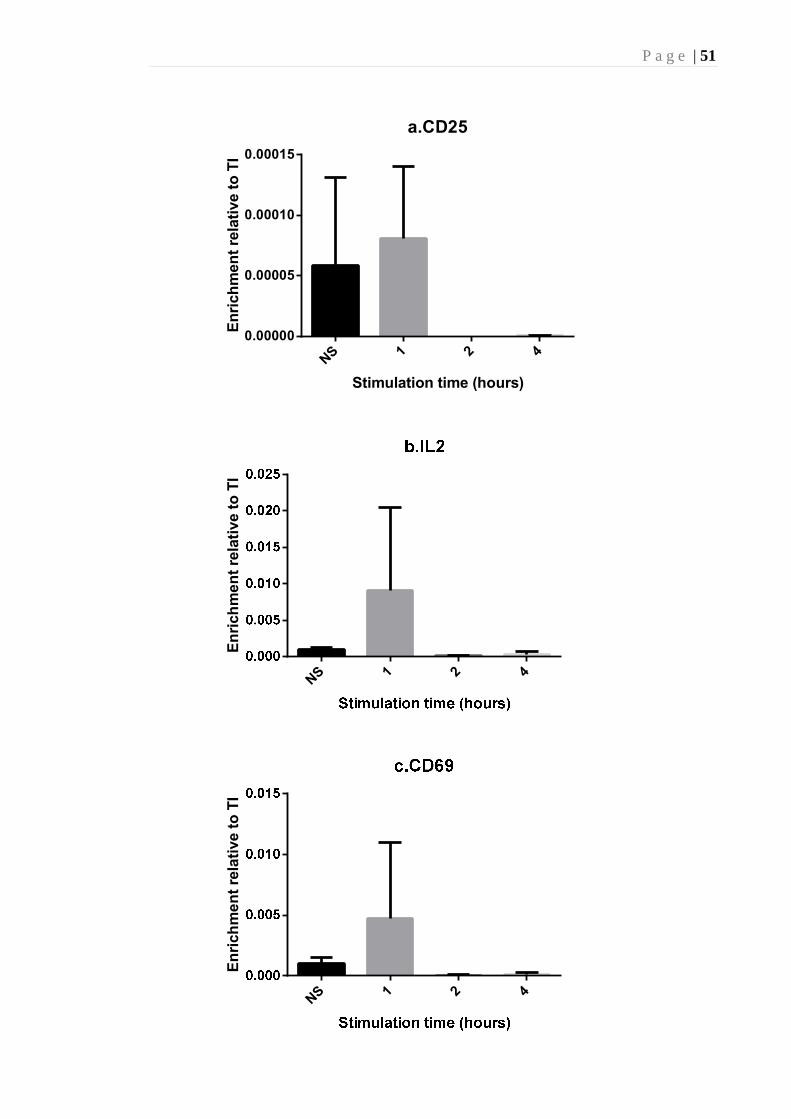
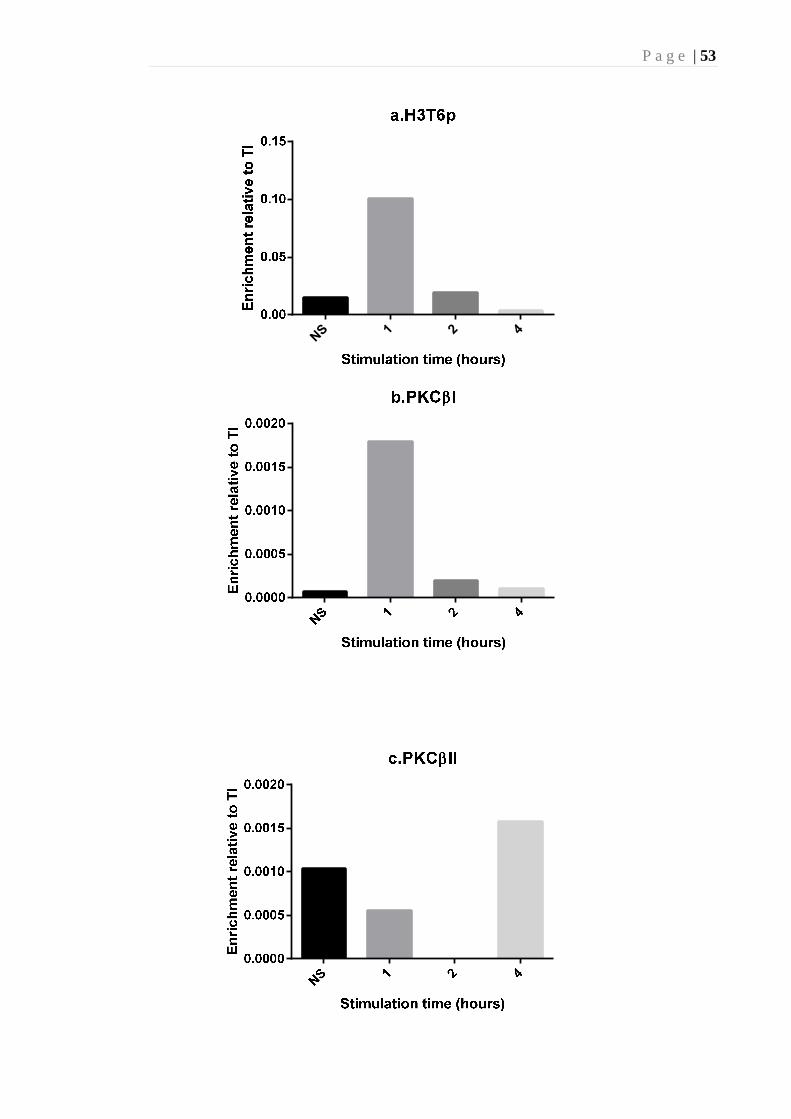
Figure 3.8. ChIP of PKCβ and H3T6p on the CD25 proximal promoter. Mouse A20 B cells were stimulated with PMA/I for 1, 2 or 4 hours, or left non-stimulated. ChIP was performed using antibodies against: (a) H3T6p, (b) PKCβI and (c) PKCβII. Isolated DNA was quantified by real-time PCR with CD25 promoter region primer. Data is presented as enrichment relative to TI. N=1. NS, non-stimulated. TI, Total input.
P a g e | 53
NS 1 2 4
P a g e | 54 35; and PKCβII even lower still (most Ct values ≈34) (Ct data not shown). Therefore
future ChIP procedures would exclude the use of the PKCβII antibody as its enrichment
and Ct values were close to or equal to that of background noise levels. The primary
focus of the remaining ChIP assays would be on the H3T6p and PKCβI antibodies as
they produced detectable enrichment patterns.
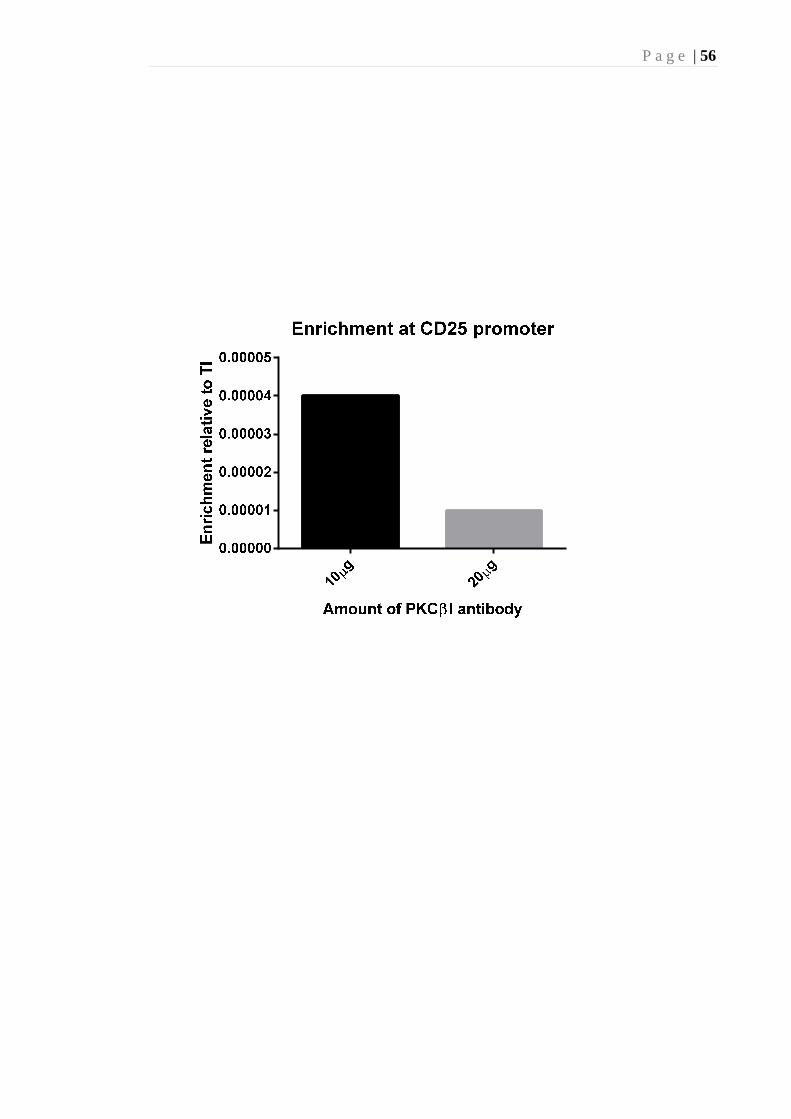
To further optimize the PKCβI antibody used,mouse B cells were stimulated
with PMA/I for 2 hours and ChIP assay was performed using two different
concentrations of the antibody; 10µg (used previously) and 20µg. Immunoprecipitated
DNA was used in real-time PCR with a primer against the promoter region of CD25.
The results demonstrate that at the lower concentration of PKCβI antibody, more DNA
is immunoprecipitated compared to the higher concentration of PKCβI antibody,
indicating that a saturation point in the antibody concentration may have been reached
(Figure 3.9). Thus the PKCβI antibody will be used at 10µg for future experiments.
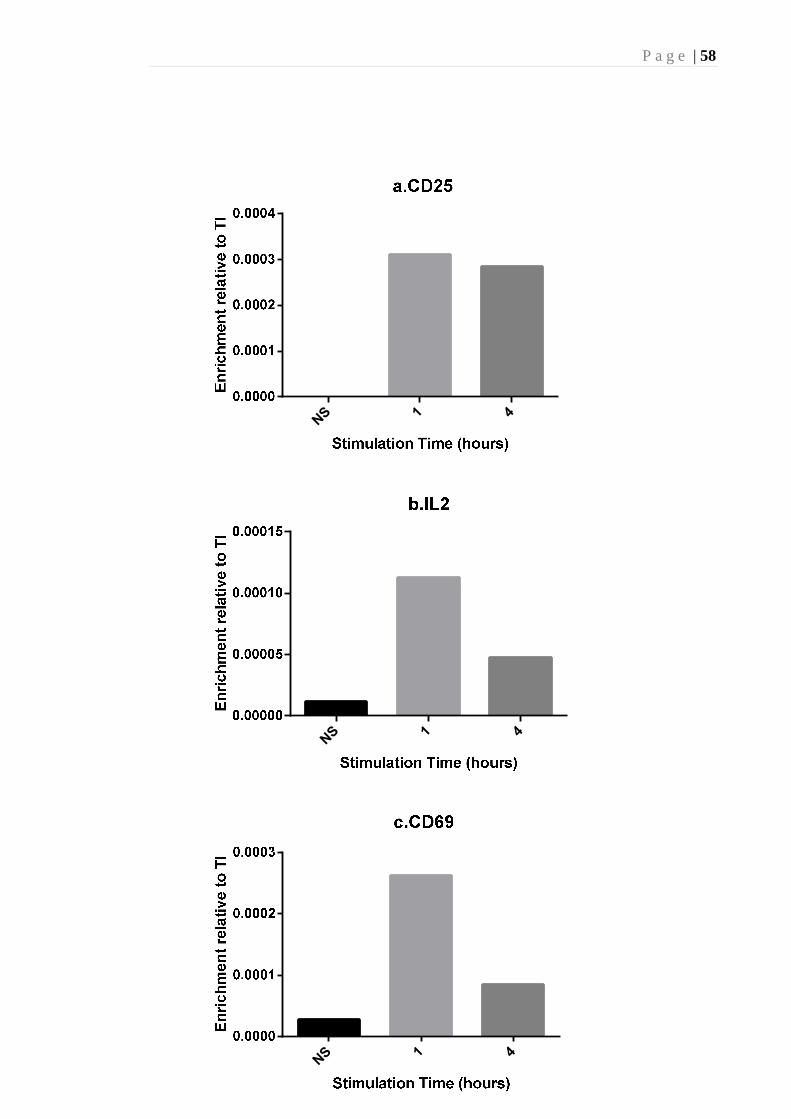
3.5.2. PKCβI and H3T6p are both enriched at gene promoter regions.
To investigate if PKCβ is recruited to the promoter regions of B cell genes, ChIP
assays were performed with antibodies against PKCβI in mouse A20 B cells stimulated
with PMA/I for 1 and 4 hours, and also left non-stimulated. Isolated ChIP DNA
fragments were analyzed with promoter primers for CD25, IL2 and CD69 by real-time
PCR.
PKCβI enrichment kinetics of the proximal promoter regions follows a
conserved pattern for all inducible genes studied (Figure 3.10). In the non-stimulated
cells, PKCβI enrichment at the inducible genes proximal promoter regions is the lowest
level observed for the time courses. At the CD25 proximal promoter, PKCβI enrichment
was not above that of the background noise/no antibody control (Figure 3.10a). For the
IL2 and CD69 proximal promoter regions, PKCβI enrichment is slightly above
background noise (Figure 3.10b and c)

P a g e | 55
Figure 3.9. ChIP using two PKCβI concentrations. Mouse A20 B cells were stimulated with PMA/In for a period of 2 hours. ChIP was performed using an antibody against PKCβI at the concentrations of either 10µg of 20µg. Isolated DNA was analysed by use of real-time PCR with CD25 proximal promoter region primers. Data is presented as enrichment relative to total input. N=1. TI, total input.
P a g e | 56

P a g e | 57
Figure 3.10. PKCβI is enriched on inducible gene promoters. A20 B cells were stimulated with PMA/I for 1 or 4 hours, or left non-stimulated. Upon harvesting, cells were cross-linked before undergoing ChIP with antibodies against PKCβI. Patterns of enrichment of PKCβI on the promoter regions of (a) CD25, (b) IL2 and (b) CD69 derived from a single representative ChIP experiment are shown. Data is presented as enrichment relative to total input. N=3. NS, non-stimulated. TI, total input.
P a g e | 58
NS 1 4
NS 1 4
NS 1 4

P a g e | 59
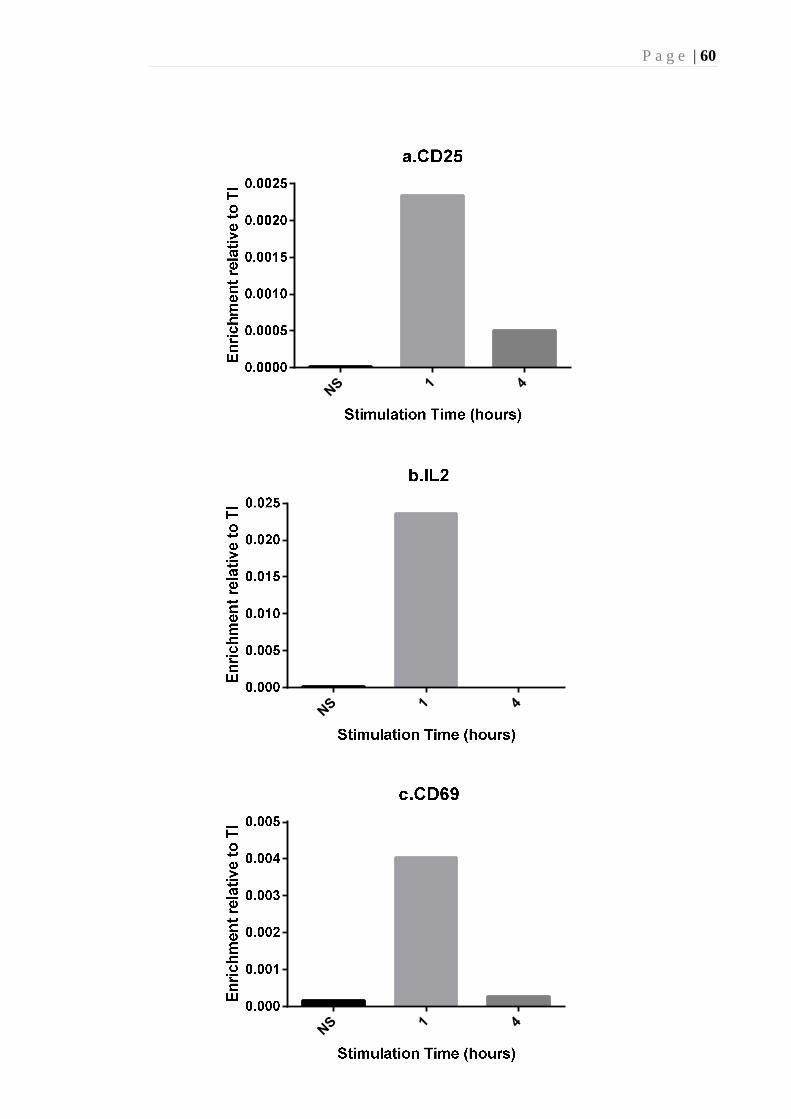
Fig 3.11. H3T6p is enriched on inducible gene promoters. A20 B cells where stimulated with PMA/I for 1 or 4 hours, or left non-stimulated. Upon harvesting, cells were cross-linked before undergoing ChIP. Patterns of enrichment of H3T6p on the promoter regions of (a) CD25, (b) IL2 and (c) CD69 derived from a single representative ChIP experiment are shown. Data is presented as enrichment relative to total input. N=3. NS, non-stimulated. TI, total input.
P a g e | 60
NS 1 4
NS 1 4
NS 1 4

P a g e | 61
The highest levels of PKCβI enrichment at the promoter regions of the inducible
genes was detected at 1 hour post-stimulation with PMA/I (Figure 3.10). The presence
of PKCβI at the CD25, IL2 and CD69 proximal promoter regions increases to over five
times that seen in non-stimulated B cells. However this association appears to be
transient as by 4 hours post-stimulation enrichment levels are decreased dramatically for
both IL2 and CD69 (Figure 3.10b and c). PKCβI enrichment at the CD25 promoter only
decreased slightly at 4 hour stimulation compared to 1 hour (Figure 3.10a).
To investigate if H3T6p is also recruited to the promoter regions of B cell genes,
ChIP assays were performed with antibodies against H3T6p in mouse A20 B cells
stimulated with PMA/I for 1 and 4 hours, and also left non-stimulated. Isolated ChIP
DNA fragments were analyzed with promoter primers for CD25, IL2 and CD69 by real-
time PCR.
Similarly, H3T6p enrichment kinetics at the proximal promoter regions of
inducible B cell genes follows a similar time course pattern when stimulated with
PMA/I (Figure 3.11). Non-stimulated B cells exhibit H3T6p very little enrichment at
the CD25, IL2 and CD69 proximal promoter, almost at background noise levels. At 1
hours post stimulation enrichment of H3T6p on all promoter regions is at the highest
levels seen throughout the time course. At 4 hours post stimulation H3T6p enrichment
at the CD25 promoter decreases, but at a level still above the non-stimulated
enrichment, while at the IL2 and CD69 promoter regions enrichment falls to non-
stimulated levels.
Given that there is an association between PKCβ and H3T6p from previous
studies (Metzger et al. 2010), the enrichment patterns both PKCβ and H3T6p were
compared to see if such an association is present in this study. The results indicate that
there may be such an association, as PKCβI and H3T6p enrichment kinetics profiles are
very similar. Both PKCβI and H3T6p enrichment on CD25, IL2 and CD69 follows a
low enrichment before stimulation, a high enrichment at 1 hours stimulation and a
decreased enrichment at 4 hours stimulation (Figure 3.10 and Figure 3.11). Thus PKCβ
and H3T6p are both dynamically present at promoter regions of inducible genes during
B cell activation.

P a g e | 62
Chapter 4: Discussion
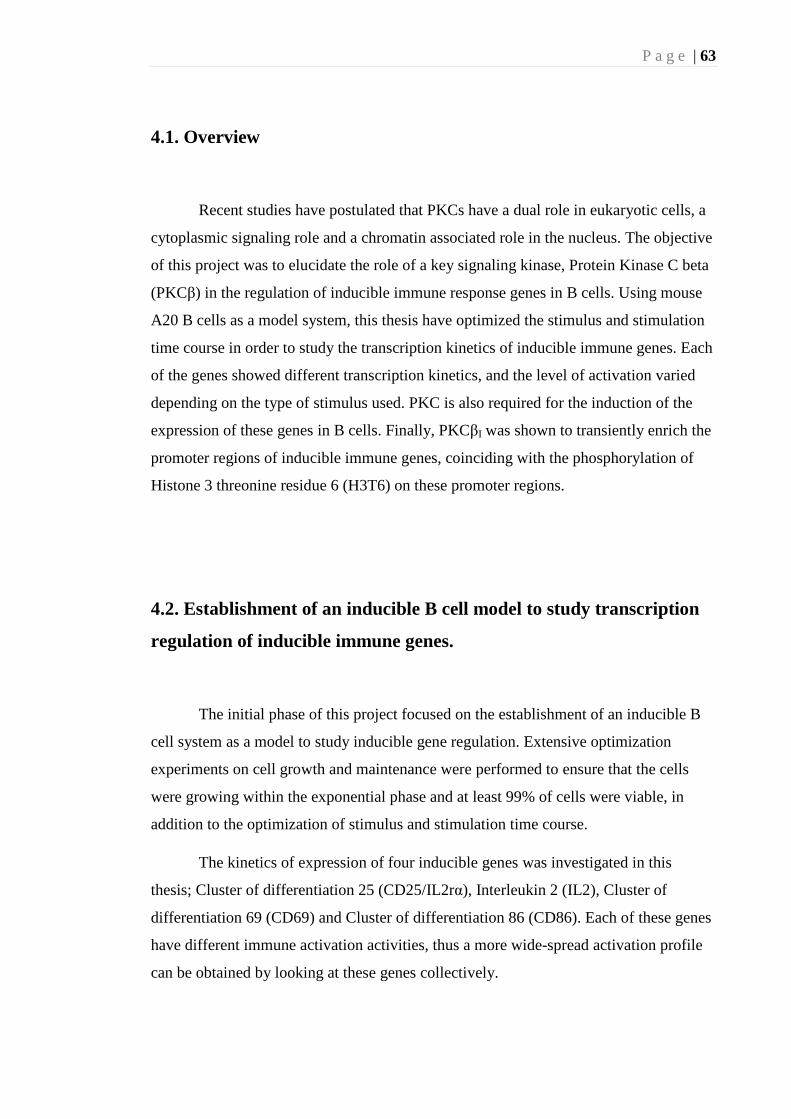
P a g e | 63
4.1. Overview
Recent studies have postulated that PKCs have a dual role in eukaryotic cells, a
cytoplasmic signaling role and a chromatin associated role in the nucleus. The objective
of this project was to elucidate the role of a key signaling kinase, Protein Kinase C beta
(PKCβ) in the regulation of inducible immune response genes in B cells. Using mouse
A20 B cells as a model system, this thesis have optimized the stimulus and stimulation
time course in order to study the transcription kinetics of inducible immune genes. Each
of the genes showed different transcription kinetics, and the level of activation varied
depending on the type of stimulus used. PKC is also required for the induction of the
expression of these genes in B cells. Finally, PKCβI was shown to transiently enrich the
promoter regions of inducible immune genes, coinciding with the phosphorylation of
Histone 3 threonine residue 6 (H3T6) on these promoter regions.
4.2. Establishment of an inducible B cell model to study transcription
regulation of inducible immune genes.
The initial phase of this project focused on the establishment of an inducible B
cell system as a model to study inducible gene regulation. Extensive optimization
experiments on cell growth and maintenance were performed to ensure that the cells
were growing within the exponential phase and at least 99% of cells were viable, in
addition to the optimization of stimulus and stimulation time course.
The kinetics of expression of four inducible genes was investigated in this
thesis; Cluster of differentiation 25 (CD25/IL2rα), Interleukin 2 (IL2), Cluster of
differentiation 69 (CD69) and Cluster of differentiation 86 (CD86). Each of these genes
have different immune activation activities, thus a more wide-spread activation profile
can be obtained by looking at these genes collectively.
P a g e | 64
4.2.1. Gene expression during B cell activation is stimulus dependent.
The findings presented in this thesis suggest that the strength of the stimulus
dictates the inducible gene expression profile elicited by A20 B cells. A variety of
stimuli were inspected for their ability to induce B cell activation, which was gauged by
the transcription levels of the inducible immune genes selected.
The use of an anti-immunoglobulin M (IgM) antibody was to study the
inducibility of B cell activation by binding of the B cell receptor (BCR). IgM constitutes
a part of the BCR, in which IgM binding (by an antigen) causes a conformational
change, leading to the activation of protein kinases (such as Lyn and Syk kinases). This
in turn leads to a cascade of signal transduction events, activating B cells through a
BCR dependent mechanism (Geisberger et al. 2006). Out of all the stimuli tested,
treatment with anti-IgM yielded the lowest changes in gene transcription. When the
BCR was bound increased transcription of CD25, IL2 and CD69 was observed,
however there was not a notable increase in CD86 transcription (Figure 3.1). This could
suggest that CD86 transcription is not as reliant upon BCR binding as CD25, IL2 and
CD69. Of note is that changes in the anti-IgM concentration only effected IL2
transcription levels, implying that transcription of CD69 and CD25 through the BCR is
not dependent upon the strength of the BCR signal.
In comparison to BCR transduction, B cell activation by bacterial wall
Lipopolysaccharide (LPS) utilizes the Toll-like receptor (TLR) signal pathways. LPS
binds to TLR-4 to induce B cell activation (Matheu et al. 2012). Similar expression
patterns for cells stimulate with LPS were seen for those treated with anti-IgM (Figure
3.1), with increased expression of IL2, CD25, and CD69 but not CD86. It could be that
CD86 expression is more selective upon the stimulus which initiates the B cell
activation.
Phorbol 12-mysristate 13-acetate (PMA) and ionomycin is a well-established
activator of B and T cells (Mizuguchi et al. 1986). PMA and ionomycin is an activator
of PKC, which is utilized in B cell activation (see Section 1.1) and is also an activator of
other kinases which could be involved in B cell activation (Schultz et al. 1997; Suga et
al. 2001). The results demonstrated that either ionomycin or PMA alone could initiate
P a g e | 65 increased inducible immune gene expression more than IgM and LPS (Figure 3.1).
However when coupled together, PMA and ionomycin produced even greater
transcription of CD69, CD25 and IL2 in treated cells. PMA and ionomycin was
observed to be dose dependent, with lower concentrations exhibiting delayed expression
of inducible genes (Figure 3.1)
Interestingly CD86 expression was highest in PMA treated cells, increased in
PMA and ionomycin treated cells, but no effect on expression was observed in
ionomycin treated cells (Figure 3.1). However more research is needed to elucidate any
mechanisms surrounding this inhibition.
Thus, PMA and ionomycin treatment resulted in the overall greatest increase in
inducible gene expression. Similar reduced expression of B cell when treated with either
LPS or anti-IgM in comparison to PMA and ionomycin treatment has been previously
observed (Gross et al. 2013; Wheeler et al. 2012). This may be due to LPS and anti-IgM
antibody initiate B cell activation through binding to the cell surface receptors Toll like
receptor4 and B cell receptor, respectively. While PMA and ionomycin by pass the cell
surface and goes directly into the cytoplasm of the cell to activate PKCs to initiate B
cell activation (Bandyopadhyay et al. 1997). PMA and ionomycin was chosen as the
stimulus of choice in this study due to its ability to elicited greater increased inducible
gene expression in comparison to the other stimuli investigated.
4.2.2. The inducible genes display distinct transcription kinetic patterns.
Overall the results presented in this thesis show that expression of inducible,
immune genes in mouse A20 B cells following stimulation with a well-established PKC
stimulant, PMA occurs as a dynamic and precise event (Gonzalez‐Garcia et al. 2013).
PMA and ionomycin stimulation results in a transient inducible gene transcription
however the patterns of expression for the same genes are consistently reproducible
(Figure 3.4). This feature of dynamic, rapid and transient inducible gene expression
observed in the B cell model is consistent with numerous reports of immune responsive
inducible genes in other immune cells such as T cells, macrophages and B cell studies
(McHugh et al. 2002; Sauer et al. 2008; Yang et al. 1994).
P a g e | 66
CD25 was chosen as a gene of interest to study as it is implicated in the immune
function of B cells. CD25 composes the α-chain of the IL2 receptor on B and T cells
(Amu et al. 2006; McKay et al. 1996). The binding of IL2 to the IL2 receptor is one
event which forces B cells to undergo proliferation and maturation after antigen
recognition. Thus as expected, CD25 expression in A20 B cells increased substantially
after stimulation for 8 hours, decreasing slightly at 16 hours. This sustained expression
demonstrates the need for the IL2 receptor during the early stages of B cell activation, in
order to facilitate B cell maturation
Interestingly, we found that the out of the 4 genes studied, IL2 was the most
highly expressed during B cell activation. IL2 has been shown to be expressed by T
cells and dendritic cells (Dennig et al. 1992; Granucci et al. 2001) and has not been
published to be expressed by B cells. The observation that IL2 is expressed during B
cell activation, and expressed at observed high levels (coming from very low basal
expression levels) presents new possibilities of this cytokines role in the immune
system. From what was observed, the expression pattern of IL2 resembled that of CD25
expression, perhaps postulating an autocrine role as similar to its action in T cells.
However more extensive studies are required to investigate the role and expression of
IL2 in B cells.
Rao et al. have shown an expression kinetics pattern of IL2 in human Jurkat T
cells under similar PMA and ionomycin stimulation conditions (Rao et al. 2001), which
is similar to that observed in this study. In comparing this study to the results obtained
in this thesis, both human Jurkat T cells and Mouse A20 B cells appear to have a rapid,
early expression of IL2 (Figure 3.3. Rao et al. 2001). However IL2 expression in human
T cells appears to be shorter lived, with maximal expression at 4 hours post-stimulation,
than that observed in mouse B cells, with maximal expression observed 8 hours post-
stimulation. It should be noted that PMA and ionomycin treatment does not alone result
in the production of IL2 in B cells, as all stimulants which were tested on A20 B cells
also resulted inducible IL2 expression (Figure 3.1).
In this study increased CD69 expression was detected earliest out of the genes
studied (Figure 3.3). CD69 is a cell surface molecule whose presence is commonly used
to gauge early lymphocytic activation. It is a class C lectin protein which regulates B
P a g e | 67 cell migration and cytokine expression, during activation (Purtha et al. 2008; Vazquez
et al. 2009). Increased expression of CD69 was observable at half an hour time point.
This increased expression was still visible after 16 hours, and in human B cells has been
shown to last for days (Purtha et al. 2008).
CD86 was the lowest expressed and most variably expressed gene studied
(Figure 3.3). CD86 gene encodes CD86, a protein which binds to CD28 and CTLA-4
on T cells to help modulate a T cell response (O’Neill et al. 2007). Basal expression
levels of CD86 varied and after 4 hours post stimulation expression levels dropped back
to basal levels. Studies which have examined CD86 expression do so after days of
activation when expression may be higher (Jain et al. 2013; Jeannin et al. 1997; Kohm
et al. 2002). Never the less expression was still measurably increased in the time
parameters of the experiments.
Expression profiles stimulated B cells were examined and for the most part
correlated to results presented in the literature. A suitable number of genes have been
chosen to be studied, with differing expression kinetics. The major unexpected finding
is that of IL2 expression, which appears to be a cytokine expressed by B cells and not
just T cells and dendritic cells. Future experiments should examine the role of IL2
expression in B cells. A limitation of this study is that only four genes where selected to
be rigorously studied. Although these genes are involved in different immune processes
in B cells, displaying different expression kinetics future studies should also incorporate
more immune associate genes.
4.4. PKC is required for inducible gene expression in B cells
Bisindolylmaleimide (BIS) is a potent PKC inhibitor (Toullec et al. 1991).
Through the use of BIS the effects of PKC inhibition on inducible gene transcription in
B cells during activation was measured. By first examining if PKC regulates the
induction of the gene expression for the genes studied in this research, it would serve as
a justification for the completion of further studies into the role of PKCβ in inducing
immune gene transcription in mouse A20 B cells.
P a g e | 68 CD25 expression upon B cell stimulation with PMA and ionomycin was
profoundly reduced when the cell samples were treated with BIS (Figure 3.5a).
Regardless of the concentration tested, there was still over a 50% reduction observed in
comparison to the stimulated, non-inhibited samples. However, the effects of BIS on
CD25 expression did not seem to be concentration dependent (Figure 3.5a). It could be
postulated that this result indicates the presence of a PKC-independent mechanism also
in part responsible for the induction of CD25 expression post B cell stimulation.
In contrast, inhibition of CD69 and IL2 appear to be PKC inhibitor dose
dependent (Figure 3.5b and c). IL2 was substantially inhibited (≈99% inhibited
expression) at the lowest BIS concentration used and continued to decrease slightly with
increasing BIS concentrations (Figure 3.5b). CD69 expression was originally more
slightly inhibited and continued to fall to reach 50% inhibition by 2µM BIS treatment
and then falling further with increased BIS treatment (Figure 3.5c). This PKC inhibitor
dose dependency displayed by CD69 and IL2 expression could indicate that
transcription of these genes is more heavily reliant upon PKC activity, than compared to
CD25 transcription.
CD86 expression was not substantially inhibited by PKC inhibition post 4 hour
stimulation with PMA and ionomycin (Figure 3.5d). Although there was a slight
inhibition when A20 B cells were treated with 4µM BIS ( less than 40%), at this
concentration PKA and other kinases may also be inhibited (Brehmer et al. 2004). This
may demonstrates that CD86 expression is not reliant upon PKC, neither as a signaling
kinase nor epigenetic enzyme. For this reason CD86 was not further analyzed.
Overall, this data suggests that the inducibility of CD25, CD69 and IL2
expression is dependent upon the activity of PKC in A20 B cells. Further experiments
are needed to analyse the importance of PKCβ specifically in inducing expression of
these gene further experiments are needed. Such experiments could include PKCβ
knockout (by use of siRNA) or inhibition by PKCβ peptide inhibitors. These findings
also suggest that such inhibition studies are warranted in primary mouse and human B
cells, to further investigate PKCβ’s role in the regulation of immune activity using in
vivo models of human physiology.

P a g e | 69 4.5. PKCβ enrichment on proximal promoter regions
The findings of this project implicates that PKCβ is likely to be involved in the
epigenetic regulation of B cell activation. PKCβI is present inside the nucleus of A20 B
cells; more specifically shown to be located at the proximal promoter regions of CD69,
CD25 and IL2 upon stimulation (Figure 3.10). While PKCβ has not been reported to be
observed in the nucleus of B cells, it has been observed in the nucleus of prostate cells
(Metzger et al. 2008). Another PKC family member, PKCδ was shown to translocate to
the nucleus upon B cell stimulation (Mecklenbräuker et al. 2004). Similarly, other
protein kinases and epigenetic enzymes have been shown to translocate to the nucleus
for chromatin association (He et al. 2012; Pascual-Ahuir et al. 2006; Pokholok et al.
2006; Sutcliffe & Rao 2011). However, no mechanism surrounding PKCβ nuclear
localization is yet available.
PKCβI appears to be involved during early B cell stimulation by PMA/I at the
proximal promoter regions of IL2, CD25 and CD86 (Figure 3.10). Using ChIP analysis,
PKCβI goes from very low association at the proximal promoter to its highest
enrichment at one hour, before declining at 4 hours post stimulation. The same pattern
of proximal promoter enrichment is observed by the histone phosphorylation of histone
H3 at threonine residue 6 (H3T6p). This mark was shown to be modulated by PKCβI
activity in prostate cells and responsible for androgen receptor gene activation, serving
to inhibit lysine specific demethylase I binding to H3K9 (Metzger et al. 2010). It could
be hypothesized that PKCβI could be responsible for the observed phosphorylation of
H3T6 in A20 B cells during this project. PKCβII was not analyzed for its chromatin
activity due to lack of a ChIP grade antibody, however once such an antibody is
produced it could be used to investigate if it has a similar role histone modifying role to
that of PKCβI.
The enrichment kinetics of PKCβI (and that also of H3T6p) indicates that this
kinase is involved in the early epigenetic regulation of post stimulation CD25, IL2 and
CD69 transcription, at the proximal promoter regions (Figure 3.10 and Figure 3.11). As
these inducible genes display different expression kinetics, this transient binding of
PKCβI is unlikely to be involved in the recruitment of universally similar epigenetic
transcription apparatuses for these inducible immune genes. The maximal expression of
CD69 when stimulated with PMA and Ionomycin was seen at 1 hour post stimulation,
P a g e | 70 coinciding with the maximal enrichment of PKCβI and H3T6p on its proximal
promoter, postulating that PKCβI has to be present to achieve maximal expression. In
comparison CD25 and IL2 do not display maximal expression until up to 8 hours post
stimulation, although expression is elevated at the 1 hour post stimulation, possibly
implying that PKCβI may be involved in the regulation of further transcription factors
which would result in this efficient expression.
These findings of PKCβ as a possible epigenetic enzyme during B cell
stimulation serves to create a new plethora of possible future experiments. To examine
the need of PKCβ and H3T6p on inducing gene expression in B cells another ChIP
assay could be performed under PKCβ specific inhibition e.g. A ChIP assay performed
on B cells which underwent PKCβ siRNA transfection before stimulation. Also of
interest is whether PKCβ chromatin association is conserved across B cell sub
populations and naïve B cells?
4.6. Conclusions
The aim of this thesis was to investigate the epigenetic role of PKCβ in
regulating inducible immune gene expression in B cells. To achieve this aim, this thesis
has detailed the stimulation optimization of the mouse A20 B cell line, and the kinetics
of inducible expression of CD25, CD69, CD86 and IL2. PKCβ was found to be required
for the successful expression of the inducible immune genes during B cell activation.
Within the nucleus PKCβ was found to be dynamically present on inducible gene
promoter regions, with the associated H3T6p mark also present at the same region. It is
therefore postulated that the importance of PKCβ in inducing immune gene expression
in B cells is not only due to its role as a cytoplasmic kinase, but also possibly due to its
chromatin association. This is the first time that PKCβ has been shown to have a
possible nuclear role in immune cells, corresponding with current research which
demonstrate protein kinases may not only have cytoplasmic roles but also nuclear roles
as well.

P a g e | 71
References
P a g e | 72
Aiello, LP, Clermont, A, Arora, V, Davis, MD, Sheetz, MJ & Bursell, S-E 2006, 'Inhibition of PKC β by Oral Administration of Ruboxistaurin Is Well Tolerated and Ameliorates Diabetes-Induced Retinal Hemodynamic Abnormalities in Patients', Investigative Ophthalmology & Visual Science, vol. 47, no. 1, pp. 86-92.
Aiello, LP, Bursell, S-E, Clermont, A, Duh, E, Ishii, H, Takagi, C, Mori, F, Ciulla, TA,
Ways, K, Jirousek, M, Smith, LEH & King, GL 1997, 'Vascular Endothelial Growth Factor–Induced Retinal Permeability Is Mediated by Protein Kinase C In Vivo and Suppressed by an Orally Effective β-Isoform–Selective Inhibitor', Diabetes, vol. 46, no. 9, pp. 1473-80.
Amu, S, Gjertsson, I, Tarkowski, A & Brisslert, M 2006, 'B-cell CD25 Expression in
Murine Primary and Secondary Lymphoid Tissue', Scandinavian Journal of Immunology, vol. 64, no. 5, pp. 482-92.
Ase, K, Saito, N, Shearman, M, Kikkawa, U, Ono, Y, Igarashi, K, Tanaka, C &
Nishizuka, Y 1988, 'Distinct cellular expression of beta I- and beta II-subspecies of protein kinase C in rat cerebellum', The Journal of Neuroscience, vol. 8, no. 10, pp. 3850-6.
Baek, Sung H 2011, 'When Signaling Kinases Meet Histones and Histone Modifiers in
the Nucleus', Molecular Cell, vol. 42, no. 3, pp. 274-84.
Bandyopadhyay, G, Standaert, ML, Zhao, L, Yu, B, Avignon, A, Galloway, L, Karnam,
P, Moscat, J & Farese, RV 1997, 'Activation of Protein Kinase C (α, β, and ζ) by Insulin in 3T3/L1 Cells: TRANSFECTION STUDIES SUGGEST A ROLE FOR PKC-η IN GLUCOSE TRANSPORT', journal of biological chemistry, vol. 272, no. 4, pp. 2551-8.
Banerjee, T & Chakravarti, D 2011, 'A Peek into the Complex Realm of Histone
Phosphorylation▿', Mol Cell Biol, vol. 31, no. 24, pp. 4858-73.
Barneda-Zahonero, B, Roman-Gonzalez, L, Collazo, O, Mahmoudi, T & Parra, M 2012,
'Epigenetic Regulation of B Lymphocyte Differentiation, Transdifferentiation, and Reprogramming', Comparative and Functional Genomics, vol. 2012, p. 10.
Bird, A 2007, 'Perceptions of epigenetics', Nature, vol. 447, no. 7143, pp. 396-8.
Brehmer, D, Godl, K, Zech, B, Wissing, J & Daub, H 2004, 'Proteome-wide
Identification of Cellular Targets Affected by Bisindolylmaleimide-type Protein Kinase C Inhibitors', Molecular & Cellular Proteomics, vol. 3, no. 5, pp. 490-500.

P a g e | 73 Christina, L-N, Nikolaus, T, Wachowicz, K, Thomas, G, Leitges, M & Gottfried, B
'PKCα and PKCβ cooperate functionally in CD3-induced de novo IL-2 mRNA transcription', Immunology Letters, no. 0.
Cooper, GM & Hausman, RE 2009, The Cell a molecular approach 5edn, ASM Press,
Boston, USA.
Copeland, RA, Olhava, EJ & Scott, MP 2010, 'Targeting epigenetic enzymes for drug
discovery', Current opinion in chemical biology, vol. 14, no. 4, pp. 505-10.
Croken, MM, Nardelli, SC & Kim, K 2012, 'Chromatin modifications, epigenetics, and
how protozoan parasites regulate their lives', Trends in Parasitology, vol. 28, no. 5, pp. 202-13.
Dawson, MA, Bannister, AJ, Gottgens, B, Foster, SD, Bartke, T, Green, AR &
Kouzarides, T 2009, 'JAK2 phosphorylates histone H3Y41 and excludes HP1alpha from chromatin', Nature, vol. 461, no. 7265, pp. 819-22.
Dennig, D, Mecheri, S, Bourhis, J & Hoffman, M 1992, 'Interleukin-2 may enhance or
inhibit antibody production by B cells depending on intracellular cAMP concentrations', Immunology, vol. 77, no. 2, p. 251.
DeVries, TA, Neville, MC & Reyland, ME 2002, 'Nuclear import of PKCδ is required
for apoptosis: identification of a novel nuclear import sequence', The EMBO journal, vol. 21, no. 22, pp. 6050-60.
Donnelly, R, Idris, I & Forrester, JV 2004, 'Protein kinase C inhibition and diabetic
retinopathy: a shot in the dark at translational research', Br J Ophthalmol, vol. 88, no. 1, pp. 145-51.
Du, Z, Li, H, Wei, Q, Zhao, X, Wang, C, Zhu, Q, Yi, X, Xu, W, Liu, XS, Jin, W & Su,
Z 2013, 'Genome-Wide Analysis of Histone Modifications: H3K4me2, H3K4me3, H3K9ac, and H3K27ac in Oryza sativa L. Japonica', Molecular Plant, vol. 6, no. 5, pp. 1463-72.
Fuchs, SM, Krajewski, K, Baker, RW, Miller, VL & Strahl, BD 2011, 'Influence of
Combinatorial Histone Modifications on Antibody and Effector Protein Recognition', Current Biology, vol. 21, no. 1, pp. 53-8.
Geisberger, R, Lamers, M & Achatz, G 2006, 'The riddle of the dual expression of IgM
and IgD', Immunology, vol. 118, no. 4, pp. 429-37.
Geraldes, P & King, GL 2010, 'Activation of Protein Kinase C Isoforms and Its Impact
on Diabetic Complications', Circulation Research, vol. 106, no. 8, pp. 1319-31.

P a g e | 74 Goering, RV, Dockrell, HM, Wakelin, D, Zuckerman, M, Chiodini, PL, Roitt, IM &
Mims, C 2008, Mim's Medical Microbiology, vol. 4, Mosby, USA.
Gonzalez‐Garcia, JR, Machaty, Z, Lai, FA & Swann, K 2013, 'The dynamics of PKC‐
induced phosphorylation triggered by Ca2+ oscillations in mouse eggs', Journal of Cellular Physiology, vol. 228, no. 1, pp. 110-9.
Granucci, F, Vizzardelli, C, Pavelka, N, Feau, S, Persico, M, Virzi, E, Rescigno, M,
Moro, G & Ricciardi-Castagnoli, P 2001, 'Inducible IL-2 production by dendritic cells revealed by global gene expression analysis', Nature Immunology, vol. 2, no. 9, p. 882.
Griner, EM & Kazanietz, MG 2007, 'Protein kinase C and other diacylglycerol effectors
in cancer', Nature Reviews Cancer, vol. 7, no. 4, pp. 281-94.
Gross, S, van Wanrooij, RL, Nijeboer, P, Gelderman, KA, Cillessen, SA, Meijer, GA,
Mulder, CJ, Bouma, G, von Blomberg, BME & Bontkes, HJ 2013, 'Differential IL-13 Production by Small Intestinal Leukocytes in Active Coeliac Disease versus Refractory Coeliac Disease', Mediators of inflammation, vol. 2013.
Guo, B, Su, TT & Rawlings, DJ 2004, 'Protein kinase C family functions in B-cell
activation', Current Opinion in Immunology, vol. 16, pp. 367-73.
He, YQ, Sutcliffe, EL, Bunting, KL, Li, J, Goodall, KJ, Poon, IK, Hulett, MD, Freeman,
C, Zafar, A & McInnes, RL 2012, 'The endoglycosidase heparanase enters the nucleus of T lymphocytes and modulates H3 methylation at actively transcribed genes via the interplay with key chromatin modifying enzymes', Transcription, vol. 3, no. 3, pp. 130-45.
Hug, H & Sarre, TF 1993, 'Protein kinase C isoenzymes: divergence in signal
transduction?', Biochem J, vol. 291 ( Pt 2), pp. 329-43.
Inche, AG & La Thangue, NB 2006, 'Keynote review: Chromatin control and cancer-
drug discovery: realizing the promise', Drug Discovery Today, vol. 11, no. 3–4, pp. 97-109.
Jain, S, Chodisetti, SB & Agrewala, JN 2013, 'Combinatorial Signaling through TLR-2
and CD86 Augments Activation and Differentiation of Resting B Cells', PLoS One, vol. 8, no. 1, p. e54392.
Jeannin, P, Delneste, Y, Lecoanet-Henchoz, S, Gauchat, J-F, Ellis, J & Bonnefoy, J-Y
1997, 'CD86 (B7-2) on Human B Cells: A FUNCTIONAL ROLE IN PROLIFERATION AND SELECTIVE DIFFERENTIATION INTO IgE- AND IgG4-PRODUCING CELLS', journal of biological chemistry, vol. 272, no. 25, pp. 15613-9.
P a g e | 75 Jin, H & Malek, TR 2006, 'Redundant and unique regulation of activated mouse B
lymphocytes by IL-4 and IL-21', Journal of Leukocyte Biology, vol. 80, no. 6, pp. 1416-23.
Juelich, T, Sutcliffe, E, Denton, A, He, Y, Doherty, PC, Parish, C, Turner, SJ,
Tremethick, D & Rao, S 2009, 'Interplay between chromatin remodeling and epigenetic changes during lineage-specific commitment to granzyme B expression', The Journal of Immunology, vol. 183, no. 11, pp. 7063-72.
Kawakami, T, Kawakami, Y & Kitaura, J 2002, 'Protein Kinase CB (PKCB): Nomal
Function and Dieases', Journal of Biochemistry, vol. 132, no. 5, pp. 677-82.
Keenan, C, Long, A & Kelleher, D 1997, 'Protein kinase C and T cell function',
Biochimica et Biophysica Acta (BBA) - Molecular Cell Research, vol. 1358, no. 2, pp. 113-26.
Kindt, TJ, Goldsby, RA & Osborne, BA 2007, Kuby Immunology, vol. 6, Kuby
Immunology, W. H. Freeman and Gompany, New York.
Kohm, AP, Mozaffarian, A & Sanders, VM 2002, 'B Cell Receptor- and β2-Adrenergic
Receptor-Induced Regulation of B7-2 (CD86) Expression in B Cells', The Journal of Immunology, vol. 168, no. 12, pp. 6314-22.
Kouzarides, T 2007, 'Chromatin Modifications and Their Function', Cell, vol. 128, no.
693-705.
Kubo, K, Ohno, S & Suzuki, K 1987, 'Primary structures of human protein kinase C βI
and βII differ only in their C-terminal sequences', FEBS Letters, vol. 223, no. 1, pp. 138-42.
Lander, ES, Linton, LM, Birren, B, Nusbaum, C, Zody, MC, Baldwin, J, Devon, K,
Dewar, K, Doyle, M, FitzHugh, W, Funke, R, Gage, D, Harris, K, Heaford, A, Howland, J, Kann, L, Lehoczky, J, LeVine, R, McEwan, P & McKernan, K 2001, 'Initial sequencing and analysis of the human genome', Nature, vol. 409, no. 6822, p. 860.
Li, B, Carey, M & Workman, JL 2007, 'The Role of Chromatin during Transcription',
Cell, vol. 128, pp. 707-19.
Lim, PS, Li, J, Holloway, AF & Rao, S 2013, 'Epigenetic regulation of inducible gene
expression in the immune system', Immunology, vol. 139, no. 3, pp. 285-93.
Lodish, H, Berk, A, Kaiser, C, Krieger, M, Bretscher, A, Ploegy, H, Amon, A & Scott,
M 2013, Molecular Cell Biology.
P a g e | 76 Luger, K, Mäder, AW, Richmond, RK, Sargent, DF & Richmond, TJ 1997, 'Crystal
structure of the nucleosome core particle at 2.8 Å resolution', Nature, vol. 389, no. 6648, pp. 251-60.
Manning, G, Whyte, DB, Martinez, R, Hunter, T & Sudarsanam, S 2002, 'The Protein
Kinase Complement of the Human Genome', Science, vol. 298, no. 5600, pp. 1912-34.
Matheu, MP, Su, Y, Greenberg, ML, Blanc, CA, Parker, I, Scott, DW & Cahalan, MD
2012, 'Toll-like receptor 4-activated B cells out-compete Toll-like receptor 9-activated B cells to establish peripheral immunological tolerance', Proceedings of the National Academy of Sciences, vol. 109, no. 20, pp. E1258-E66.
McHugh, RS, Whitters, MJ, Piccirillo, CA, Young, DA, Shevach, EM, Collins, M &
Byrne, MC 2002, 'CD4< sup>+</sup> CD25< sup>+</sup> Immunoregulatory T Cells: Gene Expression Analysis Reveals a Functional Role for the Glucocorticoid-Induced TNF Receptor', Immunity, vol. 16, no. 2, pp. 311-23.
McKay, CE & Cushley, W 1996, 'Induction of CD25 expression in human B
lymphocytes by pharmacological activators of cellular signalling pathways', Cytokine, vol. 8, no. 4, pp. 305-12.
Mecklenbräuker, I, L., KS, Michael, L, Fabienne, M & Alexander, T 2004, 'Regulation
of B-cell survival by BAFF-dependent PKCd-mediated nuclear signalling', Nature, vol. 431, no. 7007, pp. 456-61.
Metzger, E, Yin, N, Wissmann, M, Kunowska, N, Fischer, K, Friedrichs, N, Patnaik, D,
Higgins, JMG, Potier, N, Scheidtmann, K-H, Buettner, R & Schüle, R 2008, 'Phosphorylation of histone H3 at threonine 11 establishes a novel chromatin mark for transcriptional regulation', Nature Cell Biology, vol. 10, no. 1, pp. 53-60.
Metzger, E, Imhof, A, Patel, D, Kahl, P, Hoffmeyer, K, Friedrichs, N, Muller, JM,
Greschik, H, Kirfel, J, Ji, S, Kunowska, N, Beisenherz-Huss, C, Guther, T, Buettner, R & Schule, R 2010, 'Phosphorylation of histone H3T6 by PKCB1 controls demethylation at histone H3K4', Nature Cell Biology, vol. 464.
Mizuguchi, J, Beaven, MA, Li, JH & Paul, WE 1986, 'Phorbol myristate acetate inhibits
anti-IgM-mediated signaling in resting B cells', Proceedings of the National Academy of Sciences, vol. 83, no. 12, pp. 4474-8.
Montecino-Rodriguez, E & Dorshkind, K 2012, 'B-1 B Cell Development in the Fetus
and Adult', Immunity, vol. 36, no. 1, pp. 13-21.
Nelson, DL & Cox, MM 2008, Principles of Biochemistry, vol. 5, Tenney, Sara., USA.

P a g e | 77 Néron, S, Suck, G, Ma, X-Z, Sakac, D, Roy, A, Katsman, Y, Dussault, N, Racine, C &
Branch, DR 2006, 'B cell proliferation following CD40 stimulation results in the expression and activation of Src protein tyrosine kinase', International Immunology, vol. 18, no. 2, pp. 375-87.
O’Neill, SK, Cao, Y, Hamel, KM, Doodes, PD, Hutas, G & Finnegan, A 2007,
'Expression of CD80/86 on B Cells Is Essential for Autoreactive T Cell Activation and the Development of Arthritis', The Journal of Immunology, vol. 179, no. 8, pp. 5109-16.
Okkenhaug, K & Vanhaesebroeck, B 2003, 'PI3K in lymphocyte development,
differentiation and activation', Nature Reviews Immunology, vol. 3, no. 4, p. 317.
Pascual-Ahuir, A, Struhl, K & Proft, M 2006, 'Genome-wide location analysis of the
stress-activated MAP kinase Hog1 in yeast', Methods, vol. 40, no. 3, pp. 272-8.
Patke, A, Mecklenbrauker, I, Erdjument-Bromage, H, Tempst, P & Tarakhovsky, A
2006, 'BAFF controls B cell metabolic fitness through a PKC beta- and Akt-dependent mechanism', J Exp Med, vol. 203, no. 11, pp. 2551-62.
Pérez-Cadahia, B, Drobic, B & Davie, JR 2009, 'H3 phosphorylation: dual role in
mitosis and interphase', Biochemistry & Cell Biology, vol. 87, no. 5, pp. 695-709.
Peterson, RT & Schreiber, SL 1999, 'Kinase phosphorylation: Keeping it all in the
family', Current Biology, vol. 9, no. 14, pp. R521-R4.
Pokholok, DK, Zeitlinger, J, Hannett, NM, Reynolds, DB & Young, RA 2006,
'Activated signal transduction kinases frequently occupy target genes', Science, vol. 313, no. 5786, pp. 533-6.
Purtha, WE, Chachu, KA, Virgin, HW & Diamond, MS 2008, 'Early B-cell activation
after West Nile virus infection requires alpha/beta interferon but not antigen receptor signaling', Journal of virology, vol. 82, no. 22, pp. 10964-74.
Rao, S, Procko, E & Shannon, MF 2001, 'Chromatin Remodeling, Measured by a Novel
Real-Time Polymerase Chain Reaction Assay, Across the Proximal Promoter Region of the IL-2 Gene', The Journal of Immunology, vol. 167, no. 8, pp. 4494-503.
Sauer, S, Bruno, L, Hertweck, A, Finlay, D, Leleu, M, Spivakov, M, Knight, ZA, Cobb,
BS, Cantrell, D & O'Connor, E 2008, 'T cell receptor signaling controls Foxp3 expression via PI3K, Akt, and mTOR', Proceedings of the National Academy of Sciences, vol. 105, no. 22, pp. 7797-802.
P a g e | 78 Sawicka, A & Seiser, C 2012, 'Histone H3 phosphorylation - a versatile chromatin
modification for different occasions', Biochimie, vol. 94, no. 11, pp. 2193-201.
Scharf, AND & Imhof, A 2011, 'Every methyl counts – Epigenetic calculus', FEBS
Letters, vol. 585, no. 13, pp. 2001-7.
Schultz, H, Engel, K & Gaestel, M 1997, 'PMA-induced activation of the p42/44ERK-
and p38RK-MAP kinase cascades in HL-60 cells is PKC dependent but not essential for differentiation to the macrophage-like phenotype', Journal of Cellular Physiology, vol. 173, no. 3, pp. 310-8.
Sheetz Mj, KGL 2002, 'MOlecular understanding of hyperglycemia's adverse
effects for diabetic complications', JAMA, vol. 288, no. 20, pp. 2579-88.
Spitaler, M & Cantrell, DA 2004, 'Protein kinase C and beyond', Nature Immunology,
vol. 5, no. 8, pp. 785-90.
Sriram, S 2011, 'Role of glial cells in innate immunity and their role in CNS
demyelination', Journal of Neuroimmunology, vol. 239, no. 1–2, pp. 13-20.
Suga, S, Wu, J, Ogawa, Y, Takeo, T, Kanno, T & Wakui, M 2001, 'Phorbol ester
impairs electrical excitation of rat pancreatic beta-cells through PKC-independent activation of KATP channels', BMC pharmacology, vol. 1, no. 1, p. 3.
Sutcliffe, Elissa L & Rao, S 2011, 'Duplicity of protein kinase C-θ Novel insights into
human T-cell biology', Transcription, vol. 2, no. 4, pp. 189-92.
Sutcliffe, Elissa L, Bunting, Karen L, He, Yi Q, Li, J, Phetsouphanh, C, Seddiki, N,
Zafar, A, Hindmarsh, Elizabeth J, Parish, Christopher R, Kelleher, Anthony D, McInnes, Russell L, Taya, T, Milburn, Peter J & Rao, S 2011, 'Chromatin-Associated Protein Kinase C-θ Regulates an Inducible Gene Expression Program and MicroRNAs in Human T Lymphocytes', Molecular Cell, vol. 41, no. 6, pp. 704-19.
Toullec, D, Pianetti, P, Coste, H, Bellevergue, P, Grand-Perret, T, Ajakane, M, Baudet,
V, Boissin, P, Boursier, E, Loriolle, F & et al. 1991, 'The bisindolylmaleimide GF 109203X is a potent and selective inhibitor of protein kinase C', J Biol Chem, vol. 266, no. 24, pp. 15771-81.
Vallabhapurapu, S & Karin, M 2009, 'Regulation and function of NF-κB transcription
factors in the immune system', Annual review of immunology, vol. 27, pp. 693-733.
P a g e | 79 Valledor, AF, Xaus, J, Comalada, M, Soler, C & Celada, A 2000, 'Protein Kinase Cε Is
Required for the Induction of Mitogen-Activated Protein Kinase Phosphatase-1 in Lipopolysaccharide-Stimulated Macrophages', The Journal of Immunology, vol. 164, no. 1, pp. 29-37.
Vazquez, BN, Laguna, T, Carabana, J, Krangel, MS & Lauzurica, P 2009, 'CD69 Gene
Is Differentially Regulated in T and B Cells by Evolutionarily Conserved Promoter-Distal Elements', The Journal of Immunology, vol. 183, no. 10, pp. 6513-21.
Wheeler, ML & DeFranco, AL 2012, 'Prolonged production of reactive oxygen species
in response to B cell receptor stimulation promotes B cell activation and proliferation', The Journal of Immunology, vol. 189, no. 9, pp. 4405-16.
Willey, JM, Sherwood, LM & Woolverton, CJ 2011, Prescott's Microbiology, vol. 8,
Mc Graw Hill, USA.
Yang, Y, Nunes, FA, Berencsi, K, Furth, EE, Gönczöl, E & Wilson, JM 1994, 'Cellular
immunity to viral antigens limits E1-deleted adenoviruses for gene therapy', Proceedings of the National Academy of Sciences, vol. 91, no. 10, pp. 4407-11.
Zhao, B, Smallwood, A, Yang, J, Koretke, K, Nurse, K, Calamari, A, Kirkpatrick, RB
& Lai, Z 2008, 'Modulation of kinase-inhibitor interactions by auxiliary protein binding: Crystallography studies on Aurora A interactions with VX-680 and with TPX2', Protein Science, vol. 17, no. 10, pp. 1791-7.
Zheng, C & Hayes, JJ 2003, 'Structures and interactions of the core histone tail
domains', Biopolymers, vol. 68, no. 4, pp. 539-46.
Zhong, H & Minneman, KP 1999, 'α1-Adrenoceptor subtypes', European Journal of
Pharmacology, vol. 375, no. 1–3, pp. 261-76.