Embed Size (px)
Citation preview
Examining the Reliability ofRunning Records:
Attaining Generalizable ResultsPARKER C. FAWSONUtah State University
BRIAN C. LUDLOWAlfred University
D. RAY REUTZELUtah State University
RICHARD SUDVVEEKSBrigham Younf; University
JOHN A. SMITHUtah State University
ABSTRACT The authors present results of a generalirabil-ity study of running record assessment. They conduLtcd 2decision studies to ascertain the number of raters and pas-sages necessary to obtain a reliable estimate of a student'sreading ability on the basis of a running record assessment.Ten teachers completed running record assessments of 10first-grade students on 2 leveled reading passages. Findingsindicate that each student assessed with running recordsshould read a minimum of 3 passages to produce a reliablescore. Using a fully crossed design in which all students wererated by each rater on all pa.ssages did not provide sizableadvantages over a nested design in which students werecrossed with passages and nested in raters.
Key words: reliability, running record, text leveling
R Linning records (CKiy, 1995) ate ;i widelyreading-assessment process developed originallytor childreti's Reading; Recovery pro!:;ram,s. How-
ever, curretit data su f est that the u.se of this diap;nostic andprogress monitoring process has grown tar heyond theboundaries of Re;iding Recovery. Bean, Cassidy, Griimet,Shelton, and Wallis (2002) mited that 62% of memhers ofthe Internaticinal Readint^ Association who identifiedthemselves as reading teachers were usin; running recordsto assess their students' reading progress. In addition to itsoriginal purpose, running records are now hroatily used hyreading teachers to monitor students' reading progress andto diagnose reading needs in a variety of instructional set-tings across grade levels {Fountas & Pinnell, 1996).
A riaviin^ record is a test of contextual reading acctiracyanJ student strategy use in which studetits read leveled con-nected passages under untimed conditions, The examinertypically makes a record of the types of errors (e.g., dele-tions, insertions, omissions) that each reader cotnmits dur-ing oral reading- Classroom teachers have used the results ofrunning records to establish functional reading levels.Ratbvon (2004) identified functional reading levels as inde-penJent (beyond 95% accuracy), instructional (between90% and 95% accuracy), and frustration (below 90% accu-racy). Teacbers also use running records to identify reading
bebavions of yoting cbildren in context to guide selection otappropriate instructiotial intervetitions. Running recordsarc used as a bencbmark or standards-based reading assess-ment across grade levels in eletiientary schools.
RLinning records have been an attractive assessmentprocess for early readitig largely hecause they allow ateacher to capture various reading behaviors that youngchildren exhibit during contextual reading. As sucb, run-ning records provide teachers witb data in whicb to makeinformed instructional decisions. Assessment tools andprocesses tbat reliably evaluate early reading behaviorallow teachers to intervene before a student establishes apattern of reading failure. Several decades ot researcb haveconfirmed the importance of early intervention to preventreading failure ui young cbildren (Snow, Burns, iSi Griftin,1998). Early intervention is especially critical given tbedevastating future costs, socially and economically, for chil-dren wbo do not learn to read.
Effective scbools researcb identifies regular puigressmonitoring and diagnosis as contributors to improved stu-dent achievement in reading (Hoffman, 1991; Matsunuira,Pattbey-Cbavez, ValJes. & Gamier, 2002; Ross, 2004;Wharton-McOonald et al., 1997; Wray, Medwell, Fox, &Poulson, 2000). Taylor, Pearson, Clark, and Walpole(2000) and Taylor, Pearson, Peterson, and Rodriguez(2005) found that the most effective schools had a sharedsystem for communicating progress monitoring and diag-nostic assessment data within tbe school. Wben schoolprofessionals used a shared systetn for communicating stu-dent progress data, they worked together systetnatically topromptly address each student's reading instruction needs.
Pressley and colleagues (2001) found that the most effec-tive primary-grade teachers conducted running recordassessments as described in Reading Recovery during stu-dent reading instruction (Clay, 1993). Teacbers wbo were
Address currespondenee ui Parker C. Fttu'son, Uuih State Univer-iity. Depariment uf Elementary Educaium, Old Main Hill 2805,Logan, UT 84322-2805. (E-maii parker.faum)[email protected]
Copyright © 2006 Heldref Publications
113

114 The Journal of Educational Research
aware of running record information dealing with students'contextual reading were more likely to use these data tomatch students to appropriate interventions and instruc-tion-level texts. Rtxss (2004) demonstrated a high correla-tion between teachers' frequent use of running records andstudents' reading achievement.
Reading researchers have posited that poor readers relybeavily on context to identify unfamiliar words becausethey lack the ability to rapidly and accurately decode words(Nation & Snowling, 1998; Share & Stanovicb, 1995).Thus, asking struggling readers to read connected text, as isibe case in a running record, may provide teachers witb alielpful glimpse into how struggling readers are processingwritten language. Tunmer and Hoo\'er (1992) suggestedthat u,sing context to identity unknown words in text sup-ports reading aci|uisition by permitting readers to enhancetbeir basic ,sound-symbol knowledge witb context clues todecode unknown weirds. Also, measures of oral reading incontext, sucb as running records, provide a more compre-hensive glimpse into comprebension processes tban domeasures using single-word reading (Ratbvon, 2004), Run-ning records bave traditionally been viewed as prixkicingaccurate assessment results because they pro\'ide anapproximation of autbentic scbool and bome reading.Howe\'er, reliability data bave not been conclusive regard-ing the u.se of running records (Ross, 2004).
National reading reports, legislative mandates, and com-petitive government grants focus on improved reading per-f(»rmance among young children. Within tbat nationalcontext of impnu'cd reading performance, there is a needto gather accurate assessment data on tbe most at-riskyoung readers. One of the most pressing challenges foridentifying struggling readers is ensuring that the assess-ment uistruments tbat teacbers use to judge student read-ing progress produce reliable scores that adequately informteachers' intervention decisions.
One c<mspicut)usly absent finding in the research on run-ning records is tbe identification of sources of variabilitywithin student scores that helps establish the reliability ofthe running record process. To adequately meet thedemands for improved reading-perfomiance assessments,running records .should meet the traditionally expected psy-cbomctric standards ot reliability and validity. Without reli-ability and validity data on students' running record scores,parents, teachers, administrators, and policy makers cannotconfidently use these results to inform teachers' decisionmaking or to determine school-level literacy policy.
Instrument reliability refers to the degree of consistencyof the scores ohtained from a given measure (Huck, 2004).Traub and Rowley (1991) asserted that running record reli-ability is related to conditions and factors within tbe textand also to factors within the student. One factor withinthe text that affects a running record score is tbe difficultylevel of the passage to be read. Even passages at tbe samereading level may bave differing internal linguistic struc-tures or cogniti\'e concept loads tbat would cause student
running record scores to vary from one passage to the next,Establisbing running record reliability must also take intoaccount the varied experiences of each child tbat will posea potential threat to a stable sctire. Tbat is especially thecase witb younger children who differ developmentaily,experientially, and in general reading ability. In addition toreliability tbreats present witbin tbe text or between stu-dents, variability exists acro,ss or witbin the teacbers scor-ing tbe running records or tbe raters.
Interscorer reliability refers to tbe amount of variance ina test related to the variability among tbe raters. Reynolds(1990) suggested that test reliabiliry requires a repttrt ofscoring consistency when raters must make fine-grained dis-tinctions among student responses. When conducting arunning recnrd. teacbers must make such an analysis to fullyand consistently assess eacb student's reading pertormance.The raters of running records, typically teachers with variedlevels of experience, make decisions on a wide array of read-ing bebaviors that tbe cbild demonstrates. Teacber level ofsopbistication in accurately recording complex readingbehaviors creates a potential threat to running record relia-bility. Variability among raters can result not only from var-ied interpretations ot student responses on running recordsbut also trom tbe accuracy of recording student responseswhile taking a running record. Past researcb has shown thatracer variance is most likeiy to occur on tests and in assess-ment processes that require rapid and accurate scoring ofstudent responses (Reynolds).
Clay (1966) stated that "We bave to be concerned withwbetber our assessments are reliable because we do notwant to alter our teaching, or decide on a child's place-ment, on the basis of a flawed judgment" (p. 8). In anexperimental study, Ross (2004) contrasted systematicclassroom assessment using running records with a controlcondition. Teachers in the treatment conditittn completedsix 60-min training sessions in whicb tbey learned how toadminister and interpret running records to better informtheir reading instruction. Student achievement in treat-ment classtooms outperformed that ot the control students,Ross confirmed, however, that tbere has been little psy-chometric data reported on running records. Where datahave been reported, reliability e\'idence has been mixed(Chapman, Tunmer, & Prochnciw, 2001; Ross). Runningrecord reliability bas been especially difficult to establishgiven the variability in passage difficulty and rater. Chap-man and ccilleagues identified passage difficulty and ratervariance as potential threats to the reliability of runningrecord scores. Althougb those variables likely affected thereliability of running reci>rd scores, no researchers bavereporred tbeir impact on rtinning record reliability, Alsc\little is known about how tbe interaction of rbe variablesinfluences running record reliabiliry.
In summary, given the wide utility and lack of strong,consistent reliability evidence for running records, weexplored potential sources of error variance associated witbrunning recorti administration aiui scoring caused by two

NovemberA^ecember 2006 [Vol. 100 (No. 2)1 115
important sources of error variance: (a) passage difficultyand (b) rater variability. Our purpose in this study was tcisuggest potential changes needed for scoring runningrecords to make them more reliable.
To investigate tbe effect tm running records sctires ot tberu'o sources of variability, passage difficulty and rater vari-ability, we used generalizability theory (Cronbacb, Gleser,Nanda, & Rajaratnam, 1972), Three research questionsguided this study.
1, To what degree do inconsistencies between passages oftbe same level of difficulty, inconsistencies hetweenraters, and tbeir interactions contribute to discrepanciesin scores ohtained from a running record assessment (Cstudy to establisb reliability).'
2, Can one change the numher of passages or the numherof raters, or botb, to ciptiinize tbe reliability of tbeobtained running record scores, and, if so, wbat cbangesare needed (D study to affect decisions)?
3, Wbat effect will using a nested design bave (studentscrossed with passage,s atid nested in raters), ratber thanexpecting every rater ro rate every passage read by everystudent, on the error variances and on tbe overall relia-bility of the running record ratings (O stutly to affectdecisions)'
Method
Participants
Teachers and raters. Teacher participants were selectedfrom a pool of all first-grade teachers wbo taught in a largesuburban scbool district in the western United States. Onemember of the rL'.smrc/i team (the authors) made contact withthe district reading coordinator, who then solicited willingvolunteers from a pool of first-grade teachers. From tbat set,one researcher, in collahoration with the district readingcoordinator, identified 10 teacbers who represented a widerange ot training in reading. The 10 teachers were contactedby a researcher and agreed to participate in this study.
Prior to tbeir selection for participation, all teacbersreceived from 2 to 6 br of training on running record use toassess student reading performance. The training was pro-vided through their participation in a literacy conferencesponsored hy a local partner university. Three runningrecord training sessions were presented in this conference.A reading recovery-trained district literacy specialisttaught eacb 2-hr session. Teacher participation in the ses-sions was voluntary; they could attend as much or as littletraining as they wanted. As a result of the training, all par-ticipating teachers had used running records in their class-rooms at varying frequencies and for different purposes.
Three teachers reported using running records in tbeirclassrooms daily to assess student progress in reading. Threeotber teacbers applied running records on a weekly basis toappraise student reading. One teacher used running recordson a monthly basis as a general check on student reading
progress. The final 3 teacbers reported using runningrecords three times per year as directed by district policy. Inaddition to tbeir level of running record training, rbeamount of elementary teaching experience also varied tromteacher to teacher. Three teachers had more tban 15 yearsof classroom experience, 4 teacbers possessed 5 to 15 yearsof experience, and 3 teacbers had less tban 5 years in theclassroom.
Al! participating teacbers indicated that one of the mainpurposes for using running records in their classrooms wasto monitor student progress toward achieving estahlishedreading bencbmarks. Each teacher had to use a runningrecord three times per year to assess student reading. How-ever, the tbree teachers who conducted daily runningrecords also reported that they examined the types of errorstbat students were making and used this information toadjust their instruction to meet resulting reading gaps.
Tbe teachers indicated that wben tbey used runningrecords to assess benchmarks, they needed to use text iden-tified by their district. Also, teacbers who conducted regu-lar riuining records stared that tbey selected instruction-level text trom their classroom book collection. Whenselecting the texts, the teachers generally used hooks witha narrative format.
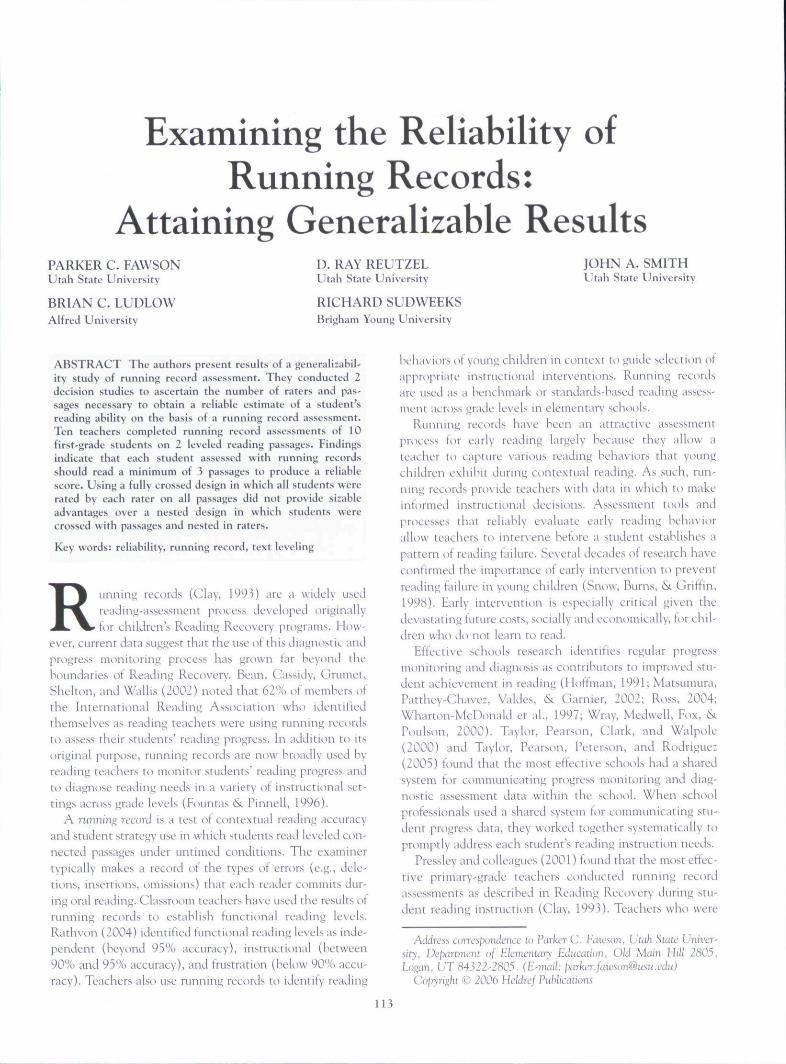
Students. The participants included 12 first-grade stu-dents who wete selected from a scbool in a large suburbandistrict. The socioeconomic status of tbe scbool was aver-age; tbe scbool served a population of 571 kindergartenthrough fitth-grade students. The ethnic makeup of theschool was 6% Asian, \% African American, 9% Hispan-ic, \% American Indian, 2% Pacific Islander, and 81%Caucasian. Students spoke a variety of languages thatincluded Korean, Cliinese, Spanish, and Japanese; Englishwas the language of instruction. All students participatingin tbis study spoke fluent Englisb and had recently com-pleted first grade.
An important consideration in this study was the selec-tion of students who represented \'aried reading-perfor-mance levels. We consulted the first-grade teachers to helpidentify student participants. Classroom teachers assignedeach student to one of the three groups on tbe basis of a setof criteria. Tbe criteria included (a) teacher observation,(b) student performance on classroom assignments, and (c)end of level reading-test scores. Using those criteria, weidentified 4 students as above-average readers, 4 students asaverage, and 4 students as below-benchmark readers. Theabove-average students were at least one grade above gradelevel, as measured by the end of level reading-test scores.Tbe average students were within a range of 5 months ofgrade level. The helow-average students were at least onegrade below grade level. We required students to read twograde-level narrative passages. We removed 2 students fromthe below-average group from the sample because theycould not read the selected text, leaving a total of 10 stu-dent participants—5 girls and 5 boys. (See Table 1 for asummary of student characteristics).
116 The Journal of Educational Research
TABLE 1.
Participant
12
4
6/8910
Nok', F = fer
Participating Student
C^unJcr Lan
FFFFFMMMMM
liilo; M = innle.
Characteristics
4u;igc background
SpanishEnglish
Chine,seEni;li,shEngl i,shEnglishEnglishEnglishS}-i;inisli
Enj lish
Readinj^ level
Average,AKivc averageAhnve- avenifjeBeldvv average
AverageAverage
Below averageAverage
Above averageAbove average
Ethnicity
HispanicCaucasian
AsiiinCauca!>ianCaucasianCaucasianCaucasianCaucasianHispanic
Caucasian
Texts
Tbe narrative passages tor tbis study were selected by aveteran Reading Recovery teacber in tbe participatingscbool district from the district's hencbmark runningrecord text collection. Tbe two narrati\'e pas ages were"George the Ttircupine" (1997) and "Tbe Wagon" (1997)and were Reading Recovery Level 14 texts. We used Level14 texts because they approximate the type of text that anaverage tirst-grade student should be able to read towardtbe end of tbe year,
"George the Porcupine" is part of the reading reco\'erytext collection and is used widely to assess student readingperformance tbrough running records. The passage followsa narrative text structure. A short summary of the story isprovided in the reading recovery book collection. "Georgeis a porcupine tbat lives under Mr. Jay's porch. George bassharp, pointed quills, Tbe quills hurt if you get stuck withthem. Mr. jay petted all kinds of animals, but he didn't petGeorge".
"The Wagon," used in tbe Developmental ReadingAssessment (DRA; a popular reading test), follows a narra-tive text structure; it is a Reading Recovery Level 14 text.Tbe DRA summary of tbe text is provided to eacb reader."This story is about what happens to the wagon that Kevin'sbig brother got to carry his newspapers, Kevin's two broth-ers and bis sister eacb used tbe wagon for ditferent things".
Botb texts used in this study follow a narrative text struc-ture (Mandler & Johnson, 1977; Thomdyke, 1977). Storystructure describes tbe necessary elements to make a stciryand tbe expected sequence tor these elements. Researchersgenerally agree on tbe following elements and sequence ofelements in a stt)ry: setting, problem, goal, events, and res-olution. The Reading Recovery teacher selected tbe twotexts, in part, because teacbers frequently used them toconduct running record assessments, Botb texts follow asimilar text structure, but the topic ai.ldrcs,-ied in each textis different, potentially rei_iuiring \'aried experience fromthe reader.
The teacher selecred text that w'as similar in several waysand dissimilar in one. Botb tests were similar regarding (a)freL|uency ot use in conducting running records, (b) identi-fied text difficulty level, (c) text type (narrative), and (d)text structure (story). We did not control for tbe topicaddressed in each story, Tbat consideration is importantbecause we wanted to replicate tbe way tbat teacbers typi-cally conductei.1 running records with existing leveled textand passages that vary by topic.
We used a fully crossed, three-factor measurementdesign: 10 students crossed witb 10 raters wbo eacb ratedtwo passages (Crocker & Algina, 1986; Sbavelson iSiWebb, 1991). We considered the 10 students as tbe objectof measurement (Sbavelson &, Webb) in tbe design, Tbeobject ot measurement and each additional factor, student,rater, and passage represented a potential source of error intbe ratings. We treated student, rater, and passage as ran-dom factors in tbe design because we viewed tbe sample ofeacb as "smaller than the size of the universe" and"exchangeable with any otber samples of the same sizedrawn tnim the universe" (Shavelson &. Webb, p. 11).
Historically, researcbers considered that a measurementscore is reliable when systematic variance is relatively highand random \-ariance is low (Crocker & Algina, 1986;SbavelscHi & Webb, 1991). We evaluated two assessmentdesigns in this study to explore optimal generalizability andto reduce random error. Design 1 was a fully crossed, tbree-tacttir. Student x Passage x Rater design. Design 2 was atbree-factor nested design witb students crossed witb pas-sages and nested in raters.
Prijcednre
To collect data for analysis, one ot the researcbers video-taped tbe 10 participating students as they read botb of tbenarrati\e, Reading Reco\-ery Le\'el 14 passages. A video

November/December 2006 [Vol. 100 (No. 2)J 117
camera closely approximated the angle from wbicb ateacber would typically view a child during the administra-tion ot a running rectird, Tbe teachers used tbe videorecording of tbe 10 students reajing tbe texts to score tberunning record for eacb passage, louring the video record-ing, a table and cbairs were set up, and a research teammember invited stLidents to sit at tbe table. Tbe re,searcbergave the parents the option to sit on a nearby couch,browse through the books in tbe library, or wait outside tbeclassroom.
Once we collected video i,lata tor eacb participant, aresearcb team member iisked the 10 teachers to complete arunning rectird in the standard torm;it (oral reading errorrate) on each of the 10 stLident> and to tabulate their i,lata.Each teacber completed a running record assessment oneach oi the 10 sttidents readitig the tirst narrative. Level 14passage, "The Wagoii." The teachers had time betweeneach students' reading to tabulate tbeir data and calculatethe running record score. Next, eacb teacher completed arunning record on each of tbe students iis tbey read the sec-ond narrative. Level 14 passage, "George tbe Porcupine."Ali teachers completed their assessments of the students inthe same order and within approximately 2 hr and 15 min.They were not allowed to stop the videotape during thetime when the student was reading, btit they cmild pausebriefly between students.
At the outset of our conducting this stLidy, we faced asignificant task. To establish the generalizability of runningrecord results, some means t)f determining instrument reli-ability needed to be applied. However, traditional methodsof determining the stability of running record results pre-sented several challenges, hi classical test theory (CTT).which has been applied traditionally to reliability studies,multiple-reliability coefficients for various sources of possi-ble error can be estimated for each instrument (i.e., inter-rater or alternate form}. However, because tbe coefficientsare rarely equivalent, test users must decide wbich one ismtwt appropriate for use witb their application. An inher-ent weakness in CTT is its inability to simultaneously ana-lyze multiple st.)urces of error, evaluate the interactions otthese errors, or predict the overall impact of measurementerror (Eason. 1991). Generalizability (G) theory wasdeveloped to help researchers overcome the inherent lim-itations of CTT (Rathvon, 2004)- G theory is used withincreasing frequency to establish the dependability otbehavioral assessments (Hintze, Owen, Shapiro, (Si Daly,2000; Hintze & Petitte. 2001; Wolfersberger, Reutzel, Sud-weeks, iSi Fawsoii, 2004)- Wbeti using G theory, multiplesources ot error can be considered that may bave tin impacton student scorers, as well as on tbe interacticm effects ofvarious error components or factors (Brennan, 1992; Gliss-meyer. 1999).
G theory is a type of conceptual framework that employsstatistical methods with analysis of variance (GENOVA)to assess the stability ot a measure, instrument, or process.G theory assumes that each student's observed score is com-
prised of a unii'L'rsL' score (the student's average score overall items of measurement), along with one or more sourcesot error. Therefore, the power of G theory is that it allowsone to evaluate the extent to which generalizatton,s mightbe made from the observed score of a student to tbe uni-verse ot obser\'ations tbat are ccmtined to tbe factcirs orconditions measured in tbe G study (Ratb\ on, 2004).
Tbe factors considered in this stLidy include student,rater, and passaj e hecause researchers have found thatthese contribute to the diffictilty in establishitig instrumentreliability (Ross, 2004)- Oral reading accLiracy scores in arunning rectird may vary tremendously, according to whichpassage students read or how knowledgeable the rater is.Passage variance is attributable to two sources of variance:(a) lingLiistic structLire Lind features of a text and (h) eachstudent's variant background in relation to the meaningftilcontent in the text. For example, the leveling procedureused to determine passage difficulty attempts to gauge lin-guistic factors that may influence a student's reading accu-racy and running record score. Also, even though two pas-sages may be labeled as similarly difficult in relation to thenumher and length of words and sentences, students mayexhihit very different running;; record scores because of tbeextensiveness of their extant prior knowledge. Further-tiiore, the knowledge level of the rater may introduce asource ot error into running record scoring. For example, arater who h is (a) advanced knowledf^e of reading develop-ment, (h) specific training on using running records, and(c) significant practice taking running records will mostlikely produce a more accurate score than will a teacherwho has limited knowledge, irLiining, or experietice withrunning record scoring.
Teachers must ensure that ohtained running recordscores are an accurate and reliable estimate of a student'suniverse score. According to Fruend and Wilson (1998),"A general principle in any data-collecting effort is tominimize the error variance, which will, in turn, providefor a higher power for hypothesis tests and narrower confi-dence intervals" (p. 362). Any time that an assessment isused as a standardized measure tor making importantinstruction or diagnostic decisions, one must determinewhether the scores generated by tbe tool or process arereliable. If teacbers are not confident that tbe scoreohtained from a running record is a giiod approximation otthe student's true score, then tbe score liuiits tbe useful-ness ot the measure in tracking reading performance. If thescore is unreliable, tben one may be able to determine it asource ot error could be reduced by changing aspects ot theprocess or instrument under the teacher's control. Forexample, when a high degree of variance exists hetweenraters ot a running record, tbe amoLint i>f error could pos-sibly be reduced by increasing the number ot raters andaveraging their scores. If a major stiurce of error is the pas-sage being read, then increasing tbe number ot passagesread and using an average shtuild produce a score, which is3 more reliable estimate ot tbe true score. The degree of
118 Tbe Journal of Educational Researcb
variance acros.s error components is establishetl tlirougb aG stuJy.
Viaking decisions about how error or variance migbt bereduced is filtered out by conducting a O study, Wbereits aG study allows one to pinpoint sources of measurementerror, 0 studies incorporate those data to determine tbeoptimal design. One can use tbe results of D studies todetermine the optimLim number of passages and raters thatsbcHild be use*.! to obtain a score tbat is tbe best estimate ofa student's universe score. Atthougb it may seem obvioustbat more passages or raters will produce a more reliablescore, D study results indicate whether this is tbe case, Tberesults of D studies also specify the degree ot difference asthe condition of each facet is changed. The power of anyassessment is critically diminished if teachers cannot makedependable generalizations on the basis of behavioralobservations. Knowledge ot conditions or circumstancesthat influence a teacher's ability to make generalizationsaccording to a score from an assessment is important. Oost-erhof (1996) reported that a gauge of studetit performance,in this case a set of scores from a running record, will gen-eralize only when it measures something with consistency.
Data Analysis
We used a three-way (Student x Passtige x Rater) ran-dom effects ANOVA for the G study to compute estimatesof the seven variance components. The componentsincluded student, rater, passage. Student x Rater, Student xPassage, Rater X Passage, and residua! interactions. Weconducted L) studies to consider whether we should usealternate designs to determine the optimum number ot pas-sages and raters needed to bave reliable scores. Resultingdata allow one to make absolute decisions based on tbelevel ot tbe student-observed score, without regard to tbeperformance of otbers (Sbaveison tSi Wehb, 1991). Weused the couiputer program GENOVA (Brennan, 198^) toperform the G and D studies. GENOVA is a Fortr;jn 77prograui tlesigned tor use in conducting generalizabilityanalyses with balanced (equal ii) designs.
Results
("i Study
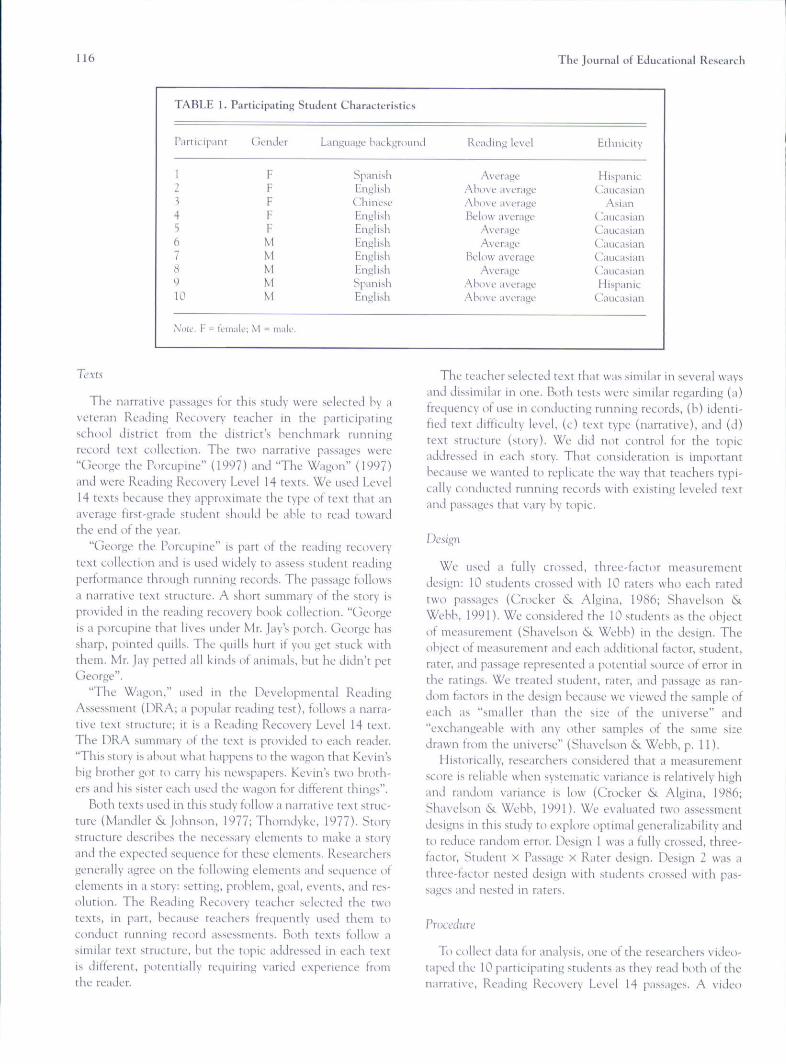
A G study answered the first research question (Thedegree tt) which passages and raters contribute to discrep-ancies in student running record scores) by identifying tbeinteractions present among readers, passages, and raters onrunning records. The magnitude of ali seven variance c<Mn-ponents is reported in Table 2, Tbree variance componentsare large relative to tbe others. The three variance compo-nents are (a) students (53.4%), (b) Student X Passageinteraction (28.0%), and (c) residual (14-5%). However,we explain tbe results of all seven variance ctnuponents.
Varialion among students' reaAing accuracy. Students' run-ning record accuracy was the object of measurement; tbus,it represented the target populatitm about whom potentialusers of running record scores intend to make inferences.We calculated the mean rating for each student by averag-ing that student's ratings across two passages and across 10raters. The resulting mean rating for each student providedan estimate ot that individual's universe or true score. Thevariance component for students provided an estimate ofhow tnuch tbe unknown universe scores varied from oneexaminee to another examinee in the population of stu-dents about whom the test user wanted to make inferences.Ideally, the value of the student mean rating variance com-ponent should be large relative to tbe other sources of vari-ability. Students' mean ratings provide an estimate of theirreiiJing ability, as assessed by similar passages and raterstliat could reasonably be considered to be comparable withthe passages and raters tbat we included in this study.
The fact that the variance component hetween studentsreported in Table 2 was so large relative tt) the other vari-ance components indicate;^ that the 10 first-grade teachersor raters could reliably detect differences in tbe readingabilities of the individual students, regardless of wbich pas-sage tbe student read or wbicb rater rated the passage. Wedid not consider the variability among students' readingaccuriJcy error variance because it was analogous to the truescore variance in classical test theory. The larger the stu-
TABLE 2. Estimated
Source ot variability
StudentRaterPassageStudent X RaterStudent X PassageRater x PassageReskiual
Total
Variance
df
981
7298
72
179
Components and Their
component
26.790,481.21036
14.030.007.29
Standard Errors
SE
14,9S0,422.300,896.330,251,20
(total variiibilityl
5.3.41.02.40.7
28.00.0
14-5
100.00
NovemberA)ecember 2006 [Vol. 100 (No. 2)] 119
vrtriiince coiupotient was iti proportion to the totalvariability in the rating's, the better. It there was no error inthe ratings, all the other variance components would havebeen zero, and the variance component tor students wouldeqtial the totitl observed \'ariance in the ratings.
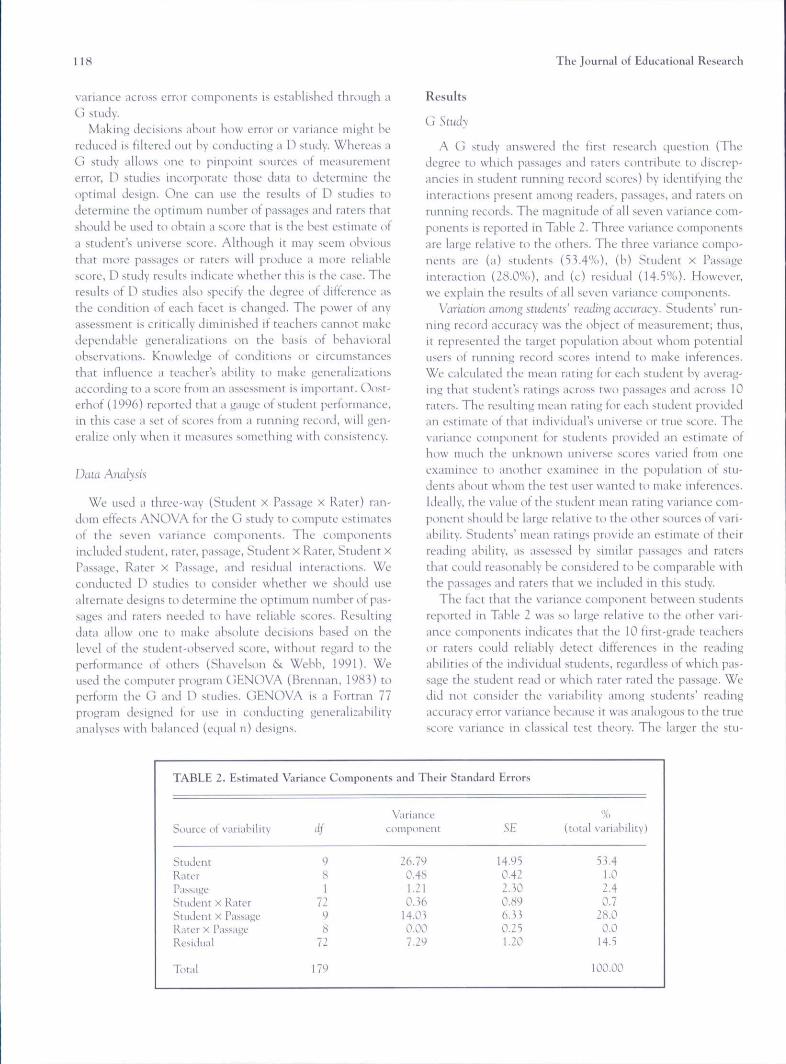
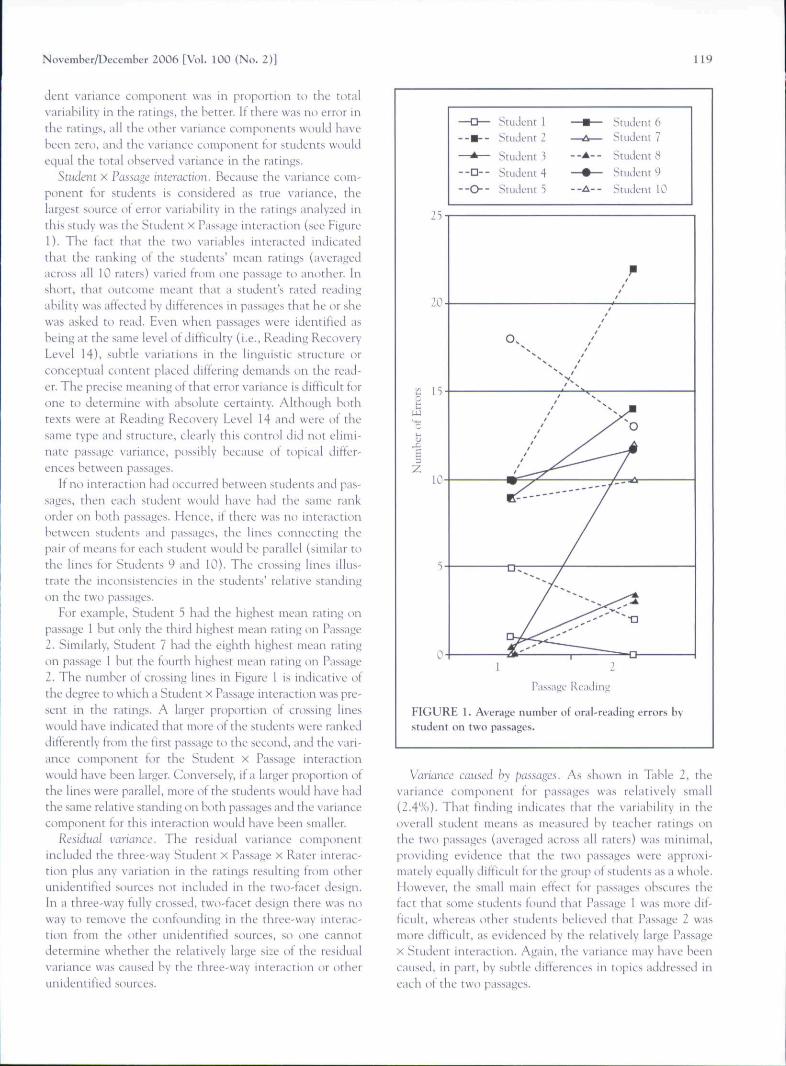
Student X Passage interaction. BecaLise rhe variance com-ponent tor students is considered as trtie variance, thelari est source ot error variability m the ratinj s analyzed inthis study was the Student x Passiif e interaction (see Fit,'ure1). The fact that the two variahles interacted indicatcJtliat the ranking of the studctits' mean ratings (averagedacross ali 10 raters) varied trom one passage to another. Inshort, that outcome meant that a student's rated readingahility was affected by differences in passages that he or shewas asked to read. Even when passages were identified asheing at the same level of diftictilty (i.e., Reading RecoveryLevel 14), subtle variations in the linguistic structLire orconceptual content placed differing demands on the read-er. The precise meaning of that error variance is difficult forone to determine with absolute certainty. Although bothtexts were at Reading Recovery Level 14 and were ot thesame type and structure, clearly this control did not elimi-nate passage variance, possihiy because of topical difter-etices between passages.
If no interaction had occurred between students and pas-sages, then each student would have had the same rankorder on both passages. Hence, if there was no interactionbetween students and passages, the lines connecting thepair of means tor each student would be parallel (similar totbe lines for Students 9 and 10), The crossing lines illus-trate the inconsistencies in the students' relative standingon the two passages.
For example. Student 5 hud the highest tnean rating onpassage 1 but only the third highest mean rating im Passage2. Similarly, Student 7 had the eighth highest mean ratingon passage 1 but the kiurth highest mean rating on Passage2. The number of crossing lines in Figure 1 is indicative ofthe degree to which a Student x Passage interaction was pre-sent in the ratings. A larger proportion ot cn)ssing lineswould have indicated that more ot the students were rankeddifferently from the first passage t< the second, and the vari-ance component tor the Student x Passage interactionwould ha\-e heen larger. Conversely, if a larger proportion otthe lines were parallel, more ot the students woukl have hat!the same relati\'e standing on both passages and the variancecomponent tor this interaction would have been smaller.
Residual variance. The residual variance componentincluded the three-way Student X Passage x Rater ititerac-tion plus any variation in the ratings resulting trom otherunidentified sources not included in the two-tacet design.In a three-way tully crossed, two-facet desigti there was tioway to remove the confounding in the three-way interac-tion from the (.ither unidentified sources, so one canncitdetermine whether the relatively large size ot the resii,hia!variance was caused by the three-way interaction or otherunidentified sources.
10
15
10-
- - • - - SlULleni 2 —^—
—*— Student ) - -A- -
- - D- - Student 4 —•—
- - O - - Student S - -A- -
/////0 '
/ ••>•
rj
SliideiilStudcnr
Student
Student
Student
67
H
9
10
Passage
FIGURE I. Average number of oral-reading errors bystudent on two passages.
Variance caused hy passages. As shown in Tahle 2, thevariance component tor passages was relatively small(2.4%)- That finding indicates that the variability in theoverall student means as measured by teacher ratings ot\the two passages (averaged across all raters) was minimal,providing evidence that the two passages were approxi-mately equally difficult for the group of students as a whole.However, the small main eftect tor passages ohscLires thetact that some sttidents toutid that Passage 1 was mi>re dif-ticult, whereas other students believed that Passage 2 wasmore difficult, as evidenced by the relatively large PassageX Student interaction. Again, the variance may have heencaLised, in part, hy subtle differences iti topics addressed ineach ot the two passages.
120 The Journal of Educiitional Researcb
Variance caused hy raters. The variance compoticnt forraters ptovided an estimate for the amount of \'ariaiMlity inthe mean ratings of the \'arioiis raters averaged across allstudents and all passages, Tahle 2 shows that the e,stimated\'ariance component tor raters accounted for less than 1%of the totLil variahility in the ratings. That titiditig ini.licatcsthat the various raters were essentially interchangeahlc inthe sense that a student being rated by only one rater wouldnot make iimch Jitterence as to which rater did the rating.All of the participatitig teachers had some experience withrunning records. In spite of that fact, the degree ot teacherexperience in using running records may have had a limit-ed impact on the teachers' accuracy when scoring students'rutming records.
Student X Rater interaction. The Student x Rater interac-tion also accounted for less than 1% of the variability Inthe ratings. The negligible size of this interaction effectindicated that the students tended to he ranked in the same()rder by the various raters. The ahsence of a large StutlentX Rater interaction Is shown in Figure 1 by the relativelysmall proportion of lines that cross each other.
Rater x Passage' interaction. The smallest variance compo-nent reported in Tahle 2 was the Rater x Passage interac-tion; the standard error tor this estimate was smaller thanfor all other standard errors in this table. The small Rater xPassage interaction indicates that raters rated students'readings of each passage consistently.
D Study
A D study is used for making decisions ahout the way toreduce or titter out error or variance. We condticted 0 stud-ies to address the two remaining research questions: (a)What number of passages and raters should one use whenadministeritig rutitiing rec<.)rds to minimize error varianceani.1 optimize the reliability of tbe resulting ratings.' (b)What effect does using a nested design, in which studentsare crossed with passage and nested in raters, bii\e on thereliability ot running record scores?
That analysis was especially important given that some\ariatice hctwecti running records was accounted tor bypassages and raters. D study restilts helped establish therunning record testing conditions that best produced a sta-ble or reliable sttident reading score. The G study resultsshow clearly that simply providing students with text of thesame le\'el, type, and structtu'e in a rtinning record dcies notsiitticietitiy eliminate error associated with passage. Also,ha\'ing one teacher conduct and interpret student runnitigrecords d<ies not elimitiate rater variance. Through the 0study, we can identify optimal rtinning record assessmentconditions for redticing passage and rater variance. ThosectMiditions ineltide using at least two raters atid three pas-sages to obtain a student running record score.
We performetl two separate O studies to address theissLies. We hased the first D study on the same fully crossed(.lesign that we used in the G study (Design 1), We coti-
ducted the second D sttidy to examine the con,sequences ofusing an alternate nested design (student,s crossed with pas-sages and nested in raters) for collecting the ratings (Design2). We used the variance component estimates from theoriginal G study as input values in hoth D stuilies. Each Dstudy produced estimated generalizahility coefficients anderror variances tor relative and absolute decisions and torvarying numbers of passages and raters,
Genaralizahility coefficients. The generalizability coeffi-cient (G coetficient) provides an estimate of the reliabilityot using the tnean rating ohtaineil by an individual student(averaged across all passages ami all raters) as a basis formaking decisiotis about how that stLident's reading abilitycotiipares with the reading ability of other students. Thegeneralizability coefficient describes the reliability of deci-sions about individual students' relative standing in agroup. Therefore, the G coefficient is the reliability esti-mate that one should use it the obtained ratings are to beemployed as a basis for making decisions about which stu-dents are better or poorer readers when compared with themean of a relevant peer group. Decisions of this kind arecalled rt falit'L' decisions in generalizahility theory.
Figure 2 shows the predicted G coefficients that wouldlikely restilt trom varying the number of passages or thenumher ot raters, or hoth, when one ohtains the ratingstrom the design requiring that each student be rated byevery rater on every passage (Design 1, tully crossed). Fig-ure 3 shows the predicted G ci)efficients that wtnild likelybe ohtained frotn using an alternate design in which eachrater is expected t<.) rate ever ' student on some passages(Design 2, nested). The ptisitive slope ot the lines in Fig-ures 2 and 3 shows the eftect of increasing the nuuiber ofpassages that each student is asked to read and the numberof raters. Figures 2 and Figure 5 reveal that increasing thenimiber ot passages increases the value of the G coefficientmore than does increasing the numher of raters, as shownin the slopes of each tigure. Asking a student to read twopassages instead of one passage increases the G coefficientmore than i,locs using four raters instead of (.me rater.
Another important finding is the similarity of the pat-terns in Figtires 2 and 3. The slopes of the tour lines andthe ditteretices in the elevation of the lines in the twographs appear to be the same. Inspectioti ot tbe nuuiericalvalties ot the reliability estimates for corresponding numberot raters arid passages in the two tigures reveal that they arenearly equi\'alent in every case, Wheti a single passage isused, the values are equivaletit to more than five decimalplaces. However, when more than two passages are used,the predicted values are nearly identical, hut they differslightly in the ,second or third decimal place. The reliabil-ity estimates for Design 2 are typically a few thousandthslarger than the corresponding estimates for Design 1 whenmore than one passage is used, but the differences are typ-ically so inconsequential that one should ignore them forall practical purpo,ses. More important is that Design 2,whicb is the more practical ilesign, produces G coefficletits

N<n ember/December 2006 tVol. 100 (No. 2)] 121
K;ner 4
R;itei- ^
0.9-
o.s
0.^ 0,5-
0.4
0,2.
O.P
Number of Passages
FIGURE 2. Projected generali:ability coefficients forDesign I.
that are equally as good or hetrer than are those obtainedfrom Design 1.
Phi coefficients. Instead of assigning meaning to the rat-ings by comparing students with one another, the ratingsobtained from running records can be used to make deci-sions about an individual student's reading ability com-pared with ,some pre-established level or cut score. AsRatiivon (2004) suggests, the cut scores for running recordsare generally separated into three categories: (a) frustrationlevel, below 89% accuracy; (b) instructional level, 90% to95%; and (c) independent level, above 95%. Such deci-sions are called absolute decisions in generalizahility theorybecause they describe a student's performance in compari-son with the cut score, with tio consideration for how theperformance of an individual compares with the perfor-mance Lif other srtidcnts. The phi coefficient is a statistic
Rater 4
1,0-
0,9-
0,8-
0,7-
I 0,4-
Q.^•
0.2.
c.\-
Number o\ Pa siige
FIGURE 3. Projected generali:ability coefficients forDesign 2.
prodticed by a D study, which presents the reliahility otabsolute decisions about individual students.
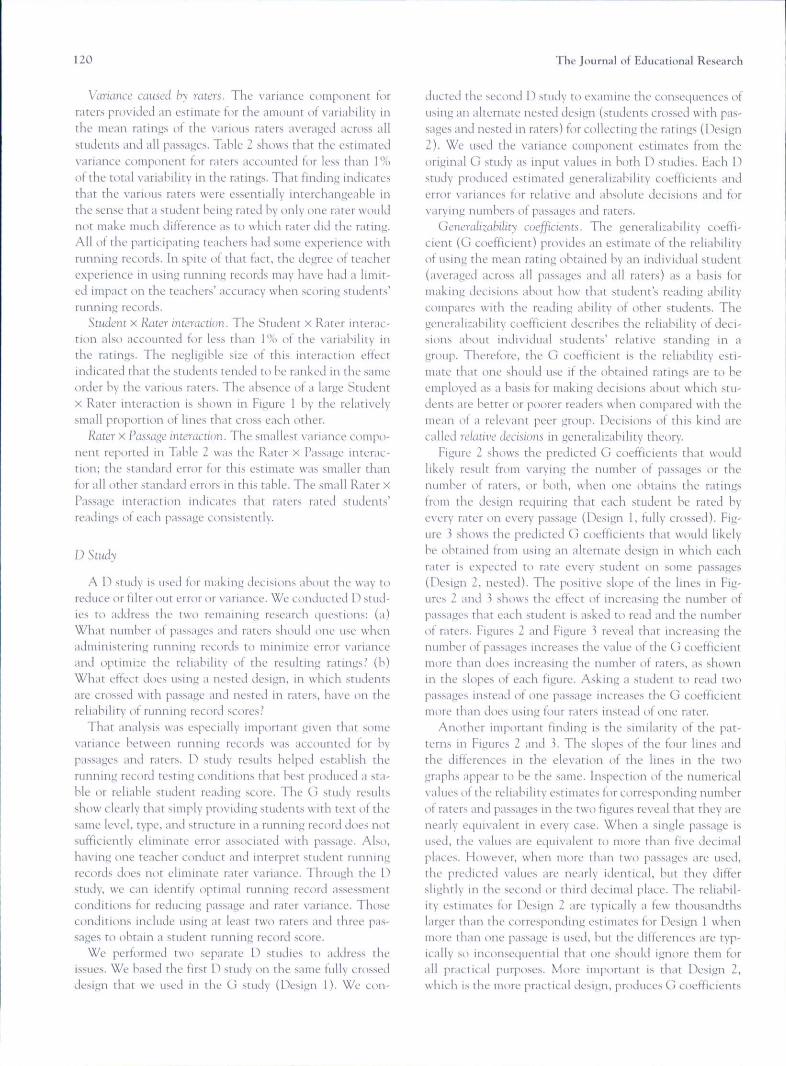
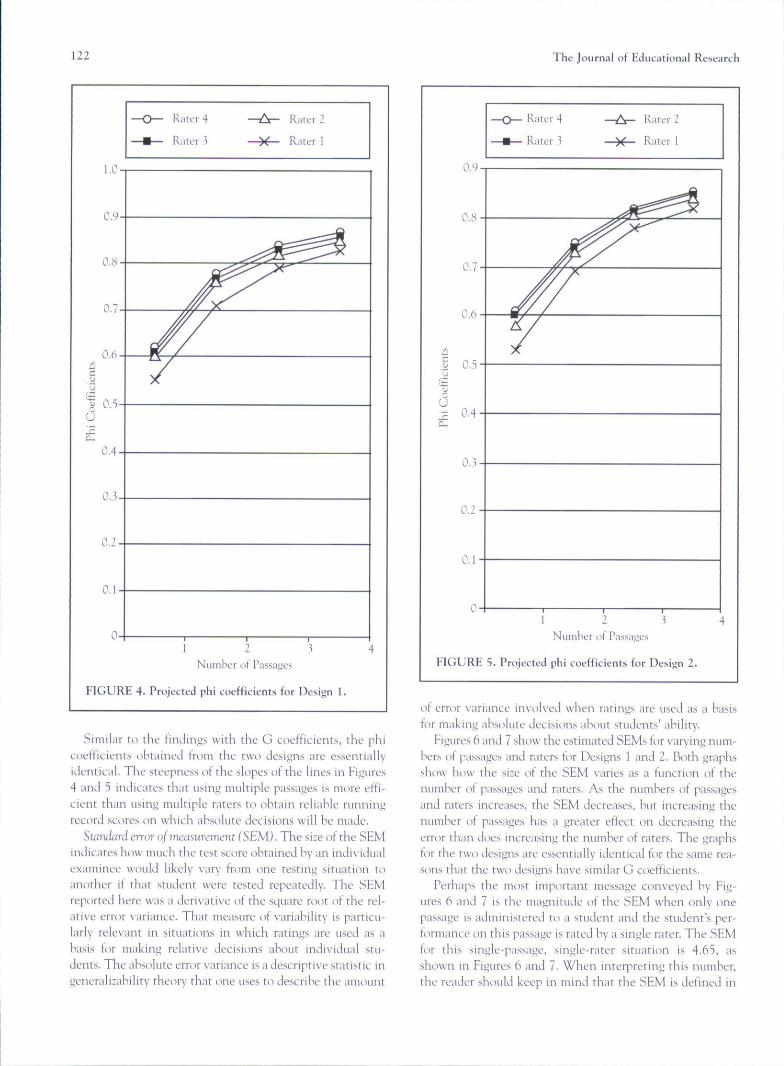
Figure 4 illustrates the predicted phi coefficients for var-ious combinations of passages and raters when the fullycrossed design is used to obtain the ratings (Design 1). Fig-ure 5 shtjws the predicted phi coefficients for various num-bers of passages and raters when the partially nested designis used where each rater rates all of the students but onlyrandomly selected passages (Design 2). The phi coefficientsin Figures 4 and 5 are smaller in every instance than thecorresponding G coefficients in Figures 2 and 3, respective-ly. One should expect that finding because the phi coetti-cient accounts for all estimated sources of error in the rat-ings, whereas the G coefficients account for only the errorsotirces that contrihute to differences in students' relativestatiding within a group.
122 The Journal of Educational Research
R.iiL-t4
Rater ">
1,0
0,9.
0-7.
y V.I-
0cZ
0,4-
0.3.
0,2
0,1
I 2 3
Numher ot Passages
FIGURE 4. Projected phi coefficients for Dt'sign 1.
Similar to the findings with the G coefficients, the phicoefficients obtained from the two designs are essentiallyidentical. The steepness of the slopes of the lines in Figures4 and 5 indicates that using tnultiple passages is more effi-cient than using multiple raters to obtain reliable runningrecord scores on which absolute decisions will be made.
Stitndard error of measurement (SEM). The size of the SEMindicates how much the test score obtained by an individualexaminee would likely vary from one testing situation toanother if that student were tested repeatedly. The SEMreported here was a derivative of the square root of the rel-ative error variance. That measure of variability is particu-larly relevant in situations in which ratings are used as abasis for making relative decisitms about individual stu-dents. The absolute error variance is a descriptive statistic ingeneralizability theory that one Lises to descrihe the amount
o,y
0.8'
0.7'
0,6 '
I 0.5'•.J
u6cZ
0.2
0.1
RatL-r 4
Rater ^
1 2 3
NiiinhtT of Passages
FIGURE S. Projected phi coefficients for Desij n 2.
ot error variance involved wheti ratings are used ijs a basisfor making absolute decisions about students' ability.
Figures 6 and 7 show the estimated SEMs for varying num-bers of passages and raters for Designs 1 and 2. Both graphsshow how the size of the SEM varies as a function of thenumbet of passages and raters. As the numhers of passagesand raters increases, the SEM decreases, but increasing rhenumber of passages has a greater effect on decreasing theerror than does increasing the number of raters. Tbe graphsfor the two designs are essentially identical for the same rea-sons that the two designs have similar G coetficients.
Perhaps the most important message conveyed by Fig-Lires 6 and 7 is the magnitude ot the SEM when only onepassage is administered to a student and the student's per-tormance on this passage is rated by a single rater. The SEMtor this single-passage, single-rater situation is 4.65, asshown in Figures 6 and 1. When interpreting this numher,the reader should keep in mind that the SEM is defined in

November/Decemhor 2006 tVol. 100 (No. 2)1 123
5,0
L3'
1.0'
0.5-
] 2 .i
NiJinht'T ot Passages
FIGURE 6. Projected standard errors of measurementfor Design 1.
terms ot the satne units of measurement as the originalscores on which it is based. In that case, the unit of tnea-surement is the numher of miscues or errors made by anindividual student as he or she reads aloud. D study resultsindicated that at least three passages rated by two raterswere necessary to make an absolute decision.
Discussion
hi education settings, teachers are expected to makeinstructional decisions regarjing their students' abilities,progress, and needs by using reliable reading assessments.Because of federal and state legislation in the last few years,the demand for reliable and valid reading progress assess-ments has increased. In cases such as with running records,where assessment processes are widely used, it is especiallyimportant to estahlish scoring reliability. Making ahsoltite
4.5
4.0' y
2.5
UJ
1 2,0.
1 2
Number (it Passa
FIGURE 7. Projected standard errors of measurementfor Design 2,
decisitms with a running record requires the teacher toaverage student scores on at least three passages with atleast two raters.
Our results indicate that the most limiting factor in ren-dering students' running record scores reliable is the numberof passages used. That finding supports the contention otRoss (2004) that passage might exhibit a sizable source oferror variance when scoring running records. Using a singlescore ohtained from reading a single passage to portray thatstudent's universe score would he highly questionable.Because the researchers controlled text variation of the pas-sages hy selecting texts of the same level, type, and structure,other between-passage differences may have contributed totext difficulty. One likely source of variation among the pas-sages was the stiiry topic or cimtent in which vocabularyserved as the proxy representation of topical differences.
124 The Journal of Educational Research
Vocahulary difficLilty catised hy topical variation could he thefactor that caused the running record scores to vary whencontrolling tor text level, type, and structure, "Wagon"wotild he considered ^ Tier I word, whereas "porcLipine"u'otild be a Tier II word (Reck & McKeown, 1985), A first-grade reader might tind a word such as porcupine more diffi-ctElt to read than wagon. A mispronunciation of porcupineCDLild likely translate to additional reading errors throughotitthe text. Also, the reader would have to know somethingahotJt the concepts of a porcupine or a wagon to accutatelyunderstand the text. The central finding oi this study is thatdespite topical \ ariation hetween passages, the use ot at leastthree pas,sages trom the same le\'el, type, and structure cannevertheless produce a stahle rtinning record score.
A careful analysis ot the data indicates that student scoresvaried considerahly trom passage to passage, directly influ-encing their relati\'e standiiig or rank order, Sttident perfor-mance on each passage was not consistent, e\'en thoughthey read two passages identified at the same level of diffi-culty. That finding seetns tti call into question the pt)pularReading Recovery or A-Z leveling ot text (Fountas & Pin-nell, 1996). Hoffman, Roser, and Salas (2001) found thatteachers using the Fountas and Pennell leveling strticturecan reliably level text. However, when texts leveled in thatmanner assess sttident reading perfotmance, they producehighly unreliable results. Running record scores that areacquired from a single-leveled text reading would not nec-essarily represent a student's true reading level.
One ot the robust findings of this study is that given thesizable weakness ot leveled passages in predicting studentreading performance on a running record, reliable resultscan occur. That effect would tequire that the sttident readat least three similarly leveled passages. Students' errorscores would then he a\'eraged, producing a reasonablyaccurate representation of the true score.
Whereas the numher of raters did not appear to accountfor much variation in the G study, the 1 study indicatedtiiat more reliable absolute decisions can be made by havingat least tw<i raters review each runnitig record session. Oost-erhof (1996) indicated that "Because the usefulness ofasse,' sments are significantly reduced if OLir observatiotis tailto generalize heyond what we ohserve, it is important to heaware ot the conditions that redtice generalirahility" {p, 45),
Ross (2004) suggested that the rater could pt.>tentialty bean additional source <.>f sizable error in running records.That is an important finding because the raters possessedvarying levels of experience with reading and runningrecords. However, all of the raters had received soute train-ing in raking running records. It we had included raterswith little training or specialized knowledge of taking run-ning records, then a different restilt might have occurred.AlthoLigh the variance components for raters and the ititer-action eftect of raters crossed with students were relativelysmall, a ditteretice existed hetween using otie, two, or threeraters in both i-lesigiiN. Improved coefficietits restilted fromincluding adtlitional raters in the model. Gi\en the practi-
cal constraints placed on teachers who may use runningrecords, we suggest that they use at least three passages inrunning record assessment to ohtain reliahle tesults. Thatseems appropriate hecause most ot the variance is account-ed tor by the passage. Given the stnall amotint ot varianceaccounted tor hy raters, teachers may chtxtse not to addailditlonal raters. In a practical context, it would seem to beeasier tor a teacher to use three passages without having toadd riiters as well.
Limitations
There is utulouhtedly some difference between perfonn-ing a rtinning record on a student sitting next to yoti andon one on television. For example, a teacher sitting next toa student during the assessment may inadvertently give ver-bal or nonverbal cues, which could either help or hinder astudent's performatice tm an assessment.
We investigated student running record scores by usingnarrative text with students who were progressing normal-ly in reading. We did not assess students with other texttypes or assess running record scores for sttidents who werestrugglitig readers. In addition, the topic of the text mayhave introduced a stutrce of variation in students' perfor-mance on running record assessments. Thus, text type,strticture, topic, and student background may influence tbereliability of a running record score.
Another lirnitation is that students tnay perform betteror worse, depending tm their relationship with the individ-ual(s) giving the test or on the way that they respond to thepre.sence of a camera. In a typical classroom setting in theregion in which we conducted the study, classroom teach-ers, rather than individuals who the students had nevermet, perfortned the running records.
One major limitation in this study was that only 10 stti-dents and 10 raters participated. Usmg a small sample sizecannot be generalized to all texts, students, and teachers.Addititinal replication of this research with a larger num-her of ratidomly selected participants and texts wouldexpand the generalizability of these findings.
Instructional Implications
Given the popularity ot runnitig records, we tentativelymade several important instructional implicatiiitis troutthis sttidy. Teachers should he very cautious when theyiletermine iiistructitinal placement of students into readinggroups with a single rutming record score. Although accu-rate scoring ot rtinning records can identify some s<:)urces otbetween- and withiti-studetit differetices, sitigle scores arenot as sensitive to between-text variations, such as level,structure, type, and topic. All ot those text characteristicscan contribute to runnitig record score variability.Betweeti-text topical differences may also contribute toinaccurate instructional group assignment for students. Forexample, a student uiay bave a good grasp of basic reading
November/December 2006 IVol. 100 (No. 2)] 125
skills, but when confronted with a text that uses a difficult
or unfamiliar vcicabulary word, a false score woulci result.
The teacher may be ititerpreting that the child struggles
with word recognition, when the reader is in fact reqtiiring
vocabulary support.
Teachers should recognize that traditional text-levelitig
procedures do not fully account for all factors that affect
the difficulty ot a text. Even when cotitroUing for text
level, type, and structure, there are still nattirally occurring
topical variations between texts that will retider one tnore
difficult than atiother. However, a teacher can acctuTimo-
date topical differences by taking running records with at
least three passages and averaging the three scores, A key
tinding is that using the average score from the three run-
ning records can produce a reliable student score. Also, stti-
dents should be carefully matched to text. Teachers should
accoutit tor the topical variatioti between texts atid etistire
that sttidents are scattolded Into the topic of texts. If limit-
e l ti'picttl knowledge is present, the teacher slmtild help
the child understand the topic ot the text. When children
are reading, their success will he strongly affected by the
material that they are reading. Teachers must be highly
involved in helping sttidents imderstand what they will
read to iticrease the likelihood that the child will be a con-
tidetit reader.
Conclusions
Our results indicate that under certain conJitiotis, ruti-
ning records can produce scores that closely approximate a
student's universe or true score. The scores generated
through the use of mnning records by teachers with vaiying
degrees of experience and expertise are reliable when at least
three passages are administered and scores are averaged.
Although there is a large difference hetween using one and
two passages versus two and three passages, the dit^erence
hetween tising three and tour passages is less suhstantial.
The tinding that students' scores may vary considerably
(.lependlng on which passage they read does not hoJe well
tor the use ot Reading Recovery or A-Z leveling strtictures
hecause text levels may be confininded by failure to C(.)nsid-
er topical ditterences that contribute to text difficulty.
Those techniques do not appear to prodtice reliable text
levels, which makes it difficult for one to predict student
reading performance.
Given the wide use of running record assessments and
the national toeus on use of reliahle assessrnent tools, our
data provide some titility. We suggest that teachers cotisii.1-
er these data when they administer running records to
iticrease the reliability of this high-utility assesstnetit tool.
REFERENCES
Bciin, R. M,, CassiJy, J., Gnimet, J. E., ShL-lton. D, S,. & W:il!i S, R,(2002), What dn reading specialists dd? Results friim ;i natinnul sutvty.The ReiuUnf" Teacher, 55. 756-744-
Reck, I. L,, & McKeown, M, G. {198S}, Tcacbiny vocabulary': Making tbein .s tnict ioi i fit t h e ffy,\\. Educational Perspectives, 2 3 , 1 1 - 1 5 ,
Brennan, R, L, (1983), hli'im-iits t)f generaiizahiiity theory. Iowa City, IA:American Collefjc Testing Pto{;ram.
Bteniian, R, L. (1W2), The context of eimtext eftects, ,A;i()l(t'ii Mamire-mem in Education. 5, 225-264,
Chapman, J. W,, Tunmer, W. E,, tk Pnichnnw, J, E, (2001). Does successin the Readinj; Recovery program depend on dt-velopint; profiticncy inphonoKi ic;il-proCL-s,sinf; skills.' A longitudinul .study in A whole inn-f uasji.' instructional context. Sciemijic Studies of Readinir, 5, 141-176,
Clay, M. M. {1%6). EmLTjjfnt reading behaviour. Unpubli,'ihod doeioml dis-sertation. University of Auckland Library, New Zealand,
Clay, M, M. (1993), An oksLTvairoji :^urvi:y nf early literacy achievement.Portsmouth, NH: Heinemann,
Crocket, 1,., & Aljjina, J, (1986), Introductiun ui classiad and modem testtheory. Orlando, EL: Holt, Rinehart and Winston.
Oonhach, L, J,, Oleser, 0 , C, Nanda, H,, iSi R:ijatatnam, N. (1972). Thedependahility of hehtiviornl measuremeiits: Tht'orv uf jicnerahzahiHty forscares and Irrofiics. New York: Wiley,
Eason, S, (1991), Why generalizabiIity theory- yield-; Ixntor re^ilt.s thanchussiijal test theory: A primer with concrete examples. In B, Thompson(Ed,), Advances in cJm'ationa/ research; Substiauive findings, methihlolof^-cal develof^wnts (pp, 85-98), Greenwich, CT: JAI,
Fountas, 1, C , kk Pinnell, G, S. (1996), Guided RWITI.I;; GOIKI first teachingfor all chiliircn. Portsmouth, NH: Heinemunn,
Freund, R. J., & Wilson, W, ], (199H). Recession analysis: Stansticai mudcl-I'njj iij a reapome vnriabk: San Oiego, t 'A: Academic Pres ,
GiTJTflL' the Porcupine. (1997), Glenvicw, IL: Scott Enresman.tiii.ssmeyet, C. B. (1999). Oral retellinf^as a measure of retidinf' cinnpreheu-
sinii; The generaii^ahility of ratings of cullej^e-ased second iayijfiitijie /L'(imer,sreading cxposimry tcvi. UnpublislK-i.i doctoral dis>ertatinn, RriyhamYounj; University, Provo, UT.
Hintze, J, M., Owen, S. V, Shapiro, E, S,, <St Daly, E, ], (2000), General-izability of oral reading,: fluency measures: Application ot G theory locurriculuin-hasL-d measurement. Schaiil Psychology Quarterly. 15, 52-68.
Hinr:e, J- M,. &. pL-titte. H, A, P, (2001), The generalizability of CBM oralreading tlucncy measures across tji-'neral and special eilufLition. Journalof P.'^ychoeducational Assessment, 19, 158-170,
Hotfman, J, V, (1991). Teacher and ^chool effects in learning to read. InR, Ban-, M, L, Kamil, P B, Mosenthal, 6J P, D. Pearson (Eds,), Handbookof reading research (Vol. 2, pp, 911-950). New York: Lonjiman,
Hoffman, ]. V. Roser, N,, ik Salas, R. (2001). Text levelinu and "littlehook,'," in tirst-gtade readinj;, hiurmd of Literacy Research, 5^.507-528,
Hiick.S. W, (2004), Reading statistics and research. Boston: Allyn& Bacon.Mandler. J. M.. St Johnson, N. S. (1977). Remembrance of thing,-; parsed:
Story ,structure and tecall, Gngiiimv Psychology, 9. 111-151.Matsumura, L. C , Patthey-Chave:. G, ti., Valdes, R,, Si GarnKT. H.
(2002), Teacher feedhaclc, writing assignment quality, and third-jjradestudents' revision in lower- and hij;ber.-achieving utban schools. Ele-mentary School Journal. (03. 3-26.
Nation, K., & Snowling, M. (1998), Individual difference,s in contextual{acilitatiiin: Evidence ttom dyslexia and poor reading comptehension.Child Development, 69, 996-1011.
Oosterhof. A. (1996), l.\'ivl<ipir\g a^id using classroimi assessments. Hngle-w.iod Cliffs. NJ: Merrill,
Pressley. M., Wharton-McDonald, R.. Allington, R., Block. C. C , Mor-row, L,, Tracey, D., ei al. (2001). A study ot effective titst-jirade liti racyinstruction. Scientific Studies of Raiding, 5{ 1), 35—58,
Rathvon. N, R, (2004), Early retJiJinn ii.s,s£,s.smi'nt: A (iraciiiiiitiLT's handbook.New York: Guilford.
Reynolds. C, R, (1990), Conceptual and technical pri>blems in learningdisability diagnosis. In C. R. Reynolds & R, W, Kamphaus (Eds.). Hand-htidli of psychoiof^cal and educatimuil asse.^sment of children: Intelligence andiu.-/iiL't'(.'inL'nt (pp, 571-592), New York: Guiltord Press,
Ross. J, A, (2004), Ettecrs ot running records assessment on early literacyachievement. The jourrial of Educaiimud Research, 97. 186-194,
Share, D, L., &, Stanovich, K, H, (1995). Cojjnitive ptocesses in early read-ing development: Accommodating individual differences into a uiodelof acquisition, l.s.sHCs m HtijMratiim, 1. 1-57,
Shavelson. R, J,, & Webh. N, M, (1991), Cenerali^ubility theory: A primer.Newhury Park, CA: Sage,
Snow, C. E., Bums. M. S.. & Griffin, P, (1998), Preventing reading difficul-ties in young children. Washington, V>C.: Naiionj] Academy Press,
Taylor. B. M,, Pearson, P D,, Clark, K,, & Walpole. S, (2000), Effectiveschool and acctimplished teachers: Lessons about primary-gnide reading
126 The Journal of Educational Research
instructiun in low-income schools ,SL')IIH)( jnurnal, 1 0 1 ,
121-166,Taylor. R. M.. Pearson. P, 11, Peterson. 0. S,, & Rodri,t:ue:. M. C, (2005),
The CIERA school change framewurk: An evidence-hiised ;ipproach toprofessional development and school reading iniproveuient, ReadingResearch Quarterly. 40( I). 40-69,
ThornJyke, P, W, (1977), t'ognitive structures in cimprehension andmemory ot narrative discourse. Cognrtk'L' Psychola^. 9, 77-110,
Trauh, R, E., & Rowley, G. L, (1991), Understanding reliability. Educa-tional Measurement: hsui:s and Practice. 10, i7-45,
Tunmer, W, E,. & H itiver, W, A. (1992), Cognitive and linguistic tuctorsin learning to read. In P, B, Gough, L, G, Ehri. iSt R, Treiman (Eds,),
ijKf.'iiiKm (pp, 175-214). HiUsd ile, N]: Erlb;ium.The Wagon. (1997), Glenview, IL: Scott Foresman.Wharton-McDonald. R., Pressley, M,, Rankin, J., Mistrett:i, J,. Yokoi, L.,
(& Etienherger, S. (1997). Effective primary-grades literiicy instrtjction- balanced literacy instruction. The Reading Teacher. 50, 518-521,
Wolfersherger. M, E.. ReuCiel. 0, R.. Sudweeb. R., & Fawson. P, G.(2004). Developing and validating the classroom literacy environmen-tal prafite (GLEP): A tool fot examining the "print richness" ot earlychildhood and elementary classrooms, Jour}\al of Literacy Research.36(1)83-144.
Wray, D., Medwell, J., Fox, R-, l i Poulson. L, (2000), The teaching prac-tices ot effective teachers of litetacy. Educations! Rei'itu', 52(0, 75-84.
How is this publication thinking about the future?
By becomingpart of the past. This publication is available from ProQuestInformation and Learning in one or more of the following ways:
• Online, via the ProQuest" information service
• Microforn:i. CD-ROM
• Via database licensing
UMlMicroform S Print CtiadwyckHealey
XanEduCurriculum Products
For more information, call
I-8OO-521-O6OO, ext. 2888 (US) or 01-734-761-4700 (International)
www.il.proquest.com
From:Pro(^uest