Embed Size (px)
Citation preview
Journal of Leadership Education DOI: 10.12806/V16/I2/R7 APR 2017 RESEARCH
109
Examining the relationship between leader-member exchange
(LMX) and objective performance within higher education:
An exploratory empirical study
Tim O. Peterson, Ph.D.
Professor of Management North Dakota State University
Shontarius D. Aikens, Ph.D.
Assistant Professor of Management Concordia College
Abstract
While the common suggestion in leader-member exchange (LMX) research is that there
is a strong relationship between LMX and performance, a closer look at these studies reveal that
the performance measures in the majority of studies are primarily subjective in nature such as
performance reviews. Relatively few studies examine the LMX-objective performance (OP)
relationship. The findings from those studies are not consistent subjective performance studies.
While most LMX studies are conducted in a work environment, this paper adds to the literature
by examining this in a higher education. The findings indicated a significantly positive
regression coefficient between Professional Respect and midterm grades. Based on the results,
the authors introduce the idea of the “peer leader effect” and discussed the development of peer
leaders.
Introduction
For the past number of years, leader-member exchange (LMX) research has examined its
relationship with a variety of organizational phenomenon. One of the key findings from past
researchers is its positive relationship with important leadership and organizational outcomes
such as employee satisfaction (Ozer, 2008; Stringer, 2006; Wikaningrum, 2007), employee
turnover and absenteeism (Burns & Otte, 1999), employee commitment (Basu & Green, 1997),
and organizational citizenship behaviors (Hui, Law, & Chen, 1999; Kent & Chelladurai, 2001;
Wayne, Shore, & Liden, 1997). The overall effect of a positive supervisor-subordinate
relationship results in an overall positive effect to organizational outcomes (Harris, Harris, &
Eplion, 2007).
A key relationship under frequent study is between LMX and job performance. Typical
LMX-performance relationship studies (Howell & Hall-Merenda, 1999; Ouyang, 2009;
Schriesheim, Neider, & Scandura, 1998) indicate that when a positive LMX exists between
superior and subordinate, the correlation between LMX and performance is significant and
positive.
Journal of Leadership Education DOI: 10.12806/V16/I2/R7 APR 2017 RESEARCH
110
A closer look at research studies examining the relationship between LMX and
performance reveals a subtle and possible overlooked dynamic. While individual performance
can be measured both subjectively (SP) and objectively (OP) (Adler, Thomas, & Castro, 2005;
Borman & Motowidlo, 1997; Hoffman, Nathan, & Holden, 1991), the majority of the LMX
research has essentially examined the relationship between LMX and subjective performance
(SP) which is typically measured through a rating scale of performance that is often called a
performance review or appraisal. While some studies incorporate elements of subjective and
objective performance in their studies (Howell & Hall-Merenda, 1999; Kraimer, Wayne, &
Jaworski, 2001; Vecchio, 1998), very few studies examine the relationship solely between LMX
and objective performance (OP) which is based on observable results that are relevant to the
desired organizational outcomes (Hoffman et al., 1991). In those relatively rare studies that
examine the LMX-OP relationship, the findings of a positive and significant relationship are not
as consistent with the studies examining the LMX-SP relationship. It has been suggested that
future studies examining the relationship between LMX and performance should utilize objective
measures of performance rather than subjective measures of performance (Taris, 2006). The
purpose of this manuscript is to examine more closely the LMX-OP relationship thus adding to
that stream of research.
Theoretical Foundation and Hypotheses
Leader-Member Exchange. LMX leadership theory examines the individual
relationship between the leader and the follower. It can be traced back to its foundations in role
theory and social exchange theory (Liden, Wayne, & Stilwell, 1993). The concept of dyads can
be found in the vertical dyad linkage theory in 1978-1983, in which the main thought or concept
was that relationships between the leader and each follower are unique (House & Aditya, 1997).
Between 1984-1989, the focus shifted from just recognizing different relationships between a
leader and the follower, but also examining the quality of those relationships (House & Aditya,
1997). In addition, research began to examine the relationship between LMX and other
constructs within the organization (Graen & Uhl-Bien, 1995). The essential premise is that there
is a positive relationship between LMX and a variety of organizational objectives.
LMX can be measured using different instruments. The most common instruments are
the LMX-7 (Graen & Uhl-Bien, 1995) which measures LMX on three dimensions (respect, trust,
and obligation) and the LMX-MDM (Liden & Maslyn, 1998) which measures LMX on four
dimensions (affect, loyalty, contribution, and professional respect). The LMX-7 is more suited
for examining LMX in work related environment according to Graen & Uhl-Bien (1995).
Measures of Performance. While performance can be measured in aggregate at the
organizational level, when considered in the framework of LMX, the shift focuses to
performance at the individual level as individual performance is a sub-component of
organizational performance. Performance can be classified as either subjective or objective
(Adler et al., 2005; Borman & Motowidlo, 1997; Hoffman et al., 1991). These two forms of
measurement are considered distinct and independent categories of job performance (Motowidlo
& Van Scotter, 1994). When measuring objective performance, specific criteria should be used
(Hoffman et al., 1991; Wang, Law, & Chen, 2008).
Journal of Leadership Education DOI: 10.12806/V16/I2/R7 APR 2017 RESEARCH
111
Research examining the LMX-OP relationship. While there is a substantial amount of
literature which utilizes a subjective measure of performance (i.e. performance ratings), very few
research studies utilize an objective measure of performance. Gerstner and Day’s (1997) meta-
analysis found significant positive correlations between LMX and objective performance, but
also indicating that the relationships were stronger when examining LMX and subjective
performance. Howell and Hall-Merenda’s (1999) study included both subjective and objective
components in the performance variable, which resulted in the inability to distinguish a
significant relationship between LMX and the objective performance component. Tanner and
Castleberry (1990) study combined both subjective and objective measures of performance.
However, before the actual study was conducted, a preliminary analysis was conducted which
examined LMX in relationship to subjective and objective performance separately. The
preliminary findings indicated a marginally significant relationship between LMX and the
objective performance measure (Tanner & Castleberry, 1990).
Given that very few articles examining a pure LMX-OP relationship could be found and
that the LMX-OP articles have conflicting results, one can conclude that the research examining
the LMX-OP relationship is still in its infancy. Given that most existing LMX research has been
conducted in traditional working environments (Ugrin, Odom, and Pearson, 2008), LMX
research as a whole should be expanded into other contexts. One example of a context in which
LMX has possible applicability and relevance is higher education.
Hypotheses. It is assumed that the study of the LMX-OP relationship is applicable and
relevant within higher education. This assumption is based on two factors. One, the
fundamental premise of LMX theory are prevalent within higher education. A dyad is one of the
foundational components of LMX theory. Interpersonal relationships consist of the quality of
the relationship, whether high or low is the foundation of a leader-follower dyad (Deluga, 1994).
This type of dyad exists in higher education in a number of forms one of which is teacher-student
dyad. The teacher-student dyad has been conceptualized as an interpersonal relationship
(Docan-Morgan, 2009). As in a work setting, a higher education environment dyad (teacher-
student) contains a difference in power in which the teacher has more power than the student
(Anderson & Shore, 2008; Biaggio, 2001; Richardson, 1999) especially since the teacher gives
the student a grade. There have been previous studies in which the teacher-student relationship
has been conceptualized in the context of LMX and used to examine the quality of teacher-
student relationships (Ugrin et al., 2008; Vaughn & Baker, 2008).
Second, the nature of the educational context allows for a purer examination of the
relationship dyad and minimizing the potential effect of power between a supervisor and a
subordinate. In a traditional work setting relationship (employer-employee), the managerial
power of that relationship can have an influence on performance above and beyond the high or
low quality of the relationship. However, in an educational setting, it is completely different in
that “subordinates are differentiated not by job title, but by talent, attitude, and personality”
(Bess & Goldman, 2001, p. 440). This helps us to distinguish between a work environment and
an educational environment. In a traditional teacher-student relationship, though not a traditional
working relationship, there is a still a big power difference albeit less than in a work
environment.
Journal of Leadership Education DOI: 10.12806/V16/I2/R7 APR 2017 RESEARCH
112
In an educational setting, other dyad types can form. For example, student to student
dyads form such as tutoring relationships or peer to peer relationships where one peer assists the
other peer in navigating this new learning environment called college. In a peer-to-peer dyad,
the power difference is lower than that of a teacher-student dyad. In fact, in a peer-to-peer dyad,
the power difference is very small if not nonexistent. Thus, the exchange is mostly based on the
relationship quality, whether high or low. This would allow us to really examine the relationship
component without any possible influences, visible or not, that could be the result of power
differences.
Thus, when considering the LMX-OP relationship within the context of higher education,
one must take into consideration that performance measures in higher education differ from
those in a traditional work environment. Within higher education, the common performance
measure for students is grade point average. The grade point average is a commonly used
measure in academic contexts to measure independent performance (Daniels et al., 2009; Hegler,
2004; Robbins, Oh, Le, & Button, 2009).
For this study, the dyad relationship is a peer-to-peer relationship, where one student is
acting as a peer leader to another student to assist them in the socialization process of college.
Given the fact that LMX has an effect on individual performance (subjectively) but not so clear
cut objectively, and since this is being tested in a new environment, the following hypotheses
were developed:
H1: There will be a statistically significant and positive correlation between peer
leaders-student LMX and a student’s midterm GPA.
H2: There will be a statistically significant and positive correlation between peer
leaders-student LMX and a student’s term GPA.
Assuming either of these hypotheses are confirmed the next step in this research will be to
consider the impact of LMX on midterm GPA and term GPA. This lead to the following two
hypotheses:
H3: There will be a statistically significant LMX regression coefficient to midterm GPA.
H4: There will be a statistically significant LMX regression coefficient to term GPA.
Again assuming either of these hypotheses are confirmed the next step in this research will be to
consider the impact of LMX on midterm GPA and term GPA after controlling for other
dependent variables that have been shown in earlier research to have a statistically significant
regression coefficient on academic performance measured by GPA. This lead to the following
two hypotheses:
H5: After controlling for past research, there will be a statistically significant LMX
regression coefficient to midterm GPA.
H6: After controlling for past research, there will be a statistically significant LMX
regression coefficient to term GPA.
Research Method
Population. The population is comprised of freshmen business students at a southwest
higher education institution as part of learning community. In this particular context, the
freshmen business students have a peer leader assigned who has successfully navigated the first
semester in college. Students are classified as first year, first semester freshman business majors
Journal of Leadership Education DOI: 10.12806/V16/I2/R7 APR 2017 RESEARCH
113
who were enrolled in an academic credit bearing course as part of a freshman business learning
community. Peer leaders are defined as business major students who mentored the first year,
first semester freshman business majors that have been assigned to them for the semester in the
learning community.
Constructs. LMX: The LMX construct was measured using a modified LMX-MDM
scale (Liden & Maslyn, 1998). The questions were adapted based on the educational
environment and the population of peer leaders and freshmen business students. For example, in
the original LMX-MDM survey, supervisor was replaced with the words peer leader and
superior was replaced with instructor. A completed copy of the modified LMX-MDM survey is
located in Table 1.
Journal of Leadership Education DOI: 10.12806/V16/I2/R7 APR 2017 RESEARCH
114
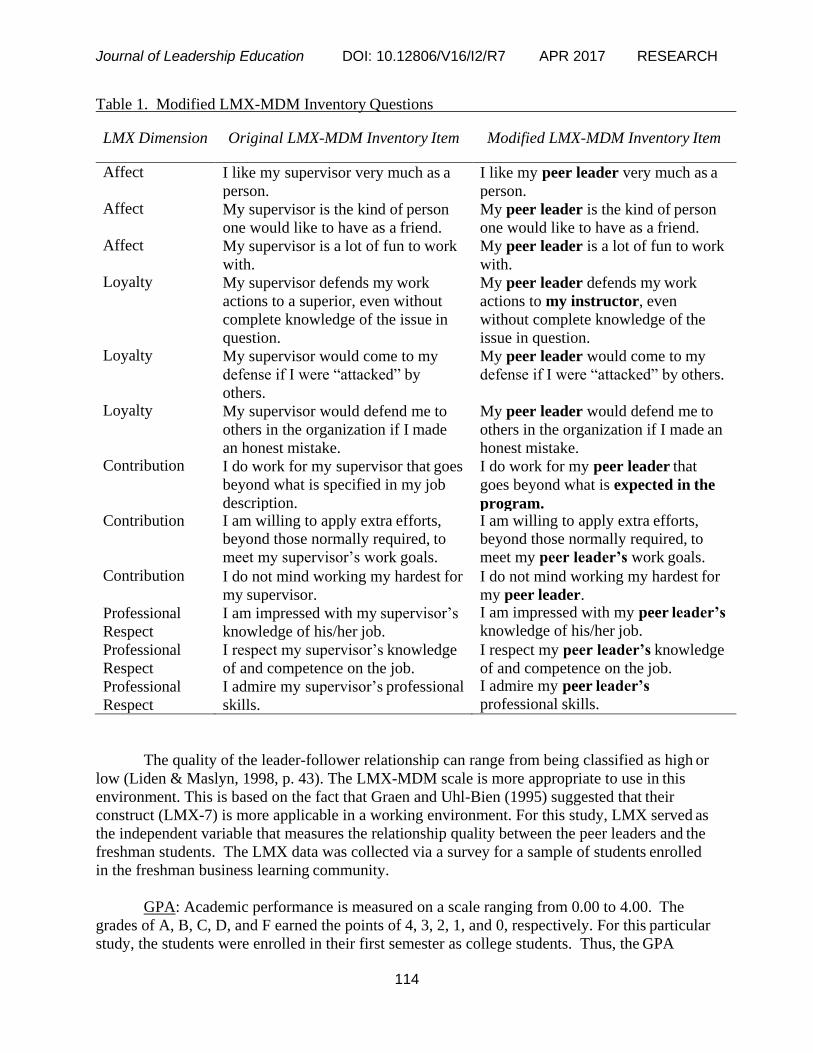
Table 1. Modified LMX-MDM Inventory Questions
LMX Dimension Original LMX-MDM Inventory Item Modified LMX-MDM Inventory Item
Affect I like my supervisor very much as a
person.
I like my peer leader very much as a
person. Affect My supervisor is the kind of person
one would like to have as a friend.
My peer leader is the kind of person
one would like to have as a friend. Affect My supervisor is a lot of fun to work
with.
My peer leader is a lot of fun to work
with. Loyalty My supervisor defends my work
actions to a superior, even without
complete knowledge of the issue in
question.
My peer leader defends my work
actions to my instructor, even
without complete knowledge of the
issue in question. Loyalty My supervisor would come to my
defense if I were “attacked” by
others.
My peer leader would come to my
defense if I were “attacked” by others.
Loyalty My supervisor would defend me to
others in the organization if I made
an honest mistake.
My peer leader would defend me to
others in the organization if I made an
honest mistake. Contribution I do work for my supervisor that goes
beyond what is specified in my job
description.
I do work for my peer leader that
goes beyond what is expected in the
program. Contribution I am willing to apply extra efforts,
beyond those normally required, to
meet my supervisor’s work goals.
I am willing to apply extra efforts,
beyond those normally required, to
meet my peer leader’s work goals.
Contribution I do not mind working my hardest for
my supervisor.
I do not mind working my hardest for
my peer leader.
Professional
Respect
I am impressed with my supervisor’s
knowledge of his/her job.
I am impressed with my peer leader’s
knowledge of his/her job.
Professional
Respect
I respect my supervisor’s knowledge
of and competence on the job.
I respect my peer leader’s knowledge
of and competence on the job.
Professional
Respect
I admire my supervisor’s professional
skills.
I admire my peer leader’s
professional skills.
The quality of the leader-follower relationship can range from being classified as high or
low (Liden & Maslyn, 1998, p. 43). The LMX-MDM scale is more appropriate to use in this
environment. This is based on the fact that Graen and Uhl-Bien (1995) suggested that their
construct (LMX-7) is more applicable in a working environment. For this study, LMX served as
the independent variable that measures the relationship quality between the peer leaders and the
freshman students. The LMX data was collected via a survey for a sample of students enrolled
in the freshman business learning community.
GPA: Academic performance is measured on a scale ranging from 0.00 to 4.00. The
grades of A, B, C, D, and F earned the points of 4, 3, 2, 1, and 0, respectively. For this particular
study, the students were enrolled in their first semester as college students. Thus, the GPA
Journal of Leadership Education DOI: 10.12806/V16/I2/R7 APR 2017 RESEARCH
115
variable was captured at Midterm (middle of October) and at the end of the term (December).
For this study, Midterm and Term GPA served as a dependent variable. The GPA variable data
was collected from institutional records at the conclusion of the semester.
Data Analysis. To test the hypotheses, the following methods were followed. First since
the LMX instrument was adapted a confirmatory factor analysis was conducted. Next, a t-test
was performed to determine if there were any significant differences between the participant
sample and the total study population. Third, correlations were run to determine the associations
between the LMX and OP variables. Assuming confirmation of a significant and positive
relationship between LMX and the objective performance measures, linear regression models
were performed to establish a base line. Previous research indicates that higher task performance
could be the result of cognitive ability for the individual (Arvey & Murphy, 1998; Borman &
Motowidlo, 1997; Motowidlo, Borman, & Schmit, 1997). In addition, other items related to
demographics can have an unintended effect on performance outcomes (Stassen, 2003). Thus, to
limit any possible effect that cognitive ability or demographics might play, and to limit the study
to a pure LMX-OP relationship analysis, college entrance exam scores (ACT) and gender were
controlled for in the step-wise regressions. Significance at the .10 significance level was pre-
determined to be used to either reject or to accept the hypotheses for this exploratory study.
Results
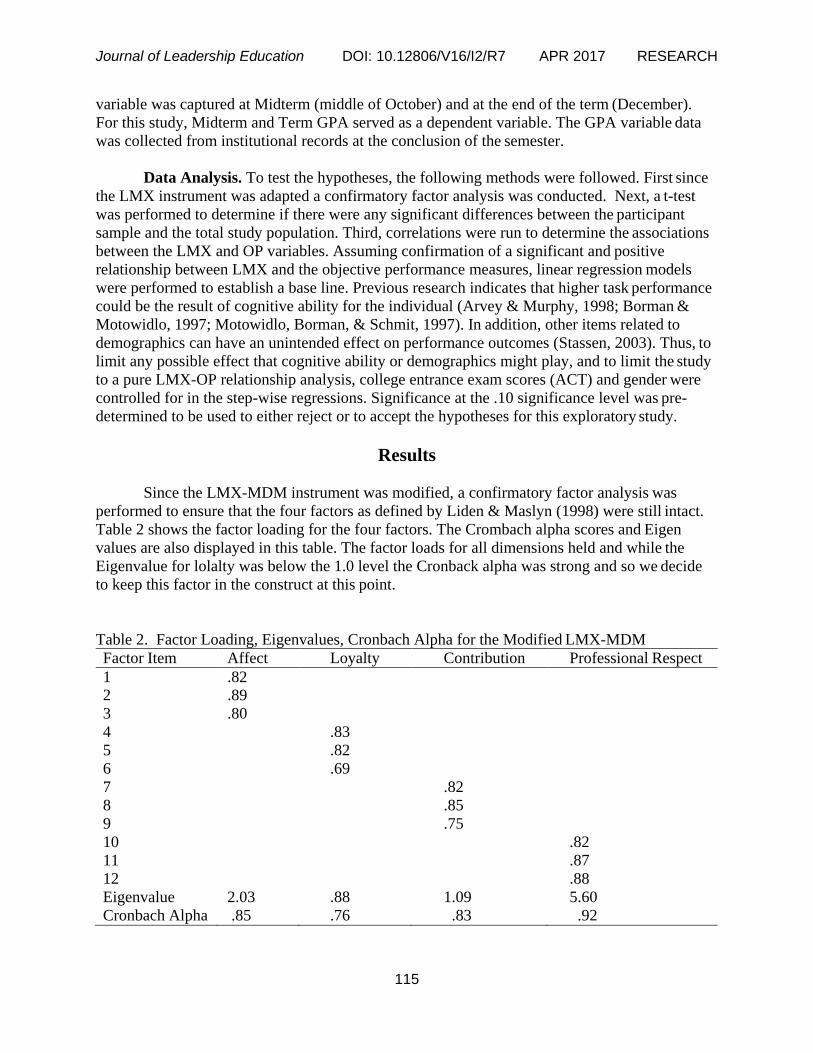
Since the LMX-MDM instrument was modified, a confirmatory factor analysis was
performed to ensure that the four factors as defined by Liden & Maslyn (1998) were still intact.
Table 2 shows the factor loading for the four factors. The Crombach alpha scores and Eigen
values are also displayed in this table. The factor loads for all dimensions held and while the
Eigenvalue for lolalty was below the 1.0 level the Cronback alpha was strong and so we decide
to keep this factor in the construct at this point.
Table 2. Factor Loading, Eigenvalues, Cronbach Alpha for the Modified LMX-MDM
Factor Item Affect Loyalty Contribution Professional Respect
1 .82
2 .89
3 .80
4 .83
5 .82
6 .69
7 .82
8 .85
9 .75
10 .82
11 .87
12 .88
Eigenvalue 2.03 .88 1.09 5.60
Cronbach Alpha .85 .76 .83 .92
Journal of Leadership Education DOI: 10.12806/V16/I2/R7 APR 2017 RESEARCH
116
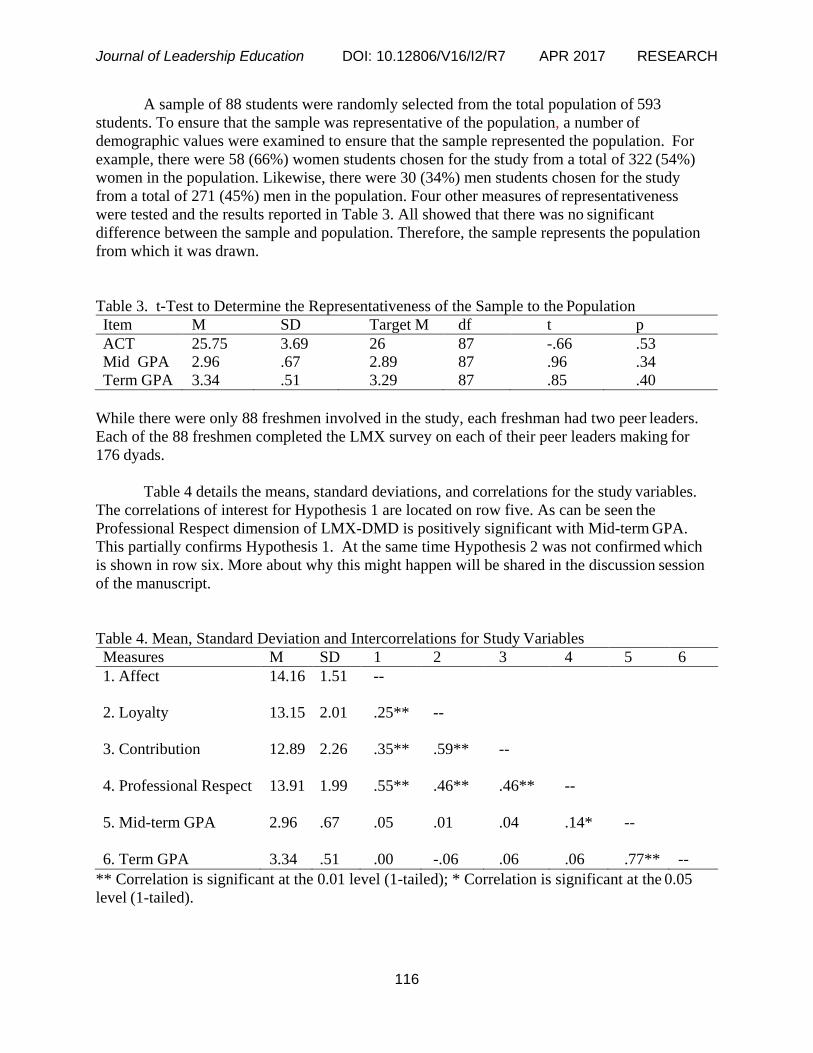
A sample of 88 students were randomly selected from the total population of 593
students. To ensure that the sample was representative of the population, a number of
demographic values were examined to ensure that the sample represented the population. For
example, there were 58 (66%) women students chosen for the study from a total of 322 (54%)
women in the population. Likewise, there were 30 (34%) men students chosen for the study
from a total of 271 (45%) men in the population. Four other measures of representativeness
were tested and the results reported in Table 3. All showed that there was no significant
difference between the sample and population. Therefore, the sample represents the population
from which it was drawn.
Table 3. t-Test to Determine the Representativeness of the Sample to the Population
Item M SD Target M df t p
ACT 25.75 3.69 26 87 -.66 .53 Mid GPA 2.96 .67 2.89 87 .96 .34
Term GPA 3.34 .51 3.29 87 .85 .40
While there were only 88 freshmen involved in the study, each freshman had two peer leaders.
Each of the 88 freshmen completed the LMX survey on each of their peer leaders making for
176 dyads.
Table 4 details the means, standard deviations, and correlations for the study variables.
The correlations of interest for Hypothesis 1 are located on row five. As can be seen the
Professional Respect dimension of LMX-DMD is positively significant with Mid-term GPA.
This partially confirms Hypothesis 1. At the same time Hypothesis 2 was not confirmed which
is shown in row six. More about why this might happen will be shared in the discussion session
of the manuscript.
Table 4. Mean, Standard Deviation and Intercorrelations for Study Variables
Measures M SD 1 2 3 4 5 6
1. Affect 14.16 1.51 --
2. Loyalty 13.15 2.01 .25** --
3. Contribution 12.89 2.26 .35** .59** --
4. Professional Respect 13.91 1.99 .55** .46** .46** --
5. Mid-term GPA 2.96 .67 .05 .01 .04 .14* --
6. Term GPA 3.34 .51 .00 -.06 .06 .06 .77** --
** Correlation is significant at the 0.01 level (1-tailed); * Correlation is significant at the 0.05
level (1-tailed).
Journal of Leadership Education DOI: 10.12806/V16/I2/R7 APR 2017 RESEARCH
117
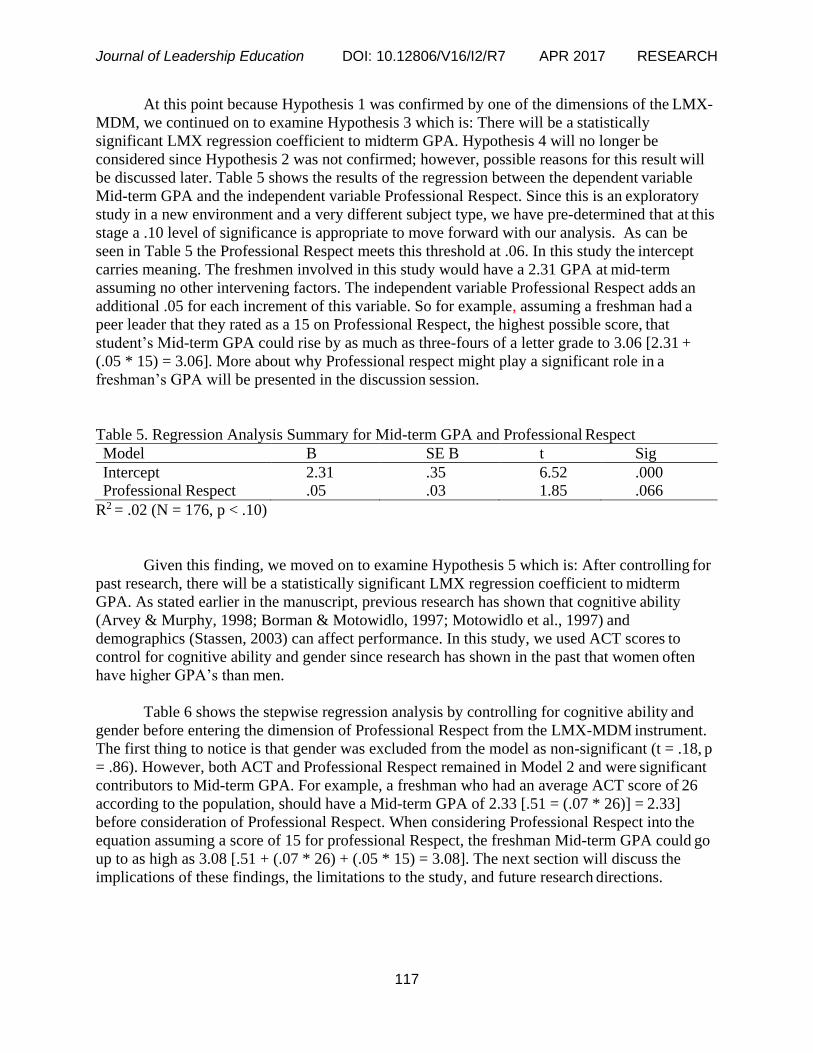
At this point because Hypothesis 1 was confirmed by one of the dimensions of the LMX-
MDM, we continued on to examine Hypothesis 3 which is: There will be a statistically
significant LMX regression coefficient to midterm GPA. Hypothesis 4 will no longer be
considered since Hypothesis 2 was not confirmed; however, possible reasons for this result will
be discussed later. Table 5 shows the results of the regression between the dependent variable
Mid-term GPA and the independent variable Professional Respect. Since this is an exploratory
study in a new environment and a very different subject type, we have pre-determined that at this
stage a .10 level of significance is appropriate to move forward with our analysis. As can be
seen in Table 5 the Professional Respect meets this threshold at .06. In this study the intercept
carries meaning. The freshmen involved in this study would have a 2.31 GPA at mid-term
assuming no other intervening factors. The independent variable Professional Respect adds an
additional .05 for each increment of this variable. So for example, assuming a freshman had a
peer leader that they rated as a 15 on Professional Respect, the highest possible score, that
student’s Mid-term GPA could rise by as much as three-fours of a letter grade to 3.06 [2.31 +
(.05 * 15) = 3.06]. More about why Professional respect might play a significant role in a
freshman’s GPA will be presented in the discussion session.
Table 5. Regression Analysis Summary for Mid-term GPA and Professional Respect
Model B SE B t Sig
Intercept 2.31 .35 6.52 .000 Professional Respect .05 .03 1.85 .066
R2 = .02 (N = 176, p < .10)
Given this finding, we moved on to examine Hypothesis 5 which is: After controlling for
past research, there will be a statistically significant LMX regression coefficient to midterm
GPA. As stated earlier in the manuscript, previous research has shown that cognitive ability
(Arvey & Murphy, 1998; Borman & Motowidlo, 1997; Motowidlo et al., 1997) and
demographics (Stassen, 2003) can affect performance. In this study, we used ACT scores to
control for cognitive ability and gender since research has shown in the past that women often
have higher GPA’s than men.
Table 6 shows the stepwise regression analysis by controlling for cognitive ability and
gender before entering the dimension of Professional Respect from the LMX-MDM instrument.
The first thing to notice is that gender was excluded from the model as non-significant (t = .18, p
= .86). However, both ACT and Professional Respect remained in Model 2 and were significant
contributors to Mid-term GPA. For example, a freshman who had an average ACT score of 26
according to the population, should have a Mid-term GPA of 2.33 [.51 = (.07 * 26)] = 2.33]
before consideration of Professional Respect. When considering Professional Respect into the
equation assuming a score of 15 for professional Respect, the freshman Mid-term GPA could go
up to as high as 3.08 [.51 + (.07 * 26) + (.05 * 15) = 3.08]. The next section will discuss the
implications of these findings, the limitations to the study, and future research directions.
Journal of Leadership Education DOI: 10.12806/V16/I2/R7 APR 2017 RESEARCH
118
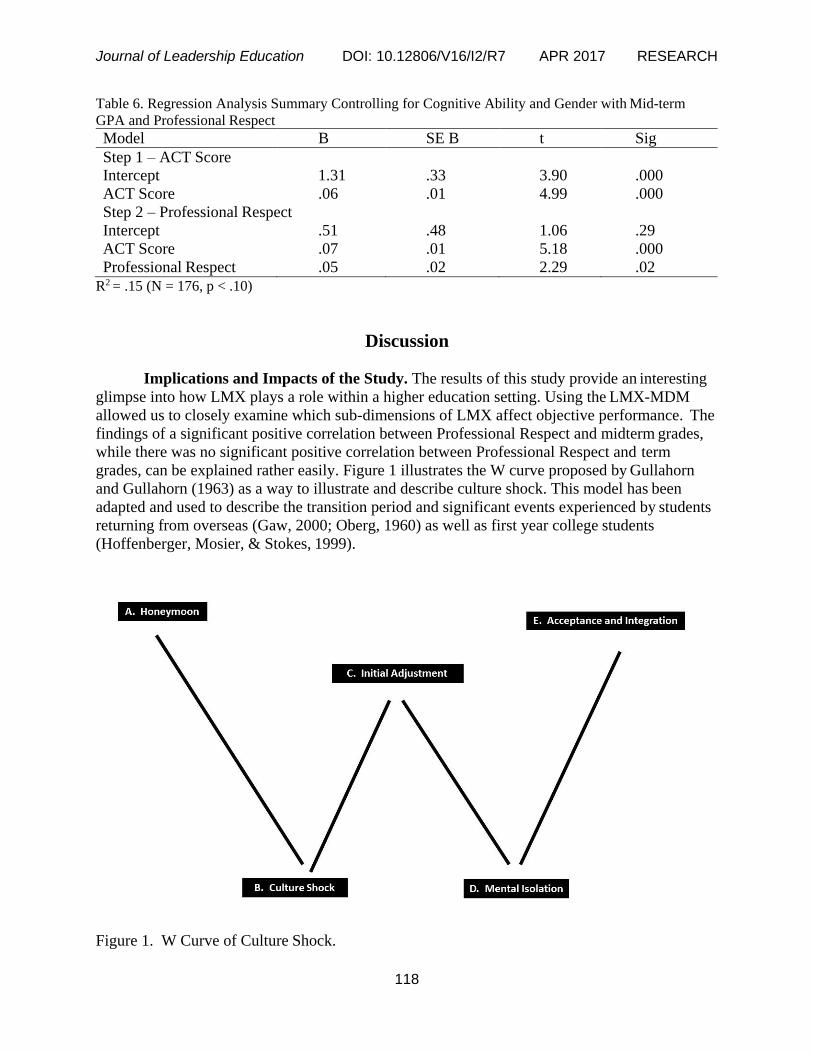
Table 6. Regression Analysis Summary Controlling for Cognitive Ability and Gender with Mid-term
GPA and Professional Respect
Model B SE B t Sig
Step 1 – ACT Score Intercept 1.31 .33 3.90 .000
ACT Score .06 .01 4.99 .000
Step 2 – Professional Respect
Intercept .51 .48 1.06 .29
ACT Score .07 .01 5.18 .000
Professional Respect .05 .02 2.29 .02
R2 = .15 (N = 176, p < .10)
Discussion
Implications and Impacts of the Study. The results of this study provide an interesting
glimpse into how LMX plays a role within a higher education setting. Using the LMX-MDM
allowed us to closely examine which sub-dimensions of LMX affect objective performance. The
findings of a significant positive correlation between Professional Respect and midterm grades,
while there was no significant positive correlation between Professional Respect and term
grades, can be explained rather easily. Figure 1 illustrates the W curve proposed by Gullahorn
and Gullahorn (1963) as a way to illustrate and describe culture shock. This model has been
adapted and used to describe the transition period and significant events experienced by students
returning from overseas (Gaw, 2000; Oberg, 1960) as well as first year college students
(Hoffenberger, Mosier, & Stokes, 1999).
Figure 1. W Curve of Culture Shock.
Journal of Leadership Education DOI: 10.12806/V16/I2/R7 APR 2017 RESEARCH
119
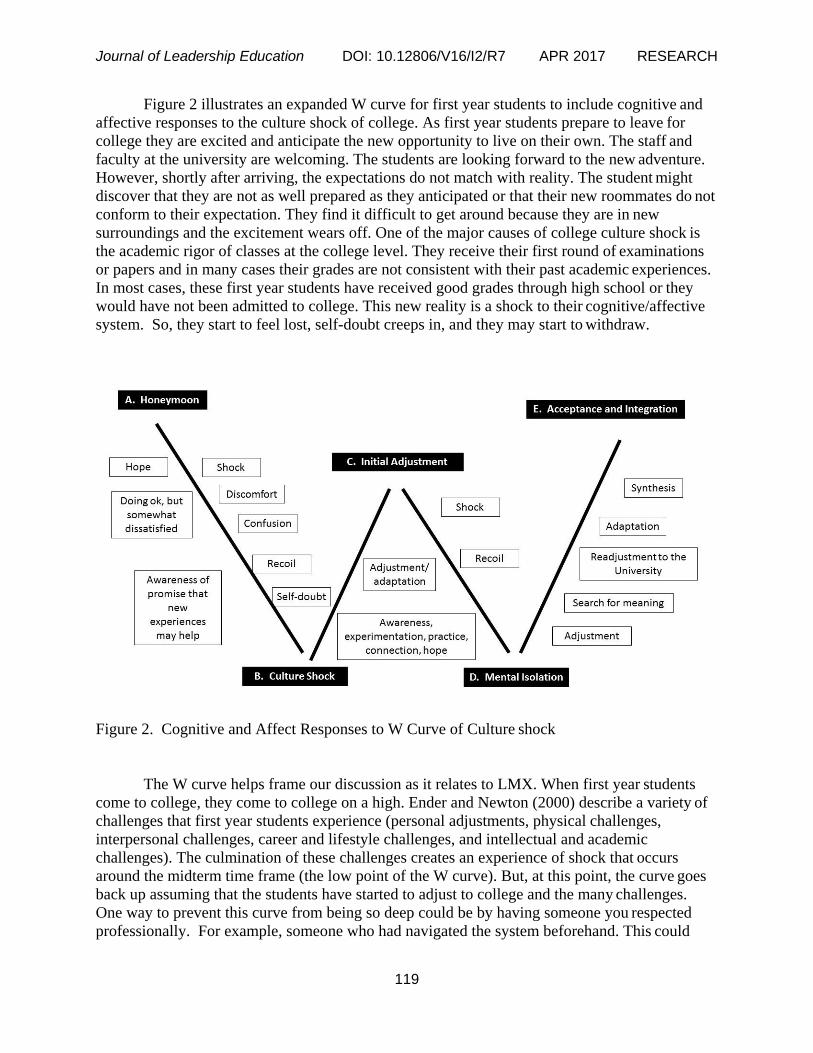
Figure 2 illustrates an expanded W curve for first year students to include cognitive and
affective responses to the culture shock of college. As first year students prepare to leave for
college they are excited and anticipate the new opportunity to live on their own. The staff and
faculty at the university are welcoming. The students are looking forward to the new adventure.
However, shortly after arriving, the expectations do not match with reality. The student might
discover that they are not as well prepared as they anticipated or that their new roommates do not
conform to their expectation. They find it difficult to get around because they are in new
surroundings and the excitement wears off. One of the major causes of college culture shock is
the academic rigor of classes at the college level. They receive their first round of examinations
or papers and in many cases their grades are not consistent with their past academic experiences.
In most cases, these first year students have received good grades through high school or they
would have not been admitted to college. This new reality is a shock to their cognitive/affective
system. So, they start to feel lost, self-doubt creeps in, and they may start to withdraw.
Figure 2. Cognitive and Affect Responses to W Curve of Culture shock
The W curve helps frame our discussion as it relates to LMX. When first year students
come to college, they come to college on a high. Ender and Newton (2000) describe a variety of
challenges that first year students experience (personal adjustments, physical challenges,
interpersonal challenges, career and lifestyle challenges, and intellectual and academic
challenges). The culmination of these challenges creates an experience of shock that occurs
around the midterm time frame (the low point of the W curve). But, at this point, the curve goes
back up assuming that the students have started to adjust to college and the many challenges.
One way to prevent this curve from being so deep could be by having someone you respected
professionally. For example, someone who had navigated the system beforehand. This could
Journal of Leadership Education DOI: 10.12806/V16/I2/R7 APR 2017 RESEARCH
120
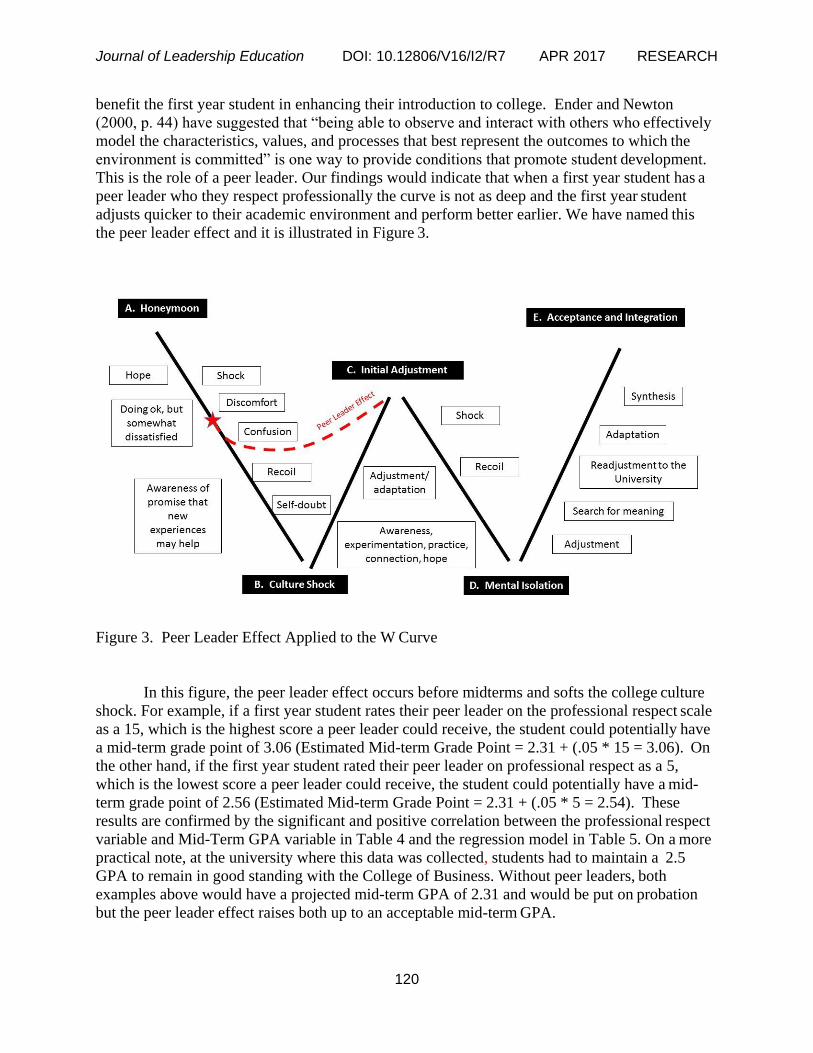
benefit the first year student in enhancing their introduction to college. Ender and Newton
(2000, p. 44) have suggested that “being able to observe and interact with others who effectively
model the characteristics, values, and processes that best represent the outcomes to which the
environment is committed” is one way to provide conditions that promote student development.
This is the role of a peer leader. Our findings would indicate that when a first year student has a
peer leader who they respect professionally the curve is not as deep and the first year student
adjusts quicker to their academic environment and perform better earlier. We have named this
the peer leader effect and it is illustrated in Figure 3.
Figure 3. Peer Leader Effect Applied to the W Curve
In this figure, the peer leader effect occurs before midterms and softs the college culture
shock. For example, if a first year student rates their peer leader on the professional respect scale
as a 15, which is the highest score a peer leader could receive, the student could potentially have
a mid-term grade point of 3.06 (Estimated Mid-term Grade Point = 2.31 + (.05 * 15 = 3.06). On
the other hand, if the first year student rated their peer leader on professional respect as a 5,
which is the lowest score a peer leader could receive, the student could potentially have a mid-
term grade point of 2.56 (Estimated Mid-term Grade Point = 2.31 + (.05 * 5 = 2.54). These
results are confirmed by the significant and positive correlation between the professional respect
variable and Mid-Term GPA variable in Table 4 and the regression model in Table 5. On a more
practical note, at the university where this data was collected, students had to maintain a 2.5
GPA to remain in good standing with the College of Business. Without peer leaders, both
examples above would have a projected mid-term GPA of 2.31 and would be put on probation
but the peer leader effect raises both up to an acceptable mid-term GPA.
Journal of Leadership Education DOI: 10.12806/V16/I2/R7 APR 2017 RESEARCH
121
However, the peer leader effect seems to wear off around mid-term and so we see no
significant positive correlation or significant coefficient for term GPA.
Framing this in LMX terms, several implications can be made. First, the basis for
Professional Respect having a significant effect on mid-term GPA is that first year students
should perceive peer leaders as having expert power. In the leadership and management
literature, French and Raven (1960) define expert power as power based on one’s expertise or
specialized knowledge not possessed by others within the organization. Some examples of
behavior associated with expert power consist of the peer leaders understanding the expectations
of the professors, knowing how to access resources on campus, or knowing how to register for
classes after the first semester. These behaviors and characteristics are in direct alignment with
the Professional Respect construct, thus indicating congruence between these two
dimensions/constructs. The general expectations of Professional Respect apply in this setting as
well. First year students look up to peer leaders who have successfully navigated the first year of
college.
Second, the Professional Respect dimension encompasses leadership behaviors found by
previous researchers that are needed to be successful. Effective leadership occurs when a) the
relationship between the leader and the follower is based on credibility (Kouzes & Posner, 2003)
and b) a leader exhibits five leadership practices or behaviors: model the way, inspire a shared
vision, challenge the process, enable others to act, and encourage the heart (Kouzes & Posner,
2012). As applied in this situation, the Professional Respect dimension measures the credibility
piece of the leader-follower dyad. Once that is established, the most applicable leadership
practice is modeling the way. If a peer leader successfully provides an example of what to do
and what not to do for first year students over the first part of a semester, then eventually the
effectiveness goes away by the end of the semester. Or, another way of presenting it is that the
peer leaders serve as a form of scaffolding for the first year student.
While the results are clear in why Professional Respect is significant, it is important to
discuss implications or reasons why the other LMX dimensions were not deemed to be
significant. The overall implication is that the remaining dimensions (affect, contribution, and
loyalty) are not applicable within this setting and in the peer leader-student dyads. The Affect
dimension is defined as “the mutual affection members of the dyad have for each other based
primarily on interpersonal attraction, rather than work or professional values” (Liden & Maslyn,
1998, p. 50). Peer leaders are trained and are constantly reminded that they are not supposed to
be friends with their first year students. In fact, they are to treat this position just as if it was a
job or work. This could explain why Affect was not significantly correlated with the
performance measures. The Contribution dimension is defined as “perception of the current
level of work-oriented activity each member puts forth toward the mutual goals explicitly or
implicitly of the dyad” (Liden & Maslyn, 1998, p. 50). In this context, first year students are not
working for the peer leaders, but in actuality are working for themselves. This could explain
why Contribution was not significantly correlated with the performance measures. The Loyalty
dimension is defined as “the expression of public support for the goals and the personal character
of the other member of the LMX dyad” (Liden & Maslyn, 1998, p. 50). It should be noted that
the findings of this study suggest a somewhat negative correlation between Loyalty and
performance ( i.e. term GPA) which is the only negative correlations found in the study. Peer
Journal of Leadership Education DOI: 10.12806/V16/I2/R7 APR 2017 RESEARCH
122
leaders who try to extract loyalty from their first year students actually harm the relationship by
making the first year students too dependent on them. This is not the purpose of a peer leader. A
peer leader is there to cushion the college cultural shock and to assist the first year student in
making that adjustment.
Third, the finding provides implications regarding the effectiveness timeline of peer
leaders. Another way of phrasing this is the law of diminishing returns. Table 4 indicates that
all correlations, except for one (Contribution), decrease between point A (midterm) and point B
(end of term). This supports the fact that peer leaders and what they can offer in terms of a LMX
framework decreases after midterms. This is supported with the incline on the W’curve from
midterm to end of the term. If Professional Respect is so critical to the relationship between peer
leaders and first year students and the cushioning of the college cultural shock what type of
development needs to occur for peer leaders before the new students arrive?
Development of Peer Leaders’ Expertise (Professional Respect) One of the critical
events that must occur is that the instructor must make it clear to the first year students that the
peer leaders have successfully navigated the college system and are knowledgeable on how to be
successful. This cannot be over emphasized. First year students are looking for ways to
successfully navigate the system. These new students often look to the instructor for guidance.
By emphasizing the expertise of the peer leaders, the instructor provides the peer leaders with
credibility.
Ender and Newton (2000) is an excellent resource for developing peer leaders’ expertise.
It has excellent chapters on academic success (Chapter 8), campus resources (Chapter 9) and
general good academic practices (Chapter10). This material is important to provide content but
not sufficient in developing the peer leader. Peer leaders must develop a more comprehensive
understanding of how people learn and develop over time. Ender and Newton point out that all
human growth and development occurs as a result of pressure from the environment. So entering
college puts pressure on the first year students to learn and develop. It is critical to get the peer
leaders to understand that their responsibilities are to mentor, coach, and guide the first year
student. Conversely, it is not their responsibility to shelter, to do the work for the first year
student, or to prevent the first year students from facing the challenges of college life.
It is important that peer leaders become familiar with the types of challenges that first
year students experience. Do not assume that your peer leaders have experienced all or even
some of these challenges. Quite often peer leaders found the navigation of the first year easy.
So they need to be introduced to the challenges that the average first year student might
experience. Chickering and Reisser (1993) identified seven development areas that are very
common for the first year student. They are: 1) developing a sense of personal competence, 2)
managing emotions effectively, 3) learning to think and act on one’s own, 4) formulating a
personal self-concept, 5) building interpersonal relationships, 6) envisioning a sense of purpose,
and 7) defining core values and beliefs from which to make personal choices.
These seven developmental areas run headlong into the challenges facing first year
students. Such as living with a roommate who is ethnically different, how to speak up in class in
order to demonstrate engagement, learning to deal with stressful situations on one’s own, being
Journal of Leadership Education DOI: 10.12806/V16/I2/R7 APR 2017 RESEARCH
123
able to assert one’s self around issue of alcohol and drug consumption, and choosing an
academic major and future career path. Peer leaders must understand again their role is to
mentor, coach, guide in these issues not direct, tell, or mandate and answer.
Limitations and Future Directions. Several limitations to this study should be
mentioned. First, we were only permitted to take a sample of the population. This was due to
our direct involvement in the program. Second, the sample only comes from one southwestern
institution. In the future, we would like to collect a larger sample. In addition, we would like to
collect data from other instructions that have peer leadership programs. Finally, it is speculated
that the significant positive p-value of .066 would go down with in the normal rigorous level of
.05 assuming a larger sample. Again this is a critical reason to repeat the student with a larger
sample.
Conclusions
The above study was an attempt to examine the LMX and performance dynamic from an
objective performance standpoint. As mentioned earlier, the majority of previous research
examines the LMX-performance relationship mostly from a subjective performance perspective.
By examining it in a different context and from a LMX-objective performance perspective, our
hope is to open up a new stream of research and to expand the findings outside of the traditional
work environment.
As educational institutions consider having peer to peer structures, it is important for
them to have an exceptional instructional method for developing the peer leaders so they are seen
as having expert power which established credibility within the peer leaders and leads to
professional respect. While peer leaders can add to objective performance measures (GPA),
what is most significant is the expert knowledge perceived by the first year students that leads
the peer leader effect that softens the college cultural shock.
Journal of Leadership Education DOI: 10.12806/V16/I2/R7 APR 2017 RESEARCH
124
References
Adler, A. B., Thomas, J. L., & Castro, C. A. (2005). Measuring up: Comparing self-reports with
unit records for assessing soldier performance. Military Psychology, 17(1), 3-24. doi:
10.1207/s15327876mp1701_2
Anderson, D. D., & Shore, W. J. (2008). Ethical issues and concerns associated with mentoring
undergraduate students. Ethics & Behavior, 18(1), 1-25. doi:
10.1080/10508420701519577
Arvey, R. D., & Murphy, K. R. (1998). Performance evaluation in work settings. Annual Review
of Psychology, 49, 141-168. doi: 10.1146/annurev.psych.49.1.141
Basu, R., & Green, S. G. (1997). Leader-member exchange and transformational leadership: An
empirical examination of innovative behaviors in leader-member dyads. Journal of
Applied Social Psychology, 27(6), 477-499. doi: 10.1111/j.1559-1816.1997.tb00643.x
Bess, J. L., & Goldman, P. (2001). Leadership ambiguity in universities and K-12 schools and
the limits of contemporary leadership theory. The Leadership Quarterly, 12(4), 419-450.
doi: 10.1016/s1048-9843(01)00090-x
Biaggio, M. (2001). Navigating roles in mentoring relationships with graduate students.
Retrieved from ERIC database. (ED457516)
Borman, W. C., & Motowidlo, S. J. (1997). Task performance and contextual performance: The
meaning for personnel selection research. Human Performance, 10(2), 99-109. doi:
10.1207/s15327043hup1002_3
Burns, J. Z., & Otte, F. L. (1999). Implications of leader-member exchange theory and research
for human resource development research. Human Resource Development Quarterly,
10(3), 225-248. doi: 10.1002/hrdq.3920100304
Chickering, A.W. & Reisser, L. (1993). Education and identity. San Francisco, CA: Jossey-Bass.
Daniels, L. M., Stupnisky, R. H., Pekrun, R., Haynes, T. L., Perry, R. P., & Newall, N. E. (2009).
A longitudinal analysis of achievement goals: From affective antecedents to emotional
effects and achievement outcomes. Journal of Educational Psychology, 101(4), 948-
963. doi: 10.1037/a0016096
Deluga, R. J. (1994). Supervisor trust building, leader-member exchange and organizational
citizenship behaviour. Journal of Occupational & Organizational Psychology, 67(4),
315-326. doi: 10.1111/j.2044-8325.1994.tb00570.x
Docan-Morgan, T. (2009). A typology of relational turning point events in college teacher-
student relationships. Journal of the Scholarship of Teaching and Learning, 9(2), 82-97.
Ender, S. C., & Newton, F. B. (2000). Students helping students: A guide for peer educators on
College Campuses. San Francisco, CA: Jossey-Bass.
Journal of Leadership Education DOI: 10.12806/V16/I2/R7 APR 2017 RESEARCH
125
French, J. R. P., & Raven, B. (1960). The bases of social power. In D. Cartwright & A. Zander
(Eds.), Group dynamics: Research and theory (2nd ed., pp. 607-623). Evanston, Illinois:
Row, Peterson and Company.
Gaw, K. F. (2000). Reverse culture shock in students returning from overseas. International
Journal of Intercultural Relations, 24(1), 83-104.
Gerstner, C. R., & Day, D. V. (1997). Meta-analytic review of leader-member exchange theory:
Correlates and construct issues. Journal of Applied Psychology, 82(6), 827-844. doi:
10.1037/0021-9010.82.6.827
Graen, G. B., & Uhl-Bien, M. (1995). Relationship-based approach to leadership: Development
of leader-member exchange (LMX) theory of leadership over 25 years: Applying a multi-
level multi-domain perspective. The Leadership Quarterly, 6(2), 219-247. doi:
10.1016/1048-9843(95)90036-5
Gullahorn, J. T., & Gullahorn, J. E. (1963). An Extension of the U-Curve Hypothesis. Journal of
Social Issues, 19(3), 33-47. doi: 10.1111/j.1540-4560.1963.tb00447.x
Harris, K. J., Harris, R. B., & Eplion, D. M. (2007). Personality, leader-member exchanges, and
work outcomes. Journal of Behavioral & Applied Management, 8(2), 92-107.
Hegler, K. L. (2004). Assessing learning communities. Assessment Update, 16(6), 1-8.
Hoffenberger, K., Mosier, R., & Stokes, B. (1999). Transition experience. In J. H. Schuh (Ed.),
Educational programming and student learning in college and university residence halls:
ACUHO-I.
Hoffman, C. C., Nathan, B. R., & Holden, L. M. (1991). A comparison of validation criteria:
Objective versus subjective performance measures and self-versus supervisor ratings.
Personnel Psychology, 44(3), 601-619.
House, R. J., & Aditya, R. N. (1997). The social scientific study of leadership: Quo vadis?
Journal of Management, 23(3), 409-473. doi: 10.1177/014920639702300306
Howell, J. M., & Hall-Merenda, K. E. (1999). The ties that bind: The impact of leader-member
exchange, transformational and transactional leadership, and distance on predicting
follower performance. Journal of Applied Psychology, 84(5), 680-694. doi:
{10.1037/0021-9010.84.5.680
Hui, C., Law, K. S., & Chen, Z. X. (1999). A structural equation model of the effects of negative
affectivity, leader-member exchange, and perceived job mobility on in-role and extra-role
performance: A Chinese case. Organizational Behavior and Human Decision Processes,
77(1), 3-21. doi: 10.1006/obhd.1998.2812
Kent, A., & Chelladurai, P. (2001). Perceived transformational leadership, organizational
commitment, and citizenship behavior: A case study in intercollegiate athletics. Journal
of Sport Management, 15(2), 135. doi: 10.1123/jsm.15.2.135
Journal of Leadership Education DOI: 10.12806/V16/I2/R7 APR 2017 RESEARCH
126
Kouzes, J. M., & Posner, B. Z. (2003). Credibility: How leaders gain and lose it, why people
demand it. San Francisco, CA: Jossey-Bass.
Kouzes, J. M., & Posner, B. Z. (2012). The leadership challenge: How to make extraordinary
things happen in organizations (5th ed.). San Francisco, CA: Jossey-Bass.
Kraimer, M. L., Wayne, S. J., & Jaworski, R. A. (2001). Sources of support and expatriate
performance: The mediating role of expatriate adjustment. Personnel Psychology, 54(1),
71-99. doi: 10.1111/j.1744-6570.2001.tb00086.x
Liden, R. C., & Maslyn, J. M. (1998). Multidimensionality of leader-member exchange: An
empirical assessment through scale development. Journal of Management, 24(1), 43-72.
doi: 10.1177/014920639802400105
Liden, R. C., Wayne, S. J., & Stilwell, D. (1993). A longitudinal study on the early development
of leader-member exchanges. Journal of Applied Psychology, 78(4), 662-674. doi:
10.1037/0021-9010.78.4.662
Motowidlo, S. J., Borman, W. C., & Schmit, M. J. (1997). A theory of individual differences in
task and contextual performance. Human Performance, 10(2), 71-83. doi:
10.1207/s15327043hup1002_1
Motowidlo, S. J., & Van Scotter, J. R. (1994). Evidence that task performance should be
distinguished from contextual performance. Journal of Applied Psychology, 79(4), 475-
480. doi: 10.1037/0021-9010.79.4.475
Oberg, K. (1960). Culture shock adjustment to new cultural environments. Practical
Anthropology, 7, 177-182.
Ouyang, Y. (2009). An investigation of the effects of leader member exchange on job
performance in Taiwan. Business Renaissance Quarterly, 4(3), 109-127.
Ozer, M. (2008). Personal and task-related moderators of leader-member exchange among
software developers. Journal of Applied Psychology, 93(5), 1174-1182. doi:
10.1037/0021-9010.93.5.1174
Richardson, S. M. (1999). Civility, leadership, and the classroom. New Directions for Teaching
& Learning, 77, 77-86. doi: 10.1002/tl.7708
Robbins, S. B., Oh, I.-S., Le, H., & Button, C. (2009). Intervention effects on college
performance and retention as mediated by motivational, emotional, and social control
factors: Integrated meta-analytic path analyses. Journal of Applied Psychology, 94(5),
1163-1184. doi: 10.1037/a0015738
Journal of Leadership Education DOI: 10.12806/V16/I2/R7 APR 2017 RESEARCH
127
Schriesheim, C. A., Neider, L. L., & Scandura, T. A. (1998). Delegation and leader-member
exchange: Main effects, moderators, and measurement issues. Academy of
Management Journal, 41(3), 298-318. doi: 10.2307/256909
Stassen, M. L. A. (2003). Student outcomes: The impact of varying living-learning community
models. Research in Higher Education, 44(5), 581-613. doi: 0.1023/a:1025495309569
Stringer, L. (2006). The link between the quality of the supervisor-employee relationship and the
level of the employee's job satisfaction. Public Organization Review, 6(2), 125-142. doi:
10.1007/s11115-006-0005-0
Tanner, J. F., Jr., & Castleberry, S. B. (1990). Vertical exchange quality and performance:
Studying the role of the sales manager. Journal of Personal Selling & Sales Management,
10(2), 17-27.
Taris, T. W. (2006). Is there a relationship between burnout and objective performance? A
critical review of 16 studies. Work & Stress, 20(4), 316-334.
doi:10.1080/02678370601065893
Ugrin, J. C., Odom, M. D., & Pearson, J. M. (2008). Exploring the importance of mentoring for
new scholars: A social exchange perspective. Journal of Information Systems Education,
19(3), 343-350.
University of Wisconsin Superior. (2016). The W-Curve Hypothesis Model. Retrieved from
https://www.uwsuper.edu/fye/parents/upload/W-Curve.pdf
Vaughn, L. M., & Baker, R. C. (2008). Do different pairings of teaching styles and learning
styles make a difference? Preceptor and resident perceptions. Teaching & Learning in
Medicine, 20(3), 239-247. doi: 10.1080/10401330802199559
Vecchio, R. P. (1998). Leader-member exchange, objective performance, employment duration,
and supervisor ratings: Testing for moderation and mediation. Journal of Business &
Psychology, 12(3), 327-341. doi: 10.1023/a:1025027514081
Wang, H., Law, K. S., & Chen, Z. X. (2008). Leader-member exchange, employee performance,
and work outcomes: An empirical study in the Chinese context. International Journal of
Human Resource Management, 19(10), 1809-1824. doi: 10.1080/09585190802323926
Wayne, S. J., Shore, L. M., & Liden, R. C. (1997). Perceived organizational support and leader-
member exchange: A social exchange perspective. Academy of Management Journal,
40(1), 82-111. doi:10.2307/257021
Wikaningrum, T. (2007). Coworker exchange, leader-member exchange, and work attitudes.
Gadjah Mada International Journal of Business, 9(2), 187-215.
Journal of Leadership Education DOI: 10.12806/V16/I2/R7 APR 2017 RESEARCH
128
Author Biographies
Tim O. Peterson is Professor of Management in the College of Business at North Dakota
State University. He teaches classes in the vital competencies needed to be a good
organizational citizen. Prior to starting his academic career, Tim served for 25 years in the U.S.
Air Force. Email is [email protected].
Shontarius D. Aikens is Assistant Professor of Management in the Offutt School of
Business at Concordia College in Moorhead, Minnesota. He teaches undergraduate courses in
leadership, organizational behavior, and entrepreneurship. Prior to Concordia College, he was
the AACSB Accreditation Manager at North Dakota State University. Email is