Embed Size (px)
Citation preview

Examining the impact of Media Content, Emotions, and
Mental Imagery Visualization on Pre-Trip Place Attachment
by
Daniel Plunkett
A Dissertation Presented in Partial Fulfillment
of the Requirements for the Degree
Doctor of Philosophy
Approved November 2013 by the
Graduate Supervisory Committee:
Megha Budruk, Co-Chair
Woojin Lee, Co-Chair
Jameson Wetmore
Greg Wise
ARIZONA STATE UNIVERSITY
December 2013

i
ABSTRACT
Numerous studies have examined the attachments individuals have to the places
they visit, and that those attachments are formed through experiencing a place in person.
This study is unique in that it examines pre-trip place attachment formation via the use of
mobile technology and social media. It proposes that media experienced through the use
of a participant’s smartphone can foster the development of positive emotions, which in
turn, facilitates greater mental imagery processing that ultimately influences pre-trip
place attachment formation.
An experimental design was constructed to examine how text and video on a
destination’s Facebook page influences an individual’s emotions, mental imagery, and
subsequently attachment to that destination. Specifically, a 2 (narrative text vs.
descriptive text) x 2 (short, fast-paced video vs. long, slow-paced video) between-
subjects design was used. A total of 343 usable participant responses were included in
the analysis. The data was then analyzed through a two-step process using structural
equation modeling.
Results revealed no significant influence of textual or video media on emotions
although the choice in text has a greater influence on emotions than choice in
video. Additionally, emotions had a significant impact on mental imagery. Finally,
mental imagery processing had a significant impact on only the social bonding dimension
of place attachment. In conclusion, while media had no significant impact on emotions,
the effect of previous traveler’s retelling of personal accounts on the emotions of
potential travelers researching a destination should be examined more closely. Further,
the study participants had no prior experience with the destination, yet emotions

ii
influenced mental imagery, which also influenced social bonding. Thus further research
should be conducted to better understand how potential traveler’s image of a destination
can be affected by the stories or others.

iii
ACKNOWLEDGEMENTS
It never hurts to acknowledge the people who helped or encouraged me during
this journey. No one person made this dissertation happen, but collectively you kept me
going. My family is at the top of this list (In particular: Gail (mom), Ken (dad), Mandy,
Joe, Bailey, Bradley, Grandma Sylvia, and Grandma Rose). Even though I moved “far”
away, your support was never ending.
I’d also like to thank my friends, from those of you I met in the program (Vern,
Jessica, and Nichole) to those I met out and about (Yes you Bree!). A special shout out
to Robert and Nick Scheib is in order. Thank you for working on the videos. While at
times you may have served as more of a distraction from my work, more times than not is
was a necessary distraction to recharge the batteries. A special shout-out has to go out to
Jeniece. It seems like 90% of all information I obtained went through Jeniece one way or
another. Thank you Jeniece!
Several professors have contributed to my success and experience over the years
at ASU, including, but not limited to Kathy and Dale, my Midwest connections who
always seemed to be around when I needed additional advice. Last, but certainly not
least, I’d like to thank my committee, and in particular, my co-chairs Megha and Woojin.
In sum, I could probably best express my gratitude to you both by thanking you Megha
for always tracking me down when I wandered off the beaten path, and by thanking you
Woojin for setting me straight after Megha tracked me down! This dissertation would
not be what it is without both of you. I would not have the opportunities I currently do,
and the opportunities I will have in the future, if it wasn’t for all your hard work and
support. Thank you!

iv
TABLE OF CONTENTS
Page
LIST OF TABLES ............................................................................................................ vii
LIST OF FIGURES ............................................................................................................. i
CHAPTER
I. INTRODUCTION ....................................................................................................... 1
Purpose ..................................................................................................... 5
Justification .............................................................................................. 5
Limitations ............................................................................................... 6
II. REVIEW OF LITERATURE..................................................................................... 8
Emotions .................................................................................................. 8
Mental Imagery ...................................................................................... 15
Narratives ............................................................................................... 24
Place Attachment ................................................................................... 29
Mobile Technology & Social Media ...................................................... 38
III. METHODS ............................................................................................................. 51
Experimental Design .............................................................................. 51
Measures ................................................................................................ 53
Pre-tests .................................................................................................. 56
Manipulation Checks ............................................................................. 59

v
CHAPTER Page
III. METHODS CONTINUED ...................................................................................... 55
Participants ............................................................................................. 60
Procedure ............................................................................................... 61
Data Analysis ......................................................................................... 61
IV. RESULTS ............................................................................................................... 69
First Steps............................................................................................... 69
Original Measurement Model ................................................................ 77
Alternative Measurement Model ........................................................... 77
Structural Model .................................................................................... 80
Testing Mediation .................................................................................. 83
Summary of Results ............................................................................... 83
V. DISCUSSION & CONCLUSION ........................................................................... 86
Theoretical Contributions ...................................................................... 86
Practical Contributions........................................................................... 90
Limitations ............................................................................................. 92
Future Research ..................................................................................... 93
Concluding Remarks .............................................................................. 94
REFERENCES ................................................................................................................. 96

vi
APPENDIX Page
A. LETTER OF CONSENT ....................................................................................... 115
B. TEXT CONDITION .............................................................................................. 117
C. STUDY IMAGES AND SCREENSHOTS............................................................ 119
D. PRE-TEST & MAIN STUDY QUESTIONNAIRES ............................................ 128
E. IRB EXEMPTION ................................................................................................. 138

vii
LIST OF TABLES
Table Page
1. Mental Imagery ..................................................................................................... 55
2. Place Attachment .................................................................................................. 56
3. Descriptive Statistics for Constructs in Pre-Test ............................................... 58
4. Descriptive Statistics for Main Study .................................................................. 71
5. Intercorrelations Among Proposed Indicators ................................................... 74
6. Intercorrelations Among Proposed Indicators with Parcels .............................. 76
7. Alternative Measurement Model Factor Loadings and Construct Reliability . 78
8. Summary of Measurement Model Fit Statistics .................................................. 80
9. Model Fit Indices for Structural Model ............................................................... 81
10. Model Fit Indices for Mediated Structural Model ............................................ 83

i
LIST OF FIGURES
Figure Page
1. Mediation mechanism of smartphones in the touristic experience .................... 41
2. Conceptual Model ................................................................................................. 50
3. Measurement Model ............................................................................................ 79
4. Hypothesized Structural Equation Model .......................................................... 82
5. Mediated Structural Model .................................................................................. 85

1
CHAPTER I
INTRODUCTION
Place attachment can be understood as a bond or link that exists between people
and places (Hidalgo & Hernandez, 2001). When people experience a place they have a
tendency to form emotional connections to that place. These attachments motivate them
to return or want to return to that place again and again. For nearly three decades,
researchers in leisure and recreation have studied place attachment, and even though
tourism is all about experiences (Gartner, 2004), tourism researchers have only recently
recognized the importance of place attachment. Only in the last decade has a handful of
studies looked at attachment in a tourism context (Gross, Brien, & Brown, 2008; Gross &
Brown, 2008; Hwang, Lee & Chen, 2005; Hou, Lin & Morais, 2005; Lee & Allen, 1999;
Yuksel, Yuksel & Bilim, 2009). Recently, tourism scholars have shown great interest in
place attachment (Cheng, Wu, & Huang, 2012; Orth, Stöckl, Veale, et al., 2012; Prayag
& Ryan, 2012; Seabra, Silva, & Abrantes, 2012; Silva, Kastenholz, & Abrantes, 2013;
Tsai, 2012). This recent interest in place attachment indicates a growing recognition,
acceptance, and importance of the concept among tourism scholars.
Hinted at in recent literature, is the notion that visitors can develop an attachment
with a destination before actually having visited the destination. For example, Kyle,
Bricker, Graefe, and Wickham (2004) suggested the possibility of recreationists forming
emotional attachments to settings without a dependence on the setting, and indicated the
possibility of having extensive involvement with a setting with little use history and vice
versa. Recent studies have concluded that identifying why visitors form attachments with
destinations can have important implications for destination managers and marketers

2
(Gross, Brien, & Brown, 2008; Gross & Brown, 2008; Lee & Allen, 1999). By
extension, knowing if these attachments form pre-trip could, greatly aid marketers in the
understanding of how tourists make their decision to visit a place and why they return.
Mental imagery is a concept that could shed some light on the possibility of
forming place attachments pre-trip. Mental imagery can be understood as a way to
process information (Lutz and Lutz, 1978). In consumer research, mental imagery helps
a customers’ persuasion process (Lee & Gretzel, 2012), positively influences product
attitudes (Lee, Gretzel, & Law, 2010; Miller & Stoica, 2004, Rossiter & Percy, 1980),
and increases product satisfaction (MacInnis & Price, 1990). In tourism research, there is
evidence supporting the influence of mental imagery processing on tourists' selection of
the destination (MacInnis & Price, 1990; Miller & Stoica, 2004; Oh, Fiore, & Jeoung,
2007; Lee et al, 2010; Lee & Gretzel, 2012). Consumers draw on detailed imagery when
anticipating vacation activities. This is especially true for consumers who intend to
invest large amounts time and money (MacInnis & Price, 1990).
Tourism is about experiences, and experiencing places can lead to emotional
bonds. Mental imagery can help explain the link between experiences and emotions.
Studies have shown that imagery could have an effect on emotions due to its ability to
mimic real-life perceptual events (Holmes & Mathews, 2005). Miller, Levin, Kozak,
Cook III, McLean Jr., and Lang (1987) found imagery to be related to the stimulation of
perceptual and emotional responses. This link between emotions and imagery is
important, as it can help identify why emotions may be stimulated by media, and
subsequently transformed through mental imagery to represent attachment. If positive
emotions can be stimulated through media content, mental images associated with those

3
positive emotions could inherently lead to the representation of emotional bonds, or
attachments, to the place depicted in the content.
Narratives are often associated with imagery, as verbal stimuli and instructions to
imagine take a narrative form. Narratives can evoke mental imagery (Escalas, 2004a;
Green & Brock, 2000), revealing that a reader can be transported into a narrative through
a mental process that bonds together attention, imagery, and feelings. Emotions can also
be influenced by narratives, as emotional reactions, mental imagery, and a loss of access
to real-world information are all components of narrative transportation. Narratives,
through the form of consumer stories, can aid potential visitors in imagining themselves
experiencing a destination, and hence can be used to effectively promote a destination
and influence decision-making (Tussyadiah, Park, & Fesenmaier, 2011). Then,
experiences can lead to place attachment when narratives influence emotions and mental
imagery while allowing consumers to experience a destination.
Since attachments are formed through experiences, and narratives that may help
foster these experiences can be experienced through media, understanding how forms of
media can also influence a tourist’s experience is important. Tourist experiences can be
facilitated by mobile tourist guides, virtual destinations, virtual travel agents, images,
videos, podcasts, and blogs provided on destination and destination marketing
organization websites (Tussyadiah & Fesenmaier, 2009). New forms of media give
tourists access to information about a destination in the pre-trip stage like never before.
In particular, travel videos can mediate a tourist’s experience through narrative
transportation, while manipulating a videos pace can increase immersive experiences
(Bracken, Petty, Guha, & Rubenking, 2010) and facilitate a viewers’ arousal and

4
attention (Grabe, Lang, & Zhao, 2003; Lang, Bolls, Potter, & Kawahara, 1999). Tourism
destination marketers would be aided by a better understanding of how mobile video
content influences the behavior of potential visitors. In addition to examining the
influence of narrative text, this study addresses the need to better understand mobile
content by including video as a factor which could stimulate positive emotions, generate
mental imagery, and lead to higher levels of attachment.
Technology advancements are changing the way tourists experience a destination.
Travelers are using new forms of technology to gather information about a destination
through websites, social media, smartphone apps, etc. that includes content such as
narratives. In part because of this, tourism research on the use of information
communication technology (ICT) has shifted focus from a supply side (what information
is presented to tourists in their online search) (Xiang, Gretzel, & Fesenmaier, 2009) to a
demand side (how people search for tourism information) (Buhalis, 2003; Kah, Vogt, &
MacKay, 2008). Buhalis and O’Connor (2005) argued for the development of
technologies and business strategies that are consumer centric in order to meet the needs
of today’s travelers who are sophisticated and experienced with these new ICTs.
Motivations, experiences, and desires of each tourist are different; therefore tourism
organizations need to develop personalized technology services to address individual
needs (Buhalis & O’Connor, 2005). Results from a study by Wang, Park, & Fesenmaier
(2012) found that a tourists’ behavior and emotional state can be changed by the use of
smartphones. Sharing experiences, storing memories, and gathering information to solve
problems can instantly and effectively be supported by smartphones. Tourism businesses
need to be aware of how such smartphone use is influencing the tourist experience.

5
Change in emotional states can alter the tourist experience in any phase of participation
(Wang, Park, & Fesenmaier, 2012).
Purpose
This study advances the place attachment literature by examining attachment and
its antecedents in a pre-trip, mobile context. Specifically, positive emotions and mental
imagery processing will be examined as antecedents of attachment. As argued here,
place attachments form prior to visiting a destination. Therefore, identity antecedents
that influence the formation of pre-trip place attachment is the goal of this study.
Understanding what might influence pre-trip attachments will aid destination markets in
attracting visitors to their destination by appealing to the pre-trip emotions that visitors’
likely associate with a destination. Furthermore, the study intends to examine place
attachment in a modern context. Technology has made information about any destination
accessible from anywhere, anytime. Potential visitors can access content from anywhere
using mobile technology, such as a smartphone, using interactive forms of social media,
such as Facebook. To better understand the influence of these information gathering
mediums on the antecedents that can influence place attachment, participants in this study
will use smartphones to view a destination’s content on Facebook.
Justification
This study addresses a lack of research analyzing antecedents which could
influence pre-trip place attachment, specifically the influences of emotions and mental
imagery. It makes sense that researchers need to understand the creation of positive
emotions in order to understand the emotional bonds people form with places. Currently,
a gap in the literature exists. Research on emotions evoked through pictures and texts has

6
overlooked what specific emotions are evoked and the reason those emotions arise
(Schneider & Stangl, 2012). Visual and textual stimuli can evoke emotions, with
understanding emotions being a solution to attracting potential tourists (Schneider &
Stangl, 2012). In addition to advancing attachment literature, mental imagery research is
advanced by examining how viewing content on a smartphone’s smaller screen
influences mental imagery through the stimulation of positive emotions. Smaller screens
can create a more immersive experience (Bracken et al., 2010). The use of smartphones
in this study should aid in creating an experience that stimulates emotions, mental
imagery, and leads to greater levels of place attachment.
Limitations
This study used a student sample for data collection, which makes it difficult to
generalize results. Particularly, since students were between the ages of 18 and 22, the
ability to generalize demographics would be impacted the most. However, this bias was
not expected to have a significant influence on pre-trip behaviors resulting in attachment.
The survey instrument was only provided in the English language. However, all
participants attended an American university, thus a language barrier was a non-issue.
As a part of this experimental design, this study used a destination that participants may
have no interest in visiting. Many participants comment that they had never heard of the
destination and/or did not know where it was located. This could influence the degree
they experience emotions and attachment towards the destination. During the pre-test,
one student commented that he might be more interested in the destination if it was a
place with fishing, camping, and hiking as opposed to a sun and sand island destination.
However, the benefit of choosing this neutral location is that preconceived perceptions of

7
the destination should influence emotions, mental imagery, and place attachment to a
lesser degree. In this study, participants only read one text entry from a previous visitor
as opposed to numerous entries from previous visitors and the destination itself that
would typically be found on a destination’s Facebook page. Last, the videos presented on
the Facebook page did not include sound or text (other than the destination name). This
was done to limit the types of media to text and sound. During a manipulation check
participants pointed out that there was no sound. Main study participants were informed
prior to beginning the study that the video was a pilot video for the destination and no
sound was included.

8
CHAPTER II
REVIEW OF LITERATURE
This review of literature connects the influence of media content to creation of place
attachment. This connection is made through a discussion of emotions, imagery,
narrative, technology and attachment.
Emotions
Defining Emotions
Emotions research over the past several decades has spanned numerous fields.
However, no clear-cut definition exists (Frijda, 1986; Ortony, Clore, & Foss, 1987;
Russell, 2003). Emotions is used interchangeably with other terms such as feelings
(Adam, Gamer, Krämer, & Weinhardt, 2011). The complexity of emotions makes it
difficult to maintain one general definition. As Russell (2003) states, there are no criteria
for what constitutes an emotion. However, Gnoth, Zins, Lengmueller, and Boshoff
(2000) found similarities in literature in regards to categories often involved when
discussing emotions, including basic emotions such as joy, acceptance, surprise, fear,
sadness, disgust, anger and expectancy (Plutchik, 1980).
Furthermore, emotions are described as affective variables more intense than
moods (Batson, Shaw, & Oleson, 1992), a complex set of interaction leading to affective
experiences like feelings of pleasure and arousal (Kleinginna & Kleinginna, 1981),
created through experiences (Barsky and Nash, 2002), with socially defined roles and
concepts (Averill, 1982). They can be separated into three distinct groups: immediate,
anticipatory, and ongoing current emotional state (Rick & Loewenstein, 2007). Bagozzi,
Gopinath, and Nyer (1999) discussed emotions as a psychological state of preparation in

9
which actions may be taken to recognize or deal with the emotion. Recently, emotions
are defined as “a subjectively experienced state that can be described qualitatively and is
accompanied by changes in feeling, physiology, and expression” (Adams et al., 2011, p.
4). According to Schneider and Stangl (2012), “current physical conditions of humans
which are from a specific quality, intensity and duration” (p. 62) are characteristics of all
emotions definitions in literature.
Emotions research in marketing is a growing field (Smith & Bolton, 2002).
Consumer research has found that understanding emotions is essential to providing
customers with the best products and services (Barsky & Nash, 2002; Bigné & Andreu,
2004; Gountas, Mavondo, Ewing, & Gountas, 2011). Emotions are an important subject,
as they can strongly influence consumers’ purchase decisions (Barsky & Nash, 2002)
satisfaction, and intent to purchase again (Gountas, et al., 2011). Consumers have the
capability of being emotionally as well as cognitively involved with an advertisement
(Zaichkowsky, 1994). Organizations utilizing emotions research in their management
and marketing practices can gain a competitive advantage (Bigné & Andreu, 2004).
Based on these definitions of emotions, and prior consumer research, narrative text and
video stimuli is used to generate positive emotions within potential travelers. The media
narrative text tells a story of group of people who had an enjoyable experience at the
destination, while the video shows images associated with their trip. The use of a
smartphone in the study will further stimulate emotions experienced by creating a more
immersive experience.

10
Emotions in Recreation & Tourism
Emotions can influence visitors’ recreational experiences. According to Chhetri,
Arrowsmith, and Jackson (2004), different types of emotional response can be elicited
based on variations in landscapes, yet those variations could lead to the same emotional
states for different hikers. Chhetri et al. suggest that a hiker’s knowledge of the
landscapes historical and cultural background can influence their emotional response.
Hull and Harvey (1989) found pleasure and arousal for suburban park visitors increased
as the density and size of trees and understorey varied.
Traditionally, tourism research has neglected the emotions of travelers (Gnoth et
al., 2000; Schneider & Stangl, 2012). As Gnoth et al. indicated, this is despite the fact
that an identified need to travel is linked to an individual’s awareness of an emotional
state. Over the past decade several studies have examined and acknowledged the
importance emotions play in tourism research. Tourism studies have linked emotions to
an increase in mood and motivations to travel (Gnoth et al., 2000), satisfaction (Brunner-
Sperdin, Peters, & Strobl, 2012; Chhetri et al., 2004; McMullan & O’Neill, 2010; Zins,
2002) loyalty (Barsky & Nash, 2002; Pullman & Gross, 2004), behavioral intentions
(Barsky & Nash, 2002, Yang & Zeng, 2010), and perceived service quality (Yang &
Zeng, 2010). Bigné and Andreu (2004) segmented tourists based on evoked emotions.
After determining emotions are a reliable segmentation variable, Bigné and Andreu
recommended that affective variables be incorporated into tourism service organizations’
market research. Schneider and Stangl (2012) examined emotions and tourism websites.
They commented that previous research on emotions evoked through pictures and texts
has overlooked what specific emotions are evoked and the reason those emotions arise.

11
Schneider and Stangl found that visual and textual stimuli can evoke emotions and
suggest that understanding emotions is a solution to attracting potential tourists.
Similarly, according to Barsky and Nash (2002), fully understanding visitor experiences
and predicting their future behavior cannot be done unless emotions are included in
satisfaction measurements. As discussed in the literature, appealing to the emotions of
visitors or potential visitors can enhance their experience. In this study, experiences are
fostered to created place attachment. Therefore, to understand the formation of place
attachment in a pre-trip context, understanding the influence of emotions as an antecedent
variable is important.
Measuring Emotions
Measuring emotions can be a tricky task. The diversity of emotions is not fully
covered in prior research, making it difficult to select appropriate measures for different
products or services (Richins, 1997). Measuring emotions is made more difficult when
existing theory offers limited information about emotions related to a particular product
or service (Pullman & Gross, 2004). Emotions are utilized as both a moderating (Zins,
2002) and mediating (Lee, Kim, Son, & Lee, 2011; Pullman & Gross, 2004) variable.
Research frequently examines two dimensions of emotions: positive and negative
(Watson et al., 1988), with positive emotions being fundamental to a quality leisure
experience (Farber & Hall, 2007).
There are numerous ways to measure emotions. Studies have used two
dimensional approaches of negative and positive (Chhetri et al., 2004; Shaver, Schwartz,
Kirson, & O’Connor, 1987), and pleasure and arousal (Bigné & Andreu, 2004; Farber &
Hall, 2007). White and Yu (2005) and White (2005) identified emotions as a three-

12
dimensional construct of positive, negative and bi-directional. Other studies have utilized
Mano’s (1991) emotions scale in conjunction with Watson et al.’s (1988) PANAS scale
(Pullman & Gross, 2004; Zins, 2002). Mano and Oliver combined the scales of Watson,
Clark, and Tellegen (1988) and Mano (1991) to create a compilation scale that include
positive and negative affect adjectives. In all, the combined scale included 10 affect
scales measuring good mood, fear, bad mood, arousal, bored, calm, surprise, guilty, quiet,
and pleasure. They used this scale to examine how products could evoke emotional
reactions and influence satisfaction. Russell’s (1980) study had participants place 28
stimulus words into eight categories labeled arousal, excitement, pleasure, contentment,
depression, distress, misery, and sleepiness. Participants then placed these categories in a
circular order with words opposite each other representing opposite feelings, and words
closer together representing similar feelings.
Several studies in recreation and tourism research have utilized scales from
previous studies. Researchers have selected emotions from several sets of emotions
developed in previous studies (Mano & Oliver, 1993; Russell, 1980; Shaver, Schwartz,
Kirson, & O'Connor’s, 1987). Zins (2002) utilized nine positive and nine negative
emotions derived from Mano and Oliver’s (1993) inventory of 43 emotional adjectives.
Bigné and Andreu (2004) used a bidirectional approach modified from Russell’s scale
with 12 items representing the pleasure and arousal dimensions of emotions. Farber and
Hall (2007) selected emotions from Shaver et al.’s (1987) set including: pleasure,
excitement, joy, affection, love, surprise, awe, sadness, aggravation, anxiety,
contentment, boredom, disappointment, anger, and fear. A five-point Likert-scale was
used to have recreationists assess the degree to which they had experience each of the 15

13
emotions during a special experience they had. Farber and Hall’s study identified two
independent dimensions of positive affect: pleasantness (happiness, cheerfulness, and
excitement) and arousal (alertness, energy, and activeness). They found links between
emotions and experiences involving wildlife and scenery, which were significant when
experienced either during a recreation activity or as a part of a social group. Yang and
Zeng (2010) measured emotion with a four-item scale proposed by Ryu and Jang (2007).
Items included unhappy-happy, disappointed-delighted, bored-entertained, and annoyed-
pleased. Pullman and Gross (2004) examined two categories of positive emotions (basic
and VIP/esteem) utilizing items from scales developed by Watson et al. (1988), Mano
(1991) and Barsky and Nash (2002). They found basic emotions such as “inspired”,
“satisfied”, “excited”, “relaxed”, and “happy” mediated the relationship between design
elements of a VIP hospitality tent and loyal behavior. Barsky and Nash (2002) narrowed
down a broad list of emotions to create a list of only those emotions the study site (hotel)
at least partially caused. This allowed them to understand the underlying dimensions of
visitors’ emotional experiences as opposed to characterizing every emotional experience
during their stay. Chhetri et al. (2004) used a five-point Likert scale ranging from highly
positive to highly negative to capture the effects of basic emotions such as joy. White
and Yu (2005) conceptualized emotions as a three-dimensional construct that included
positive, negative and bi-directional (emotions towards self and service provider)
emotions. Zakrisson and Zillinger (2012) found that ratings of positive emotions were
usually higher than ratings of negative emotions, suggesting that positive experiences
produced positive feelings progressively more so than negative experiences produced
negative feelings. In this study, measuring emotions is particularly important. Media

14
content (narrative text and fast-paced video) presented in this study is expected to
positively influence emotions. Previous literature has already made this link. Emotions
can be evoked in response to reading a story (Green & Dill, 2013), and video pace has the
capability to influence viewers’ arousal (Grabe et al., 2003).
Emotions & Imagery
Schneider and Stangl (2012) made the connection that visual and textual stimuli
can evoke emotions and suggest that understanding emotions is the solution to attracting
potential tourists. As discussed later on, imagery is seen as a way to process information
(Lutz & Lutz, 1978), and is elicited through visual and textual stimuli (Paivio, 1971). It
would make sense that how information is processed would have an effect on an
individual’s emotions. However, only recently is imagery research exploring the
influence of emotions. Kosslyn (1994) argued for the need to address emotions in mental
imagery research, however, little research since has done so. Holmes and Mathews’
(2005) study made the connection by finding a link between imagery and anxiety. In
their discussion, Holmes and Mathews suggest that imagery could have emotional effects
because of the way it mimics real-life perceptual events. If this is the case, greater
affective response could be linked to imagery regardless of the emotion being elicited.
Additionally, Miller et al.’s (1987) study found that imagery ability is more related to the
stimulation of perceptual and emotional response patterns than processing pictorial or
modality-specific information. Therefore, this study suggests that the stimulation of
positive emotions will have a positive influence on the mental imagery processing of
participants.

15
Mental Imagery
Imagery is defined by Lutz and Lutz (1978) as “a mental event involving
visualization of a concept or relationship” (p. 611). Mental imagery can be seen as a way
to process information. Additionally, imagery is defined as “(1) a process (not a
structure) by which (2) sensory information is represented in working memory”
(MacInnis & Price, 1987, p. 473). Mental imagery can be elicited through one of three
types of strategies, or external treatment variables: pictorial stimuli, concrete verbal
stimuli, and imagery instructions (Burns, Biswas & Babin, 1993; Miller & Stoica, 2004;
Paivio, 1971). Pictorial material (a picture or illustration) is any two-dimensional
illustration in which the stimulus assortment contains at least one non-alphabetic, non-
numeric, and non-arithmetic element (Lutz & Lutz, 1978). Concrete verbal stimulus is a
strategy examining imagery values of words and the ease with which a word can arouse
sensory images. Both pictorial material and concrete verbal stimuli are types of external
stimuli used to elicit mental imagery. Imagery instructions are a more direct way to elicit
mental processing by providing participants a statement that directs him or her to form a
mental picture of the desired notion to be learned (Lutz & Lutz, 1978). In their review of
literature Lutz and Lutz (1978) found a general indication that pictures, concrete words,
and mental imagery instructions aid memory and could potentially enhance attitudes
towards ads. The brain may be engaged more fully in the response to an ad when
imagery is used in advertising combining both verbal and pictorial information.
A concept derived from mental imagery is the consumption vision (Phillips,
Olson, & Baumgartner, 1995). Consumption vision is defined as “a visual image of
certain product-related behaviors and their consequences” (Walker & Olson, 1994, p. 27).

16
They allow consumers to indirectly experience the outcomes of product use through
concrete and vivid mental images. Consumption visions are formed by consumers to
help them select suitable alternatives, with several factors influencing the formation of
these visions (Phillips et al., 1995). Through projecting a “possible self” into a future
consumption scenario, consumers create consumption visions, and mentally consume a
product before purchase and/or try out alternatives to select the product they believe best
satisfies their values and goals. Many of these visions take a narrative form where the
consumer creates a character, plot and setting within their vision. Escalas (2004a)
discusses how narratives structures have two important elements: chronology and
causality. Events within narrative stories follow a timeline (plot with beginning, middle,
and end), and there is some goal within the story. Consumers then form tangible
representations of abstract goals, motives, and values, or realistic/ideal goals through
their consumption visions. Based on this description, travelers’ consumption visions play
an important role in trip decision making. Imaginative processes and their associated
emotions may influence planning or deciding on what vacation to take (Walters, Sparks,
& Herington, 2007). The combination of a concrete-style picture in combination with
textual content containing instructions to imagine can effectively evoke a tourism
consumer’s consumption vision. Methods for measuring consumption visions are closely
related to those of mental imagery; therefore, this study’s foundation will be based on the
concept of mental imagery as opposed that of consumption visions.
Supporting Theories of Mental Imagery
According to Lee and Gretzel (2012), mental imagery is supported by two
theories, dual coding theory (Paivio, 1971) and multimedia learning theory (Mayer,

17
1997). From a dual coding theory perspective, information is best represented and
processed when presented using a combination of verbal and nonverbal stimuli. Images
generated by high imagery words can result in the formation of verbal and imaginal codes
in memory (Paivio, 1971). Unnava and Burnkrant (1991) studied the processing of
verbal information and the role of pictures. They looked at high versus low imagery
words accompanied by a picture. An example of high vs. low imagery words, as
provided by Unnava and Burnkrant, are the words “table” and “freedom.” Saying the
word table more easily evokes a mental image in one’s mind than saying the word
freedom. Based on the dual coding model, encoding pictures as imaginal codes in
memory and representing words as verbal codes (Paivio, 1986), they found that when low
image verbal information is accompanied by a picture participants could recall more of
the verbal information. However, when high imagery verbal information was
accompanied by a picture, participants did not see an increase in their ability to recall the
verbal information within the advertisement. They concluded that internally produced
visual imagery can substitute for pictures presented externally.
Similar to dual coding theory, multimedia learning theory presents information in
two or more formats, and posits that content presented in both audio/verbal and
visual/pictorial form can result in immersion into that content, in turn making it more
meaningful (Mayer, 1997; Mayer, 2001). According to Mayer (2001), cognitive theory
of multimedia learning is triggered through five steps: “(a) selecting relevant words for
processing in verbal working memory, (b) selecting relevant images for processing in
visual working memory, (c) organizing selected words into a verbal mental model, (d)
organizing selected images into a visual mental model, and (e) integrating verbal and
18
visual representations as well as prior knowledge” (p. 54). As multimedia continues to
provide richer environments for learners in a wide variety of formats, the challenge arises
to effectively combine information that best facilitates learning (Reed, 2006). In this
study, the combination of narrative text and a shorter, fast-paced video will best facilitate
the creation of emotions, mental images, and attachment.
Mental imagery is connected to other theories, including simulation theory and
multimedia richness theory. Simulation theory is a theoretical approach used in
narrative-based studies. It was developed by Oatley (1994) to understand how narrative
entertainment media is received. Simulation theory posits that there are three different
means to elicit emotional responses through simulating a story world including: (1)
sympathy with characters is an affective experience which can lead to emotional
reactions, (2) past experiences of readers can be reactivated by internal simulations, and
(3) simply identifying with characters can lead to emotional reactions (Klimmt &
Vorderer, 2003). Furthermore, simulation theory advocates that external information is
not exclude from mental simulations, but rather that mediated stimuli like that of a
novel’s text are possibly filled in by memories and imagery of the user and potentially
cognitively reshaped in order to run the simulation. According to simulation theory, the
reader creates the plot in their mind based on their past experiences, and stories become
more convincing and enjoyable. Other studies discuss simulation theory as a theory
argue that our own mental state is used to reason and simulate what someone else might
think or do based on what we might do (Baron-Cohen & Cross, 1992; Biocca & Harms,
2002; Currie, 1995; Shanton & Goldman, 2010). Accordingly, simulations could be
adopted by individuals to represent the emotional state of others. While not capable of

19
knowing what others think, individuals could simulate emotions of others as if they were
in the same situation as the other person. Currie (1995) makes a connection between
visual imagery and simulation. Currie suggested that visual imagery is the simulation of
vision and a kind of imaginative projection. With this, people have the capability of
projecting themselves into purely hypothetical situations that they may or may not
actually be in. Similarly, Taylor and Schneider (1989) found that simulations can make
events seem more real or true. The term mental simulation was introduced into narrative
processing research by Escalas (2004a, 2004b). A consumer creates a cognitive assembly
of a hypothetical scenario based on the chronology and causality of a story. Moulton and
Kosslyn (2009) would argue that all imagery is in fact simulation. This literature makes a
strong connection between mental imagery and simulations generated from narrative text,
particularly through the elicitation of emotions; however, this study opts not to use it as
dual coding theory and multimedia learning theory provide a better overarching
background to this study. Situation theory relies heavily on past experiences. In this
study participants may rely very little on past experience. They are viewing content
about a destination they have never visited and may know little or nothing about beyond
what is presented to them in the study.
Mental imagery has been examined in conjunction with media richness theory
(Segovia & Bailenson, 2009). Studies on media richness first emerged in the 1980’s to
suggest that the matching of media characteristics to organizational information
processing task needs could help managers improve performance (Daft & Lengel, 1986).
Media richness theory proposes that the use of “richer” media for equivocal tasks will
improve performance (Dennis & Kinney, 1998). In terms of media, text can be seen as a

20
“lean” media while video is consider a “rich” media. A description of media richness can
be based on four criteria: ability to generate immediate feedback; capability of
transmitting multiple cues such as graphic symbols or human gestures; greater language
variety (conveying natural language as opposed to just numeric information); and
capacity to personalize the message (Daft, Lengel, and Trevino, 1987). However, media
richness theory was developed to theorize which media should be most effective and in
what circumstances, as opposed to theorizing how managers should choose media
(Dennis & Valacich, 1999). Since its inception, media richness studies have progressed
beyond the workplace. Media richness theory was used to examine false memories of
children in virtual reality. Mental imagery stimuli was found to be high in media richness
as the stimuli can provide feedback, multiple cues, a variety of languages, and a
personalized perspective (Segovia & Bailenson, 2009). Additionally, media richness
theory was used to exam web-based communication technologies such as video blogging
on YouTube (Harley & Fitzpatrick, 2009) and micro-blogs (Twitter) (Zhoa & Rosson,
2009). Social media platforms can be segmented by media richness. According to
Kaplan and Haenlein (2010), blogs and collaborative projects such as Wikipedia score
the lowest since they tend to be text-based. Content communities such as YouTube and
social networking sites like Facebook are richer, as they allow pictures, videos and other
forms of media in addition to text-based communication. Virtual games and social
worlds such as World of Warcraft and SecondLife are the richest forms of social media
as virtual environments attempt to replicate all aspects of face-to-face interactions.
Although media richness theory was traditionally used to improve work performance,
recent studies such as Kaplan and Haenlein’s have shown its potential outside the

21
workplace. As the literature shows, media richness theory provides a foundation to
understand the influence of media with varying richness, and can help put this study in
context. This study examines the influence of media with different degrees of richness
using the social media platform Facebook. The media is expected to elicit positive
emotions and mental imagery processing. Media richness theory shows how the varying
richness in media affects the study. In terms of this study, media richness theory will be
used in conjunction with and dual-coding theory and multimedia learning theory to
explain the relationships between emotions, imagery, and attachment in a mobile social
media context presenting lean and rich media.
Practical Implications of Mental Imagery
Mental imagery is an important subject in consumer research, with multiple
studies having looked at imagery in relation to product placement or advertisement since
it helps the consumer persuasion process (Lee & Gretzel, 2012; Schlosser, 2003). Mental
imagery positively influences attitudes (Rossiter & Percy, 1980), increase satisfaction
(MacInnis & Price, 1990), increase product attitudes (Lee, Gretzel, & Law, 2010; Miller
& Stoica, 2004, Rossiter & Percy, 1980), and behavioral intentions (Kim, Kim, & Bolls,
2013). Furthermore, Rossiter and Percy (1980) discuss that both visual and auditory
imagery are capable of increasing a consumers overall product attitude. It was found that
advertisements increased a consumer’s product attitude as much by visual content as by
verbal content. More important here is that research evidence supports the influence of
mental imagery processing on tourists' selection of a destination (MacInnis & Price,
1990; Miller & Stoica, 2003; Oh, Fiore, & Jeoung, 2007; Lee et al, 2010; Lee & Gretzel,
2012). MacInnis and Price (1990) identified low consumer experience, the degree to

22
which consumers were familiar with what they would be partaking in on vacation, of
individuals engaging in imagery processing to be the most satisfied with their vacation.
Greater levels of elaborated imagery resulted in satisfactory vacation outcomes, even if
the vacation did not unfold as planned.
Understanding how both textual and pictorial stimuli influence mental imagery is
important in the field of tourism. Use of elaborated imagery is a prevailing part in the
anticipation of vacation activities, especially for consumers who intend to invest more
time and money (MacInnis & Price, 1990). Sensory descriptions have a positive
influence on the extent of mental imagery experience (Lee, Gretzel, & Law, 2010), and
extensive mental imagery leads to a greater sense of virtual presence at a destination
resulting in stronger attitudes about the destination (Lee et al., 2010). Furthermore, the
mental imagery construct can be utilized to aid tourists in navigating a destination’s map
in a virtual context (Go & Gretzel, 2010). Mental imagery generated through virtual
spatial experiences can be created through interactive maps which can help tourists learn
about a destination. Kim, Kim, and Bolls (2013) exposed study participants to high-
imagery audio and visual text destination ads. They found visual text advertisements
produced greater imagery processing as well as arousal, attitude, and behavioral
intentions than audio advertisements. Narrative texts in particular have the capability to
evoke mental imagery (Escalas, 2004a), and thus are included as an integral part of this
study. Additionally, research has found that mental imagery is better produced by a
photograph than an artist’s rendering of the same image (Miller & Stoica, 2004). A
photograph in Miller and Stoica’s study produced more favorable attitudes towards an ad,
the brand, and intention to visit a destinations website. In this study, video as opposed to

23
still images is used to elicit emotions and mental imagery processing. Goossens (2000)
suggested that promotional stimuli can be manipulated in numerous forms of media,
including video, to stimulate mental imagery and emotions, and better understand
vacation behavioral intentions.
Measuring Mental Imagery
Based on empirical evidence that imagery can mediate cognitive and affective
responses to advertising, Miller, Hadjimarcou, and Miciak (2000) developed a
multidimensional scale to measure the attributes of advertisement-evoked mental
imagery. The developed scale measures mental imagery vividness, quantity, valence and
sensory modality, attributes considered to be relevant to advertising research. As defined
in a review of literature, Miller et al. (2000) identified vividness as relating to the quality
of imagery, from its clarity, to its intensity and distinctiveness; quantity as the number of
images evoked by a stimulus as well as the amount of activated memory structures
holding perceptual information; valence as indicating an individual’s understanding of
the emotional meaning attached to concrete memories; and sensory modality referring to
the sensory nature of the imagery, with images being visual, auditory, gustatory, olfactory
or tactile, or a combination of these sensory stimuli. In their study, Miller et al. (2000)
created a 16-item scale found to be reliable in print, radio, and television advertising
media. More recently, Frikha and Khrouf (2013) developed a scale to measure
commercial website customers’ mental imagery when surfing the websites. Previously
developed scales were designed within an ads persuasion context and an often one-sided
sensory aspect. Frikha and Khrouf argue that since sensorial simulations differ by media
instruments, the webs multi-sensory aspect requires a new scale.

24
Narratives
As mentioned, mental imagery is a way to process information that can be elicited
through pictorial stimuli, concrete verbal stimuli, and imagery instructions. Verbal
stimuli and instructions to imagine take a narrative form. Understanding narratives is
important in many research studies. Narratives are the most effective means to
understanding human experiences, which are best understood through understanding
stories (Tussyadiah, Park, & Fesenmaier, 2011). Recent studies have looked at narratives
and how they have the means to evoke mental imagery (Escalas, 2004; Green & Brock,
2000). Narrative is an important means by which individuals can make sense of their
experiences. According to Padgett and Allen (1997), narrative is “the primary form
through which people communicate and comprehend experience” (p. 56). Narratives are
used by people to understand the world around them (Wiles, Rosenberg, & Kearns,
2005). Pace (2008) utilized narrative analysis to examine the content people place on
YouTube, and showed how this content can be understood as stories. Through consumer
generated narratives, potential visitors are able to imagine themselves experiencing a
destination, thus making narratives an effective promotional tool for influencing their
decision-making process (Tussyadiah, Park, & Fesenmaier, 2011).
Recent studies have looked at narratives and how they have the means to evoke
mental imagery utilizing transportation theory (Green & Brock, 2000). The concept of
transportation is similar to that of the consumption vision discussed prior as consumer
consumption visions often take a narrative form (Phillips et al., 1995). The idea of
transportation was initially introduced by Gerrig (1993). Gerrig described transportation
as:

25
Someone ("the traveler") is transported, by some means of transportation, as a
result of performing certain actions. The traveler goes some distance from his or
her world of origin, which makes some aspects of the world of origin
inaccessible. The traveler returns to the world of origin, somewhat changed by the
journey (p 10-11).
Narrative transportation is a mental process in which attention, imagery, and feelings are
bonded (Green & Brock, 2000). When individuals read stories, either fiction or
nonfiction, they may become transported into a narrative world. Transportation is
conceived as a convergent process, in which events in the narrative become the primary
focus of all mental functions. Readers who experience narrative transportation can
experience emotions in response to the story they read (Green & Dill, 2013). In fact,
emotional reactions, mental imagery, and a loss of access to real-world information are
all components of transportation. Media presentations, even fictional narratives, have the
ability to foster narrative transportation and subsequently influence the beliefs, attitudes,
and behaviors of individuals (Green & Clark, 2012; Green & Dill, 2013). In this study,
presenting a narrative version of a previous visitor’s trip experience to study participants
will create an emotional reaction, and subsequently stimulate mental imagery processing.
Transportation is not limited to written material (Green & Brock, 2000). Within a
narrative world, listeners, viewers, or any recipient of narrative information can be
interpreted as the “reader.” Transportation is an immersion into a text in which negative
cognitive responding can be reduced. During transportation readers may be less likely to
dispute the story claims, hence influencing their beliefs. The experiences within the
narrative may seem more like a real experience, and the beliefs of a character within a
narrative may have a greater influence on readers’ own beliefs. In sum, narratives are an
important component of mental imagery research, and understanding the ability of
26
narratives to transport readers can help identify how content on a destination’s Facebook
page could influence potential visitors. Given this, some focus on narrative
transportation follows.
Green and Brock (2000) utilized Gerrig’s (1993) description of transportation to
develop a scale measuring its dimensions, including emotional involvement in and
cognitive attention to the story, feelings of suspense, lack of awareness of surroundings,
and mental imagery. A 15 item scale consisting of 11 general question items to measure
cognitive engagement and affective reactions as well as 4 items to evaluate mental
imagery was created and measured on a seven-point scale ranging from very much to not
at all. Transportation was found to be an instrument in which narratives have the ability
to change beliefs. Furthermore, highly transported participants consistently reported
greater liking for central characters within the story. Since its inception, several studies
have incorporated Green and Brock’s (2000) transportation scale into their research
(Phillips & McQuarrie, 2010; Rozier-Rich & Santos, 2011). Narrative transportation as a
route to persuasion can intensify brand experience (Phillips & McQuarrie, 2010), and
transportation by promotional travel narratives can vary by demographics and be
negatively affected by skepticism towards the travel narrative (Rozier-Rich & Santos,
2011). As an important implication for destination promoters, overall persuasiveness of
the promotional messages could be negatively influenced by a lack of narrative
transportation. Since this study will already incorporate a more elaborate mental imagery
scale, the narrative transportation scale will not be included in the analysis. The primary
rationale for understanding narrative transportation here is to identify the qualities of
narrative text that are necessary to stimulate emotional reactions and mental imagery.

27
Thus, when using narratives, properly formatting the text is important (Adaval &
Wyers, 1998; Escalas, 2004a, 2004b; Escalas, Moore, & Britton, 2004; Green & Brock,
2000; Mattila, 2002; Rozier-Rich & Santos, 2011; Slater & Rouner, 2002; Stafford &
Day, 1995). The way in which reader’s process information presented is influenced by
the format in which a narrative is written, which in turn influences the overall
persuasiveness of the message. This can be particularly important within the travel and
tourism industry. Travel narratives are an important source of information for tourist
consumers, and with the increasing number of outlets from which tourists can consume
travel narratives, destination marketers and managers need to be aware of how narratives
can affect a potential visitor’s image. Travel narratives can be found in numerous media
outlets today, including: print media (e.g., travel guidebooks), television (The Travel
Channel), radio (travel talk shows), podcasts, in-flight magazines, and an endless array of
websites (e.g., Travelocity.com, Expedia.com, and Orbitz.com). Currently there is a lack
of research pertaining to how consumers process and perceive different types of travel
narratives (Rozier-Rich & Santos, 2011).
Narrative marketing plays a significant role in the field of tourism and hospitality
as products within the field are characterized with their experiential values (Tussyadiah et
al., 2011). Tussyadiah and Fesenmaier (2009) advanced the literature on narrative,
specifically in tourism, by examining the role online travel videos played as mediators of
tourist experiences. An increase in the development and advancement of technology-
based mediators such as the internet, smartphones, and digital cameras, make studies like
that of Tussyadiah and Fesenmaier (2009) possible and relevant. These mediators have
an influence on the tourism industry. Tourist experiences can be facilitated by mobile

28
tourist guides, virtual destinations, virtual travel agents, and images, videos, podcasts,
and blogs provided on destination and destination marketing organization websites. New
multimedia features such as text, images, video streaming, and virtual reality benefit
users by enhancing and adding value to their tourism experience (Tussyadiah et al.,
2011). New consumer-generated media, online content created by online users
themselves, allows the sharing of tourism experiences through social media and social
networking sites. Using all videos containing tourism activities in New York City on
YouTube.com, Tussyadiah and Fesenmaier (2009) showed that videos aided participants
in recalling past travel memories, provide mental pleasure by stimulating fantasies and
daydreams, and acted as narrative transportation. Participants felt so immersed in the
narratives of the videos that they felt transported. Potential tourists can benefit from the
process of information sharing while also having their interest to travel to a destination
intensified through videos. It was found that viewing an attraction in a video can lead to
viewers adding the attraction to their itinerary. Tourists visiting attractions in a video can
signify that the attraction is worth viewing (Tussyadiah et al., 2011).
Several studies have examined how narratives impact a tourism destination
(Guthrie & Anderson, 2010; Tussyadiah et al., 2011). According to Guthrie and
Anderson (2010), most research on narratives has tended to focus on post experience
narratives, capturing narratives sometime after an event or experience has occurred. This
potentially leads to narratives that may be unconsciously manipulated by various post
visit images or a distortion of memory. They argue that capturing narratives “on the
spot” can better capture an experience before this manipulation occurs, providing a better
understanding of how visitors understand and talk about a destination. Narratives can
29
have the ability to develop a better understanding about the attraction of existing tourist
destinations and potential attraction of new destinations (Guthrie & Anderson, 2010).
Karapanos, Barreto, Nisi, and Niforatos (2012) examined how people at locations
depicted in videos could have an immersive experience when accessing location aware
narratives through mobile computing. They found that location aware narratives
significantly influenced immersion into the story and mental imagery when participants
were at the location as opposed to a location that looked similar. In this study, it is
argued that visitor narratives can influence a visitors experience prior to their visit, as
narratives have the ability to stimulate emotions (Green & Dill, 2013) in addition to
stimulating mental imagery (Green & Brock, 2000). The remaining literature review
discusses place attachment, how creating emotions and stimulating mental imagery
processing can influence attachment, and the role that technology and media plays.
Place Attachment
Place research began in the 1970s with the research of two geographers, Tuan
(1975, 1977) and Relph (1976). Tuan (1977) argued that an undistinguished space
becomes a place through personal experiences. A place could be conceptualized as a
geographic location, made of material form, which has meaning and value (Gieryn,
2000). Trentelman (2009) discussed that scholars have used two overarching concepts
when discussing place, “sense of place” and “place attachment.” Sense of place is an
inclusive concept with “a personal orientation toward place, in which one’s
understanding of place and one’s feelings about place become fused in the context of
environmental meaning” (Hummon, 1992, p. 262). Meanings of a place can be captured
by how attached an individual is to that place (Williams, Patterson & Roggenbuck, 1992).

30
Dissimilar from sense of place, attachment implies a positive relationship with a place
(Trentelman). Place attachment is a multi-dimensional concept that can be understood as
a bond or link that exists between people and places, and is generally understood to form
after an individual has experienced a place (Hidalgo & Hernandez, 2001). Two of these
dimensions, place identity and place dependence, described by Williams and Roggenbuck
(1989), appear most frequently in the literature (Bricker & Kerstetter, 2000; Moore &
Graefe, 1994; Warzecha & Lime, 2001, Williams & Vaske, 2003). Place dependence,
refers to the ability of a place to fulfill a functional need given other alternatives
(Williams et al., 1992). In other words, a place may be valued because an individual
depends on it for its unique ability to aid certain needs and desires. The second
dimension, place identity describes the deep connection between a place and an
individual’s personal identity (Proshansky, 1978). Place identity is defined as “a sub-
structure of the self-identity of the person consisting of broadly conceived cognitions
about the physical world in which the individual lives” (Proshansky, Fabian & Kaminoff,
1983, p. 59). In other words, places allow for individuals to express and affirm their
identities (Kyle, Graefe, & Manning, 2005). The focus here is on how place contributes
to the psychological construct of identity. The two-dimensional model of place
attachment was shown to be valid and generalizable across several settings by Williams
and Vaske (2003).
While most studies focus on place dependence and place identity, Kyle et al.,
2005) introduced social bonding as a third dimension of place attachment. This third
dimension was derived from an interactionist-based theory of place attachment, which
states that past, current, and future interactions with a setting are likely to lead to meaning

31
development of social relationships and ultimately place attachment. According to Kyle
et al. (2005), if meaningful social relationships occur and are maintained in specific
settings, then those settings should share some of the meaning given that they provide the
opportunity for these relationships and shared experiences to occur. In other words, the
meanings associated with a setting do not result only from the physical characteristics or
attributes of the setting but also from the social relationships it supports. In some
instances, social bonding can be the primary source of meaning.
Hammitt, Backlund, and Bixler (2006) developed a five dimensional model of
place attachment. This model incorporated the conventional two dimensions of place
dependence and place identity, as well as three additional dimensions - familiarity,
belongingness, and rootedness. Place familiarity included memories, cognitions and
environmental images that result from acquaintances and remembrances associated with
places (Hammitt et al., 2006) and parallels social bonding described by Kyle et al. (2005).
Place belongingness was described as a feeling of membership or connection with a place
(Mesch and Manor, 1998; Milligan, 1998). Finally, place rootedness was described as a
very strong and focused bond that can be compared to the feeling of fully being at home
(Hammitt et al.). While interesting to note these additional dimensions of place
attachment, this study is exploratory in nature. Therefore, the primary focus here is on
the place dependence, place identity, and social bonding dimensions.
Kyle et al. tested three variations of the place attachment model using the
dimensions of place dependence, place identity, and social bonding, including: (1) a
single factor model in which the three constructs of place identity, place dependence, and
social bonding were loaded onto one factor of place attachment, (2) a first order, three

32
factor correlated model allowing the dimensions to differ, and (3) a second order model
where the three constructs of place attachment were first order factors loading onto a one
second order factor, place attachment. Both of the first two models were supported in
their study; however, based on their review of literature they opted to keep the first order,
three factor correlated model that allowed place identity, place dependence, and social
bonding to differ within individuals. Previous literature suggested similar responses are
not elicited by place identity and place dependence in association with other variables.
Based on Kyle et al.’s study and previous literature, this study will utilize a first order,
three factor correlated model to examine the dimensions of place identity, place
dependence, and social bonding.
Place attachment and tourism
Several studies have explored place attachment in a recreation context (Bricker &
Kerstetter, 2000; Moore & Graefe, 1994; Williams & Roggenbuck, 1989), but this
concept was only recently applied in a tourism context. Traditionally, tourism studies
have focused on characteristics of a destination’s setting and facilities, not attachment
(Hu & Ritchie, 1993). Previously only a handful of studies had looked at a tourists’
destination attachment (Gross, Brien, & Brown, 2008; Gross & Brown, 2008; Hwang,
Lee & Chen, 2005; Hou, Lin & Morais, 2005; Lee, 2001; Lee & Allen, 1999; Yuksel,
Yuksel, & Bilim, 2009), but studies on tourists and attachment have become more
prevalent recently (Prayag & Ryan, 2012; Seabra, Silva, & Abrantes, 2012, Silva,
Kastenholz, & Abrantes, 2013; Tsai, 2012). Studies on tourists and attachment have
concluded that identifying why visitors form attachments with destinations can have
important implications for destination managers and marketers (Gross et al., 2008; Gross

33
& Brown, 2008; Lee & Allen, 1999). Because of its ability to drive high revisit
frequency, place attachment is a distinctive strength of tourism marketing (Tsai, 2012).
Attachment research can capture the emotional meaning that tourists associate with the
places they visit and experience; with tourists attaching symbolic meanings to the
destinations they visit (Lee & Allen, 1999). Attachment to a destination is related to
travel-related variables like destination loyalty (Prayag & Ryan, 2012), involvement
(Gross & Brown, 2008; Seabra et al., 2012), destination attractiveness, and perceptions of
visiting a destination as a family tradition (Lee & Allen, 1999).
An important component in creating place, place meaning, and place attachment
as just discussed, is social interaction (Manzo, 2008; Stokowski, 2002; Stokowski, 2008;
Williams, 2008). Places are not mere geographic locations, but rather fluid and variable
contexts of social interaction and meaning (Stokowski, 2002). A social sense of place
relies on the intersection of social relationships, interactions, and contexts; with language
playing an essential role in the development of place meanings (Stokowski, 2008). When
created through language practices, sense of place is seen as imaginative social
productions. Language can be seen as an integral part of place and place meaning
creation, as people use language to talk about places and speak or act them into existence.
Myth-making, argumentation, visual symbolism, and other narrative used to remember a
place, are examples of how language can be utilized to create places and their meanings.
Shared experiences, stories, and broad cultural narratives are important in
creating, altering, and passing on place meanings within a specific population (Williams,
2008). Manzo’s (2008) review of literature discusses the importance of social
dimensions of place attachment (Clark & Stein, 2003; Hummon, 1992; Stewart, Liebert,
34
& Larkin, 2003). Place meanings develop through social processes regardless of whether
or not there is any agreement on what a place means (Manzo, 2008). Kyle and Johnson’s
(2008) review of literature found that the interactions individuals have with a place can
shape the personal meanings they ascribe to them and their setting preferences
(Eisenhaurer, Krannich, & Blahna, 2000; Hammitt, Backlund, & Bixler, 2004; Milligan,
1998; Tuan, 1977; Vorkinn & Riese, 2001). Places carry meaning and relevance when a
personal connection is made to the place either through personal experiences, cultural
heritage, or both (Kyle & Johnson, 2008).
Research by Kyle, Bricker, Graefe, and Wickham (2004) used a sample of hikers,
boaters, and anglers while examining the relationship between activity involvement and
place attachment. Their findings suggest the possibility for recreationists to form
emotional attachments to settings without being dependent on the setting. The authors
also indicate it could be possible to have extensive involvement with a setting with little
use history and vice versa. These findings are significant for this study as they highlight
the ability to become attached to a place with little in person experience. Furthermore,
Kyle, Mowen, and Tarrant (2004) have provided theoretical support that place
attachments can form prior to visiting a place. The authors argue that positive
psychological, social, and physiological outcomes experienced as a result of viewing
images of natural environments can result in attachments forming over time to those
settings. This study will attempt to gauge attachments in a similar manner. Participants
will be exposed to media content in order to generate positive emotions and greater
mental imagery processing, resulting in a positive increase in place attachment.
35
Linking Emotions to Place Attachment
According to Pullman and Gross (2004), experiences we have are inherently
emotional. Likewise, emotional bonds people create with a place are created through
experiences and referred to as attachments (Hidalgo & Hernandez, 2001). Magai (1999)
compared Bowlby’s (1969) attachment theory to Tomkins (1984) affect theory in a
review of theories of human development, noting the similarities they share with respect
to the importance of emotions and feelings. In a review of the theories, Magai
highlighted that emotions are primarily facial expressions and other behaviors in
Tomkins’s theory, while Bowlby sees these expressions as part of a set of attachment
signals. When studying attachment, emotions experienced during the development of
attachments need to better understood. The understanding of emotions can aid
destination managers and marketers in improving planning decisions and more fully
understanding consumers’ views of potential or existing offers (White, 2005). As an
emotional state is by definition an integral part of place attachment, this study will look to
capture positive emotions as the antecedent of forming an emotional bonds (attachment).
This relationship is expected to be mediated by mental imagery processing.
Place scholars have identified a variety of factors that influence place attachment.
Research has shown that as the importance and pleasure obtained from a recreational
activity increases, so too does participants’ emotional bond with the setting (Kyle,
Graefe, Manning, & Bacon, 2003). Similarly, in Kyle et al.’s (2003) study participants’
emotional bond with the setting, along with their dependence on the setting to provide
specific experiences, also increases as their perceived self-expressive value of the activity
increased. In recreation research, it was found that experience use history positively

36
influences place identity (Moore & Graefe, 1994). Autonomy, an individual’s need for
isolation and solitude, can not only increase outdoor recreation participation, but place
identity as well (Kyle, Bricker et al., 2004). Place dependence is positively influenced by
the distance between a natural setting and the users home (Moore & Graefe, 1994) and
the health benefits an natural setting can provide (Kyle, Mowen, & Tarrant, 2004).
Providing leisure activities for groups in a natural setting can influence the development
of social bonds to a setting (Kyle, Mowen et al., 2004). Level of activity specialization
can influence place attachment (Bricker & Kerstetter, 2000), as can personal commitment
to an activity (Moore & Scott, 2003). Participants with high specialization in Bricker and
Kerstetter’s study identified more with a place than participants with low specialization.
In a tourism context, involvement with a setting (Gross & Brown, 2008), family trips
(Lee, 2001), destination attractiveness (Hou et al., 2005), and service quality (Alexandris,
Kouthouris, & Meligdis, 2006).
Linking Mental Imagery to Place Attachment
While not directly discussed in research to this point, mental imagery can be
understood as an important concept in place attachment research. When people
experience a place they develop a sense of what that place means to them, and therefore
have a tendency to form emotional connections to that place. Meanings of a place can be
captured by how attached an individual is to that place (Williams, Patterson &
Roggenbuck, 1992). Place attachment can be understood as a bond or link that exists
between people and places (Hidalgo & Hernandez, 2001). These attachments motivate
them to return or desire to return to that place again. By definition, visitors who have
experienced a place have formed mental representations of the destination. Knowledge
37
of what factors of a destination result in the formation of attachments can be utilized by
destination marketing organizations. For example, if destinations marketers promote
their destination using images of a particular resource within that destination visitors are
known to depend on and are attached to, then those images could evoke mental imagery
and subsequent feelings of attachment that result in them wanting to make a return visit.
Further, mental imagery could aid place attachment research by stimulating the formation
of attachment prior to a visitor traveling to the destination for the first time through social
interaction as discussed by Stokowski (2002). Williams (2008) further discussed the
importance of social interactions by stressing the importance of shared experiences,
stories, and broad cultural narratives in creating, altering, and passing on place meanings
within a specific population.
Literature has discussed the ability to experience places before visiting them. The
concept of consumption vision is derived from mental imagery (Phillips, Olson, &
Baumgartner, 1995), and these visions are formed by consumers to help them select
suitable alternatives, with several factors influencing the formation of these visions. The
formation of consumption visions allow consumers to mentally “try out” alternatives and
select the one believed to provide the most satisfaction for achieving values and goals.
Through literature suggesting places can be experience through imagery such as
consumption visions, and social interaction, the importance of understand imagery in the
context of place attachment becomes evident. This study examines the influence of
mental imagery on place identity, place dependence, and social bonding as a mediator
between positive emotions and the three constructs of place attachment. As previously
discussed, using media content to generate positive emotions is expected to stimulate

38
increased mental imagery processing. The increased mental imagery processing will
strengthen the emotional bonds participants feel towards a place, thus allowing them to
more strongly identify with that place. Mental imagery processing is not expected to
influence place dependence. Since place dependence is based on a functional needed, the
increase in mental imagery processing that is expected to strengthen emotional ties to the
place will not influence the participants’ perceptions on the destinations ability to meet a
functional need. The media content in this study provides more of an overview of what a
destination has to offer. If the content focused on a specific activity, participant would
have a greater chance of seeing the destination as meeting a functional need. Last, an
increase in mental imagery processing is expected to positively influence social bonding.
The narrative text in combination with the video is expected to increase to ability,
quantity, and vividness of imagery visualized by participants. The narrative is written in
a social context (“My friends and I…”), thus the images generated by participates are
expected to include social interactions at the destination. The next section discusses
technology, and its ability to make these connections possible prior to visiting a
destination.
Mobile Technology & Social Media
The way people recreate and travel is changing with advancements in technology.
Information communication technologies (ICTs) have advanced rapidly over the past
several decades. We have seen advances in terms of the desktop computer to laptops and
tablets, and the mobile phone to smartphones. Advances in ICT are important in tourism.
In the 1990s it was argued that in the future people would no longer be constrained by
desktops, and a hand-held device will provide tourists with everything they need to know

39
about where they are in real-time (Abowd, Atkeson, Hong, Long, Kooper, & Pinkerton,
1997). Fast-forward to today and handheld devices such as smartphones or tablets can be
found everywhere, capable of doing anything a desktop can do, maybe more. Third
generation (3G) mobile services allow for the sharing of multimedia (picture, video) on
mobile devices (Buhalis & O’Connor, 2005), and now we have 4G.
ICT and Mobile Technology Use in Tourism
ICTs play an important role in tourism. Tourism websites are often the first place
tourists go to for information when researching a destination (Schneider & Stangl, 2012),
while tourism organization and destination competitiveness is becoming more and more
defined by use of ICTs (Buhalis & O’Connor, 2005). Recently tourism research has
shifted focus from a supply side use of ICT (Xiang, Gretzel, & Fesenmaier, 2009) to a
demand side (Buhalis, 2003; Kah, Vogt, & MacKay, 2008). Understanding the process
of how tourists gather information online is now more important than understanding what
information is presented to them when they search for it online. MacKay and Vogt’s
(2012) review of literature further highlights the shift. Buhalis and O’Connor (2005)
argued for the development of technologies and business strategies that are consumer
centric in order to meet the needs of today’s sophisticated and experienced travelers.
Motivations, experiences and desires of each tourist is different, therefore tourism
organizations need to develop personalized technology services to address individual
needs.
Technology and Experience
New forms of ICT are affecting the way a tourist experiences a destination. An
effective design of information gathering technologies for tourism allows tourists to be

40
more efficient and provides them with a more enjoyable experience (Brown & Chalmers,
2003). Numerous studies have examined how ICTs influence the tourist experience
(Hyun, Lee, & Hu, 2009; Tussyadiah & Fesenmaier, 2009; Wang, Park, & Fesenmaier,
2011, 2012; Wang & Xiang, 2012). Tussyadiah and Fesenmaier (2009) discussed how
online travel videos that represent an experience of a place can mediate the tourist
experience. Their study found that online travel videos can act as narrative
transportation. This allows a tourist to experience a destination as if they were the
traveler in the video. In addition, the videos stimulate fantasies and daydreams,
providing mental pleasure to viewers. In a discussion on how popular media influences a
tourist’s experience, Kim (2012) stated that tourism “is a visual encounter with a place
that is coded as distant, both spatially and temporally. When one visits an actual place,
he or she might therefore feel that the place seems strangely familiar even though he or
she has never previously visited” (p. 388). This highlights the possibility of a tourist
experiencing a place before having visited it.
Mobile technologies provide a new way for tourists to experience a destination
(Hyun et al, 2009; Wang, Park, & Fesenmaier, 2011, 2012; Wang & Xiang, 2012).
Smartphones specifically have received a lot of attention. Wang, Park, and Fesenmaier
(2012) posited that smartphones could mediate the tourist experience through storytelling
customer reviews. Results from their study found that a tourists’ behavior and emotional
state can be changed by the use of smartphones. Sharing experiences, storing memories,
and gathering information to solve problems can instantly and effectively be supported by
smartphones. Tourism businesses need to be aware of how such smartphone use is
influencing the tourist experience. As Wang et al.’s (2012) model shows, change in

41
emotional states can alter the tourist experience in any phase of participation (see Figure
1).
Figure 1. Model by Wang et al. (2012): Mediation mechanism of smartphones in the
touristic experience.
The nature of travel has particularly changed by the advancement of mobile
technologies (Wang & Xiang, 2012). Mobile technologies allow people to access
customized service to meet their needs (Katsura & Sheldon, 2008). The mobile
applications (apps) market is one of the fastest growing media outlets ever in consumer
technology (Newark-French, 2011). According to Murdock (2011), some of the most
popular travel apps are not travel apps at all, but rather apps for Facebook, Twitter, Skype
and Google. In an analysis of apps Kennedy-Eden and Gretzel (2012) identified 7
categories travel-related apps fall under: navigation, social, marketing, entertainment,

42
security/emergency, transactional, and informational. While at the destination, mobile
devices can provide tourists access to numerous travel-related services (Schmidt-Belz,
Nick, Poslad, & Zipf, 2002). DMOs can utilize stimuli generated by mobile
communications to generate greater destination involvement by mobile tourists. Mobile
technologies such as smartphones can connect tourists or potential tourists to destinations
at any time, from anywhere.
Hyun, Lee, and Hu (2009) examined how virtual tourism experiences can be
facilitated by mobile applications through mobile narratives and mobile text chats. A
virtual experience can be defined as “an experience in a virtual environment using a
computer-mediated environment and is based upon the concept of ‘telepresence’” (Cho,
Wang, & Fesenmaier, 2002, p. 3). According to Hyun et al. (2009), travelers become
immersed in a destination through real-time virtual experiences. Mobile technologies are
at the cutting edge of providing virtual tourism experiences, providing tourists with the
ability to share experiences through face-to-face communications and video
instantaneously. In the pre-trip phase, virtual environments can help tourists gain an
awareness of a destination through promotional messages and downloading photos and
videos, and even take virtual tours when comparing destinations that can provide
potential visitor with a taste of what the destination will offer. Smartphones will continue
to play an increased role in shaping visitor behavior with travelers potentially relying
even more on mobile technology (Wang et al., 2012).
As the literature shows, technology, and in particular videos, have a prevalent
impact on the tourist experience. In fact, all marketers, not just tourism marketers
recognize the potential value and importance of technology, including the use of videos.

43
According to eMarketer (2012, April 23), North American markets spent $40.2 billion in
2011 on the production and distribution of content marketing. Of that, $11.4 billion was
spent on electronic marketing (websites, email, etc.), while traditional print accounted for
the majority of the spending ($23.6 billion), and “other” accounted for $5.2 billion.
Eighty-two percent of North American companies now use websites, following the
increasing use of digital media by their consumers. A noteworthy growing segment of
content marketing is video, used by 52% of the North American companies surveyed.
While 35% of the companies surveyed plan on investing more in website content in 2012,
54% plan to increase investments in video. With the increasing popularity of marketing
through websites and video, marketers need to understand how videos online can
influence consumer behavior, particularly as it becomes increasingly easy and popular to
view video content on mobile devices. In 2012, eMarketer (2012, April 17) estimated
37.8 million travels would use mobile internet or app services to research travel options,
with that number expected to increase to 74.3 million in 2016.
Social Media
Social media is a popular ICT that includes a vast amount of video content.
Social media has become a popular way for consumers to communicate with one another,
but social media use is also becoming popular with tourism organizations (Dwivedi,
Yadav, & Venkatesh, 2012; Milano, Baggio, & Piatrelli, 2011). According to Dwivedi,
et al. (2012) the most popular social media platforms being used by National Tourism
Organizations (NTOs) are Facebook, Twitter, YouTube, and Flickr. Increased social
media use has led to a move away from traditional forms of advertising (Wright, Khanfar,
Harrington, & Kizer, 2010). According to Wright et al. (2010), we are seeing an increase

44
in social media advertising as marketers continue to try to establish more personal
relationships with customers. The fluidity of social media allows marketers to stay in
direct contact with their customers 24 hours a day (Wright et al., 2010). In their study
looking at online users and holiday travel, Parra-Lopez, Gutiérrez-Taño, Díaz-Armas, &
Bulchand-Gidumal (2012) concluded that destinations looking to utilize social media
platforms as a tool need to increase the users’ benefits, including: fun derived from using
the tools, better knowledge of the destination, and cost savings.
The growth in types, uses, and popularity of social media has become extensively
incorporated into tourism. Social media needs to be an integral part of a destination’s
marketing strategy (Guarente, 2010). Beyond advertising to potential visitors, sites like
TripAdvisor or other discussion and forum boards give consumers both the opportunity to
post and review comments on destinations they have visited or are considering visiting.
The world consumers live in is a narrative one where consumers are not only told stories,
they write their own (Pace, 2008). Tourists don’t just use technology to gather
information and aid with travel decisions; they enjoy the interaction with others through
engaging in online social relationships, browsing user-generated content, and posting
their own material (Chung & Buhalis, 2008). Consumers can gather information about a
destination from previous with just a click of the button (or tapping of the screen).
Guarente (2010) highlighted the convergence of social media with smartphones, such as
instant reviews, twitter and foursquare, as the next major technological trend impacting
the tourism industry. This technology allows consumers to access destination specific
information for anywhere in the world at any time.
45
Within social media, travel blogs have become a means of both expressing views
towards a destination previously visited and researching a destination for a future trip
(Gretzel & Yoo, 2008). Travel and tourism blogs can be a powerful source of both
positive and negative word of mouth, and come in a variety of forms, including:
individual, collaborative, corporate, and traditional media (Thevenot, 2007). They can be
informative, entertaining, useful in social networking, and credible as sources of
information (Tan & Chen, 2012), while influencing the decision making process of
prospective tourists by containing recommendations and future intentions to visit (Volo,
2010).
While evidence exists showing the importance of social media in tourism, Xiang
and Gretzel (2010) identified a lack of existing literature addressing the role of social
media in online travel information search. Social media provides a variety of sources that
allow consumers to share their experiences in different ways. Parra-López, Bulchand-
Gidumal, Gutiérrez-Taño, and Díaz-Armas (2011) examined how intentions to use social
media technologies could impact a tourist’s trip organization. Results of their study
found that of the 89% of travelers who took photographs, 41% of them posted trip
photographs online; primarily to SNSs (most popular), instant messaging, online photo
albums, and personal blogs. More than half of the participants posted their photos on
more than one online media outlet. Gretzel and Yoo’s (2008) study found travel reviews
are used to inform accommodation decisions, narrow down choices, get inspired at the
beginning of a trip and confirm decisions, but not so much to inform decisions during a
trip. Reviews helped participants increase their confidence and help reduce risk through
allowing them to image what the destination will be like.

46
Kaplan and Haenlein (2010) differentiated ‘social media’ from concepts such as
Web 2.0 and user-generated content (UGC), and divided applications currently coined
social media into several more specific categories: collaborative projects, blogs, content
communities, social networking sites (SNSs), virtual game worlds, and virtual social
worlds. They identified social media as internet-based applications advanced from the
premises of Web 2.0 which allow UGC to be created and exchanged. Boyd and Ellison
(2008) define SNSs as “web‐based services that allow individuals to (1) construct a
public or semi‐public profile within a bounded system, (2) articulate a list of other users
with whom they share a connection, and (3) view and traverse their list of connections
and those made by others within the system” (p. 211). The main feature of SNSs is
visible user profiles that display a list of friends. Boyd and Ellison discuss that SNSs
differ from previous online communities in that they focus on people as opposed to
interests, with users at the center of their own community. People often join and use
SNSs to foster connections with others and for their entertainment value (Lin & Lu,
2011; Shin, 2010).
Narrative constitutes the majority of social media content. Tussyadiah and
Fesenmaier (2009) advanced the literature on narrative within social media and tourism
by examining the role online travel videos play as mediators of the tourist experience.
Their study is the result of the increased development of technology-based mediators, and
the influence those mediators are having in tourism, including: the internet, smartphones,
and tablets. Tourist experiences can be facilitated by mobile tourist guides, virtual
destinations, virtual travel agents, and images, videos, podcasts, and blogs provided on
destination and destination marketing organization websites. As Tussyadiah and

47
Fesenmaier (2009) indicate, new multimedia features such as text, images, video
streaming, and virtual reality benefit users by enhancing and adding value to their tourism
experience. New consumer-generated media, online content created by online users
themselves, allows the sharing of tourism experiences through social media and SNSs.
Using all videos containing tourism activities in New York City on YouTube.com, results
of a content analysis showed the videos aided participants in recalling past travel
memories, provide mental pleasure by stimulating fantasies and daydreams, and acted as
narrative transportation (Tussyadiah & Fesenmaier, 2009). In their study participants felt
so immersed in the narratives of the videos that they felt transported. Potential tourists
can benefit from the process of information sharing while also having their interest to
travel to a destination intensified through videos. In fact, as Tussyadiah and Fesenmaier
state, “After watching the videos, viewers planning to visit the city may include the
attractions portrayed on the videos, whether the attraction is the Empire State Building or
the subway, in their itineraries. The videos can signify that a particular sight is worth
viewing, as it is portrayed to be gazed at by other tourists” (p. 35).
Viewed from a social psychological perspective, Wang and Fesenmaier (2004)
found social and hedonic benefits were the primary drivers of participation in online
travel communities, while levels of active contribution are based on various incentives
participants may receive. Qu and Lee’s (2011) found that active participation in an
online travel community reinforced participants’ sense of belonging to that community,
which in turn led to strengthened support for the community through positive member
behaviors. Increased interaction also produced a strong sense of identity within the
community. Members who participated passively in community activities, by being a

48
part of the community but not actively communicating, had an intensified community
attachment to the online travel community.
Literature references the ability to experience a place without physically being at
that place. Stokowski (2008) concluded her piece by suggesting “virtual” spaces could
be a useful topic for future analysis in relation to the social construction of place, sense of
place, and place meanings. She posits the question, “What techniques of language use
and conversational practice create senses of place in these settings, and what are the
implications of these settings for social interaction?” (p 56). Through literature
suggesting places can be experienced through media content by stimulating emotions,
generating mental imagery processing, particularly through narrative; this study
demonstrates how visitors to a destination can become attached to that destination before
an actual trip takes place. A combination of media (text and video) was presented to
participants in order to stimulated positive emotions. Experiencing greater positive
emotions was expected to stimulate greater mental imagery, with increased mental
imagery leading to higher levels of place identity and social bonding. Based on the
literature, the current study aims to further explore the influence of technology on
dimensions of place attachment. To do so, this study will examine the impact of viewing
media content on a destination’s Facebook page using a smartphone. Understanding the
influence of mobile technology such as smartphones has become increasingly important
as people are no longer accessing destination content strictly from the confines of their
homes. Literature has shown that smartphones can mediate the tourist experience (Wang,
Park, & Fesenmaier, 2011, 2012; Wang & Xiang, 2012). Here, how smartphones can

49
mediate the tourist experience in a pre-trip context and influence place attachment is
examined.
Based on a review of literature, this study hypothesizes that participants presented
with a narrative story and fast-paced video posted on the Facebook page of an island
destination are expected to experience greater positive emotions. Further, participants
who experience greater positive emotions are expected to generate more elaborative
mental images of the destination. The creation of these mental images will lead to higher
levels of attachment for the dimensions of place identity and social bonding (see Figure
2). No significant relationship is expected between mental imagery and place
dependence. As discussed, place dependence is a functional dependence on a place
(Williams et al., 1992), not contingent upon a visitor’s emotional state, but rather the
place is valued for its ability to fulfill a utilitarian need. Because of this, mental imagery
process is not expected to mediate the relationship between emotions and place
dependence. Therefore, the following hypotheses are proposed:
Hypotheses
H1: Emotions will be positively influenced by narrative text read on the destination’s
Facebook page accessed using a smartphone.
H2: Emotions will be positively influenced by the presence of a video viewed on the
destination’s Facebook page accessed using a smartphone.
H2a: Positive emotions will be greater when narrative text and a fast-paced video are
present.
H3: Emotions will mediate the relationship between the destination’s Facebook page
characteristics (text and video) and mental imagery processing.

50
H3a: Increased levels of positive emotions will positively influence mental imagery
processing.
H4a: Place identity will positively increase through increased mental imagery processing.
H4b: Mental imagery processing will have no significant influence on place dependence.
H4c: Social bonding will positively increase through increased mental imagery
processing.
Figure 2. Conceptual Model.
Narrative Text vs.
Descriptive Text
Fast-Paced Video vs.
Slow-Paced Video
Emotion
s
Mental Imagery
Place Identity
Social Bonding
Place Dependence
H1
H2
H3
H4a
H4b
H4c
H2a
H3a
51
CHAPTER III
METHODS
The preceding literature review makes a strong connection between emotions, mental
imagery, and place attachment, and the current need in tourism research to better
understand the influence of mobile technology and social media on these constructs. This
study builds on previous literature by examining the relationship between emotions,
mental imagery, and place attachment through the use of social media on smartphones.
The following section will discuss the methods used in this study.
Experimental Design
As argued here, understanding visitors’ pre-trip experiences is important.
Knowing how destination videos influence the experience is particularly important.
Travelers who have had less experience with a particular destination tend to explore more
video-included information compared to travelers who prefer a combination of text and
photo information (Lee and Tussyadiah, 2011). As Lee and Tussyadiah (2011) note,
video can contain visual, textual, and oral information simultaneously. Similar to their
study, this study will consider video visual information to differentiate the format from
text. As text and audio will be excluded from videos viewed by participants, this format
is fitting.
A 2 (narrative vs. descriptive) x 2 (fast-paced video vs. slow-paced video)
between-subjects design was used to identify the influence of narrative and video on
emotions, and subsequently mental imagery processing and place attachment. For the
purpose of this experiment a Facebook page was designed to represent an island
destination. The island depicted is an existing island located in the southern Caribbean

52
Sea. It was shown as a sun and sand tourism destination offering numerous sandy
beaches and water activities. The study contained four experimental conditions (fast-
paced video/narrative text, fast-paced video/descriptive text, slow-paced video/narrative
text, slow-paced video/descriptive text). Four different versions of the same destination’s
Facebook page represented the four conditions. All four versions of Facebook page
showed the same profile pictures and cover photos to control for the effect of still images.
Links to the destinations ‘About’ section and photos were left active. Only the pages
cover photo and profile photo could be found in the ‘Photos’ link.
The Facebook page presented participants with a fictitious text entry from a
previous visitor in either descriptive or narrative format:
Narrative Text:
My friends and I got back last night from our first trip to [destination]! Wow!
[destination]is stunningly beautiful! When we arrived at the airport our cab driver
took us to a guesthouse located on one of its gorgeous beaches. We spent our
entire first day at the beach. Sandy trails surrounded by dense tree cover lead us
to secluded beaches. I couldn’t get enough of the endless turquoise water, pink
tinted sand and dark rock formations along the coast. On day two we decided to
go scuba diving. We hired a local tour provider to take us out on the water. We
dove on a shipwreck, saw vibrant reef coral, and colorful fish. I would definitely
recommend this to anyone. Afterwards, we toured a crystal cave with glistening
formations. On our last day I ran down to the beach for one last swim before
heading back to the airport. [Destination] is a special place. I absolutely loved it
and hope to return! ~ Brittany G., [destination] Trip March 5-11, 2013
Descriptive Text:
Visitors planning a trip to [destination] for the first time can prepare for a
relaxing, but adventurous experience. The island offers quick access to the beach
as guests can take advantage of one of a dozen beaches. The island is known for
its sandy beaches, turquoise water, and amazing views. For visitors looking to
escape, the secluded beaches offer fewer crowds and are equally as stunning. The
island offers a variety of activities for everyone to enjoy. For those looking to
explore, guests can embark on a scuba diving expedition to an offshore reef. The
island is surrounded by coral and underwater rock formations. If you have some
time and want to partake in a land-based activity, take a tour of one of the islands

53
pristine caves. However, the islands main attraction is certainly the beaches and
beautiful ocean waters. Visitors of all ages will enjoy taking advantage of the
beaches. [Destination] provides an experience that will leave you wanting to
return. ~ Brittany G., [destination] Trip March 5-11, 2013
As shown, each text entry is similar in length, written by the same person for the same
time period, and discussed the same destination features. As discussed, the difference
lies in how the destination features are presented.
Increased video pace can facilitate a viewers’ arousal and attention (Grabe et al.,
2003; Lang et al., 1999). As Bracken, Petty, Guha, & Rubenking (2010) discussed,
studies often manipulate pace by presenting stimuli in fast-pace and slow-pace versions.
In Bracken et al.’s study comparing screen size and pace, the highest level of immersion
was reported by participants in the fast-paced, small screen condition. In addition, they
found telepresence can also be induced by small screens. Video clips chosen for the
study were based on the criteria of length, speed of motion, and the content representing
the destination. Both versions of the video depicted the same scenes with the short video
showing each scene for approximately half the time. On a smartphone, videos showed up
to participants on the main Facebook wall underneath the text written by a previous
visitor. Appendix C includes screenshots of all the scenes shown to participants. The
following discusses the measures necessary to carry out the purpose of this study.
Measures
Emotions. In this study, emotions are examined as a mediating variable between
the media content presented on the Facebook page and mental imagery processing. As
discussed in the literature, emotions have been measured using numerous scales. Here, a
seven-point Likert scale ranging from 1 (not at all) to 7 (very much), utilizing items from
Mano and Oliver’s (1993) inventory of 40 emotional adjectives to encompass negative

54
and positive emotions generated from participants’ mental images, was used to measure
emotions. The inventory includes: enthusiastic, proud, alert, inspired, determined,
attentive, active, aroused, astonished, surprised, elated, pleased, satisfied, happy, in a
good mood, calm, at rest, relaxed, quiet, still, quiescent, distressed, upset, guilty, scared,
hostile, irritable, ashamed, jittery, afraid, sleepy, sluggish, drowsy, unhappy, sad, blue, in
a bad mood, anxious, fearful and nervous. For the main study included eight emotion.
However, the pre-test included all 40 items. First, the media content in this study was
designed to elicit positive emotions; however, the initial stages of the study included
negative emotions to ensure the media content indeed generated positive emotions.
Second, including too many items in a study can result in participants becoming bored
(Martin & Eroglu, 1993). Items were retained with the goal of unidimensionality (Clark
& Watson, 1995). According to Clark and Watson, unidimensionality should take
precedence over internal consistency, with all interitem correlations moderate in
magnitude. The number of positive emotions included in the study was reduced to eight
based on evidence of unidimensionality as well as internal consistency.
Mental Imagery. The mental imagery construct was measured through an
adaptation of a scale utilized by Go and Gretzel (2010). Go and Gretzel utilized items
from Vorderer, Wirth, Gouveia, Biocca, Saari, Jäncke, et al.’s (2004) special presence
questionnaire and Blajenkova, Kozevnikov, & Motes (2006) mental imagery
questionnaire to create their mental imagery scale. The scale consists of three dimensions
representing 15-items, including: 1) seven items to measure ease of mental imagery, 2)
three items to measure quantity of mental imagery, and 3) five items to measure
vividness (Table 1). Ease of mental imagery and quantity of mental imagery were

55
measured on a seven-point scale ranging from 1 (strongly disagree) to 7 (strongly agree).
Vividness was measured on a seven-point semantic differential scale. The statement
“The mental imagery I experienced was…” preceded vividness items.
Table 1
Mental Imagery
Ease of Mental Imagery
In my mind’s eye, I was able to clearly see the arrangement of the
destination described
I was easily able to imagine being at the destination
It was easy for me to navigate around the destination in my mind
without actually being there.
I had a precisely detailed image of the described surroundings in my
mind’s eye.
I could easily imagine the layout of the destination described
I could picture the destination as though I were actually there
It was very easy for me to imagine the destination clearly
Quantity of Mental Imagery
While looking at the destinations Facebook page, many images came to
my mind
While looking at the destinations Facebook page, very few images
came to my mind
While looking at the destinations Facebook page, a lot of images came
to my mind
Vividness of Mental Imagery
Vivid:Vague
Clear:Unclear
Sharp:Dull
Intense:Weak
Well-defined:Fuzzy Note: Ease of use and quantity items measured along a 7-point scale where 1 = Strongly
disagree and 7 = Strongly agree; Vividness measured on a 7-point semantic scale.
Place Attachment. To measure attachment, this study adapted a scale utilized by
Kyle, Graefe, and Manning (2005). The scale includes three dimensions, with four items
to measure place identity, four items for place dependence, and four items for social
bonding. The 12-item scale was measured on a seven-point Likert-scale ranging from 1
(strongly disagree) to (strongly agree) (Table 2). The dimensions of place identity and

56
place dependence are at the foundation of place attachment research, and reliably and
validly measure how attached an individual is to a place. The dimension of social
bonding has received comparatively less attention. Due to the social means by which
participants are expected to be obtaining information about a destination when planning
their trip, this study aimed to capture the socially derived attachments that may be
formed.
Table 2
Place Attachment
Identity
The destination means a lot to me
I am very attached to this destination
I identify strongly with this destination
I feel no commitment to this destination (R)
Dependence
I would enjoy planning my trip to/traveling to this destination more
than any other destination
I would get more satisfaction out of visiting this destination than from
visiting any other destination
Traveling to this destination is more important than traveling to any
other destination
I wouldn’t substitute any other destination for the type of activities I
could do at this destination
Social Bonding
I have a lot of fond memories about this destination
I have a special connection to this destination and the people who
visit/live there
I wouldn't tell many people about this destination (R)
I would bring my friends to [the destination] Note: Items measured along a 7-point scale where 1 = strongly disagree and 7 =
strongly agree.
R. Reverse coded
Pre-tests
A pre-test was conducted to test scale validity and reliability using a combination
of 20 graduate students and students from the same subject pool as the main study.
Pretest subjects filled out the questionnaire while noting any grammatical errors or

57
confusion in statement wording. The pre-test data was analyzed to test scale reliability
using Cronbach’s alpha, and manipulation checks to assess validity.
Cronbach’s alpha is still one of the mostly popular ways to measure reliability
despite recent criticism (Sijtsma, 2009). Here Cronbach’s alpha was used to access the
internal consistency of items in the constructs of emotions, mental imagery, and place
identity, place dependence, and social bonding. As a rule of thumb, alpha levels above
0.70 were considered acceptable (Nunnally, 1978). After conducting the pre-test it
became evident that very few participants would experience any negative emotions. This
makes sense, and was expected, since the two forms of text and videos were constructed
to elicit positive emotions. Therefore, items measuring negative emotions were removed
following the pre-test. The main study retained eight positive emotions. As previously
discussed, the interitem correlations of these eight were significant in magnitude,
providing support for unidimensionality. For positive emotions using eight items,
Cronbach’s alpha was 0.945 respectively. During the pre-test, several participants noted
that the statement, In my mind’s eye, I was able to clearly see the arrangement of the
destination described, was confusing and also similar to the statement, I could easily
imagine the layout of the destination described. Therefore, based on the pre-test the latter
was removed from the scale. Cronbach’s alpha values for the mental imagery construct
consisting of ease of use (after removing statement one), quantity, and vividness were
0.947, 0.661 and 0.755 respectively. Participants also noted that “many” and “a lot” were
too similar in the quantity construct, thus, “a lot” was changed to “a variety.” The place
attachment construct consisting of place dependence, place identity, and social bonding
generated Cronbach alpha values of 0.820, 0.899, and 0.310 respectively. All constructs
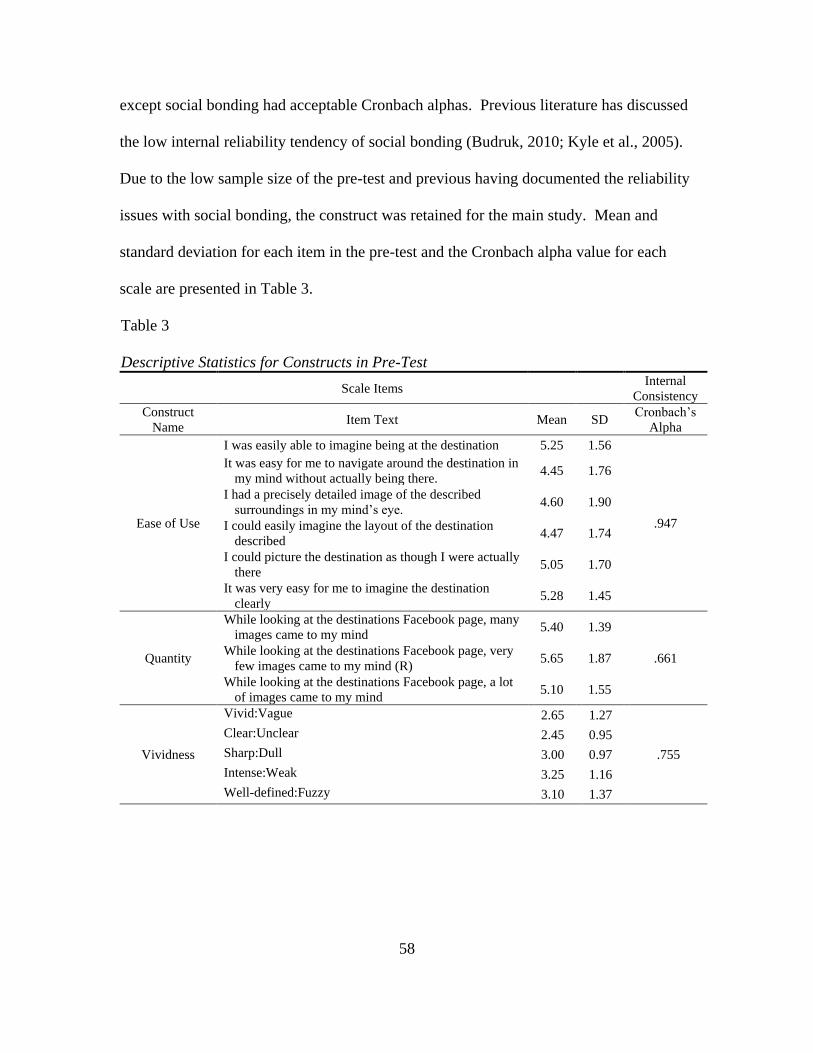
58
except social bonding had acceptable Cronbach alphas. Previous literature has discussed
the low internal reliability tendency of social bonding (Budruk, 2010; Kyle et al., 2005).
Due to the low sample size of the pre-test and previous having documented the reliability
issues with social bonding, the construct was retained for the main study. Mean and
standard deviation for each item in the pre-test and the Cronbach alpha value for each
scale are presented in Table 3.
Table 3
Descriptive Statistics for Constructs in Pre-Test
Scale Items Internal
Consistency
Construct
Name Item Text Mean SD
Cronbach’s
Alpha
Ease of Use
I was easily able to imagine being at the destination 5.25 1.56
.947
It was easy for me to navigate around the destination in
my mind without actually being there. 4.45 1.76
I had a precisely detailed image of the described
surroundings in my mind’s eye. 4.60 1.90
I could easily imagine the layout of the destination
described 4.47 1.74
I could picture the destination as though I were actually
there 5.05 1.70
It was very easy for me to imagine the destination
clearly 5.28 1.45
Quantity
While looking at the destinations Facebook page, many
images came to my mind 5.40 1.39
.661 While looking at the destinations Facebook page, very
few images came to my mind (R) 5.65 1.87
While looking at the destinations Facebook page, a lot
of images came to my mind 5.10 1.55
Vividness
Vivid:Vague 2.65 1.27
.755
Clear:Unclear 2.45 0.95
Sharp:Dull 3.00 0.97
Intense:Weak 3.25 1.16
Well-defined:Fuzzy 3.10 1.37
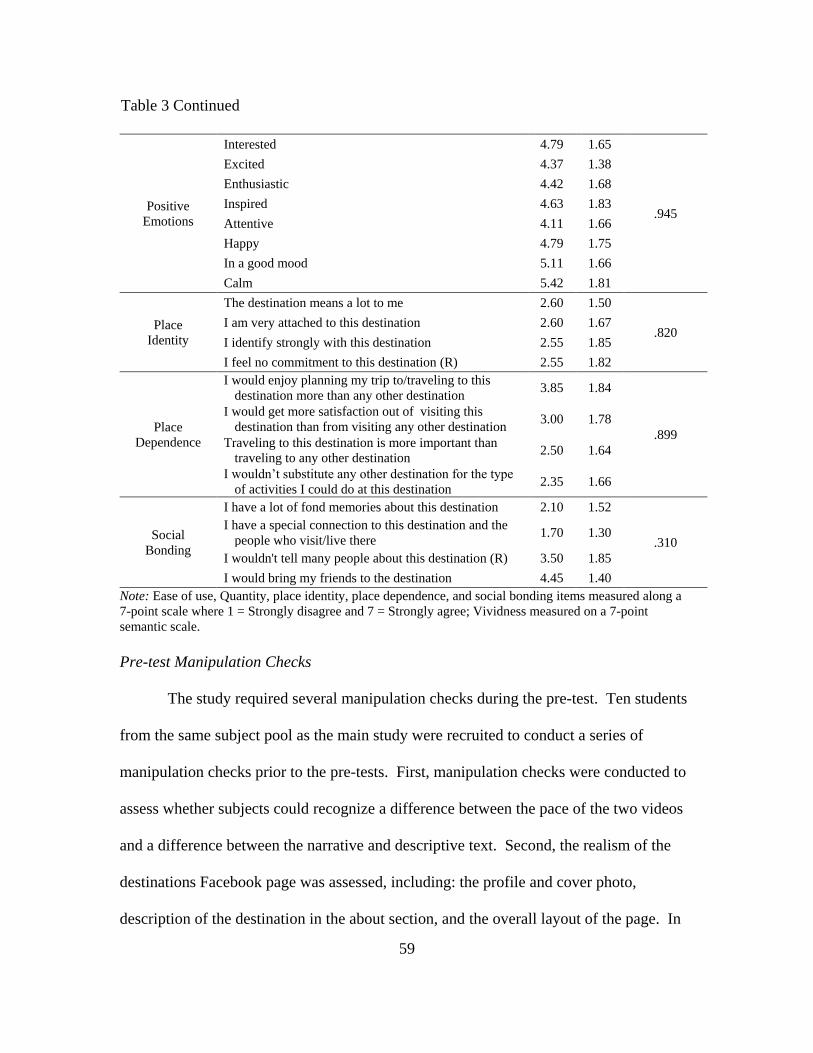
59
Note: Ease of use, Quantity, place identity, place dependence, and social bonding items measured along a
7-point scale where 1 = Strongly disagree and 7 = Strongly agree; Vividness measured on a 7-point
semantic scale.
Pre-test Manipulation Checks
The study required several manipulation checks during the pre-test. Ten students
from the same subject pool as the main study were recruited to conduct a series of
manipulation checks prior to the pre-tests. First, manipulation checks were conducted to
assess whether subjects could recognize a difference between the pace of the two videos
and a difference between the narrative and descriptive text. Second, the realism of the
destinations Facebook page was assessed, including: the profile and cover photo,
description of the destination in the about section, and the overall layout of the page. In
Table 3 Continued
Positive
Emotions
Interested 4.79 1.65
.945
Excited 4.37 1.38
Enthusiastic 4.42 1.68
Inspired 4.63 1.83
Attentive 4.11 1.66
Happy 4.79 1.75
In a good mood 5.11 1.66
Calm 5.42 1.81
Place
Identity
The destination means a lot to me 2.60 1.50
.820 I am very attached to this destination 2.60 1.67
I identify strongly with this destination 2.55 1.85
I feel no commitment to this destination (R) 2.55 1.82
Place
Dependence
I would enjoy planning my trip to/traveling to this
destination more than any other destination 3.85 1.84
.899
I would get more satisfaction out of visiting this
destination than from visiting any other destination 3.00 1.78
Traveling to this destination is more important than
traveling to any other destination 2.50 1.64
I wouldn’t substitute any other destination for the type
of activities I could do at this destination 2.35 1.66
Social
Bonding
I have a lot of fond memories about this destination 2.10 1.52
.310
I have a special connection to this destination and the
people who visit/live there 1.70 1.30
I wouldn't tell many people about this destination (R) 3.50 1.85
I would bring my friends to the destination 4.45 1.40

60
addition, manipulation checks were used to determine if the amount of time it took to
read the text and watch the video was reasonable. After conducting the manipulation
checks, the texts were slightly altered and shortened to make them more realistic, and
scenes were added to the videos for the same reason. Overall, the participants indicated
the Facebook page appeared real. As a manipulation check during the main study,
participants were asked if they watched the video, read the text, and if they had
previously visited the destination depicted in the study.
Participants
As the intent of the study was to test the proposed theoretical model using an
experimental design, a student sample was considered sufficient. Participants were
recruited through primarily recreation and tourism classes, one business class, and from
communal areas at a large southwestern university. As an incentive, participating
students were entered into a drawing to win one of four $20 gift cards. Overall, 417
students out of 452 (92.3%) participated in the study. Some classes were sampled at the
end of the class period. This resulted in a loss of some participants who could not stay
after class to participate. Fourteen classes were used to collect the data. Classes were
randomly assigned to one of the four conditions in three cycles. At the end of the study
two conditions had fewer participants. Therefore, two additional classes were randomly
assigned to one of the two conditions in order to achieve a more equal sample across all
conditions. To avoid confusion experienced by participants during the manipulation
check, participants in the main study were informed that the current video on the page did
not include audio. Despite being provide with instructions to read a post from a previous
visitor describing their trip and then to watch the video, 55 participants indicated on their

61
questionnaire that they either did not read the entry or did not watch the video. Their
responses were excluded from the study. In addition, 13 participants indicated they had
previously visited the destination and hence their responses were excluded, and another
cases were removed during a missing data analysis. In total, 343 responses were usable
for the analysis. In total there were 87 participants in condition 1; 81 in condition 2; 82
in condition 3; and 93 participants in condition 4 after conducting the manipulation
checks and assessing the missing data.
Procedure
All participants were randomly assigned to view one of the four versions of the
destination’s Facebook page and asked to explore the page for approximately 3 minutes.
Participants were asked to open the Facebook app on their smartphone and use the search
feature to find the destination. A thumbnail image of the destinations profile picture was
included on the first page of the survey along with instructions for finding the page to
help participants access it quickly. During the search, subjects were informed that the
main wall of the Facebook page currently highlighted a trip review from a previous
visitor and a video featuring the islands attractions. Upon accessing the destinations
page, subjects were then asked to view the contents of the page. After reading the trip
review and watching the video, subjects were provided with a paper questionnaire to fill
out.
Data Analysis
Prior to analyzing the model, the data will be cleaned and assessed for normality
and homogeneity of variance. Missing data will be dealt with using regression
estimation. Normality is assessed by analyzing skewness and kurtosis, while Levene’s

62
test will be used to determine homogeneity of variance. Descriptive analysis was utilized
to report the statistics of items measured in the study. The hypothesized relationships
between media content, positive emotions, mental imagery processing, and the place
attachment constructs of place identity, place dependence and social bonding were tested
by means of structural equation modeling (SEM) using AMOS 20.0. AMOS 20.0 has the
advantage of being part of the SPSS 21.0 package, allowing for convenient analysis of
this study’s collected data. The process used for constructing and analyzing the structural
equation model is outlined below.
Structural Equation Modeling Process
Structural equation modeling was used in this study to test the hypotheses of the
proposed model. SEM is a statistical technique that establishes measurement models as
well as structural models (Nusair & Hua, 2010). SEM is a combination of factor analysis
and path analysis. SEM is still a relatively new statistical technique that is growing in
popularity in tourism research (Chi & Qu, 2008; Gross & Brown; Lee & Gretzel, 2012;
Mehmetoglu, 2012; Nusair & Hua, 2010). Nusair and Hua (2010) discuss SEM as a
potential tool to advance tourism research by providing a better option to examine
relationships between latent variables in a study. Structural equation modeling allows
researchers a comprehensive way to assess, modify, and further theoretical models and
theory development (Anderson & Gerbing, 1988). The advantage of SEM is its ability to
measure latent constructs and evaluate the paths of the hypothesized relationships
between those constructs (Klem, 2000). Overall, SEM provides the advantage of
estimating a series of multiple regression equations simultaneously with one

63
comprehensive model, integrating latent variables into the analysis while accounting for
measurement errors in the estimation process (Hair, Anderson, Tatham, & Black, 1998).
Anderson and Gerbing (1988) advocated for a two-step approach to structural
equation modeling using nested models and sequential chi-square difference steps as
opposed to a one-step approach in which a measurement model and structural submodels
are estimated simultaneously. The measurement model should be estimated prior to this
simultaneous estimation. The assessment of the measurement model lets the researcher
examine whether the constructs have been measured accurately, while the ensuing
assessment of the structural model allows for the examination of the model’s explanatory
power (Cool, Dierickx, & Jemison, 1989). This two-phase approach in which the
measurement model was assessed prior to the structural model was used in this study.
Parceling
Prior to assessing the measurement model, this study incorporated parcels into the
model for measuring the mental imagery construct. Numerous studies across multiple
disciplines have used parceling in the building of structural equation models (Anderson &
Gerbing, 1984; Bandalos, 2002; Ding, Velicer, & Harlow, 1995; Hall, Snell, & Foust,
1999; Lee et al., 2012). Item parceling was originally presented by Cattell (1956).
Parceling is a process in which item responses are combined into subscales before the
analysis, usually done by averaging or summing items scores into parcel scores (Meade
& Kroustalis, 2005). Several studies have used theoretical and empirical reasons to
combine item-level responses into parcels, which can be used as indicators in structural
equation models (Hall et al., 1999). These parcels reflect a factor dimension or latent
construct. More accurate parameter estimates are produced by parceling (Hall et al.,

64
1999), improve model fit (Bandalos, 2002), deal with problems associated with needing
large sample sizes, address nonnormal measured items (Bagozzi & Heatherton, 1994),
and problems of unreliability (Cattell & Burdsal, 1975). Further research has suggested
that as the number of indicators per factor increase, the value of several commonly used
fit indices can decrease (Anderson & Gerbing, 1984; Ding et al., 1995). This problem
can be avoided by reducing the indicator/factor ratio (Bagozzi & Edwards, 1998). An
increased number of indicators also results in more free parameters, requiring an increase
in sample size (Hall et al., 1999). Parceling becomes attractive since parceling items
reduces the number of indicators, thus reduce the sample size requirements, while also
resolving issues with nonnormal data. When using item parcels in confirmatory factor
analysis (CFA), model estimates and fit can be improved (Meade & Kroustalis (2005).
Ultimately, the appropriateness of sample size in SEM is linked to the size of the model
to be estimated, and more specifically to the number of parameters estimated in the
model (Tanaka, 1987).
Research on parceling has shown that some guidelines should be followed when
using parceling. Bagozzi and Edwards (1998) found item parcels may actually best
represent some multifaceted scales, but suggested that parceled items be unidimensional,
while indicating that parceling rules should also require that items parceled be at the same
level of specificity and be independent observations from items in other parcels.
Parceling should also be based on a strategy as opposed to being done just for the sake of
the model. Hall, Snell, & Foust (1999) parceled items with shared uniqueness based on
the concept of external consistency. The parceling strategy worked when the unmodeled
secondary influence was related to indicators of only one latent construct. The “content

65
oriented strategy” is an approach to parceling in which items are assigned to parceling
based on existing theory and rational judgment, and is the recommended strategy for
creating parcels from multidimensional scales where subsets of items measure a unique
construct. (Hallak, Assaker, & O’Connor, 2012; Landis, Beal, & Tesluk, 2000). In this
study, the content oriented strategy was used to parcel items within the multidimensional
scale of mental imagery. Three parcels were created representing three unique
constructs: ease of use, quantity, and vividness. When parceling items, parceled items
should be unidimensional, with an exploratory factor analysis (EFA) showing the items
have strong factor loading on a single-factor (Hall et al., 1999).
It should be noted that several studies have identified problems with parceling,
ranging from erroneously indicating measurement invariance (Meade & Kroustalis,
2005), parceling together items influenced by different factors and distributions can
created parameter estimate bias (Bandalos, 2008), and masking rather than correcting
model misfit (Bandalos, 2002; Hall et al., 1999). Ding et al. (1995) found that improper
solutions in SEM decreased when N increased, while improper solutions occurred more
frequently when p/r =2 and N was less than 100. Ding et al. recommend using a
minimum of three indicators per factor and a sample size of at least 100 in SEM.
However, their finding for improper solutions when p/r=2 sample sizes less than 100. In
this study, the content oriented strategy was used to avoid common pitfalls of parceling.
In addition, this study’s sample was much greater than 100 (N=343).
Measurement Model
As mentioned, SEM is a two-step process. Before assessing the SEM, the
adequacy of the measurement model is measured using confirmatory factor analysis
66
(CFA). CFA was done in this study using AMOS 20.0. A CFA model identifies the
hypothesized relations of the observed variables to the primary constructs, with the
constructs being allowed to intercorrelate freely (Anderson & Gerbing, 1988).
Relationships among observed variables and latent variables are analyzed and identified
in the measurement model (Nusair & Hua, 2010). Modeling is often considered a four
stage process involving model specification, model estimation, model evaluation, and
model modification (Ullman & Bentler, 2001). In the CFA process the research must
first specify the model by identifying which relationships among variables will be
examined, and how they will be specified in the model based on theoretical or empirical
support (Nusair & Hua, 2010).
Once the CFA model is specified, model modifications are then made if
necessary. Finally, the measurement model is established and assessed for overall model
fit using several measures of goodness-of-fit indices. Choosing the proper goodness-of-
fit measures depends on the parameter estimation method used. The most widely used
estimation method is Maximum Likelihood Estimation (ML), and is often the default
estimator on most software programs (Schermelleh-Engel, Moosbrugger, & Müller,
2003). Consequently, this study employed ML as the parameter estimation method.
Goodness of Fit Indices
SEM uses numerous measures of goodness-of-fit, including: 2,
2/ ratio,
comparative fit index (CFI), normed fit index (NFI), root mean-square error of
approximation (RMSEA), and incremental fit index (IFI). Since no single statistical
significance text exists in SEM that can pinpoint a correct model given the sample data,
multiple goodness-of-fit indices are provide to assess the consistency of the model with

67
the empirical data (Browne & Cudeck, 1993; Hu & Bentler, 1999; Schermelleh-Engel,
Moosbrugger, & Müller, 2003). Only the 2 test is an inferential statistic with a
subsequent significance test from which conclusions can be drawn. A significant 2 in an
indication of an inadequate fit, but its value is influenced by sample size (Bollen, 1989).
Other measures of fit are descriptive, but necessary to account for the drawbacks of 2
(Fan et al., 1999; Schermelleh-Engel et al., 2003). Iacobucci (2010) also points out that
researchers tend to agree that chi-squared (2), the standardized root mean square residual
(SRMR), and the comparative fit index (CFI) should be reported. According to
Schermelleh-Engel et al. (2003), CFI, normal fit index (NFI), goodness-of-fit index
(GFI), and the adjusted goodness-of-fit index (AGFI) are measures often used based on
model comparison. In this study, criteria including GFI ≥ 0.95 (Kline, 1998), AGFI ≥
0.90 (Jöreskog and Sörbom, 1993), IFI ≥ 0.95, NFI ≥ 0.95 (Kaplan, 2000), CFI ≥ 0.95
(Hu & Bentler, 1998), and RMSEA < 0.05 (Brown & Cudeck, 1993) was used to define
good fit. Then, parameters of the specified model are estimated. After assessing the
measurement model, the structural model is assessed.
Dummy Variable Coding
In this study, the independent variables are media content (text and video). These
variables were unobserved in the study, and thus dummy coded variables need to be
created in order to observe their effects. Dummy coding requires assigning numbers to
indicate group membership within a category. In this study there are two categories, text
and video, with two groups in each category. Therefore, two new variables were created
to represent text (1=narrative, 0=descriptive) and video (1=short/fast-paced, 0=long/slow-
paced). The codes of 1’s and 0’s were used to represent group membership within the
68
new variables. A third variable was created to represent the interaction of these two
dummy variables by multiplying them by each other (text × video). Narrative and the
short video were both coded 1 for the purpose of interpreting the results. If the dummy
variables have significant positive correlation with the mediating variable of emotions, or
even directly with mental imagery processing, based on this coding it will be an
indication that narrative text, the short video, or the interaction of the two significantly
influences participants.

69
CHAPTER IV
RESULTS
This study’s results present the hypothesized overall relationships between the influence
of media content (e.g., narrative text and video) on positive emotions, mental imagery
processing, and ultimately on attachment to a destination. It was posited that positive
emotions could be effectively evoked by media content viewed on a destinations
Facebook page using a smartphone. This in turn would generate more elaborative
(greater) mental imagery processing, significantly influencing levels of place
attachments.
First Steps
As previously mentioned, 68 cases were removed based on the inclusion of these
manipulation checks. Students were provided specific instructions to read the text and
watch the video. It may be possible that they did indeed read the text and watched the
video, and erroneously checked these boxes; but regardless, these cases were removed to
maintain the integrity of the study. Upon completing the data collection and removing
cases based on the manipulation check, a missing data analysis was conducted. Thanks
in part to being able to sample a captive audience, there was very little missing data.
Only seven cases were removed in which participants did not respond to multiple items.
Missing data for the remaining cases was replaced using the regression estimation
technique. It should be noted that with how little missing data there was, all techniques
for replacing missing data using SPSS produced the same results.
After replacing the missing data, assumptions of normality and homogeneity of
variance were examined. Table 4 presents the means, standard deviations, skewness, and

70
kurtosis of all variables examined in the study. Skewness and kurtosis were quite low for
all variables. Kline (1998) suggested that in order to assume normality, skewness and
kurtosis should be cutoff at values not exceeding 3.0 and 8.0 respectively. In this study,
univariate skeweness ranged from -.906 to .611 while kurtosis ranged from -.900 to .484
for all variables. No skewness or kurtosis values surpassed -1 or 1. To further ensure the
data is normally distributed, Levene’s test is used to examine homogeneity of variance
(Levene, 1960). Levene’s test is powerful and robust test to nonnormality, and a popular
tool for checking the homogeneity of variance (Gastwirth, Gel, & Miao, 2009). When
used for analysis, a significant result would indicate that the variances are not equal. In
this study, Levene’s test for homogeneity of variance on all variables was not statistically
significant. Based on these results, the analysis proceeded under the assumption that the
data is normally distributed and the scores are roughly similar.
Examining the means in Table 4 provides some insight on the anticipated results.
The means for emotions were fairly high, ranging from 4.34 to 5.27 on a seven-point
Likert scale. Similarly, the means of all items with the mental imagery constructs were
high, ranging from 4.68 to 5.43. These results show that participants were likely to
experience positive emotions while viewing the Facebook page, and were able to easily
generate both many and a variety of vivid images in their mind. Overall, items related to
place attachment had lower means compared to emotions and imagery. Within place
identity and place attachment, not item had a mean greater than 3.49. Based on the scale
used in this study, these findings would suggest that participants were indifferent about
their attachment to the destination. The means of social bonding tell a different story.
Only one item, social bonding 2, had a low mean (2.61). The means of the other three

71
items were 4.34, 4.76, and 5.28. These results suggest that while viewing the Facebook
page was not likely to create any meaning for the individual on a personal level, the
destination was likely to support socially derived meanings. The following will now
analyze the measurement model and SEM to further explore the relationships of the
variables in this study.
Table 4
Descriptive Statistics for Main Study
Construct
Name Item Mean SD Skewness Kurtosis
Cronbach’s
Alpha
Emotions Positive
Emotions
Em1 5.01 1.49 -.446 -.501
.942
Em2 4.45 1.58 -.005 -.766
Em3 4.34 1.61 -.019 -.760
Em4 4.36 1.67 -.161 -.814
Em5 4.41 1.54 -.125 -.446
Em6 5.02 1.38 -.443 -.220
Em7 5.17 1.39 -.636 .159
Em8 5.27 1.37 -.669 .279
Mental
Imagery
Ease of
Imagery
Ease1 5.39 1.49 -.906 .409
.938
Ease2 4.68 1.51 -.138 -.707
Ease3 5.06 1.45 -.387 -.542
Ease4 4.84 1.52 -.316 -.679
Ease5 5.03 1.53 -.415 -.567
Ease6 5.21 1.45 -.531 -.504
Quantity
Quan1 4.80 1.66 -.409 -.816
.791
Quan2 5.10 1.82 -.721 -.732
Quan3 4.69 1.49 -.329 -.606
Vividness
Viv1 5.40 1.46 -.856 .127
.929
Viv2 5.43 1.32 -.741 .004
Viv3 5.24 1.42 -.582 -.349
Viv4 4.69 1.58 -.160 -.818
Viv5 5.16 1.46 -.501 -.427

72
Note: Ease of use, Quantity, place identity, place dependence, and social bonding items measured along a
7-point scale where 1 = Strongly disagree and 7 = Strongly agree; Vividness measured on a 7-point
semantic scale.
As mentioned, this study used parceling to reduce the number of items in the
mental imagery construct. Previously literature suggested that items parceled by on the
same level, with an EFA showing the items load strongly one factor. An EFA of the
mental imagery constructs in this study revealed items indeed loaded strongly on their
respective constructs. Cronbach’s alpha values for the mental imagery construct
consisting of ease of use, quantity, and vividness were 0.938, 0.791 and 0.929
respectively (see Table 4). Made apparent by the reliability of the constructs in Table 4,
the factor loadings of the items onto their respective constructs provide evidence of
convergent validity. However, similar to the pre-test an EFA revealed the reliability of
the social bonding construct to be low (.553), however Cronbach’s alpha was vastly
improved since the pre-test (.310). Low reliability scores is common theme in studies
using the social bonding construct (Budruk, 2010; Kyle et al., 2005). Due to a
consistently low reliability score, further research may be needed to refine the items
Table 4 Continued
Place
Attachment
Place
Identity
PL_ID1 3.38 1.51 .129 -.613
.699
PL_ID2 2.77 1.57 .742 -.289
PL_ID3 3.06 1.40 .271 -.619
PL_ID4 3.43 1.58 .354 -.364
Place
Dependence
PL_Dep1 3.49 1.48 -.076 -.700
.879
PL_Dep2 3.28 1.44 .092 -.662
PL_Dep3 2.79 1.38 .303 -.900
PL_Dep4 2.85 1.48 .522 -.472
Social
Bonding
Soc_Bond1 4.34 1.54 -.393 -.400
.553
Soc_Bond2 2.61 1.34 .611 -.370
Soc_Bond3 4.76 1.47 -.234 -.653
Soc_Bond4 5.28 1.44 -.848 .484

73
included in the social bonding construct. As Kyle et al. kept the social bonding factor in
their study based on Cortina’s (1993) .60 threshold, social bonding will be kept in this
study and assessed in the measurement model.
The results provided in Table 5 suggest that overall there is a strong correlation
among the variables. All emotions and mental imagery are significantly correlated.
However, as probably already hinted at by the means in Table 4, some place attachment
variables are not correlated with several other variables. Particularly, several place
identity and place dependence variables are not correlated with multiple mental imagery
variables. These results suggest that the variables of mental imagery are not related to
those of place identity or place dependence. Similar results can be seen for the
relationship between mental imagery and social bonding; however, many of the mental
imagery variables and social bonding variables are significantly correlated.
While Table 5 presents the correlations of all variables, not all mental imagery
variables are being used in this analysis as they were parceled into three items labeled
‘Ease’, ‘Quantity’, and ‘Vividness’ to reduce the number of indicators in the mental
imagery construct. Table 6 presents the correlation of all variables with the items
parceled for mental imagery. All variables are significantly correlated with a few
exceptions involving Emotions 8 and Social Bonding 3. Based on these results, there is
justification for removing several of these items if necessary when analyzing the
measurement model.
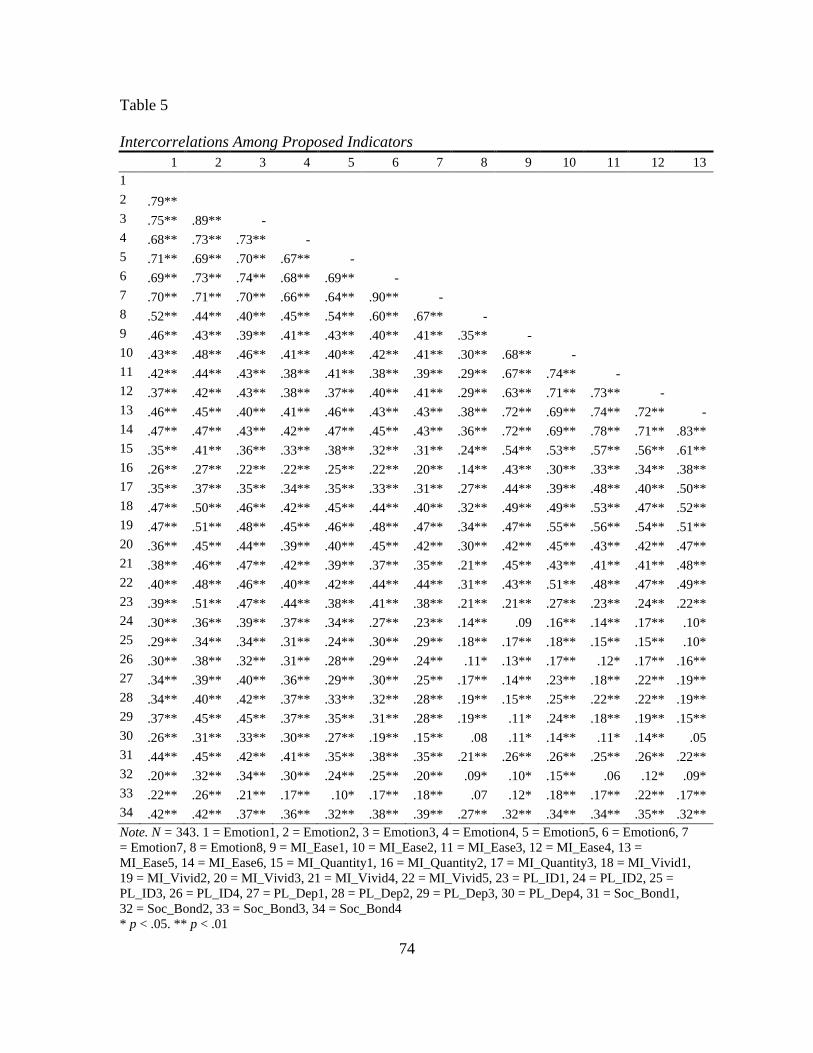
74
Table 5
Intercorrelations Among Proposed Indicators 1 2 3 4 5 6 7 8 9 10 11 12 13
1
2 .79**
3 .75** .89** -
4 .68** .73** .73** -
5 .71** .69** .70** .67** -
6 .69** .73** .74** .68** .69** -
7 .70** .71** .70** .66** .64** .90** -
8 .52** .44** .40** .45** .54** .60** .67** -
9 .46** .43** .39** .41** .43** .40** .41** .35** -
10 .43** .48** .46** .41** .40** .42** .41** .30** .68** -
11 .42** .44** .43** .38** .41** .38** .39** .29** .67** .74** -
12 .37** .42** .43** .38** .37** .40** .41** .29** .63** .71** .73** -
13 .46** .45** .40** .41** .46** .43** .43** .38** .72** .69** .74** .72** -
14 .47** .47** .43** .42** .47** .45** .43** .36** .72** .69** .78** .71** .83**
15 .35** .41** .36** .33** .38** .32** .31** .24** .54** .53** .57** .56** .61**
16 .26** .27** .22** .22** .25** .22** .20** .14** .43** .30** .33** .34** .38**
17 .35** .37** .35** .34** .35** .33** .31** .27** .44** .39** .48** .40** .50**
18 .47** .50** .46** .42** .45** .44** .40** .32** .49** .49** .53** .47** .52**
19 .47** .51** .48** .45** .46** .48** .47** .34** .47** .55** .56** .54** .51**
20 .36** .45** .44** .39** .40** .45** .42** .30** .42** .45** .43** .42** .47**
21 .38** .46** .47** .42** .39** .37** .35** .21** .45** .43** .41** .41** .48**
22 .40** .48** .46** .40** .42** .44** .44** .31** .43** .51** .48** .47** .49**
23 .39** .51** .47** .44** .38** .41** .38** .21** .21** .27** .23** .24** .22**
24 .30** .36** .39** .37** .34** .27** .23** .14** .09 .16** .14** .17** .10*
25 .29** .34** .34** .31** .24** .30** .29** .18** .17** .18** .15** .15** .10*
26 .30** .38** .32** .31** .28** .29** .24** .11* .13** .17** .12* .17** .16**
27 .34** .39** .40** .36** .29** .30** .25** .17** .14** .23** .18** .22** .19**
28 .34** .40** .42** .37** .33** .32** .28** .19** .15** .25** .22** .22** .19**
29 .37** .45** .45** .37** .35** .31** .28** .19** .11* .24** .18** .19** .15**
30 .26** .31** .33** .30** .27** .19** .15** .08 .11* .14** .11* .14** .05
31 .44** .45** .42** .41** .35** .38** .35** .21** .26** .26** .25** .26** .22**
32 .20** .32** .34** .30** .24** .25** .20** .09* .10* .15** .06 .12* .09*
33 .22** .26** .21** .17** .10* .17** .18** .07 .12* .18** .17** .22** .17**
34 .42** .42** .37** .36** .32** .38** .39** .27** .32** .34** .34** .35** .32**
Note. N = 343. 1 = Emotion1, 2 = Emotion2, 3 = Emotion3, 4 = Emotion4, 5 = Emotion5, 6 = Emotion6, 7
= Emotion7, 8 = Emotion8, 9 = MI_Ease1, 10 = MI_Ease2, 11 = MI_Ease3, 12 = MI_Ease4, 13 =
MI_Ease5, 14 = MI_Ease6, 15 = MI_Quantity1, 16 = MI_Quantity2, 17 = MI_Quantity3, 18 = MI_Vivid1,
19 = MI_Vivid2, 20 = MI_Vivid3, 21 = MI_Vivid4, 22 = MI_Vivid5, 23 = PL_ID1, 24 = PL_ID2, 25 =
PL_ID3, 26 = PL_ID4, 27 = PL_Dep1, 28 = PL_Dep2, 29 = PL_Dep3, 30 = PL_Dep4, 31 = Soc_Bond1,
32 = Soc_Bond2, 33 = Soc_Bond3, 34 = Soc_Bond4
* p < .05. ** p < .01

Table 5 Continued
14 15 16 17 18 19 20 21 22 23 24 25 26 27 28 29 30 31 32 33 34
15 .63** -
16 .42** .63** -
17 .55** .64** .42**
18 .54** .49** .41** .46** -
19 .58** .51** .40** .45** .81** -
20 .50** .45** .37** .42** .74** .78** -
21 .48** .45** .35** .44** .69** .62** .69** -
22 .52** .49** .39** .40** .73** .78** .76** .69** -
23 .25** .22** .14** .20** .26** .32** .26** .29** .29** -
24 .14** .11* -.03 .12* .15** .14** .07 .16** .12* .43** -
25 .10* .13** .01 .09 .22** .22** .17** .19** .24** .46** .46** -
26 .14** .19** .20** .10* .18** .17** .12* .22** .18** .34** .30** .24** -
27 .19** .24** .07 .17** .23** .21** .18** .22** .22** .46** .52** .45** .26** -
28 .17** .21** .03 .12* .20** .19** .13** .20** .18** .42** .56** .52** .29** .82** -
29 .14** .18** .02 .14** .20** .19** .14** .19** .23** .66** .55** .51** .34** .68** .67** -
30 .08 .12* .03 .10* .14** .12* .06 .11* .13** .48** .63** .48** .26** .53** .60** .57** -
31 .25** .28** .18** .20** .21** .23** .18** .21** .19** .36** .36** .39** .21** .37** .42** .42** .35** -
32 .10* .10* -.04 .03 .15** .15** .12* .20** .18** .46** .57** .56** .30** .48** .52** .55** .59** .39** -
33 .15** .15** .16** .13** .14** .16** .12* .17** .15** .11* .09* .08 .29** .11* .12* .11* .04 .23** .00 -
34 .35** .30** .22** .27** .32** .34** .30** .27** .28** .31** .18** .26** .16** .37** .33** .30** .16** .36** .13** .29** -
Note. N = 343. 1 = Emotion1, 2 = Emotion2, 3 = Emotion3, 4 = Emotion4, 5 = Emotion5, 6 = Emotion6, 7 = Emotion7, 8 = Emotion8, 9 = MI_Ease1, 10 =
MI_Ease2, 11 = MI_Ease3, 12 = MI_Ease4, 13 = MI_Ease5, 14 = MI_Ease6, 15 = MI_Quantity1, 16 = MI_Quantity2, 17 = MI_Quantity3, 18 = MI_Vivid1, 19
= MI_Vivid2, 20 = MI_Vivid3, 21 = MI_Vivid4, 22 = MI_Vivid5, 23 = PL_ID1, 24 = PL_ID2, 25 = PL_ID3, 26 = PL_ID4, 27 = PL_Dep1, 28 = PL_Dep2, 29 =
PL_Dep3, 30 = PL_Dep4, 31 = Soc_Bond1, 32 = Soc_Bond2, 33 = Soc_Bond3, 34 = Soc_Bond4
* p < .05. ** p < .01
75

Table 6
Intercorrelations Among Proposed Indicators with Parcels 1 2 3 4 5 6 7 8 9 10 11 12 13 14 15 16 17 18 19 20 21 22 23
1. Em1 -
2. Em2 .79** -
3. Em3 .75** .89** -
4. Em4 .68** .73** .73** -
5. Em5 .72** .69** .70** .67** -
6. Em6 .69** .73** .74** .68** .69** -
7. Em7 .70** .71** .70** .66** .65** .90** -
8. Em8 .52** .44** .40** .45** .54** .60** .67** -
9. Ease .51** .52** .49** .47** .50** .48** .48** .38** -
10. Quantity .42** .47** .42** .39** .44** .39** .38** .29** .79** -
11. Vividness .49** .55** .53** .48** .50** .51** .49** .36** .70** .68** -
12. PL_ID1 .39** .51** .47** .44** .38** .41** .38** .21** .28** .26** .32** -
13. PL_ID2 .31** .36** .39** .37** .34** .27** .24** .14** .15** .12* .15** .43** -
14. PL_ID3 .29** .34** .34** .31** .24** .30** .29** .18** .16** .14** .24** .46** .46** -
15. PL_ID4 .30** .38** .32** .31** .28** .29** .24** .11** .18** .20** .20** .34** .30** .24** -
16. PL_Dep1 .34** .39** .40** .36** .29** .30** .25** .18** .22** .24** .24** .46** .52** .45** .26** -
17. PL_Dep2 .34** .40** .42** .38** .33** .32** .28** .19** .23** .21** .21** .42** .56** .52** .29** .82** -
18. PL_Dep3 .37** .45** .45** .37** .35** .31** .28** .19** .19** .19** .22** .66** .55** .51** .34** .68** .67** -
19. PL_Dep4 .26** .31** .33** .30** .27** .19** .15** .08 .12* .13* .13** .48** .63** .48** .26** .53** .60** .57** -
20. Soc_Bond1 .44** .45** .42** .41** .35** .38** .35** .21** .29** .30** .24** .36** .36** .39** .21** .37** .42** .42** .35** -
21. Soc_Bond2 .20** .32** .34** .30** .24** .25** .20** .09* .12* .09* .17** .46** .57** .56** .30** .48** .52** .55** .59** .39** -
22. Soc_Bond3 .22** .26** .21** .17** .10** .17** .18** .07 .19** .18** .17** .11* .09* .08 .29** .11* .12* .11* .04 .23** .00 -
23. Soc_Bond4 .42** .42** .37** .37** .32** .38** .39** .27** .39** .34** .36** .31** .18** .26** .16** .37** .33** .30** .16** .36** .13** .29** -
Note. N = 343. Emotion1, 2 = Emotion2, 3 = Emotion3, 4 = Emotion4, 5 = Emotion5, 6 = Emotion6, 7 = Emotion7, 8 = Emotion8, 9 = Ease, 10 = Quantity, 11 =
Vividness, 12 = PL_ID1, 13 = PL_ID2, 14 = PL_ID3, 15 = PL_ID4, 16 = PL_Dep1, 17 = PL_Dep2, 18 = PL_Dep3, 19 = PL_Dep4, 20 = Soc_Bond1, 21 =
Soc_Bond2, 22 = Soc_Bond3, 23 = Soc_Bond4
* p < .05. ** p < .01
76
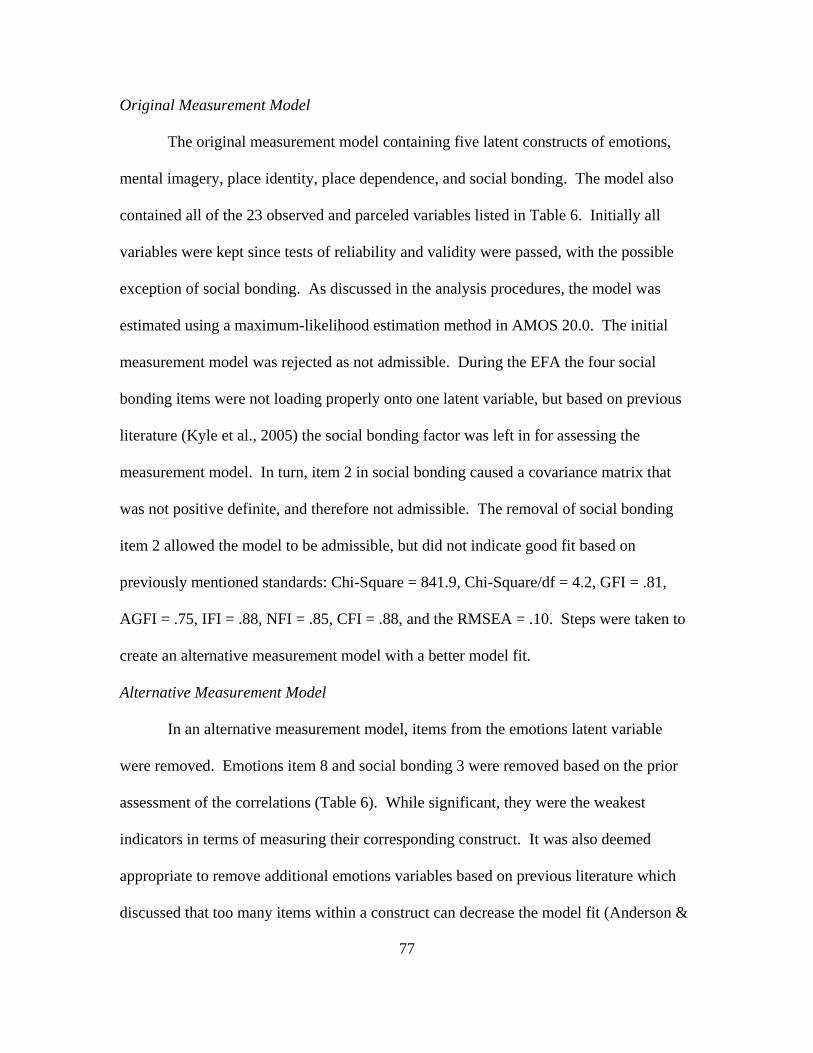
77
Original Measurement Model
The original measurement model containing five latent constructs of emotions,
mental imagery, place identity, place dependence, and social bonding. The model also
contained all of the 23 observed and parceled variables listed in Table 6. Initially all
variables were kept since tests of reliability and validity were passed, with the possible
exception of social bonding. As discussed in the analysis procedures, the model was
estimated using a maximum-likelihood estimation method in AMOS 20.0. The initial
measurement model was rejected as not admissible. During the EFA the four social
bonding items were not loading properly onto one latent variable, but based on previous
literature (Kyle et al., 2005) the social bonding factor was left in for assessing the
measurement model. In turn, item 2 in social bonding caused a covariance matrix that
was not positive definite, and therefore not admissible. The removal of social bonding
item 2 allowed the model to be admissible, but did not indicate good fit based on
previously mentioned standards: Chi-Square = 841.9, Chi-Square/df = 4.2, GFI = .81,
AGFI = .75, IFI = .88, NFI = .85, CFI = .88, and the RMSEA = .10. Steps were taken to
create an alternative measurement model with a better model fit.
Alternative Measurement Model
In an alternative measurement model, items from the emotions latent variable
were removed. Emotions item 8 and social bonding 3 were removed based on the prior
assessment of the correlations (Table 6). While significant, they were the weakest
indicators in terms of measuring their corresponding construct. It was also deemed
appropriate to remove additional emotions variables based on previous literature which
discussed that too many items within a construct can decrease the model fit (Anderson &

78
Gerbing, 1984; Ding et al., 1995). Items were also removed in which the latent variable
explained less variance in, and thus had a weaker relationship to the hypothesized factor.
An alternative measurement model is shown in Figure 3 below. The overall model fit
was greatly improved from the original model: Chi-Square = 124.9, Chi-Square/df = 2.3,
GFI = .95, AGFI = .91, IFI = .98, NFI = .96, CFI = .98, and the RMSEA = .061. In
addition to an improved model fit, the correlations between latent factors were not too
high. As Brown (2006) suggested, problematic discriminant validity occurs when factor
correlations equal or exceed .85. A comparison of the original and alternative
measurement models can be seen in Table 8. All fit indices were improved while 2/
was reduced from 4.2 to 2.3.
Table 7
Alternative Measurement Model Factor Loadings and Construct Reliability
Latent Variable Indicators Factor Loadings Construct
Reliability
Emotions
Emotions 1 .82
.93 Emotions 2 .97
Emotions 3 .92
Mental Imagery
Ease .91
.88 Quantity .86
Vividness .79
Place Identity
PL_ID1 .66
.71 PL_ID2 .69
PL_ID3 .66
Place Dependence PL_PD1 .89
.90 PL_PD2 .92
Social Bonding SOC_BOND1 .63
.53 SOC_BOND4 .58

79
Figure 3. Measurement Model
Emotions
Mental Imagery
Place Identity
Place Dependence
Social Bonding
EM1
EM2
EM3
E
Q
V
PL_ID
1
PL_ID
2
PL_ID
3
PL_PD1
PL_PD2
Soc_B1
Soc_B4
e
e
e
e
e
e
e
e
e
e
e
e
e
.82**
.97**
.92**
.86**
.79**
.91**
.69**
.66**
.66**
.89**
.92**
.63**
.58**
.61**
.33**
.81**
.68**
.77**
.28**
.63**
.46**
.61**
.75**
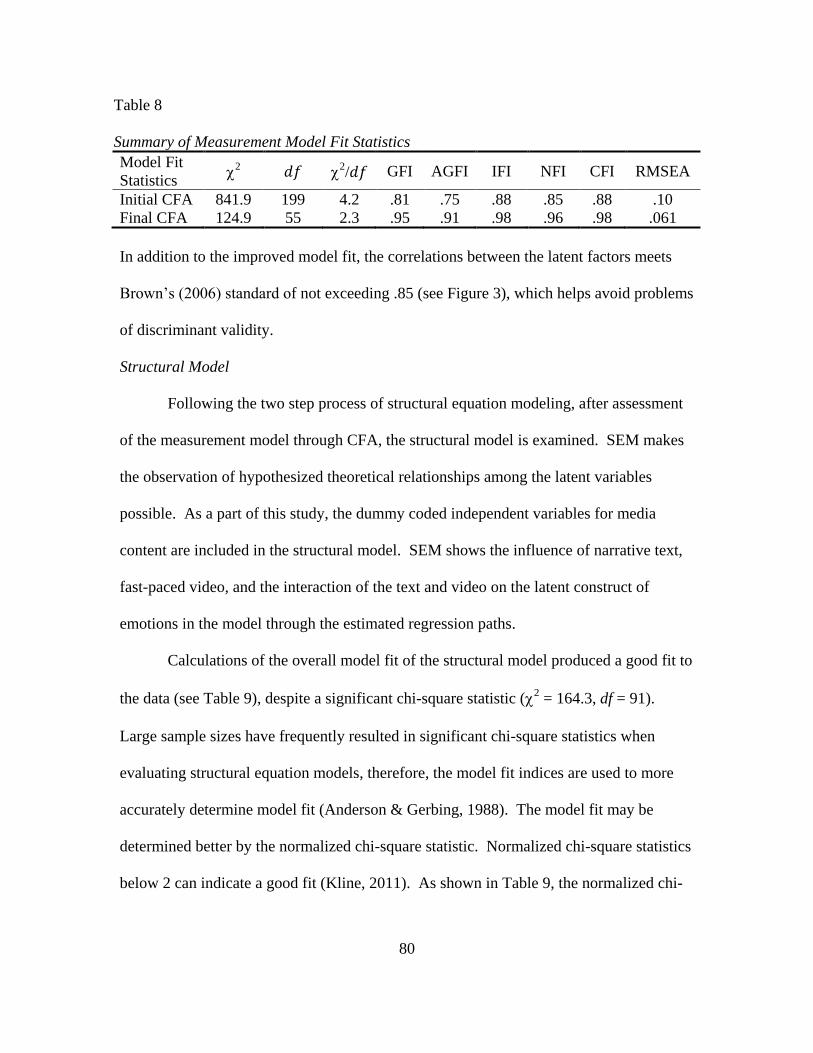
80
Table 8
Summary of Measurement Model Fit Statistics
Model Fit
Statistics
2
2/ GFI AGFI IFI NFI CFI RMSEA
Initial CFA 841.9 199 4.2 .81 .75 .88 .85 .88 .10
Final CFA 124.9 55 2.3 .95 .91 .98 .96 .98 .061
In addition to the improved model fit, the correlations between the latent factors meets
Brown’s (2006) standard of not exceeding .85 (see Figure 3), which helps avoid problems
of discriminant validity.
Structural Model
Following the two step process of structural equation modeling, after assessment
of the measurement model through CFA, the structural model is examined. SEM makes
the observation of hypothesized theoretical relationships among the latent variables
possible. As a part of this study, the dummy coded independent variables for media
content are included in the structural model. SEM shows the influence of narrative text,
fast-paced video, and the interaction of the text and video on the latent construct of
emotions in the model through the estimated regression paths.
Calculations of the overall model fit of the structural model produced a good fit to
the data (see Table 9), despite a significant chi-square statistic (2 = 164.3, df = 91).
Large sample sizes have frequently resulted in significant chi-square statistics when
evaluating structural equation models, therefore, the model fit indices are used to more
accurately determine model fit (Anderson & Gerbing, 1988). The model fit may be
determined better by the normalized chi-square statistic. Normalized chi-square statistics
below 2 can indicate a good fit (Kline, 2011). As shown in Table 9, the normalized chi-

81
square statistic is 1.80, with other fit statistics such as CFI = .98 and RMSEA =.049 also
indicating a good model fit.
Table 9
Model Fit Indices for Structural Model
Model Fit
Statistics
2
2/ GFI AGFI IFI NFI CFI RMSEA
164.3 91 1.80 .94 .92 .98 .95 .98 .049
Utilizing the squared multiple correlation coefficients (R2), an understanding of
how well the model explains the latent constructs can be gained. The squared multiple
correlation coefficients for the respective construct were: emotions (R2 =.02), mental
imagery (R2 =.37), place identity (R
2 =.39), place dependence (R
2 =.21), and social
bonding R2 =.60) (see Figure 4). As can be seen, the model does not explain emotions,
modestly explains mental imagery, place identity, and place dependence, but explains a
fairly large portion of the social bonding construct.
In addition to explaining the constructs, the structural model presents the results
of the hypothesized structural model paths. Two paths between the latent construct were
significant: the path between emotions and mental imagery, and the path between mental
imagery and social bonding (see Figure 4). The paths between mental imagery and the
two place attachment constructs of place identity and place dependence were not
significant. In addition, this study hypothesized that media content, specifically the
interaction between text and video, would influence positive emotions. However, the
results showed no significant relationship between either form of media or the interaction
of media on the emotions construct.

Figure 4. Hypothesized Structural Equation Model
d
d
d
d
d
e
e e
Text
Video
Text X Video
Emotion
s
Mental Imagery
Place Identity
Place Dependence
Social Bonding
e
e e
e
e
e
e
e
e
e
V E Q
PI1
PI2
PI3
SB1
PD2
PD1
SB4
EM1 EM2 EM3
.07(ns)
.79**
-.01(ns)
.92** .12(ns)
.97** .82**
.91** .86**
.00(ns)
-.08(ns)
.24**
.69**
.66**
.61**
R2=.60
.89**
.66**
.58**
.63**
.92**
R2=.21
R2=.39
R2=.37
R2=.02
82

83
Therefore, this structural model did not support hypotheses 1, 1a, or 2. Hypothesis 4 was
partially supported as mental imagery had a significant influence on social bonding
(β=.24, p < .01), but not place identity or place dependence. Hypothesis 3 will be
discussed in the next section.
Testing Mediation
In this study, it was hypothesized that positive emotions would mediate the
relationship between the effects of media content and mental imagery processing
(hypothesis 3). However, as discussed in regards to Figure 4, the independent variables
have no significant influence on the mediating variable of emotions. Thus, as can be seen
in Figure 5, emotions had no significant mediation effect on media content and mental
imagery. The overall model fit of this model differed slightly from the original structural
model (see Table 10). While the results still produced a good model fit, fit indices either
stayed rough the same or worsened slightly.
Table 10
Model Fit Indices for Mediated Structural Model
Model Fit
Statistics
2
2/ GFI AGFI IFI NFI CFI RMSEA
162.8 88 1.85 .94 .91 .98 .95 .98 .050
Summary of Results
In sum, the results did not support the majority of the hypotheses. For hypothesis
H1, H2, and H2a, no significant relationship was found between media content and
positive emotions, including between the interactions of the text and video. Similarly,
and partially as a consequence of hypothesis 1, hypothesis 3 in witch emotions was
expected to mediate the relationship between the influences of media content and mental

84
imagery processing was not supported. However, the model does show a significant
relationship between the emotions construct and mental imagery construct. Finally,
hypothesis 4 was partially supported. No significant relationship was found between
mental imagery processing and place identity (H4a). No significant relationship was
found between mental imagery processing and place dependence, which supports
hypothesis 4b. Last, hypothesis 4c was supported as the model showed a significant
relationship between mental imagery and social bonding.

Figure 5. Mediated Structural Model
d
d
d
d
d
e
e e
Text
Video
Text X Video
Emotion
s
Mental Imagery
Place Identity
Place Dependence
Social Bonding
e
e e
e
e
e
e
e
e
e
E V Q
PI1
PI2
PI3
SB1
PD2
PD1
SB4
EM1 EM2 EM3
.07(ns)
.91**
-.00(ns)
.92** .12(ns)
.97** .82**
.79** .86**
.00(ns)
-.08(ns)
.24**
.69**
.66**
.61**
R2=.60
.89**
.66**
.58**
.63**
.92**
R2=.21
R2=.39
R2=.37
R2=.02
-.00(ns)
-.03(ns)
-.01(ns)
85

86
CHAPTER V
DISCUSSION & CONCLUSION
Theoretically, place attachment can form without having visited a place (Kyle, Mowen et
al., 2004). Then, such attachments to symbolic places conceivably form in the pre-trip
phases of visiting a destination. This study was designed to better grasp how media
content about a destination can influence a potential visitor’s positive emotions and
mental imagery processing, and subsequently influence levels of pre-trip attachment to
that destination. It was posited that the combination of text from a previous visitor and a
video of a destination posted on the destinations Facebook page would stimulate mental
imagery processing through positive emotions when viewing the page. A smartphone
was used to present the media information. The generation of positive emotions and
increased mental imagery processing would result in higher levels of place attachment.
The following presents the contributions and limitations of the results of this study along
with recommendations for future research.
Theoretical Contributions
Previous research on place attachment has examined attachment and it’s
antecedents after visitors have had a chance to experience the destination in person
(Bricker & Kerstetter, 2000; Gross & Brown, 2008; Hidalgo & Hernandez, 2001). As
attachment is the formation of a person’s emotional bond with a place, it stands to reason
that visiting the place will subsequently result in attachment. However, technology is
rapidly changing the way we experience a place. Conceptual evidence exists suggesting
people can become attached to places they have never visited (Plunkett, 2011). Plunkett
examined the potential to become attached to virtual places. The concept of becoming

87
attached to a real destination follows the same premise, arguing that people can become
attached to a place they have not physically traveled to, but have experience with through
various forms of technology, media streams, and stories from past visitors. As
experience starts well before the first visit, this study looked to advance the place
attachment literature by examining individuals’ pre-trip attachments to a destination.
Here, mental imagery processing was measured as an antecedent to attachment.
There was no significant relationship between media content and emotions, nor
media content and mental imagery mediated by emotions. At first, this finding was
surprising. Numerous studies have made the connection between media content and
emotions (Zaichkowsky, 1994), and media content and mental imagery (Lee & Gretzel,
2012). However, a review of the theories used in this study sheds some light on these
findings. While both dual coding theory and multimedia learning theory suggest that
media is most effective when presented in two forms, the media needs to be presented
simultaneously (combined). In this study, two forms of media (text and video) were
presented on the same Facebook page; however, participants read the previous travelers
trip review, and then watched the video. Therefore, opposed to receiving stimulus from
the combined effect of the media, participants received stimulus from the text and then
from the video. Even though the contented described in the text was mirrored in the
video, a disconnect occurred for participants.
While no significant link was found as a result of the type of media present to
participants, there was a significant positive relationship between emotions and mental
imagery. Previously research has linked mental imagery and emotions (Holmes &
Mathews, 2005; Kosslyn, 1994; Schneider & Stangl, 2012), but has primarily examined

88
mental imagery processing as an antecedent to emotions. Emotions in mental imagery
research needs to be better understood (Kossyln, 1994). According to Goossens (2000),
the concepts of imagery, feelings, and memories are all interrelated. In this study,
emotion is suggested as an antecedent to mental imagery. The findings suggest that an
increase in positive emotions can significantly increase mental imagery processing. The
formation of emotions and mental imagery in the context of this study is a quick process.
Since previously literature suggests mental imagery processing stimulates emotions, and
this study shows the creation of positive emotions leads to greater imagery processing,
the processes of forming emotions and stimulating mental imagery processing could be a
simultaneous one.
Mental imagery processing and place identity were not significantly related.
According to Proshansky (1978), place identity is strong when deep connection between
a place and an individual’s personal identity are formed. In this study, only one brief trip
review from a previous visitor along with a brief video was presented to the participants.
Individuals use places to express and affirm their identities (Kyle, Graefe, & Manning,
2005). Here, there was a limited opportunity in both time and content made available
that was needed to form a deep connection, and that could provide the ability to explore a
place and confirm that it affirms ones identity. This ultimately could have resulted in a
non-significant result.
As expected, no significant relationship was found between mental imagery
processing and place dependence. While place attachment is considered an emotional
bond between a person and a place, the dimension of place dependence is not inherently
emotional, but functional (Williams et al., 1992). In this study, while emotions

89
significantly influenced mental imagery processing, it did not, and was expected not to,
translate into a significant relationship between mental imagery processing and place
dependence. Since place dependence is based on a functional need, participants were not
expected to be attached to the destination. They have never been to the destination;
therefore, they are not dependent upon it for the resources it offers. Place dependence
can still have an emotional component, but those emotions would be experienced when a
place is altered or no longer available, thus changing the ability of the visitor to meet a
specific functional need.
A significant relationship was found between mental imagery and social bonding.
A common link appears to exist between these constructs, memory. Both mental imagery
and social bonding revolve around the developing or processing of memory. Mental
imagery research, utilizing both dual coding theory and multimedia learning theory,
involves the processing of information in memory (Mayer, 2001; Paivio, 1971). Mental
imagery by definition is “(1) a process (not a structure) by which (2) sensory information
is represented in working memory” (MacInnis & Price, 1987, p. 473); whereas, items
within the social bonding construct specifically as respondents to recall memories (I have
a lot of fond memories about this destination), and relates to the social memories that can
be developed through visiting a destination, and then forming an attachment to that
destination through social bonds (Kyle et al., 2005). This natural link between mental
imagery and social bonding became evident in the results of the structural model. Based
on this finding, it could be suggested that the process of forming social bonds with a
place relies on the ability of an individual to make a mental connection that a place holds
social value. Ultimately, because of a mental image formed, one may identify the social

90
value of a place and form a social bond to that place, without having experienced the
place in person.
Practical Contributions
While not statistically significant, the relationship between text and emotions had
a p value (p = .122) three times lower than the p value (p = .386) of video to emotions.
The literature strongly supports narrative text’s ability to influence emotions (Green &
Dill, 2013), mental imagery (Green & Brock, 2000), and attachment (Williams, 2008).
Attachment research can capture the emotional meaning that tourists associate with the
places they visit and experience, with tourists attaching symbolic meanings to those
destinations (Lee & Allen, 1999). Because of its ability to drive high revisit frequency,
place attachment is a distinctive strength of tourism marketing (Tsai, 2012). Multimedia
features such as text, images, video streaming, and virtual reality benefit users by
enhancing and adding value to their tourism experience (Tussyadiah et al., 2011), and as
attachment is traditionally based on experience, it stands to reason that attachments begin
to form through pre-trip experiences. Gretzel and Yoo’s (2008) study found travel
reviews are used to inform accommodation decisions, narrow down choices, get inspired
at the beginning of a trip and confirm decisions. Reviews helped participants increase
their confidence and help reduce risk through allowing them to imagine what the
destination will be like. Destination marketers should consider the inclusion of narrative
text in their marketing strategies to attract potential tourists, if they are not doing so
already. Not only using, but understanding narratives can help markets understand the
attraction of a destination (Guthrie & Anderson, 2010).

91
Although many of the hypotheses in this study were not supported, there are some
practical contributions that should be considered. Previous research evidence supports
the influence of mental imagery processing on tourists' selection of a destination
(MacInnis & Price, 1990; Miller & Stoica, 2004; Oh, Fiore, & Jeoung, 2007; Lee et al,
2010; Lee & Gretzel, 2012), and understanding emotions can aid destination managers
and marketers in improving planning decisions and more fully understanding consumers’
views of potential or existing offers (White, 2005). A significant relationship was found
between emotions and mental imagery in this study, with partial support found between
the relationship of mental imagery and the place attachment constructs. The results of
this study suggest that including narratives may be more important than including videos.
The results also show a significant relationship between mental imagery and social
bonding. These results point to one key thing destination markets should be aware of
when targeting potential visitors, other people. This study highlights the ability of other
people to influence potential visitors in two ways: through the content previous visitors
write about a destination in narrative format, and the ability of other people to foster
social interactions desired by potential visitors. Studies have shown the popularity of
electronic word-of-mouth (eWOM) and its ability to influence the customer decision
process (Doh & Hwang, 2009; Gruen, Osmonbekov, & Czaplewski, 2006; Pan & Chiou,
2011). Based on this study, destination markets should pay particular attention to content
that is written in a narrative form.
The finding linking mental imagery and social bonding also has implications for
destination marketers. People and places are inherently linked through social interaction
(Manzo, 2008; Stokowski, 2002; Stokowski, 2008; Williams, 2008). It could be

92
suggested that if destinations promote themselves in a way which makes it possible for
potential visitors to form mental images of how they could bond with others, then their
perceptions regarding the memories that could be created through visiting the destination
could lead to greater interest in visiting that destination. And as Wang, Park, and
Fesenmaier (2012) found, through shared experiences and storing memories, and
gathering information, a tourists’ behavior and emotional state can be changed by the use
of smartphones. The relationship between emotions and mental imagery, and mental
imagery and social bonding in this study was found by having participants few a
destinations Facebook page on a smartphone. Technology is used by tourists because
they enjoy the interactions it offers (Chung & Buhalis, 2008), thus the capabilities of
these smaller devices should not be underestimated. Highlighting destination features
that spotlight social interaction opportunities is strongly suggested here. Potential visitors
should easily be able to access this content using a smartphone.
Limitations
This research utilized a sun and sand tourism destination. Participants included in
this study may prefer a different setting and therefore feel less attached regardless of the
narrative or video shown. As a pre-test participant mentioned, he prefers more of a
wilderness setting where he can camp, hunt, or fish, and therefore felt no attachment for
the destination portrayed. Another student commented on the survey, saying, “Nothing
against [the destination], it sounds great! I just love the Western European countries
more. Sounds lovely though!” Participants such as this could have a pre-conceived bias
towards the type of destination being depicted, and thus be uninterested in it from the
start. Conversely, other participants have this reaction: “I’m surprised I have never

93
heard of this place. It is very beautiful and the video made it look pretty populated!” This
could also be a limitation of using a student sample with varying interests and
motivations to participate. While it was deemed appropriate to use a student sample for
this experimental study, how their interest level might affected their participation is
unknown.
There was a discrepancy in the way the Facebook page appeared to various
participants on the smartphones used. As the study progressed, it became evident that
depending on the phone model and/or version of Facebook software on a participant’s
phone led to the Facebook page appearing in slightly different layouts. However, these
variations were not expected to affect the study as the same images appeared to all
participants, and the text entries from a previous visitor and the videos appeared the same
regardless of how the overall page looked. Overall, a strength of this study is the use of
smartphones. Even though discrepancies may occur between models, the way content
was presented mimics how many potential visitors now access content; through Facebook
using a smartphone.
Future Research
After reviewing the implications and limitations of this study, there are several
suggestions that can be made for future research. Future research should analyze pre-trip
attachment of visitors who are actively in the pre-trip planning stages of visiting a
destination for the first time. Since some participants indicated that the type of
destination did not appeal to them, it could influence their emotions and capability of
generating mental images of the destination. Next, while it was noted that the type of
smartphone was not expected to influence this study, future research should examine the

94
influence of a variety of mobile devices. When potential visitors research a destination
away from their computer, these days smartphones are just one of their options as many
now use tablet devices as well. Research has shown that smaller screens can influence
things such as immersion and telepresence (Bracken et al., 2010), how small is too small?
Future research should examine how prolonged exposure to destination content, as
mediated through the use of a smartphone, can influence emotions, mental imagery
processing, place identity, place dependence, and social bonding.
Future research should examine the relationship of these variables utilizing a
population that is planning on traveling to a destination for the first time. In addition,
assessing pre- and post-test results of this sample will provide a better understanding of
how much levels of attachment can bet attributed to pre-trip experiences versus
experiencing the destination in person. Continued research examining antecedents will
be able to ascertain to degree attachments are formed prior to experience a destination.
Concluding Remarks
In conclusion, this study was just the first step in examining the ability to form
attachments prior to visiting a destination. A great deal of literature presented here
suggests the potential for these place attachments to exist, but this is the first known study
to attempt to measure those levels of place attachment with the constructs of place
identity, place dependence, and social bonding. The one significant link between mental
imagery and social bonding suggests this research is heading the right direction.
Furthermore, while not a significant finding, there is the potential that narrative trip
reviews from previous travelers plays a greater role than what was seen in this study. As
a whole, the ability of previous visitors to influence the place attachment of potential

95
visitors is intriguing, and deserves further attention. This line of research is in its infancy
stages. As technology continues to advance at a rapid pace and potential visitors
continue to consumer more and more information about destinations prior to visiting
them, it can be expect that more findings will begin to emerge.
96
REFERENCES
Abowd, G. D., Atkeson, C. G., Hong, J., Long, S., Kooper, R., & Pinkerton, M. (1997).
Cyberguide: A mobile context‐ aware tour guide. Wireless Networks, 3(5), 421-
433.
Adam, M. T. P., Gamer, M., Krämer, J., & Weinhardt, C. (2011). Measuring emotions in
electronic markets. Proceedings of the International Conference on Information
Systems (ICIS), 1-19.
Adaval, R., & Wyers, Jr., R. S. (1998). The role of narratives in consumer information
processing. Journal of Consumer Psychology, 7(3), 207-245.
Alexandris, K., Kouthouris, C., & Meligdis, A. (2006). Increasing customers' loyalty in a
skiing resort: The contribution of place attachment and service quality.
International Journal of Contemporary Hospitality Management, 18(5), 414-425.
Anderson, J. C., & Gerbing, D. W. (1984). The effect of sampling error on convergence,
improper solutions, and goodness-of-fit indices for maximum likelihood
confirmatory factor analysis. Psychometrika, 49, 155-172.
Anderson, J. C., & Gerbing, D. W. (1988). Structural equation modeling in practice: A
review and recommended two-step approach. Psychological bulletin, 103(3), 411-
423.
Averill, J. R. (1982). Anger and aggression: An essay on emotion. New York: Springer.
Bagozzi, R. P., & Edwards, J. R. (1998). A general approach for representing constructs
in organizational research. Organizational Research Methods, 1, 45-87.
Bagozzi, R. P., Gopinath, M., & Nyer, P. U. (1999). The role of emotions in marketing.
Journal of the Academy of Marketing Science, 27(2), 184-206.
Bagozzi, R. P., & Heatherton, T. F. (1994). A general approach to representing
multifaceted personality constructs: Application to state self-esteem. Structural
Equation Modeling, 1, 35-67.
Bandalos, D. L. (2002). The effects of item parceling on goodness-of-fit and parameter
estimate bias in structural equation modeling. Structural Equation Modeling, 9,
78-102.
Bandalos, D. L. (2008). Is parceling really necessary? A comparison of results from item
parceling and categorical variable methodology. Structural Equation Modeling,
15(2), 211-240.

97
Baron‐Cohen, S., & Cross, P. (1992). Reading the eyes: Evidence for the role of
perception in the development of a theory of mind. Mind & Language, 7(1‐2),
172-186.
Barsky, J., & Nash, L. (2002). Evoking emotion: Affective keys to hotel loyalty. The
Cornell Hotel and Restaurant Administration Quarterly, 43(1), 39-46.
Batson, C. D., Shaw, L. L., & Oleson, K. C. (1992). Differentiating affect, mood, and
emotion: Toward functionally based conceptual distinctions.
Bigné, J. E., & Andreu, L. (2004). Emotions in segmentation: An empirical study. Annals
of Tourism Research, 31(3), 682-696.
Biocca, F., & Harms, C. (2002). Defining and measuring social presence: Contribution to
the networked minds theory and measure. Proceedings of PRESENCE, 2002, 1-
36.
Blajenkova, O., Kozhevnikov, M., & Motes, M. A. (2006). Object‐spatial imagery: a new
self‐report imagery questionnaire. Applied Cognitive Psychology, 20(2), 239-263.
Bowlby, J. (1969). Attachment and loss v. 3 (Vol. 1). Random House.
Boyd, D. M., & Ellison, N. B. (2008). Social network sites: Definition, history, and
scholarship. Journal of Computer-Mediated Communication, 13(1), 210-230.
Bracken, C. C., Pettey, G., Guha, T., & Rubenking, B. E. (2010). Sounding out small
screens and telepresence. Journal of Media Psychology: Theories, Methods, and
Applications, 22(3), 125-137.
Bricker, K. S., & Kerstetter, D. L. (2000). Level of specialization and place attachment:
An exploratory study of whitewater recreationists. Leisure Sciences, 22(4), 233-
257.
Brown, B., & Chalmers, M. (2003). Tourism and mobile technology. Proceedings of the
Eighth Conference on European Conference on Computer Supported Cooperative
Work, 335-354.
Brown, T. A. (2006). Confirmatory factor analysis for applied research. Guilford Press.
Browne, M. W., & Cudeck, R. (1993). Alternative ways of assessing model fit. In Bollen,
K. A. Long, J. S. (Eds.), Testing structural equation models. Newbury Park: Sage
Publications.

98
Brunner-Sperdin, A., Peters, M., & Strobl, A. (2012). It is all about the emotional state:
Managing tourists’ experiences. International Journal of Hospitality
Management, 31(1), 23-30.
Budruk, M. (2010). Cross-language measurement equivalence of the place attachment
scale: A multigroup confirmatory factor analysis approach. Journal of Leisure
Research, 42(1), 24-42.
Buhalis, D. (2003). eTourism: Information technology for strategic tourism management
Prentice Hall.
Buhalis, D., & O'Connor, P. (2005). Information communication technology
revolutionizing tourism. Tourism Recreation Research, 30, 7-16.
Burns, A. C., Biswas, A., & Babin, L. A. (1993). The operation of visual imagery as a
mediator of advertising effects. Journal of Advertising, 22(2), 71-85.
Cattell, R. B. (1956). Personality and motivation structure and measurement. New York,
NY: World Book Co.
Cattell, R. B., & Burdsal, C. A. (1975). The radial parcel double factoring design: A
solution to the item-vs.-parcel controversy. Multivariate Behavioral Research,
10(2), 165-179.
Cheng, T. M., Wu, H. C., & Huang, L. M. (2012). The influence of place attachment on
the relationship between destination attractiveness and environmentally
responsible behavior for island tourism in Penghu. .Journal of Sustainable
Tourism, 1-22.
Chhetri, P., Arrowsmith, C., & Jackson, M. (2004). Determining hiking experiences in
nature-based tourist destinations. Tourism Management, 25(1), 31-43.
Chi, C., & Qu, H. (2008). Examining the structural relationships of destination image,
tourist satisfaction and destination loyalty: an integrated approach. Tourism
Management, 29(4), 624-636.
Cho, Y. H., Wang, Y., & Fesenmaier, D. R. (2002). Searching for experiences: The web-
based virtual tour in tourism marketing. Journal of Travel & Tourism Marketing,
12(4), 1-17.
Chung, J. Y., & Buhalis, D. (2008). Web 2.0: A study of online travel community. In P.
O'Connor, W. Höpken, & U. Gretzel (Eds.), Information and Communication
Technologies in Tourism 2008, 70-81.

99
Clark, J. K., & Stein, T. V. (2003). Incorporating the natural landscape within an
assessment of community attachment. Forest Service, 49(6), 867-876.
Clark, L. A., & Watson, D. (1995). Constructing validity: Basic issues in objective scale
development. Psychological Assessment, 7(3), 309.
Cool, K., Dierickx, I., & Jemison, D. (1989). Business strategy, market structure and risk‐return relationships: A structural approach. Strategic Management Journal, 10(6),
507-522.
Cortina, J. M. (1993). What is coefficient alpha? An examination of theory and
applications. Journal of Applied Psychology, 78(1), 98.
Currie, G. (1995). Visual imagery as the simulation of vision. Mind & Language, 10(1‐2), 25-44.
Daft, R. L., & Lengel, R. H. (1986). Organizational information requirements, media
richness and structural design. Management Science, 32(5), 554-571.
Daft, R. L., Lengel, R. H., & Trevino, L. K. (1987). Message equivocality, media
selection, and manager performance: Implications for information systems. MIS
Quarterly, 355-366.
Dennis, A. R., & Kinney, S. T. (1998). Testing media richness theory in the new media:
The effects of cues, feedback, and task equivocality. Information Systems
Research, 9(3), 256-274.
Dennis, A. R., & Valacich, J. S. (1999). Rethinking media richness: Towards a theory of
media synchronicity. In System Sciences, 1999. HICSS-32. Proceedings of the
32nd Annual Hawaii International Conference on (pp. 10-pp). IEEE.
Ding, L., Velicer, W. F., & Harlow, L. L. (1995). Effects of estimation methods, number
of indicators per factor, and improper solutions on structural equation modeling fit
indices. Structural Equation Modeling: A Multidisciplinary Journal, 2(2), 119-143.
Doh, S. J., & Hwang, J. S. (2009). How consumers evaluate eWOM (electronic word-of-
mouth) messages. CyberPsychology & Behavior, 12(2), 193-197.
Dwivedi, M., Yadav, A., & Venkatesh, U. (2012). Use of social media by national
tourism organizations: A preliminary analysis. Information Technology &
Tourism, 13(2), 93-103.
Eisenhaurer, B. W., Krannich, R. S., & Blahna, D. J. (2000). Attachments to special
places on public lands: an analysis of activities, reason for attachments, and
community connections. Society and Natural Resources, 13, 421-441.

100
eMarketer (2012, April 17). Mobile use spurs digital travel sales. Retrieved from
http://www.emarketer.com/Article/Mobile-Use-Spurs-Digital-Travel-
Sales/1008979
eMarketer (2012, April 23). Video is a rising star among content marketers. Retrieved
from http://www.emarketer.com/Article/Video-Rising-Star-Among-Content-
Marketers/1008991
Escalas, J. E. (2004a). Imagine yourself in the product: mental stimulation, narrative
transportation, and persuasion. Journal of Advertising, 33, 37-48.
Escalas, J. E. (2004b). Narrative processing: building consumer connections to brands.
Journal of Consumer Psychology, 14, 168-180.
Escalas, J. E., Moore, M. C., & Britton, J. E. (2004). Fishing for feelings? Hooking
viewers helps! Journal of Consumer Psychology, 14, 105-114.
Farber, M. E., & Hall, T. E. (2007). Emotion and environment: Visitors' extraordinary
experiences along the Dalton highway in Alaska. Journal of Leisure Research,
39(2), 248-270.
Frijda, N. H. (1986). The emotions: Studies in emotion and social interaction. New York:
Cambridge University Press. (1989)," Aesthetic Emotion and Reality," American
Psychologist, 44, 1546-1547.
Frikha, A., & Khrouf, L. (2013). Scaling mental imagery: an application to commercial
web sites. International Journal of Consumer Studies, 37, 401-413.
Gartner, W. C. (2004). Rural tourism development in the USA. International Journal of
Tourism Research, 6(3), 151-164.
Gastwirth, J. L., Gel, Y. R., & Miao, W. (2009). The impact of Levene’s test of equality
of variances on statistical theory and practice. Statistical Science, 24(3), 343-360.
Gerrig, Richard J. (1993), Experiencing Narrative Worlds, New Haven, CT: Yale
University Press.
Gieryn, T. F. (2000). A space for place in sociology. Annual Review of Sociology, 463-
496.
Gnoth, J., Zins, A. H., Lengmueller, R., & Boshoff, C. (2000). Emotions, mood, flow and
motivations to travel. Journal of Travel & Tourism Marketing, 9(3), 23-34.

101
Go, H., & Gretzel, U. (2010). The role of interactive maps and spatial ability in creating
virtual tourism experiences: A measurement framework. 41st Annual Proceedings
of the Travel and Tourism Research Association Conference, Travel and Tourism
Research Association, San Antonio, TX, 20-22 June.
Goossens, C. (2000). Tourism information and pleasure motivation. Annals of Tourism
Research, 27(2), 301-321.
Gountas, S., Mavondo, F., Ewing, M., & Gountas, J. (2011). Exploring the effects of
perceived service provider sincerity on consumers' emotional state and
satisfaction during service consumption. Tourism Analysis, 16(4), 393-403.
Grabe, M. E., Lang, A., & Zhao, X. (2003). News content and form implications for
memory and audience evaluations. Communication Research, 30(4), 387-413.
Green, M. C., & Brock, T. C. (2000). The role of transportation in the persuasiveness of
public narratives. Journal of Personality and Social Psychology, 79(5), 701-721.
Green, M. C., & Clark, J. L. (2012). Transportation into narrative worlds: implications
for entertainment media influences on tobacco use. Addiction, 108, 477-484.
Green, M. C., & Dill, K. E. (2013). Engaging with stories and characters: Learning,
persuasion, and transportation into narrative worlds. The Oxford Handbook of
Media Psychology, 449-461.
Gretzel, U., & Yoo, K.H. (2008). Use and impact of online travel reviews. In: O’Connor,
P., Hopken, W., Gretzel, U. (Eds.), Information and Communication Technologies
in Tourism. Springer-Verlag, Wien, New York, p. 35-46.
Gross, M. J., Brien, C., & Brown, G. (2008). Examining the dimensions of a lifestyle
tourism destination. Journal of Culture, Tourism and Hospitality Research, 2(1),
44-66.
Gross, M. J., & Brown, G. (2008). An empirical structural model of tourists and places:
Progressing involvement and place attachment into tourism. Tourism
Management, 29(6), 1141-1151.
Gruen, T. W., Osmonbekov, T., & Czaplewski, A. J. (2006). eWOM: The impact of
customer-to-customer online know-how exchange on customer value and loyalty.
Journal of Business research, 59(4), 449-456.
Guarente, M. (2010). The importance of social media. Tourism Insights, March,
unpaginated.

102
Guthrie, C., & Anderson, A. (2010). Visitor narratives: Researching and illuminating
actual destination experience. Qualitative Market Research: An International
Journal, 13(2), 110-129.
Hair, J., Anderson, R., Tatham, R., & Black, W. (1998). Multivariate data analysis (5th
ed.). Upper Saddle River, New Jersey: Prentice Hall.
Hallak, R., Assaker, G., & O'Connor, P. (2012). Are family and nonfamily tourism
businesses different? An examination of the entrepreneurial self-efficacy–
entrepreneurial performance relationship. Journal of Hospitality & Tourism
Research.
Hall, R. J., Snell, A. F., & Foust, M. S. (1999). Item parceling strategies in SEM:
Investigating the subtle effects of un-modeled secondary constructs.
Organizational Research Methods, 2(3), 233-256.
Hammitt, W., Backlund, E. A., & Bixler, R. D. (2004). Experience use history, place
bonding, and resource substitution of trout anglers during recreation engagements.
Journal of Leisure Research, 36, 356-378.
Hammitt, W., Backlund, E. A., & Bixler, R. D. (2006). Place bonding for recreation
places: Conceptual and empirical development. Leisure Studies, 25, 17-41.
Harley, D., & Fitzpatrick, G. (2009). Creating a conversational context through video
blogging: A case study of Geriatric1927. Computers in Human Behavior, 25(3),
679-689.
Hidalgo, M. C., & Hernandez, B. (2001). Place attachment: Conceptual and empirical
questions. Journal of Environmental Psychology, 21(3), 273-281.
Holmes, E. A., & Mathews, A. (2005). Mental imagery and emotion: A special
relationship? Emotion, 5(4), 489.
Hou, J., Lin, C., & Morais, D. B. (2005). Antecedents of attachment to a cultural tourism
destination: The case of Hakka and non-Hakka Taiwanese visitors to Pei-Pu,
Taiwan. Journal of Travel Research, 44, 221-233.
Hu, L. T., & Bentler, P. M. (1998). Fit indices in covariance structure modeling:
Sensitivity to underparameterized model misspecification. Psychological
methods, 3(4), 424-453.
Hu, L. T., & Bentler, P. M. (1999). Cutoff criteria for fit indexes in covariance structure
analysis: Conventional criteria versus new alternatives. Structural Equation
Modeling: A Multidisciplinary Journal, 6(1), 1-55.

103
Hu, Y., & Ritchie, B. (1993). Measuring destination attractiveness: A contextual
approach.
Hull, R. B., & Harvey, A. (1989). Explaining the emotion people experience in suburban
parks. Environment and Behavior, 21(3), 323-345.
Hummon, D. M. (1992). Community attachment: local sentiment and sense of place. In
Altman, I., Low, S. (Eds.), Place attachment (pp. 253-278). New York: Plenum
Press.
Hwang, S., Lee, C., & Chen, H. (2005). The relationship among tourists’ involvement,
place attachment and interpretation satisfaction in Taiwan’s national parks.
Tourism Management, 26(2), 143-156.
Hyun, M. Y., Lee, S., & Hu, C. (2009). Mobile-mediated virtual experience in tourism:
Concept, typology and applications. Journal of Vacation Marketing, 15(2), 149-
164.
Iacobucci, D. (2010). Structural equations modeling: Fit indices, sample size, and
advanced topics. Journal of Consumer Psychology, 20(1), 90-98.
Jöreskog, K. G., & Sörbom, D. (1993). Lisrel 8: Structured equation modeling with the
Simplis command language. Scientific Software International.
Kah, J. A., Vogt, C., & MacKay, K. (2008). Online travel information search and
purchasing by internet use experiences. Information Technology & Tourism,
10(3), 227-243.
Kaplan, D. (2000). Structural equation modeling: Foundation and extensions. Thousand
Oaks, CA: Sage Publications.
Kaplan, A. M., & Haenlein, M. (2010). Users of the world, unite! The challenges and
opportunities of social media. Business Horizons, 53, 59-68.
Karapanos, E., Barreto, M., Nisi, V., & Niforatos, E. (2012). Does locality make a
difference? Assessing the effectiveness of location-aware narratives. Interacting
with Computers, 24(4), 273-279.
Katsura, T., & Sheldon, P. (2008). Forecasting mobile technology use in Japanese
tourism. Information Technology & Tourism, 10(3), 201-214.
Kennedy-Eden, H., & Gretzel, U. (2012). A taxonomy of mobile applications in tourism.
Kim, S. (2012). Audience involvement and film tourism experiences: Emotional places,
emotional experiences. Tourism Management, 33(2), 387-396.

104
Kim, S. B., Kim, D. Y., & Bolls, P. D. (2013, January). The Effects of Tourism
Advertisements on Viewer’s Attention and Arousal: A Visual persuasion Mental
Imagery Processing. In The 18th Annual Graduate Education and Graduate
Student Research Conference in Hospitality and Tourism.
Kleinginna Jr, P. R., & Kleinginna, A. M. (1981). A categorized list of emotion
definitions, with suggestions for a consensual definition. Motivation and Emotion,
5(4), 345-379.
Klem, L. (2000). Structural equation modeling. In L. G. Grimm, & P. R. Yarnold (Eds.),
Reading and understanding more multivariate statistics (pp. 227-260).
Klimmt, C., & Vorderer, P. (2003). Media psychology “is not yet there”: Introducing
theories on media entertainment to the presence debate. Presence: Teleoperators
and Virtual Environments, 12(4), 346-359.
Kline, R. B. (1998). Principles and practice of structural equation modeling, third
edition. New York, NY: Guilford Press.
Kline, R. B. (2011). Principles and practice of structural equation modeling, third
edition. New York, NY: Guilford Press.
Kosslyn, S. M. (1994). Image and brain. Cambridge, MA: MIT Press.
Kyle, G., Bricker, K., Graefe, A., & Wickham, T. (2004). An examination of
recreationists’ relationships with activities and settings. Leisure Sciences, 26, 123-
142.
Kyle, G., Graefe, A., & Manning, R. (2005).Testing the dimensionality of place
attachment in recreation settings. Environment and Behaviour, 37(2), 153-177.
Kyle, G., Graefe, A., Manning, R., & Bacon, J. (2003). An examination of the
relationship between leisure activity involvement and place attachment among
hikers along the Appalachian Trail. Journal of Leisure Research, 35, 249–273.
Kyle, G. & Johnson, C. Y. (2008). Understanding cultural variation in place meaning. In
L. Kruger, T. Hall, & M. C. Steifel (Eds.), Understanding concepts of place in
recreation research and management (PNW-GTR-744) (pp. 109-134). Portland,
OR: USDA Forest Service, Pacific Northwest Research Station.
Kyle, G. T., Mowen, A. J., & Tarrant, M. (2004). Linking place preferences with place
meaning: An examination of the relationship between place motivation and place
attachment. Journal of Environmental Psychology, 24(4), 439-454.

105
Landis, R. S., Beal, D. J., & Tesluk, P. E. (2000). A comparison of approaches to forming
composite measures in structural equation models. Organizational Research
Methods, 3, 186-207.
Lang, A., Bolls, P., Potter, R. F., & Kawahara, K. (1999). The effects of production
pacing and arousing content on the information processing of television messages.
Journal of Broadcasting & Electronic Media, 43(4), 451-475.
Lee, C. C., & Allen, L. (1999). Understanding individuals’ attachment to selected
destinations: An application of place attachment. Tourism Analysis, 4(3/4), 173-
185.
Lee, W., & Gretzel, U. (2012). Designing persuasive destination websites: A mental
imagery processing perspective. Tourism Management, 33(5), 1270-1280.
Lee, W., Gretzel, U., & Law, R. (2010). Quasi-trial experiences through sensory
information on destination web sites. Journal of Travel Research, 49(3), 310-322.
Lee, Y. K., Kim, Y., Son, M. H., & Lee, D. J. (2011). Do emotions play a mediating role
in the relationship between owner leadership styles and manager customer
orientation, and performance in service environment? International Journal of
Hospitality Management, 30(4), 942-952.
Levene, H. (1960). Robust testes for equality of variances. In Contributions to
Probability and Statistics (I. Olkin, ed.) 278-292. Stanford University Press, Palo
Alto, CA.
Lin, K.-Y., & Lu, H.-P. (2011). Why people use social networking sites: An empirical
study integrating network externalities and motivation theory. Computers in Human
Behavior, 27, 1152-1161.
Lutz, K. A., & Lutz, R. J. (1978). Imagery-eliciting strategies: Review and implications
of research. Advances in Consumer Research, 5, 611-620.
MacInnis, D. J., & Price, L. L. (1990). An exploratory study of the effects of imagery
processing and consumer experience on expectations and satisfactions. Advances
in Consumer Research, 17, 41-47.
MacInnis, D. J., & Price, L. L. (1987). The role of imagery in information processing:
Review and extensions. The Journal of Consumer Research, 14(4), 473-491.
MacKay, K., & Vogt, C. (2012). Information technology in everyday and vacation
contexts. Annals of Tourism Research, 39(3), 1380-1401.

106
Magai, C. (1999). Affect, imagery, and attachment: Working models of interpersonal
affect and the socialization of emotion.
Mano, H. (1991). The structure and intensity of emotional experiences: Method and
context convergence. Multivariate Behavioral Research, 26(3), 389-411.
Mano, H., & Oliver, R. L. (1993). Assessing the dimensionality and structure of the
consumption experience: Evaluation, feeling, and satisfaction. Journal of
Consumer Research, 451-466.
Manzo, L. C. (2008). Understanding human relationships to place and their significance
for outdoor recreation and tourism. In L. Kruger, T. Hall, & M. C. Steifel (Eds.),
Understanding concepts of place in recreation research and management (PNW-
GTR-744) (pp. 135-173). Portland, OR: USDA Forest Service, Pacific Northwest
Research Station.
Martin, I. M., & Eroglu, S. (1993). Measuring a multi-dimensional construct: country
image. Journal of Business Research, 28(3), 191-210.
Mattila, A. S. (2002). The use of narrative appeals in promoting restaurant experiences.
Journal of Hospitality & Tourism Research, 26, 379-395.
Mayer, R. E. (1997). Multimedia learning: Are we asking the right questions?
Educational psychologist, 32(1), 1-19.
Mayer, R. E. (2001). Multimedia learning. Cambridge, UK: Cambridge University Press.
McMullan, R., & O'Neill, M. (2010). Towards a valid and reliable measure of visitor
satisfaction. Journal of Vacation Marketing, 16(1), 29-44.
Mehmetoglu, M. (2012). Partial Least Squares Approach to Structural Equation
Modeling for Tourism Research. Advances in Hospitality and Leisure, 8, 43-61.
Meade, A. W., & Kroustalis, C. M. (2005, April). Problems of item parceling with CFA:
Test of measurement invariance. Paper presented at the 20th Annual Conference
of the Society for Industrial and Organizational Psychology, Los Angeles, CA.
Mesch, G. S., & Manor, O. (1998). Social ties, environmental perception, and local
attachment. Environment and Behavior, 30, 504-519.
Milano, R., Baggio, R., & Piatrelli, R. (2011). The effects of online social media on
tourism websites. Proceedings of the International Conference in Innsbruck,
Austria, January, 26-28.

107
Miller, D. W., Hadjimarcou, J., & Miciak, A. (2000). A scale for measuring
advertisement-evoked mental imagery. Journal of Marketing Communications, 6,
1-20.
Miller, D. W., & Stoica, M. (2004). Comparing the effects of a photograph versus artistic
renditions of a beach scene in a direct response print ad for a Caribbean resort
island: A mental imagery perspective. Journal of Vacation Marketing, 10(1), 11-
21.
Miller, G. A., Levin, D. N., Kozak, M. J., Cook III, E. W., McLean Jr., A., & Lang, P. J.
(1987). Individual differences in imagery and the psychophysiology of emotion.
Cognition and Emotion, 1(4), 367-390.
Milligan, M. J. (1998). Interactional past and potential: The social construction of place
attachment. Symbolic Interaction, 21, 1-33.
Moore, R. L., & Graefe, A. R. (1994). Attachments to recreation settings: the case of rail-
trail users. Leisure Sciences, 16, 17-31.
Moore, R. L., & Scott, D. (2003). Place attachment and context: Comparing a park and a
trail within. Forest Science, 49(6), 877-884.
Murdock, A. (2011). Mobile Apps for Travel-What are you using? Retrieved from
http://insidedigital.blog.lonelyplanet.com/2011/05/04/mobile-apps-for-travel-
what-are-you-using/
Newark-French, C. (2011). Mobile App Inventory Hungry Enough to Eat Internet
Display Ad Spend. http://blog.flurry.com/bid/71285/Mobile-App-Inventory-
Hungry-Enough-to-Eat-Internet-Display-Ad-Spend. Accessed October 31, 2012.
Nunnally, J. C. (1978). Psychometric theory (2nd ed.). New York: McGraw-Hill.
Nusair, K., & Hua, N. (2010). Comparative assessment of structural equation modeling
and multiple regression research methodologies: E-commerce context. Tourism
Management, 31(3), 314-324.
Oatley, K. (1994). A taxonomy of the emotions of literary response and a theory of
identification in fictional narrative. Poetics, 23, 53-74.
Orth, U. R., Stöckl, A., Veale, R., Brouard, J., Cavicchi, A., Faraoni, M., & Wilson, D.
(2012). Using attribution theory to explain tourists' attachments to place-based
brands. Journal of Business Research, 65(9), 1321-1327.
Ortony, A., Clore, G. L., & Foss, M. A. (1987). The referential structure of the affective
lexicon. Cognitive Science, 11(3), 341-364.

108
Pace, S. (2008). YouTube: an opportunity for consumer narrative analysis? Qualitative
Market Research: An International Journal, 11(2), 213-226.
Padgett, D., & Allen, D. (1997). Communicating experiences: A narrative approach to
creating service brand image. Journal of Advertising, 26(4), 49-62.
Paivio, A. (1971). Imagery and verbal processes. New York: Holt, Rinehart & Winston.
Paivio, A. (1986). Mental representation: A dual coding approach. Oxford: Oxford
University Press.
Pan, L. Y., & Chiou, J. S. (2011). How much can you trust online information? Cues for
perceived trustworthiness of consumer-generated online information. Journal of
Interactive Marketing, 25(2), 67-74.
Parra-López, E., Bulchand-Gidumal, J., Gutiérrez-Taño, D., & Díaz-Armas, R. (2011).
Intentions to use social media in organizing and taking vacation trips. Computers in
Human Behavior, 27, 640-654.
Parra-López, E., Gutiérrez-Taño, D., Díaz-Armas, R. J., & Bulchand-Gidumal, J. (2012).
Travellers 2.0: Motivation, Opportunity and Ability to Use Social Media. Social
Media in Travel Tourism and Hospitality: Theory Practice and Cases, 171-187.
Phillips, B. J., & McQuarrie, E. F. (2010). Narrative and Persuasion in Fashion
Advertising. Journal of Consumer Research, 37(3), 368-392.
Phillips, D. M., Olson, J. C., & Baumgartner, H. (1995). Consumption visions in
consumer decision making. In Frank R. Kardes & Mita Sujan, Provo UT (Eds),
Advances in Consumer Research, 22, 280-284. Association for Consumer
Research.
Plunkett, D. (2011). On place attachments in virtual worlds. World Leisure Journal,
53(3), 168-178.
Plutchik, R. (1980). Emotion, a psychoevolutionary synthesis Harper & Row New York.
Prayag, G., & Ryan, C. (2012). Antecedents of tourists’ loyalty to Mauritius The role and
influence of destination image, place attachment, personal involvement, and
satisfaction. Journal of Travel Research, 51(3), 342-356.
Proshansky, H. M. 1978. The city and self-identity. Environment and Behavior 10: 147-
169.
Proshansky, H. M., Fabian, A. K., & Kaminoff, R. (1983). Place identity: Physical world
and socialization of the self. Journal of Environmental Psychology 3: 57-83.

109
Pullman, M. E., & Gross, M. A. (2004). Ability of experience design elements to elicit
emotions and loyalty behaviors. Decision Sciences, 35(3), 551-578.
Qu, H., & Lee, H. (2011). Travelers’ social identification and membership behaviors in
online travel community. Tourism Management, 32, 1262-1270.
Relph, E. C. (1976). Place and placelessness. London: Pion Limited.
Richins, M. L. (1997). Measuring emotions in the consumption experience. Journal of
Consumer Research, 24(2), 127-146.
Rick, S., & Loewenstein, G. (2007). The role of emotion in economic behavior. Available
at SSRN 954862,
Rossiter, J. R., & Percy, L. (1980). Attitude change through visual imagery in
advertising. Journal of Advertising, 9(2), 10-16.
Rozier-Rich, S., & Santos, C. A. (2011). Processing promotional travel narratives.
Tourism Management, 32, 394-405.
Russell, J. A. (1980). A circumplex model of affect. Journal of Personality and Social
Psychology, 39(6), 1161.
Russell, J. A. (2003). Core affect and the psychological construction of emotion.
Psychological Review, 110(1), 145.
Ryu, K., & Jang, S. S. (2007). The effect of environmental perceptions on behavioral
intentions through emotions: The case of upscale restaurants. Journal of
Hospitality & Tourism Research, 31(1), 56-72.
Schermelleh-Engel, K., Moosbrugger, H., & Müller, H. (2003). Evaluating the fit of
structural equation models: Tests of significance and descriptive goodness-of-fit
measures. Methods of psychological research online, 8(2), 23-74.
Schlosser, A. E. (2003). Experiencing products in the virtual world: the role of goal and
imagery in influencing attitudes versus purchase intentions. Journal of Consumer
Research, 30(2), 184-198.
Schmidt-Belz, B., Nick, A., Poslad, S., & Zipf, A. (2002). Personalized and location-
based mobile tourism services. Workshop on “Mobile Tourism Support Systems”
in conjunction with Mobile HCI, 2002.

110
Schneider, A., & Stangl, B. (2012). Analyzing the emotional appeal of a website through
verbal and pictorial stimuli. Information and Communication Technologies in
Tourism 2012: Proceedings of the International Conference in Helsingborg,
Sweden, January 24-27, 2012, 60.
Seabra, C., Silva, C., & Abrantes, J. L. (2012). Place-attachment and involvement by
tourists of natural areas. Tourism & Management Studies, 1105-1108.
Segovia, K. Y., & Bailenson, J. N. (2009). Virtually true: Children's acquisition of false
memories in virtual reality. Media Psychology, 12(4), 371-393.
Shanton, K., & Goldman, A. (2010). Simulation theory. Wiley Interdisciplinary Reviews:
Cognitive Science, 1(4), 527-538.
Shaver, P., Schwartz, J., Kirson, D., & O'Connor, C. (1987). Emotion knowledge: Further
exploration of a prototype approach. Journal of Personality and Social
Psychology, 52(6), 1061.
Shin, D.-H. (2010). Analysis of online social networks: A cross-national study. Online
Information Review, 34(3), 473-495.
Sijtsma, K. (2009). On the use, the misuse, and the very limited usefulness of Cronbach’s
alpha. Psychometrika, 74(1), 107-120.
Silva, C., Kastenholz, E., & Abrantes, J. L. (2013). Place-attachment, destination image
and impacts of tourism in mountain destinations. Anatolia, 24(1), 17-29.
Slater, M. D., & Rouner, D. (2002). Entertainment-education and elaboration likelihood:
understanding the processing of narrative persuasion. Communication Theory, 12,
173-191.
Smith, A. K., & Bolton, R. N. (2002). The effect of customers' emotional responses to
service failures on their recovery effort evaluations and satisfaction judgments.
Journal of the Academy of Marketing Science, 30(1), 5-23.
Stafford, M. R., & Day, E. (1995). Retail services advertising: the effects of appeal,
medium, and service. Journal of Advertising, 24, 57-71.
Stewart, W., Liebert, D., & Larkin, D. (2003). Community identities as visions for
landscape change. Landscape and Urban Planning, 69, 315-334.
Stokowski, P. A. (2002). Languages of place and discourses of power: constructing new
senses of place. Journal of Leisure Research, 34(4), 368-382.

111
Stokowski, P. A. (2008). Creating social senses of place: New directions for sense of
place research in natural resource management. In L. Kruger, T. Hall, & M. C.
Steifel (Eds.), Understanding concepts of place in recreation research and
management (PNW-GTR-744) (pp. 31-60). Portland, OR: USDA Forest Service,
Pacific Northwest Research Station.
Tan, W. K., & Chen, T. H. (2012). The usage of online tourist information sources in
tourist information search: An exploratory study. The Service Industries Journal,
32(3), 451-476.
Taylor, S. E., & Schneider, S. K. (1989). Coping and the simulation of events. Social
Cognition, 7(2), 174-194.
Thevenot, G. (2007). Blogging as a social media. Tourism and Hospitality Research,
7(3/4), 287-289.
Tomkins, S. S. (1984). Affect theory. Approaches to Emotion, 163, 195.
Tsai, S. P. (2012). Place attachment and tourism marketing: Investigating international
tourists in Singapore. International Journal of Tourism Research, 14(2), 139-152.
Tuan, Y. F. (1975). Place: an experiential perspective. Geographical Review, 151-165.
Tuan, Y. (1977). Space and place: the perspective of experience. St. Paul, MN:
University of Minnesota Press.
Tussyadiah, I. P., & Fesenmaier, D. R. (2009). Mediating tourist experiences: Access to
places via shared videos. Annals of Tourism Research, 36(1), 24-40.
Tussyadiah, I. P., Park, S., & Fesenmaier, D. R. (2011). Assessing the effectiveness of
consumer narratives for destination marketing. Journal of Hospitality & Tourism
Research, 35(1), 64-78.
Ullman, J. B., & Bentler, P. M. (2001). Structural equation modeling. Handbook of
Psychology, Second Edition.
Unnava, H. R., & Burnkrant, R. E. (1991). An imagery-processing view of the role of
pictures in print advertisements. Journal of Marketing Research, 28 (May), 226-
231.
Volo, S. (2010). Bloggers’ reported tourist experience: Their utility as a tourism data
source and their effect on prospective tourists. Journal of Vacation Marketing,
16(4), 297-311.

112
Vorderer, P., Wirth, W., Gouveia, F. R., Biocca, F., Saari, T., Jäncke, F., et al. (2004).
MEC Spatial Presence Questionnaire (MECSPQ): Short Documentation and
Instructions for Application. Report to the European Community, Project Presence.
Vorkinn, M., & Riese, H. (2001). Environmental concern in a local context: the
significance of place attachment. Environment and Behavior, 33, 249-263.
Walker, B. A., & Olson, J. (1994). The activated self in consumer behavior: A cognitive
structure perspective. Working paper, Pennsylvania State University.
Walters, G., Sparks, B., & Herington, C. (2007). The effectiveness of print advertising
stimuli in evoking elaborate consumption visions for potential travelers. Journal
of Travel Research, 46(1), 24-34.
Wang, D., Park, S., & Fesenmaier, D. (2011). An examination of information services
and smartphone applications.
Wang, D., Park, S., & Fesenmaier, D. R. (2012). The role of smartphones in mediating
the touristic experience. Journal of Travel Research, 51(4), 371-387.
Wang, D., & Xiang, Z. (2012). The new landscape of travel: A comprehensive analysis of
Smartphone Apps. In Information and Communication Technologies in Tourism
2012 (pp. 308-319). Springer Vienna.
Wang, Y., & Fesenmaier, D. R. (2004). Towards understanding members’ general
participation in and active contribution to an online travel community. Tourism
Management, 25, 709-722.
Warzecha, C. A., & Lime, D. W. (2001). Place Attachment in Canyonlands National
Parks: Visitors’ assessment offsetting attributes on the Colorado and Green
Rivers. Journal of Park and Recreation Administration, 19(1), 59–78.
Watson, D., Clark, L. A., & Tellegen, A. (1988). Development and validation of brief
measures of positive and negative affect: the PANAS scales. Journal of
personality and social psychology, 54(6), 1063.
White, C. J. (2005). Culture, emotions and behavioural intentions: Implications for
tourism research and practice. Current Issues in Tourism, 8(6), 510-531.
White, C., & Yu, Y. T. (2005). Satisfaction emotions and consumer behavioral intentions.
Journal of Services Marketing, 19(6), 411-420.
Wiles, J. L., Rosenberg, M. W., & Kearns, R. A. (2005). Narrative analysis as a strategy
for understanding interview talk in geographic research. Area, 37, 89-99.

113
Williams, D. R. (2008). Pluralities of place: A user’s guide to place concepts, theories,
and philosophies in natural resource management. In L. Kruger, T. Hall, & M. C.
Steifel (Eds.), Understanding concepts of place in recreation research and
management (PNW-GTR-744) (pp. 7–30). Portland, OR: USDA Forest Service,
Pacific Northwest Research Station.
Williams. D. R., Patterson, M. E., Roggenbuck, J. W., & Watson, A. E. (1992). Beyond
the commodity metaphor: Examining the emotional and symbolic attachment to
place. Leisure Sciences, 14, 29-46.
Williams, D. R., & Roggenbuck, J. W. (1989). Measuring place attachment: Some
preliminary results. National Recreation and Parks Association Symposium on
Leisure Research, San Antonio, TX.
Williams, D. R., & Vaske, J. J. (2003). The measurement of place attachment: Validity
and generalizability of a psychometric approach. Forest Science, 49(6), 830-840.
Wright, E., Khanfar, N. M., Harrington, C., & Kizer, L. E. (2010). The lasting effects of
social media trends on advertising. Journal of Business & Economics Research
(JBER), 8(11).
Xiang, Z., & Gretzel, U. (2010). Role of social media in online travel information search.
Tourism Management, 31, 179-188.
Xiang, Z., Gretzel, U., & Fesenmaier, D. R. (2009). Semantic representation of tourism
on the internet. Journal of Travel Research, 47(4), 440-453.
Yang, J., & Zeng, X. (2010, June). Festival tourists' emotion, perceived service quality
and behavioral intentions. In Education Technology and Computer (ICETC), 2010
2nd International Conference on (Vol. 3, pp. V3-308). IEEE.
Yuksel, A., Yuksel, F., & Bilim, Y. (2009). Destination attachment: Effects on customer
satisfaction and cognitive, affective and cognitive loyalty. Tourism Management,
In Press, Corrected Proof.
Zaichkowsky, J. L. (1985). Measuring the involvement construct. The Journal of
Consumer Research, 12(3), 341-352.
Zaichkowsky, J. L. (1994). The personal involvement inventory: Reduction, revision, and
application to advertising. Journal of Advertising, 23(4), 59-70.
Zakrisson, I., & Zillinger, M. (2012). Emotions in motion: Tourist experiences in time
and space. Current Issues in Tourism, 15(6), 505-523.

114
Zhao, D., & Rosson, M. B. (2009, May). How and why people Twitter: the role that
micro-blogging plays in informal communication at work. In Proceedings of the
ACM 2009 international conference on Supporting group work (pp. 243-252).
ACM.
Zins, A. H. (2002). Consumption emotions, experience quality and satisfaction. Journal
of Travel & Tourism Marketing, 12(2-3), 3-18.

APPENDIX A
LETTER OF CONSENT

116
EXAMINING THE IMPACT OF MENTAL IMAGERY VISUALIZATION Dear Participant: I am a graduate student under the direction of Dr. Megha Budruk and Dr. Woojin Lee in the College of Public Programs, School of Community Resources & Development at Arizona State University.
I am conducting a research study to examine how mobile application characteristics affect the mental imagery of potential travelers. I am inviting your participation, which will involve the viewing the official tourism Facebook page of an island destination and then filling out of a short questionnaire. Your participation will involve approximately 10-15 minutes of your time. Your participation in this study is voluntary. You can skip questions if you wish. If you choose not to participate or to withdraw from the study at any time, there will be no penalty. You must be 18 or older to participate in the study. Depending on your instructor’s approval, you may receive extra credit for your participation in this study. If extra credit is offered, a separate sign-up sheet will be provided to keep questionnaire responses anonymous. In addition, there will be a random gift card drawing for participants who participate in the study. Participants will be entered to win one of four (4) gift cards of $20 each to an on campus food vendor. The random drawing will take place in April 2013. There are no foreseeable risks or discomforts to your participation. All information obtained in this study is strictly confidential. The results of this research study may be used in reports, presentations, and publications, but the researchers will not identify you. In order to maintain confidentiality of your records, Daniel Plunkett will maintain the data on a secure office computer at Arizona State University. No names will be collected for this study. Your email, if you opt to provide it, will be kept only for the purpose of notify you if you are selected to receive a gift card. If you have any questions concerning the research study, please contact the research team at: [email protected]. If you have any questions about your rights as a subject/participant in this research, or if you feel you have been placed at risk, you can contact the Chair of the Human Subjects Institutional Review Board, through the ASU Office of Research Integrity and Assurance, at (480) 965-6788. You will now be asked to view a destinations Facebook page. After taking sufficient time to view the page a computer will be made available to you for filling out a short questionnaire. Filling out the questionnaire will be considered your consent to participate. Sincerely, Daniel Plunkett Ph.D. Candidate ***At this time, please use the search feature on your mobile phones Facebook app to find “Belle Vie Tourism”. Belle Vie Tourism may not be the first search result. Look for a thumbnail
image of lounge chairs and thatch umbrellas overlooking the ocean. After viewing the page for 3
minutes please fill out the questionnaire.***

APPENDIX B
TEXT CONDITION
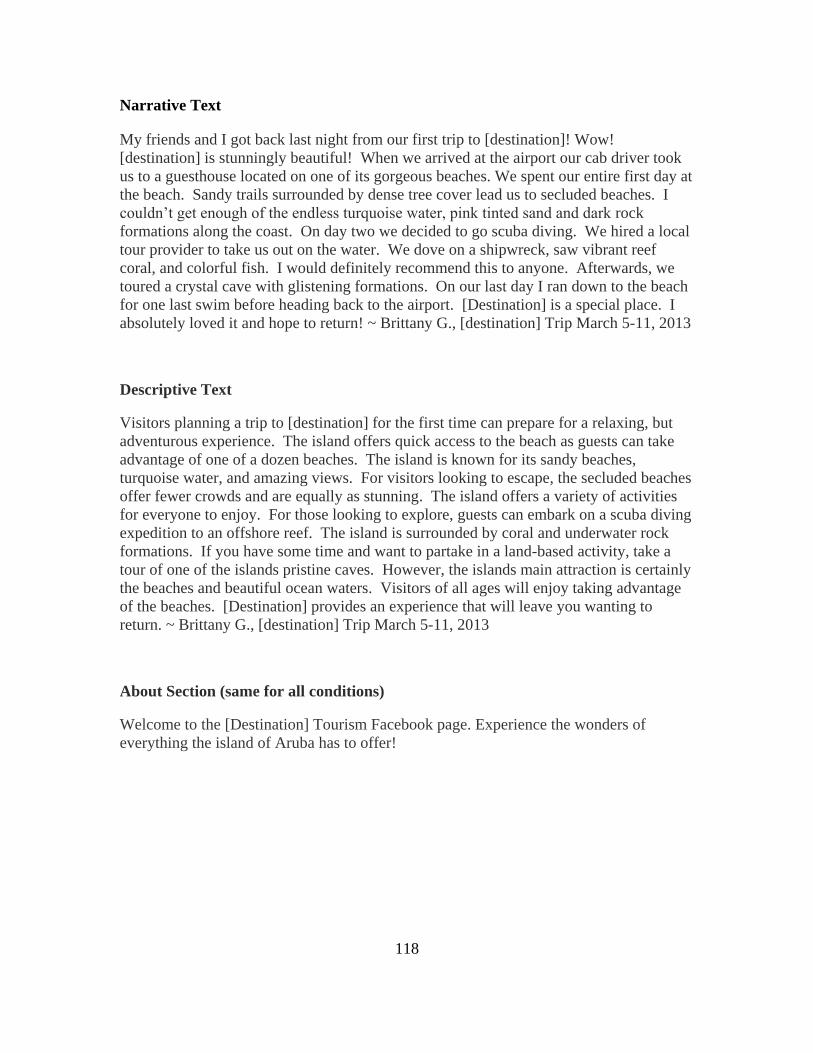
118
Narrative Text
My friends and I got back last night from our first trip to [destination]! Wow!
[destination] is stunningly beautiful! When we arrived at the airport our cab driver took
us to a guesthouse located on one of its gorgeous beaches. We spent our entire first day at
the beach. Sandy trails surrounded by dense tree cover lead us to secluded beaches. I
couldn’t get enough of the endless turquoise water, pink tinted sand and dark rock
formations along the coast. On day two we decided to go scuba diving. We hired a local
tour provider to take us out on the water. We dove on a shipwreck, saw vibrant reef
coral, and colorful fish. I would definitely recommend this to anyone. Afterwards, we
toured a crystal cave with glistening formations. On our last day I ran down to the beach
for one last swim before heading back to the airport. [Destination] is a special place. I
absolutely loved it and hope to return! ~ Brittany G., [destination] Trip March 5-11, 2013
Descriptive Text
Visitors planning a trip to [destination] for the first time can prepare for a relaxing, but
adventurous experience. The island offers quick access to the beach as guests can take
advantage of one of a dozen beaches. The island is known for its sandy beaches,
turquoise water, and amazing views. For visitors looking to escape, the secluded beaches
offer fewer crowds and are equally as stunning. The island offers a variety of activities
for everyone to enjoy. For those looking to explore, guests can embark on a scuba diving
expedition to an offshore reef. The island is surrounded by coral and underwater rock
formations. If you have some time and want to partake in a land-based activity, take a
tour of one of the islands pristine caves. However, the islands main attraction is certainly
the beaches and beautiful ocean waters. Visitors of all ages will enjoy taking advantage
of the beaches. [Destination] provides an experience that will leave you wanting to
return. ~ Brittany G., [destination] Trip March 5-11, 2013
About Section (same for all conditions)
Welcome to the [Destination] Tourism Facebook page. Experience the wonders of
everything the island of Aruba has to offer!

APPENDIX C
STUDY IMAGES AND SCREENSHOTS

120
Images seen by Participants on all Facebook Pages
Profile Picture
Cover Photo

121
Snapshot of all Scenes Depicted in the Videos

122

123

124

125

126

127

APPENDIX D
PRE-TEST & MAIN STUDY QUESTIONNAIRES

129
Pre-Test Questionnaire
Did you visit the Facebook page of an island destination? □ Yes □ No
Did you watch a video? □ Yes □ No
Did you read a text entry describing a [destination] experience? □ Yes □ No
Read the following statements and rate how strongly you agree or disagree with them.
Statement
Strongly
disagree
(1) 2 3 4 5 6
Strongly
agree (7)
In my mind’s eye, I was able to
clearly see the arrangement of the
destination described
□ □ □ □ □ □ □
I was easily able to imagine being
at the destination □ □ □ □ □ □ □
It was easy for me to navigate
around the destination in my mind
without actually being there.
□ □ □ □ □ □ □
I had a precisely detailed image of
the described surroundings in my
mind’s eye.
□ □ □ □ □ □ □
I could easily imagine the layout
of the destination described □ □ □ □ □ □ □
I could picture the destination as
though I were actually there □ □ □ □ □ □ □
It was very easy for me to imagine
the destination clearly □ □ □ □ □ □ □
While looking at the destinations
Facebook page, many images
came to my mind
□ □ □ □ □ □ □
While looking at the destinations
Facebook page, very few images
came to my mind
□ □ □ □ □ □ □
While looking at the destinations
Facebook page, a lot of images
came to my mind
□ □ □ □ □ □ □
The mental imagery I experienced was…
Vivid □ □ □ □ □ □ □ Vague
Clear □ □ □ □ □ □ □ Unclear
Sharp □ □ □ □ □ □ □ Dull
Intense □ □ □ □ □ □ □ Weak
Well-defined □ □ □ □ □ □ □ Fuzzy

130
Read the following statements and rate how strongly you agree or disagree with them.
Not at
all (1) 2 3 4 5 6
Very
much
(7)
While I was reading the narrative, I could
easily picture the sites in it being visited. □ □ □ □ □ □ □
While I was reading the narrative, activity
going on away from my phone was going
was on my mind.
□ □ □ □ □ □ □
I could picture myself at the sites described
in the narrative. □ □ □ □ □ □ □
I was mentally involved in the narrative
while reading it. □ □ □ □ □ □ □
After finishing the narrative, I found it easy
to put it out of my mind. □ □ □ □ □ □ □
I wanted to learn how the narrative ended. □ □ □ □ □ □ □
The narrative affected me emotionally. □ □ □ □ □ □ □
I found myself thinking of ways the
narrative could have turned out differently. □ □ □ □ □ □ □
I found my mind wandering while reading
the narrative. □ □ □ □ □ □ □
The events in the narrative are relevant to
my everyday life. □ □ □ □ □ □ □
The trip described in the narrative has
changed my thoughts/feelings about the
destination.
□ □ □ □ □ □ □
Please rate to which extent you experienced the following emotions while viewing the contents of the
Facebook page.
Not at all (1) 2 3 4 5 6 Very much (7)
Interested □ □ □ □ □ □ □
Excited □ □ □ □ □ □ □
Strong □ □ □ □ □ □ □
Enthusiastic □ □ □ □ □ □ □
Proud □ □ □ □ □ □ □
Alert □ □ □ □ □ □ □
Inspired □ □ □ □ □ □ □
Determined □ □ □ □ □ □ □
Attentive □ □ □ □ □ □ □
Active □ □ □ □ □ □ □

131
Continued: Please rate to which extent you experienced the following emotions…
Not at all (1) 2 3 4 5 6 Very much (7)
Aroused □ □ □ □ □ □ □
Astonished □ □ □ □ □ □ □
Surprised □ □ □ □ □ □ □
Elated □ □ □ □ □ □ □
Pleased □ □ □ □ □ □ □
Satisfied □ □ □ □ □ □ □
Happy □ □ □ □ □ □ □
In a good mood □ □ □ □ □ □ □
Calm □ □ □ □ □ □ □
At rest □ □ □ □ □ □ □
Relaxed □ □ □ □ □ □ □
Quiet □ □ □ □ □ □ □
Still □ □ □ □ □ □ □
Quiescent □ □ □ □ □ □ □
Distressed □ □ □ □ □ □ □
Upset □ □ □ □ □ □ □
Guilty □ □ □ □ □ □ □
Scared □ □ □ □ □ □ □
Hostile □ □ □ □ □ □ □
Irritable □ □ □ □ □ □ □
Ashamed □ □ □ □ □ □ □
Nervous □ □ □ □ □ □ □
Jittery □ □ □ □ □ □ □
Afraid □ □ □ □ □ □ □
Sleepy □ □ □ □ □ □ □
Sluggish □ □ □ □ □ □ □
Drowsy □ □ □ □ □ □ □
Unhappy □ □ □ □ □ □ □
Sad □ □ □ □ □ □ □
Blue □ □ □ □ □ □ □
In a bad mood □ □ □ □ □ □ □
Anxious □ □ □ □ □ □ □
Fearful □ □ □ □ □ □ □

132
Please indicate the extent to which you agree or disagree with the following statements about the
destination.
Strongly
Disagree
(1) 2 3 4 5 6
Strongly
Agree
(7)
The destination means a lot to
me □ □ □ □ □ □ □
I am very attached to this
destination □ □ □ □ □ □ □
I identify strongly with this
destination □ □ □ □ □ □ □
I feel no commitment to this
destination □ □ □ □ □ □ □
I would enjoy planning my
trip to/traveling to this
destination more than any
other destination
□ □ □ □ □ □ □
I would get more satisfaction
out of visiting this destination
than from visiting any other
destination
□ □ □ □ □ □ □
Traveling to this destination is
more important than traveling
to any other destination
□ □ □ □ □ □ □
I wouldn’t substitute any other
destination for the type of
activities I could do at this
destination
□ □ □ □ □ □ □
I have a lot of fond memories
about this destination □ □ □ □ □ □ □
I have a special connection to
this destination and the people
who visit/live there
□ □ □ □ □ □ □
I wouldn’t tell many people
about this destination I □ □ □ □ □ □ □
I would bring my friends to
[destination] □ □ □ □ □ □ □

133
What year were you born? ________
Pertaining to your education, are you a:
□ Freshman
□ Sophomore
□ Junior
□ Senior
□ Graduate student
□ Not in school
What is your annual household income?
□ Less than $20,000 □ $80,000-99,999
□ $20,000-39,999 □ $100,000-119,999
□ $40,000-59,999 □ 120,000 or more
□ $60,000-79,999
Are You Hispanic or Latino, i.e., a person of Cuban, Mexican, Puerto Rican, South or Central
American, or other Spanish culture or origin, regardless of race?
□ Yes □ No
With which racial/ethnic group(s) do you identify?
□ American Indian or Alaska Native
□ Asian
□ Black or African American
□ Native Hawaiian or other Pacific Islander
□ White
□ Other (please specify) ____________________
What is your sex? □ Male □ Female
Did you use your own smartphone for viewing the page? □ Yes □ No
What model smartphone did you use? _____________________________________
What travel/tourism related app do you use most? ___________________________
Thank you for your participation!!!!

134
Main Study Questionnaire
***At this time, please use the search feature on your mobile phones
Facebook app (click on symbol in upper left-hand corner to find Search bar)
and find “Aruba Island Tourism”. Aruba Island Tourism may not be the
first search result. Look for this thumbnail image
[thumbnail
image]
Once you have viewed the contents of the page, please answer the following questions.
Did you watch a video? □ Yes □ No
Did you read a text entry describing an Aruba experience? □ Yes □ No
Read the following statements and rate how strongly you agree or disagree with them.
Statement
Strongly
disagree
(1) 2 3 4 5 6
Strongly
agree (7)
I was easily able to imagine being at
the destination □ □ □ □ □ □ □
It was easy for me to navigate around
the destination in my mind without
actually being there.
□ □ □ □ □ □ □
I had a precisely detailed image of the
described surroundings in my mind’s
eye.
□ □ □ □ □ □ □
I could easily imagine the layout of
the destination described □ □ □ □ □ □ □
I could picture the destination as
though I were actually there □ □ □ □ □ □ □
It was very easy for me to imagine the
destination clearly □ □ □ □ □ □ □
While looking at the destinations
Facebook page, many images came to
my mind
□ □ □ □ □ □ □
While looking at the destinations
Facebook page, very few images came
to my mind
□ □ □ □ □ □ □
While looking at the destinations
Facebook page, a variety of images
came to my mind
□ □ □ □ □ □ □
The mental images I generated in my mind were…
Vivid □ □ □ □ □ □ □ Vague
Clear □ □ □ □ □ □ □ Unclear
Sharp □ □ □ □ □ □ □ Dull
Intense □ □ □ □ □ □ □ Weak
Well-defined □ □ □ □ □ □ □ Fuzzy

135
Read the following statements and rate how strongly you agree or disagree with them.
Strongly
disagree
(1) 2 3 4 5 6
Strongly
agree (7)
While I was reading the narrative, I
could easily picture the sites in it
being visited.
□ □ □ □ □ □ □
While I was reading the narrative,
activity going on away from my
phone was on my mind.
□ □ □ □ □ □ □
I could picture myself at the sites
described in the narrative. □ □ □ □ □ □ □
I was mentally involved in the
narrative while reading it. □ □ □ □ □ □ □
After finishing the narrative, I found it
easy to put it out of my mind. □ □ □ □ □ □ □
I wanted to learn how the narrative
ended. □ □ □ □ □ □ □
The narrative affected me
emotionally. □ □ □ □ □ □ □
I found myself thinking of ways the
narrative could have turned out
differently.
□ □ □ □ □ □ □
I found my mind wandering while
reading the narrative. □ □ □ □ □ □ □
The events in the narrative are
relevant to my everyday life. □ □ □ □ □ □ □
The trip described in the narrative has
changed my thoughts/feelings about
the destination.
□ □ □ □ □ □ □
Please rate to which extent you experienced the following emotions while viewing the contents (text
and video) of the Facebook page.
Not at all (1) 2 3 4 5 6 Very much (7)
Interested □ □ □ □ □ □ □
Excited □ □ □ □ □ □ □
Enthusiastic □ □ □ □ □ □ □
Inspired □ □ □ □ □ □ □
Attentive □ □ □ □ □ □ □
Happy □ □ □ □ □ □ □
In a good mood □ □ □ □ □ □ □
Calm □ □ □ □ □ □ □

136
Please indicate the extent to which you agree or disagree with the following statements about the
destination.
Strongly
Disagree
Strongly
Agree
The destination means a
lot to me □ □ □ □ □ □ □
Traveling to this
destination is more
important than traveling
to any other destination
□ □ □ □ □ □ □
I would bring my friends
to Aruba □ □ □ □ □ □ □
I feel no commitment to
this destination □ □ □ □ □ □ □
I would enjoy traveling to
this destination more than
any other destination
□ □ □ □ □ □ □
I would get more
satisfaction out of
visiting this destination
than from visiting any
other destination
□ □ □ □ □ □ □
I am very attached to this
destination □ □ □ □ □ □ □
I wouldn’t substitute any
other destination for the
type of activities I could
do at this destination
□ □ □ □ □ □ □
I have a lot of fond
memories about this
destination
□ □ □ □ □ □ □
I have a special
connection to this
destination and the people
who visit/live there
□ □ □ □ □ □ □
I wouldn't tell many
people about this
destination
□ □ □ □ □ □ □
I identify strongly with
this destination □ □ □ □ □ □ □
Without looking back at the video, do you recall seeing any of the following in the video?
Yes No Yes No Yes No
Beaches Caves Reefs
Trees Cliffs Boats
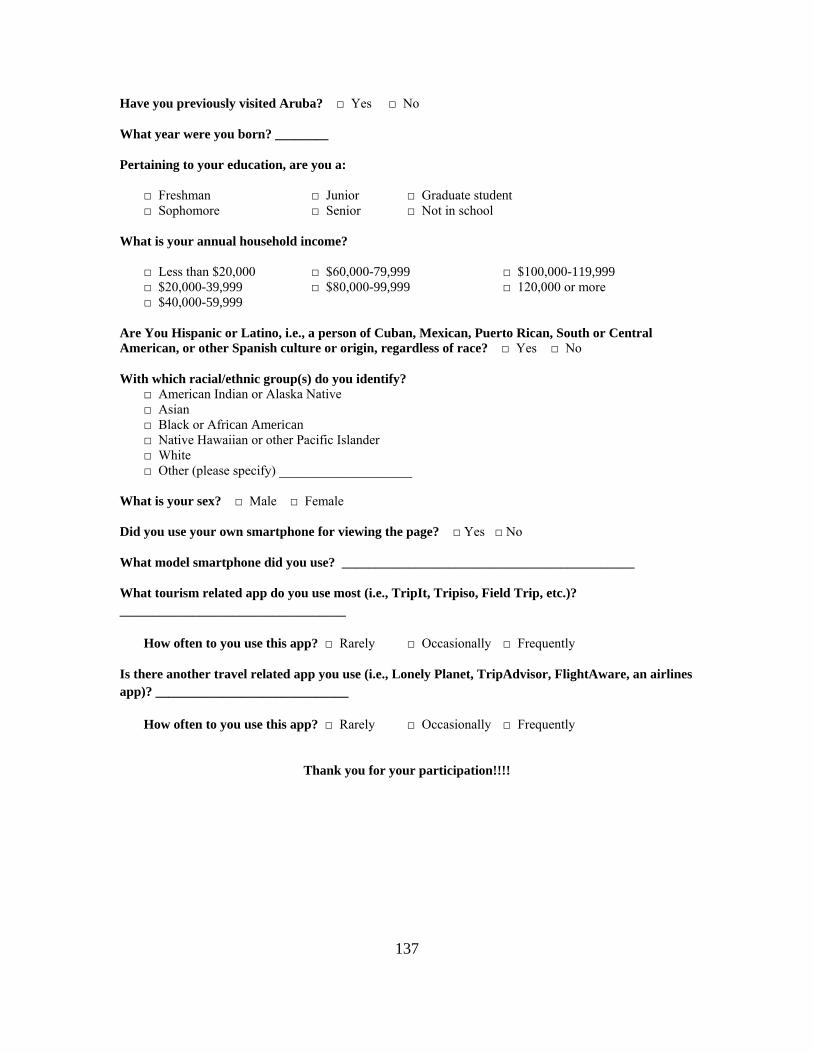
137
Have you previously visited Aruba? □ Yes □ No
What year were you born? ________
Pertaining to your education, are you a:
□ Freshman □ Junior □ Graduate student
□ Sophomore □ Senior □ Not in school
What is your annual household income?
□ Less than $20,000 □ $60,000-79,999 □ $100,000-119,999
□ $20,000-39,999 □ $80,000-99,999 □ 120,000 or more
□ $40,000-59,999
Are You Hispanic or Latino, i.e., a person of Cuban, Mexican, Puerto Rican, South or Central
American, or other Spanish culture or origin, regardless of race? □ Yes □ No
With which racial/ethnic group(s) do you identify?
□ American Indian or Alaska Native
□ Asian
□ Black or African American
□ Native Hawaiian or other Pacific Islander
□ White
□ Other (please specify) ____________________
What is your sex? □ Male □ Female
Did you use your own smartphone for viewing the page? □ Yes □ No
What model smartphone did you use? ____________________________________________
What tourism related app do you use most (i.e., TripIt, Tripiso, Field Trip, etc.)?
__________________________________
How often to you use this app? □ Rarely □ Occasionally □ Frequently
Is there another travel related app you use (i.e., Lonely Planet, TripAdvisor, FlightAware, an airlines
app)? _____________________________
How often to you use this app? □ Rarely □ Occasionally □ Frequently
Thank you for your participation!!!!

APPENDIX E
IRB EXEMPTION

139