Embed Size (px)
Citation preview

EXAMINE TRADE FINANCE METHODS USED BY
TRADING COMPANIES GLOBALLY AND EVALUATE
THEIR EFFECTIVENESS
TEOH TEIK TOE
(James Cook University Australia – Singapore Campus)
Werner R. Murhadi
(Universitas Surabaya, Indonesia)
NEETU KATARIA
(Anglia Ruskin University, UK)
ABSTRACT
This study is planned in the functional area of Trade Finance Methods used by trading
companies globally and in Singapore with focus to study on effectiveness in each
method. While arriving at the effectiveness of the trade finance method the effort has
been to include not just the cost or pricing dimension but also risk mitigation aspects
as well as the documentation intensity translating to the convenience factor of the
method. Research further attempted to explore importance accorded to country risk
element over the counterparty risk by banks while pricing the trade finance product
offered to the trading companies. Research aim is to quantify and validate the general
understanding on the effectiveness of trade finance techniques employed by the
trading companies. Researcher has explored and analysed the relationship or
interrelationships between variable – cost effectiveness, risk mitigation and
documentation aspects of commonly used trade finance products, so as to obtain
effects by causative factors (Creswell, 1994) to have a great insight into the overall
effectiveness of the trade finance products being used by the trading companies.
Researcher employed „Survey‟ methodology to articulate research questions and
hypothesis in the field. Researcher designed and administered the questionnaires to
specific set of banking professionals & representatives of trading companies active in
trade finance areas. Sample of trading Companies and Banks was carefully selected
using stratified random probabilistic sampling approach. Data collected was analysed
using non-parametric statistical packages to establish association like chi-square (χ²)
and the extent/ degree of association like spearman correlation coefficient( or rs).
Researcher concluded that documentation has been sighted as major reason for its
lower use as a source of trade finance. Based on the results it can be reasonably
deduced that documentation intensity might affect rationality significantly while
choosing between letter of credit vis-à-vis other source of finance such as Bill
discounting. It can be reasonably inferenced that increased documentation might have
resulted in a risky practice of going for clean invoice financing where use of letter of
credit would have been optimal from the risk management perspective of the trading
companies. Research concluded that country risk is more potent factor considered by
the banks where documentary credit like Letter of Credit is extended while
creditworthiness might influence pricing where trading company goes in for other
trade finance methods such as invoice financing.

Keywords: International Trade, Bill Discounting, Letter of Credit, Clean Invoice
Finance & Country Risk

1. Introduction
Trading companies from various parts of the globe have set up their offices in
Singapore for carrying out trading activities due to varied reasons like better access to
ports, good legal system, convenient time zoning etc. Schemes like Global Trading
Partners (GTP) etc. administered by International Enterprises, Singapore (IE website,
2012) provide congenial atmosphere for the trading companies. Further Singapore
provides strong judicial and legal system and has good presence of financial
institutions - 122 commercial banks and 49 merchant banks in Singapore as per
Monetary Authority of Singapore (Source: MAS website, 2012). Trading companies
deal in multiple commodities who facilitate import- export based on commercial and
financial documents. In the process trading companies facilitate to manage the
pressures on the working capital cycles of both importers and exporters by stepping in
to make payment to the exporters using the trade finance facilities available from the
banks based on the title documents. Bank facilities are used till importer pays off on
receiving the goods. Trading companies thus always look out for the financing
facilities to keep this fund cycle going and would ensure that bank facilities are
effective in terms of cost and risk effectiveness. Most effective bank facility would be
the one that would optimally balance the cost, convenience of use and the risk for
these trading companies. In contrast, the bankers who provide these trade finance
facilities would also base the pricing of the trade facilities on the inherent risk of the
facility besides considering factors such as creditworthiness of the companies, tenure
of the facility and the security offered. Thus it is always a tight rope walk for trading
companies to balance finance costs and their trading margins.
How efficiently these trading company rotate funds would determine how
profitable their operations would be. This would critically depend on trading company
using the most effective bank facility. Most effective bank facility is one which
optimally balances cost, ease of documentation and the risk mitigation for these
trading companies. From industry practice it is observed that trading companies
predominantly prefer use of bill discounting as a source of trade finance. Letter of
credit- a documentary credit, on the other hand is preferred where there is potential
counterparty risk is observed. However documentary credit documentation is really a
major hurdle. What are the chances that increased documentation would result in a
risky practice of going for bill discounting in such cases? On the Other hand, Banks

who are on the opposite end of the price risk spectrum, has to manage the risk arising
out of the trade finance facilities. Are they inclined to build risk premium by way of
higher rates while pricing their products. What is the consideration for pricing, is it
creditworthiness of buyer or the country risk? Researcher will study various trade
finance facilities and design a research methodology which would aim to arrive at the
most commonly used source of trade finance, most cost effective source of trade
finance and least documentation intensive source of trade finance.
Based on the explanation above, this research will study following research questions:
(1) Do Trading Companies prefer Bill Discounting over other sources of trade finance
like Letter of credit as most cost effective? (2) Is Letter of credit superior product
compared to Bill discounting from the perspective of risk mitigation for trading
companies? (3) Would excessive documentation influence choice of trade finance
method employed by the trading companies? (4) Do banks charge premium based on
creditworthiness while pricing the trade finance products to reflect the higher risk. Do
banks consider Country risk as more important factor for pricing decision than the
counterparty risk
2. Literature Review
2.1. International Trade
International trade is the buying and selling of goods and services across national
borders or Territories as a result of uneven distribution of natural resources in different
countries. Both when sourcing supplies and when selling the products, a company is
exposed to risk. Such risks cannot be avoided but can only be better managed.
Sources of Risk for the Parties involved in trade finance are:
Buyer’s Insolvency/Credit Risk refers to the inability of the buyer to honour full
payment for goods or services rendered on due date. This is a risk on seller
associated with selling or supplying a product or service without collecting full
payment or experienced late payment.
Buyer’s Acceptance Risk refers to the buyer‟s non-acceptance of goods delivered
or services rendered. Unaccepted goods or services may create difficulty for the
seller to dispose the goods to another buyer or encounter working capital problem.
Knowledge Inadequacy A buyer or seller who intends to expand his business into
another product/service/industry/country

may not have adequate knowledge on the risk of the new product/service, local
market situation or goods‟ fashion. The lack of knowledge increases the chances of
business failure.
Seller’s Performance Risk - A seller may fail to carry out his obligations in a
sales contract due to one or more reasons, and such non-performance by the seller
may have adverse consequential impacts on the buyer‟s business. It could be
expensive for the buyer to take legal actions against the seller in his country.
Documentation Risk is the risk of non-conformance to specific documentation
requirements under a sales contract or documentary credit. Failure in fulfilling
documentation requirements may result in seller‟s inability or delay in obtaining
payment for goods delivered or service rendered.
Economic Risk -Refers to unfavorable economic conditions in buyer or seller‟s
country which may affect both parties in fulfilling their obligations. On the buyer
side, economic risk may result in buyer‟s insolvency or inability to accept the
goods or services. On the other hand, the seller may experience difficulty in
producing or shipping the goods per se.
Cultural Risk - Different countries have their unique language and culture. The
inability to appreciate/accept cultural differences and/or language barrier may
result in conflicts and non-completion of the sales contract.
Legal Risk - Potential for financial loss arising from uncertainty of legal
proceeding or change in legislation, such as a foreign exchange control policy. A
sales contract could be frustrated due to changes in laws and regulations.
Foreign Exchange Risk -A buyer or seller may deal with foreign currencies in
their daily course of business. This implies that they are exposed to fluctuations in
foreign exchange market which may result in paying more (by the buyer) or
receiving less (from the buyer) in terms of the local currency.
Interest Rate Risk is the risk borne by an interest-bearing asset, such as a floating
rate loan. An increase in interest rate will result in buyer or seller paying more
interest for their floating rate loan.
Political/Sovereign Risk refers to the complications that buyer or seller may
expose due to unfavourable political decisions or political changes that may vary
the expected outcome of an outstanding contract. Examples of political/sovereign
risk are changes in fiscal/monetary policy, war, riots, terrorism, trade embargoes,
etc.
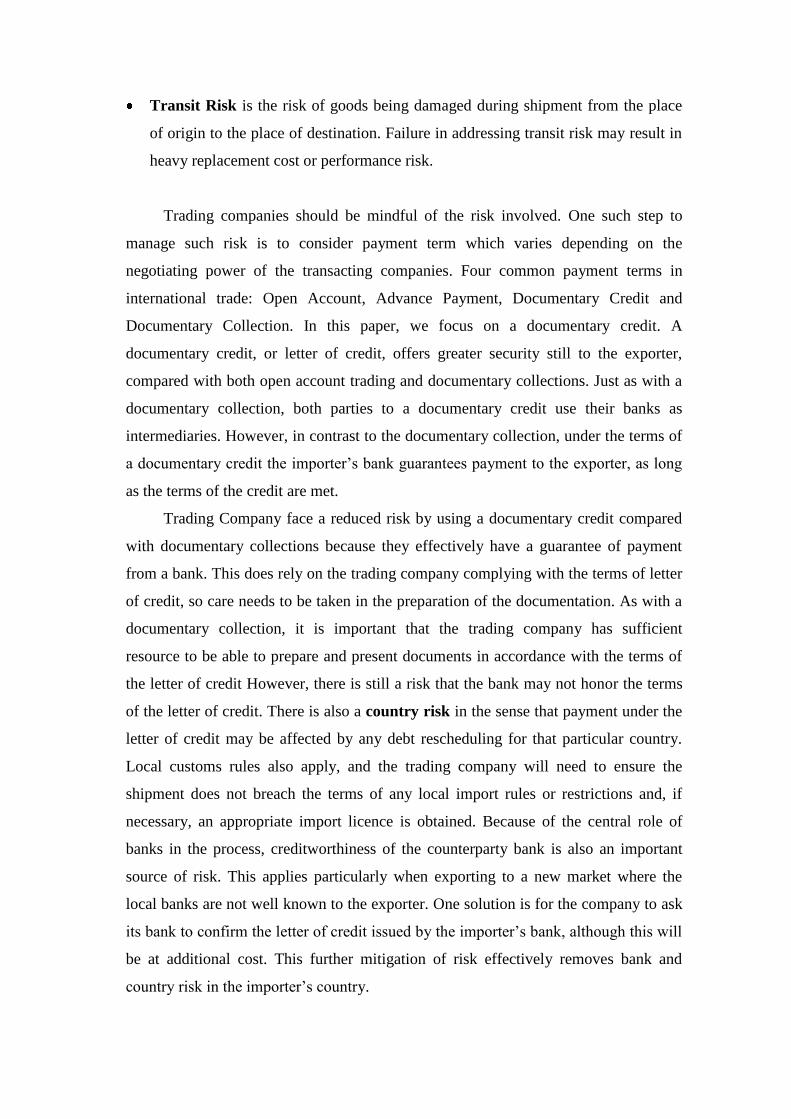
Transit Risk is the risk of goods being damaged during shipment from the place
of origin to the place of destination. Failure in addressing transit risk may result in
heavy replacement cost or performance risk.
Trading companies should be mindful of the risk involved. One such step to
manage such risk is to consider payment term which varies depending on the
negotiating power of the transacting companies. Four common payment terms in
international trade: Open Account, Advance Payment, Documentary Credit and
Documentary Collection. In this paper, we focus on a documentary credit. A
documentary credit, or letter of credit, offers greater security still to the exporter,
compared with both open account trading and documentary collections. Just as with a
documentary collection, both parties to a documentary credit use their banks as
intermediaries. However, in contrast to the documentary collection, under the terms of
a documentary credit the importer‟s bank guarantees payment to the exporter, as long
as the terms of the credit are met.
Trading Company face a reduced risk by using a documentary credit compared
with documentary collections because they effectively have a guarantee of payment
from a bank. This does rely on the trading company complying with the terms of letter
of credit, so care needs to be taken in the preparation of the documentation. As with a
documentary collection, it is important that the trading company has sufficient
resource to be able to prepare and present documents in accordance with the terms of
the letter of credit However, there is still a risk that the bank may not honor the terms
of the letter of credit. There is also a country risk in the sense that payment under the
letter of credit may be affected by any debt rescheduling for that particular country.
Local customs rules also apply, and the trading company will need to ensure the
shipment does not breach the terms of any local import rules or restrictions and, if
necessary, an appropriate import licence is obtained. Because of the central role of
banks in the process, creditworthiness of the counterparty bank is also an important
source of risk. This applies particularly when exporting to a new market where the
local banks are not well known to the exporter. One solution is for the company to ask
its bank to confirm the letter of credit issued by the importer‟s bank, although this will
be at additional cost. This further mitigation of risk effectively removes bank and
country risk in the importer‟s country.
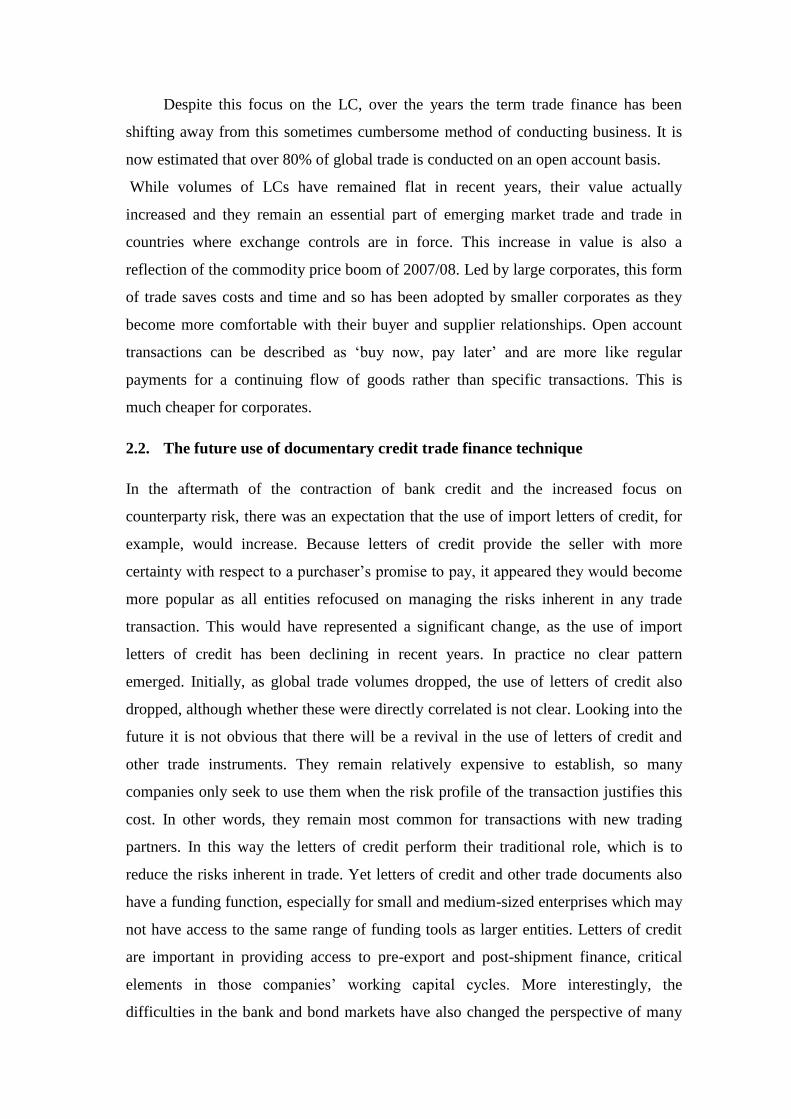
Despite this focus on the LC, over the years the term trade finance has been
shifting away from this sometimes cumbersome method of conducting business. It is
now estimated that over 80% of global trade is conducted on an open account basis.
While volumes of LCs have remained flat in recent years, their value actually
increased and they remain an essential part of emerging market trade and trade in
countries where exchange controls are in force. This increase in value is also a
reflection of the commodity price boom of 2007/08. Led by large corporates, this form
of trade saves costs and time and so has been adopted by smaller corporates as they
become more comfortable with their buyer and supplier relationships. Open account
transactions can be described as „buy now, pay later‟ and are more like regular
payments for a continuing flow of goods rather than specific transactions. This is
much cheaper for corporates.
2.2. The future use of documentary credit trade finance technique
In the aftermath of the contraction of bank credit and the increased focus on
counterparty risk, there was an expectation that the use of import letters of credit, for
example, would increase. Because letters of credit provide the seller with more
certainty with respect to a purchaser‟s promise to pay, it appeared they would become
more popular as all entities refocused on managing the risks inherent in any trade
transaction. This would have represented a significant change, as the use of import
letters of credit has been declining in recent years. In practice no clear pattern
emerged. Initially, as global trade volumes dropped, the use of letters of credit also
dropped, although whether these were directly correlated is not clear. Looking into the
future it is not obvious that there will be a revival in the use of letters of credit and
other trade instruments. They remain relatively expensive to establish, so many
companies only seek to use them when the risk profile of the transaction justifies this
cost. In other words, they remain most common for transactions with new trading
partners. In this way the letters of credit perform their traditional role, which is to
reduce the risks inherent in trade. Yet letters of credit and other trade documents also
have a funding function, especially for small and medium-sized enterprises which may
not have access to the same range of funding tools as larger entities. Letters of credit
are important in providing access to pre-export and post-shipment finance, critical
elements in those companies‟ working capital cycles. More interestingly, the
difficulties in the bank and bond markets have also changed the perspective of many

larger companies towards letters of credit and other trade finance instruments. These
instruments benefit the larger companies in two ways. Firstly, the funding techniques
open funding streams larger companies have been able to ignore in recent years. With
more emphasis on managing funding risk, treasurers in even the largest companies are
reviewing their assessment of trade instruments. Secondly, the risk management
tools incorporated into trade instruments are of increased interest as companies focus
more on managing counterparty risk. These movements have come at a time when
bank technologies have made it possible for banks to offer a more coordinated cash
and trade proposition, integrating the two sides of traditional banking activity, which
historically had remained separate.
2.2.1. Bill Discounting
Collection/ Bill Discounting is one of the conventional methods of payment in
international trade whereby the seller forwards financial and/or commercial documents
to the buyer against cash payment or acceptance of a bill of exchange. In collection,
banks control the release of documents and payments based on the Uniform Rules for
Collection ICC Publication No. 522, but do not commit to pay the seller, unlike
documentary credit operations. Collection is suitable in circumstances where the
buyer‟s solvency is not in doubt and the seller wants additional security in payment.
2.2.2. Invoice or Trust Receipt (TR) discounting
Trust Receipt (TR) is a type of short-term import loan to provide the buyer with
financing to settle goods imported under Letter of Credit where title of goods is held
by the bank. Under a TR arrangement, the Bank retains title to the goods but allows
the buyer to take possession of the goods on trust for resale before paying the Bank on
TR due date. TR financing is applicable to goods imported under documentary credit.
For documentary collection, we offer import loans against Import Invoice Financing is
a short term loan applicable to buyer who trade on open account basis.
2.2.3. Banker’s Guarantee Issuance
A Banker‟s Guarantee (BG) is a definite undertaking by the bank (guarantor) to pay
the beneficiary a certain sum of money within a specified period if the applicant
(principal) fails to fulfill his contractual or other obligations of an underlying

transaction. It is normally used to secure either a financial or performance obligation
of the principal. BG can be issued to both local and overseas beneficiary either in the
form of hardcopy or transmitted via SWIFT message MT760 or MT799.
2.2.4. Overdrafts
Overdrafts can be an effective way to finance working capital. Where offered, they are
usually relatively flexible, although this will depend on any terms and conditions
applied by the bank offering the facility. An overdraft facility allows a company to run
its current or checking account with a debit balance. Overdraft facilities should be pre-
arranged and are sometimes offered by banks without the need for formal security.
Where available, overdrafts are usually renewable on an annual basis, although in
certain jurisdictions a bank may require funds to be repaid before a facility is renewed.
In some locations it is common practice to turn an informal overdraft into a committed
facility after a period, often a month. They are not available everywhere, through
either market practice or regulation. Some countries prohibit companies from
arranging any unsecured overdrafts. In Venezuela, for example, account holders are
prohibited from writing cheques with insufficient funds to support them. Their
availability may be restricted to short periods. In some countries, for example France,
companies may only be able to arrange overdrafts for periods up to about a month,
after which banks insist on converting the arrangement to secured borrowing. Banks in
Poland, on the other hand, usually require companies to clear their overdraft facilities
once a year. Banks can withdraw overdraft facilities on demand. A bank is most likely
to withdraw such facilities from a company which relies on them, simply because such
companies represent the greatest counterparty risk to the bank. In 2009 a number of
UK companies reported that their banks withdrew part of their overdraft facilities
when the UK government arranged a moratorium on the payment of VAT.
However it occurs, any withdrawal of overdraft facilities to a company which relies on
them (whether as a permanent source of funds or as the funding of last resort) will put
significant pressure on that company‟s cash flow. Because they are unsecured,
overdrafts are often a relatively expensive method of arranging finance. For example,
overdrafts in Mexico are usually charged at more than double the prevailing rate on
treasury bills. The Basel 2 treatment of overdrafts is less favorable than other
techniques, such as invoice discounting. Banks will now be looking more often for a
facility fee and a non-utilisation fee to cover the capital costs associated with such a
facility.
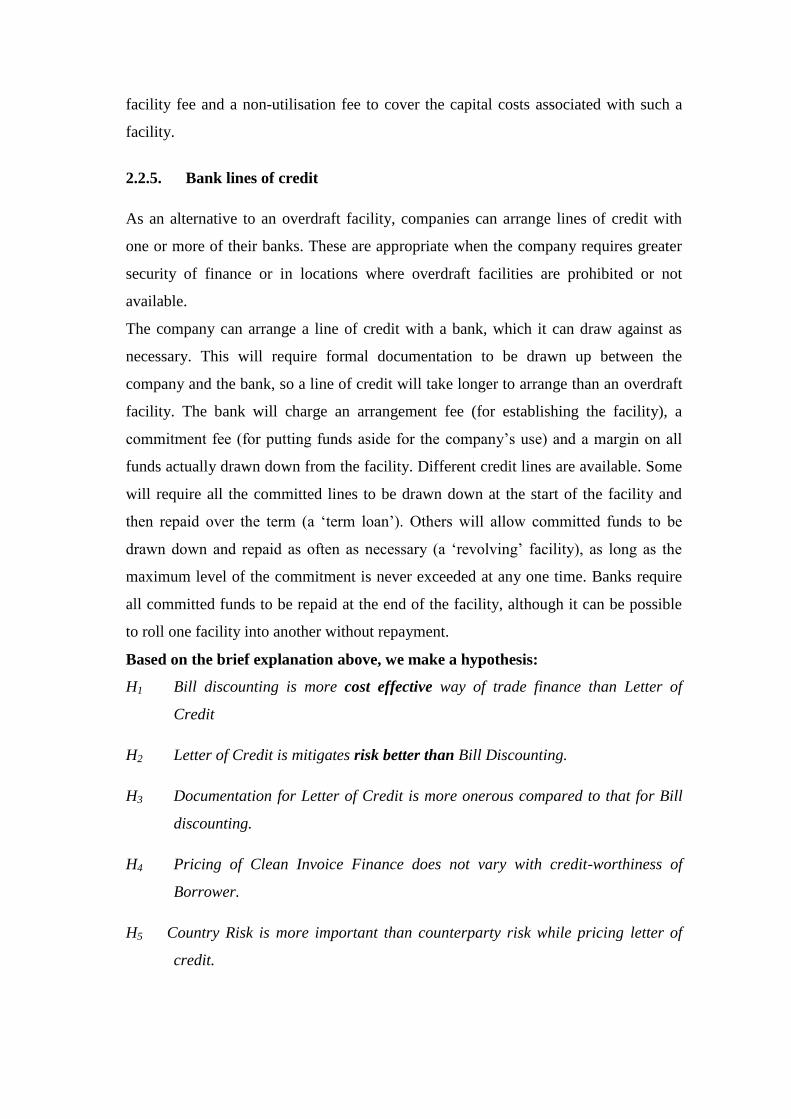
2.2.5. Bank lines of credit
As an alternative to an overdraft facility, companies can arrange lines of credit with
one or more of their banks. These are appropriate when the company requires greater
security of finance or in locations where overdraft facilities are prohibited or not
available.
The company can arrange a line of credit with a bank, which it can draw against as
necessary. This will require formal documentation to be drawn up between the
company and the bank, so a line of credit will take longer to arrange than an overdraft
facility. The bank will charge an arrangement fee (for establishing the facility), a
commitment fee (for putting funds aside for the company‟s use) and a margin on all
funds actually drawn down from the facility. Different credit lines are available. Some
will require all the committed lines to be drawn down at the start of the facility and
then repaid over the term (a „term loan‟). Others will allow committed funds to be
drawn down and repaid as often as necessary (a „revolving‟ facility), as long as the
maximum level of the commitment is never exceeded at any one time. Banks require
all committed funds to be repaid at the end of the facility, although it can be possible
to roll one facility into another without repayment.
Based on the brief explanation above, we make a hypothesis:
H1 Bill discounting is more cost effective way of trade finance than Letter of
Credit
H2 Letter of Credit is mitigates risk better than Bill Discounting.
H3 Documentation for Letter of Credit is more onerous compared to that for Bill
discounting.
H4 Pricing of Clean Invoice Finance does not vary with credit-worthiness of
Borrower.
H5 Country Risk is more important than counterparty risk while pricing letter of
credit.

3. Research Methodology
These research used „Survey‟ methodology to articulate research question or the
hypothesis in the field. Questionnaire designed to administer specific set of banks who
are active in providing trade finance to trading companies. Survey research
methodology is generally mapped to relativist epistemologies (Easter-Smith, 2008,
p.83) which assume that there are regular patterns in human and organisational
behaviour which are often difficult to detect and to explain. As a result cross-sectional
designs, which enable multiple factors to be measured simultaneously, are employed.
Researcher had used factual & inferential survey designs. Factual questions in
the questionnaire were used to collect and collate the factual data on the cost
effectiveness of Invoice financing as a trade finance tool. Inferential questions in the
questionnaire which is aim to establish relationship between use of trade facility vis-à-
vis documentation intensity. Cross Sectional survey was performed by the researcher.
Participants included banks incorporated in Singapore & branches of the global banks
and trading companies were included local trading companies as well as branches of
the global trading companies. Researcher included the trading companies from varying
sizes in term of their turnover and those dealing in different trading products.
Data collected would be quantitative and any qualitative data would be
quantified. Researcher used both qualitative (non-numerical form) and quantitative
(numerical form) data for the purpose of conducting research using various sources of
data. Questionnaire and Interviews were used as in Delphi Study, where the aim is to
gather opinions from carefully selected group of experts (Collis, 2009, p.192)
Researcher used primary and secondary sources of data. For Primary sources,
interviews were carefully scheduled with bank respondents due to confidentiality or
commercially sensitiveness perceived by interviewees (Easterby-Smith, 1991 cited in
Collis, 2009, p.144). Questionnaires using Likert scale were developed as a source of
primary data. Primary Sources included self-administered questionnaires,
Interviews- Face to face, email & telephonic with the representatives of 30 Banks &
50 Trading companies. Secondary sources of data included organisation‟s websites,
annual reports, Journals etc. Official websites of 10 major banks and 8 trading
companies were reviewed for trade finance practices. Discrete details of data collected
from the respondent category-wise as per under:
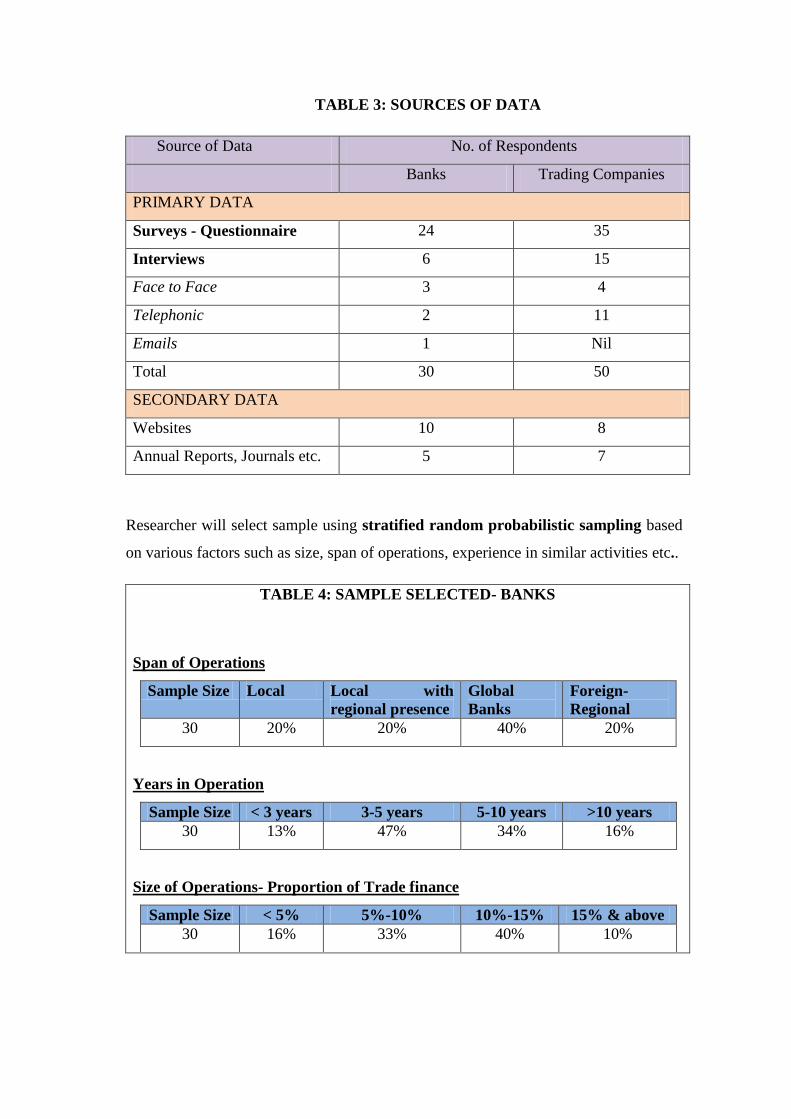
TABLE 3: SOURCES OF DATA
Source of Data No. of Respondents
Banks Trading Companies
PRIMARY DATA
Surveys - Questionnaire 24 35
Interviews 6 15
Face to Face 3 4
Telephonic 2 11
Emails 1 Nil
Total 30 50
SECONDARY DATA
Websites 10 8
Annual Reports, Journals etc. 5 7
Researcher will select sample using stratified random probabilistic sampling based
on various factors such as size, span of operations, experience in similar activities etc..
TABLE 4: SAMPLE SELECTED- BANKS
Span of Operations
Sample Size Local Local with
regional presence
Global
Banks
Foreign-
Regional
30 20% 20% 40% 20%
Years in Operation
Sample Size < 3 years 3-5 years 5-10 years >10 years
30 13% 47% 34% 16%
Size of Operations- Proportion of Trade finance
Sample Size < 5% 5%-10% 10%-15% 15% & above
30 16% 33% 40% 10%

TABLE 5: SAMPLE SELECTED- TRADING COMPANIES
Span of Operations
Sample
Size
Local Local with
regional presence
Global Foreign-
Regional
50 24% 20% 34% 22%
Business Segment
Sample
Size
Agri-
Commodities
Non-Agri (excl.
Energy)
Energy
Related
Others
50 28% 26% 28% 18%
Size of operations*
Sample
Size
< 40 40-100 100-200 200 and
above
50 30% 40% 20% 10%
* No of Trade Finance Transactions per month
Years of Operation
Sample
Size
< 3 years 3-5 years 5-10 years >10 years
50 20% 30% 30% 20%
Preferred Source of Trade Finance
Sample Size Bill
Discounting
Letter of Credit Invoice
Finance
Bankers
Guarantee
50 36% 12% 48% 4%
Researcher used Excel and SPSS (Statistical Package for Social Sciences) or
PASW (Predictive Analytics SoftWare) for analysing quantitative data. Researcher
analysed data using following statistical techniques: Researcher will use the
descriptive statistics to summarize data in a compact form so that it can be presented in
tables, charts or other graphical forms to help ascertain patterns which will aid
subsequent Hypothesis detection/ confirmation (Lovie, 1986 cited in Collis, 2009, p.
221). Researcher will analyse data by using the following descriptive statistics:
Distribution, Central Tendency Measures: Mean(μ), Mode & Median, Dispersion
Measure: Range & Standard Deviation, Normal Distribution – Skewness (extent of
asymmetry beyond +1 & -1 indicates Skewness) & Kurtosis ( extent to which

distribution is flat or peak) distribution where responses are heavily in the centre are
peaked (+3) or where scores are widely distributed (-3) are flat.
Researcher also used inferential statistics that helped to lead her to conclusions
about the target population based on the random sample (Kervin, 1992 cited in Collis,
2009, p.222). Following non parametric tests/ techniques were used since the data
collected was largely Ordinal/Nominal: Test of Association: Chi-Square test (χ²)
and Test of Correlation. Strength of association between the two variables is
measured by correlation coefficient. Pearson correlation measures linear
relationship, while Spearman correlation measures non-linear relationship. Number
varies between +1 and nearer the value to 1 more is the association either positive or
negative.
4. Results, Analysis & Discussion
4.1. Results
4.1.1. Bill Discounting was preferred by trading companies over Letter of Credit in
terms of cost effectiveness. Of the total 50 respondents from various industry segments
and varies level of operations and varied sizes, 37 of the respondents preferred Bill
discounting over Letter of credit.
4.1.2. Based on the sample data results were deduced for the total population using
chi- square test of „goodness of fit‟. Following conclusions were drawn :
We sampled 50 Trading companies and evaluated whether the Trading companies who
consider Bill Discounting was equal to the number of Traders who consider LC in
terms of cost effectiveness (expected outcome representing null Hypothesis H0). The
data was analyzed using chi square goodness of fit test. Observed frequencies for Bill
Discounting (f=37) compared with that observed for LC (f=13) was much higher. The
null hypothesis was rejected, χ² (1) = 11.520, p<0.001. Bill Discounting was
preferred by the traders over LC in terms of cost effectiveness.
4.1.3. Letter of credit was observed to be a superior product compared to Bill
discounting from the perspective of risk mitigation for trading companies. Of the total
50 respondents from various industry segments and varies level of operations and
varied sizes, 34 of the respondents preferred Letter of credit compared to 16 who
preferred Bill discounting.
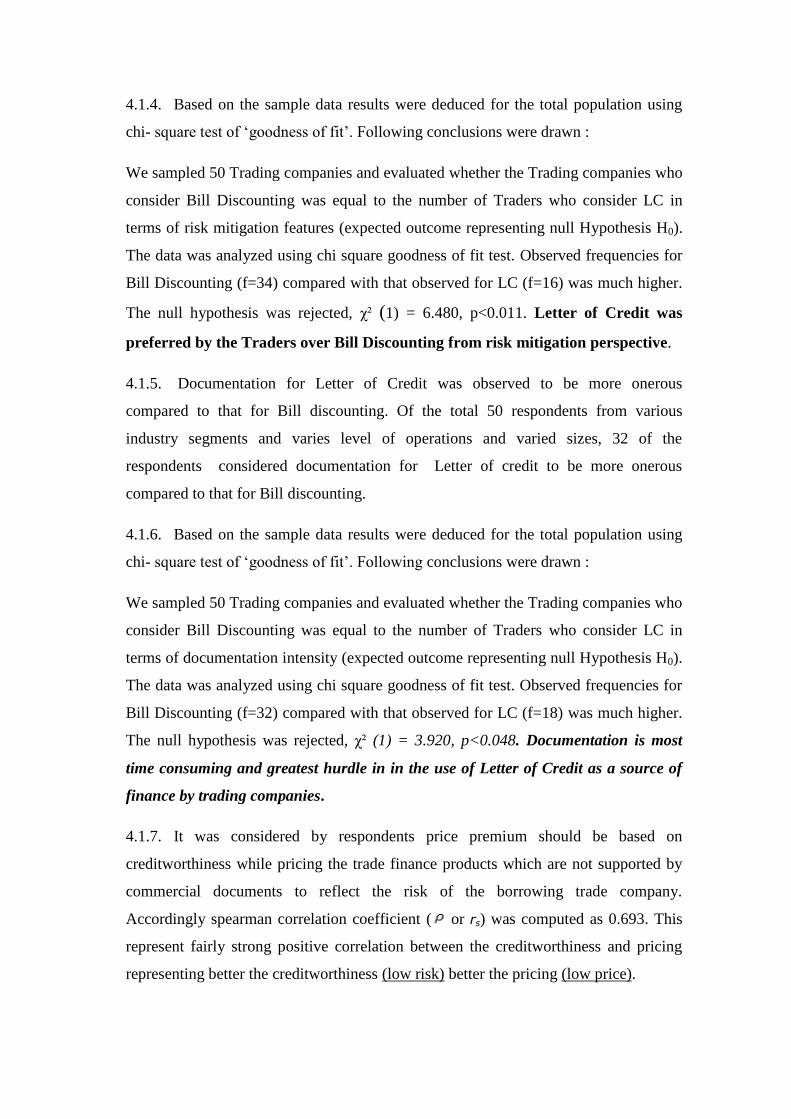
4.1.4. Based on the sample data results were deduced for the total population using
chi- square test of „goodness of fit‟. Following conclusions were drawn :
We sampled 50 Trading companies and evaluated whether the Trading companies who
consider Bill Discounting was equal to the number of Traders who consider LC in
terms of risk mitigation features (expected outcome representing null Hypothesis H0).
The data was analyzed using chi square goodness of fit test. Observed frequencies for
Bill Discounting (f=34) compared with that observed for LC (f=16) was much higher.
The null hypothesis was rejected, χ² (1) = 6.480, p<0.011. Letter of Credit was
preferred by the Traders over Bill Discounting from risk mitigation perspective.
4.1.5. Documentation for Letter of Credit was observed to be more onerous
compared to that for Bill discounting. Of the total 50 respondents from various
industry segments and varies level of operations and varied sizes, 32 of the
respondents considered documentation for Letter of credit to be more onerous
compared to that for Bill discounting.
4.1.6. Based on the sample data results were deduced for the total population using
chi- square test of „goodness of fit‟. Following conclusions were drawn :
We sampled 50 Trading companies and evaluated whether the Trading companies who
consider Bill Discounting was equal to the number of Traders who consider LC in
terms of documentation intensity (expected outcome representing null Hypothesis H0).
The data was analyzed using chi square goodness of fit test. Observed frequencies for
Bill Discounting (f=32) compared with that observed for LC (f=18) was much higher.
The null hypothesis was rejected, χ² (1) = 3.920, p<0.048. Documentation is most
time consuming and greatest hurdle in in the use of Letter of Credit as a source of
finance by trading companies.
4.1.7. It was considered by respondents price premium should be based on
creditworthiness while pricing the trade finance products which are not supported by
commercial documents to reflect the risk of the borrowing trade company.
Accordingly spearman correlation coefficient ( or rs) was computed as 0.693. This
represent fairly strong positive correlation between the creditworthiness and pricing
representing better the creditworthiness (low risk) better the pricing (low price).

4.1.8. Besides Creditworthiness of the counterparty, other risk factors also have
bearing on the price premium charged by the bankers. Researcher observed that
country risk element was strongly viewed by the respondents as more potent risk
compared to counterparty risk for documentary credits.
4.2. Analysis & Discussion
4.2.1. Do Trading Companies prefer Bill Discounting over other sources of trade
finance like Letter of credit as most cost effective?
Descriptive statistical analysis: The responses received from 50 respondents of the
sample trading companies with varying size, span and business segment. Responses
were mapped on the on the Likert scale of 1 to 7, with 1 meaning „Strongly Agree‟ and
7 meaning „Strongly Disagree‟ and frequency distribution was prepared as per below:
Table 6: Frequency Distribution: Cost Effectiveness
Valid Frequency Percent Valid Percent Cumulative Percent
1 12 24.0 24.0 24.0
2 10 20.0 20.0 44.0
3 13 26.0 26.0 70.0
4 4 8.0 8.0 78.0
5 4 8.0 8.0 86.0
6 4 8.0 8.0 94.0
7 3 6.0 6.0 100.0
Total 50 100.0 100.0
It can be observed that 70% of the sample population, as represented by the right most
column in the table above, strongly agree that bill discounting is more cost effective
compared to the use of Letter of Credit. Since there are no missing numbers percent
and valid percent are the same. Histogram was plotted with normal curve
superimposed on histogram to present the visual representation of the frequency
distribution chart prepared as above.
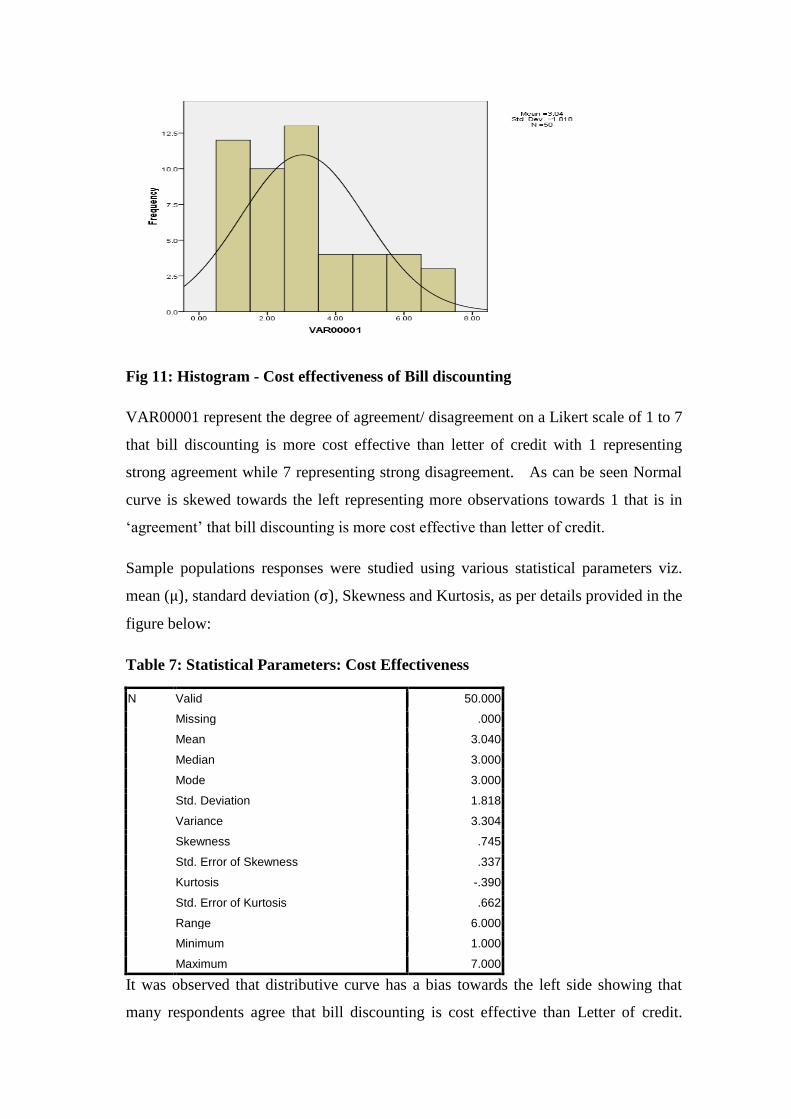
Fig 11: Histogram - Cost effectiveness of Bill discounting
VAR00001 represent the degree of agreement/ disagreement on a Likert scale of 1 to 7
that bill discounting is more cost effective than letter of credit with 1 representing
strong agreement while 7 representing strong disagreement. As can be seen Normal
curve is skewed towards the left representing more observations towards 1 that is in
„agreement‟ that bill discounting is more cost effective than letter of credit.
Sample populations responses were studied using various statistical parameters viz.
mean (μ), standard deviation (σ), Skewness and Kurtosis, as per details provided in the
figure below:
Table 7: Statistical Parameters: Cost Effectiveness
N Valid 50.000
Missing .000
Mean 3.040
Median 3.000
Mode 3.000
Std. Deviation 1.818
Variance 3.304
Skewness .745
Std. Error of Skewness .337
Kurtosis -.390
Std. Error of Kurtosis .662
Range 6.000
Minimum 1.000
Maximum 7.000
It was observed that distributive curve has a bias towards the left side showing that
many respondents agree that bill discounting is cost effective than Letter of credit.
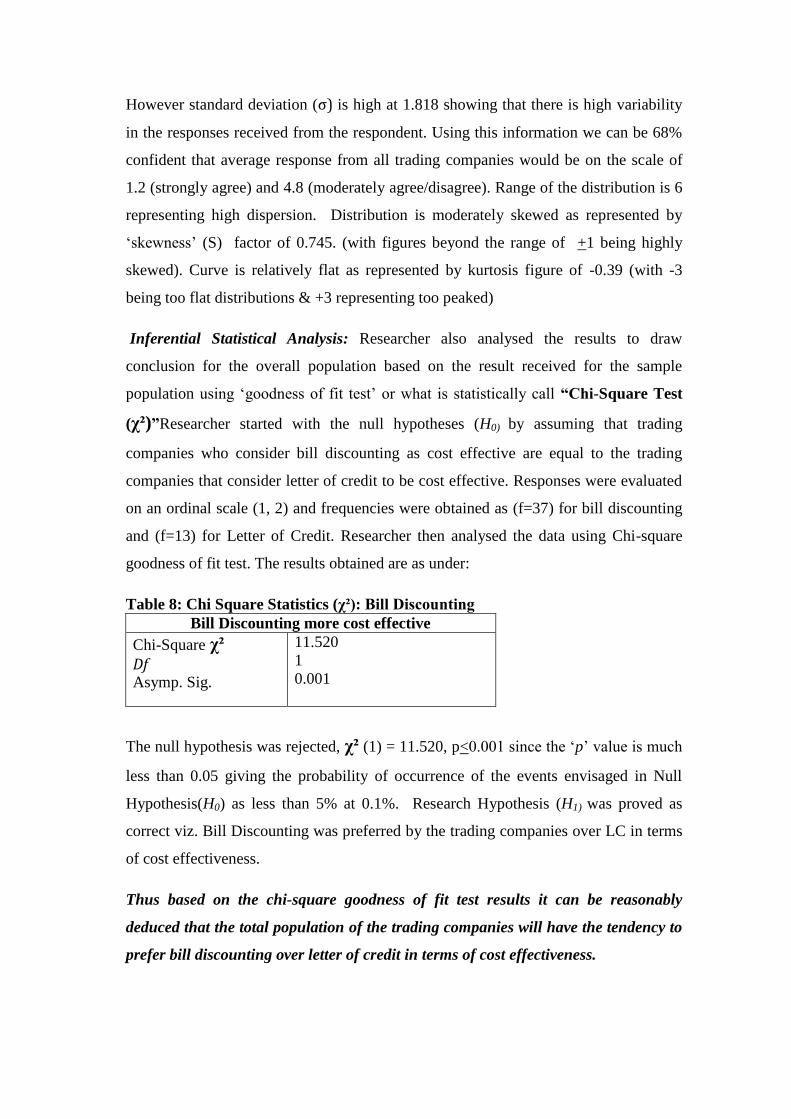
However standard deviation (σ) is high at 1.818 showing that there is high variability
in the responses received from the respondent. Using this information we can be 68%
confident that average response from all trading companies would be on the scale of
1.2 (strongly agree) and 4.8 (moderately agree/disagree). Range of the distribution is 6
representing high dispersion. Distribution is moderately skewed as represented by
„skewness‟ (S) factor of 0.745. (with figures beyond the range of +1 being highly
skewed). Curve is relatively flat as represented by kurtosis figure of -0.39 (with -3
being too flat distributions & +3 representing too peaked)
Inferential Statistical Analysis: Researcher also analysed the results to draw
conclusion for the overall population based on the result received for the sample
population using „goodness of fit test‟ or what is statistically call “Chi-Square Test
(χ²)”Researcher started with the null hypotheses (H0) by assuming that trading
companies who consider bill discounting as cost effective are equal to the trading
companies that consider letter of credit to be cost effective. Responses were evaluated
on an ordinal scale (1, 2) and frequencies were obtained as (f=37) for bill discounting
and (f=13) for Letter of Credit. Researcher then analysed the data using Chi-square
goodness of fit test. The results obtained are as under:
Table 8: Chi Square Statistics (χ²): Bill Discounting
Bill Discounting more cost effective
Chi-Square χ² Df Asymp. Sig.
11.520
1
0.001
The null hypothesis was rejected, χ² (1) = 11.520, p<0.001 since the „p‟ value is much
less than 0.05 giving the probability of occurrence of the events envisaged in Null
Hypothesis(H0) as less than 5% at 0.1%. Research Hypothesis (H1) was proved as
correct viz. Bill Discounting was preferred by the trading companies over LC in terms
of cost effectiveness.
Thus based on the chi-square goodness of fit test results it can be reasonably
deduced that the total population of the trading companies will have the tendency to
prefer bill discounting over letter of credit in terms of cost effectiveness.

4.2.2. Is Letter of credit superior product compared to Bill discounting from the
perspective of risk mitigation for trading companies?
Descriptive statistical analysis: The responses received from 50 respondents of the
sample trading companies with varying size, span and business segment. Responses
were mapped on the on the Likert scale of 1 to 7, with 1 meaning „Strongly Agree‟ and
7 meaning „Strongly Disagree‟ and frequency distribution was prepared as per below:
Table 9: Frequency Distribution: Risk Mitigation by use of LC
Frequency Percent Valid Percent
Cumulative Percent
Valid 1 28 56.0 56.0 56.0
2 18 36.0 36.0 92.0
3 4 8.0 8.0 100.0
Total 50 100.0 100.0
It can be observed that 92% of the sample population, as represented by the right most
column in the table above, strongly agree that Letter of Credit is more effective
compared to the use of bill discounting from the risk management perspective. Since
there are no missing numbers percent and valid percent are the same. Histogram was
plotted with normal curve superimposed on histogram to present the visual
representation of the frequency distribution chart prepared as above.
Fig 12: Histogram – Risk Mitigation by use of LC
“RISKLC” represent the degree of agreement/ disagreement on a Likert scale of 1 to 7
that letter of credit is more effective than bill discounting with 1 representing strong
agreement while 7 representing strong disagreement. As can be seen Normal curve is
skewed towards the left representing more observations towards 1 that is in

„agreement‟ that letter of credit is more cost effective than bill discounting from the
risk management perspective meaning trade finance availed by way of Letter of credit
proffered more safety to the trading companies compared to Bill discounting.
Sample populations responses were studied using various statistical parameters viz.
mean, standard deviation, Skewness and Kurtosis, as per details provided in the figure
below:
Table 10: Statistical Parameters: Risk Mitigation by use of LC
N Valid 50.000
Missing .000
Mean 1.520
Median 1.000
Mode 1.000
Std. Deviation .646
Variance .418
Skewness .867
Std. Error of Skewness .337
Kurtosis -.262
Std. Error of Kurtosis .662
Range 2.000
Minimum 1.000
Maximum 3.000
It was observed that distributive curve has a bias towards the left side showing that
many respondents agree that Letter of credit is effective than bill discounting from the
risk mitigation perspective meaning trade finance availed by way of Letter of credit
proffered more safety to the trading companies compared to Bill discounting. However
standard deviation is moderate at 0.646 showing that there is moderate variability in
the responses received from the respondent. Using this information we can be 68%
confident that average response from all trading companies would be on the scale of
0.874 (strongly agree) and 2.166 (moderately agree). Range of the distribution is 3
representing moderate dispersion. Distribution is near highly skewed as represented
by „Skewness‟(S) factor of 0.867. (with figures beyond the range of +1 being highly
skewed). Curve is relatively flat as represented by kurtosis(K) figure of -0.26 (with -3
being too flat distributions & +3 representing too peaked)
Inferential Statistical Analysis: Researcher also analysed the results to draw
conclusion for the overall population based on the result received for the sample
population using „goodness of fit test‟ or what is statistically call “Chi-Square Test

(χ²)”. Researcher started with the null hypotheses (H0) by assuming that trading
companies who consider bill discounting to be as effective from the risk mitigation
angle are equal to the trading companies that consider letter of credit to be cost
effective. Responses were evaluated on an ordinal scale (1, 2) and frequencies were
obtained as (f=34) for bill discounting and (f=16) for Letter of Credit. Researcher then
analysed the data using Chi-square goodness of fit test. The results obtained are as
under:
Table 11: Chi Square Statistics (χ²): Risk Mitigation by use of LC
LC mitigates risk better than Bill Discounting
Chi-Square (χ²) Df
Asymp. Sig.
6.480a
1
0.011
The null hypothesis was rejected, χ² (1) = 6.480, p<0.011 since the „p‟ value is much
less than 0.05 giving the probability of occurrence of the events envisaged in Null
Hypothesis(H0) as less than 5% at 1.1%. Research Hypothesis (H1) was proved as
correct viz. Letter of Credit was preferred by the trading companies over Bill
Discounting in terms of effectiveness from risk management perspective .
Thus based on the chi-square goodness of fit test results it can be reasonably
deduced that the total population of the trading companies will have the tendency to
prefer letter of credit over bill discounting in terms of effectiveness of LC from risk
mitigation perspective.
4.2.3. Would excessive documentation influence choice of trade finance method
employed by the trading companies?
Descriptive statistical analysis: The responses received from 50 respondents of the
sample trading companies with varying size, span and business segment. Responses
were mapped on the on the Likert scale of 1 to 7, with 1 meaning „Strongly Agree‟ and
7 meaning „Strongly Disagree‟ and frequency distribution was prepared as per below:
Table 12: Frequency Distribution – Documentation
Frequency Percent Valid Percent
Cumulative Percent
Valid 1 23 46.0 46.0 46.0

2 13 26.0 26.0 72.0
3 6 12.0 12.0 84.0
4 5 10.0 10.0 94.0
5 3 6.0 6.0 100.0
Total 50 100.0 100.0
It can be observed that 84% of the sample population, as represented by the right most
column in the table above, strongly agree that level of documentation would have
influence over the choice of the trade finance product employed by the trading
companies. Since there are no missing numbers percent and valid percent are the same.
Histogram was plotted with normal curve superimposed on histogram to present the
visual representation of the frequency distribution chart prepared as above.
FIG. 13 Histogram- Documentation Intensity of LC
LCDOC represent the degree of agreement/ disagreement on a Likert scale of 1 to 7
that Letter of credit is more document intensive than Bill discounting with 1
representing strong agreement while 7 representing strong disagreement on the Likert
scale. As can be seen Normal curve is skewed towards the left representing more
observations towards 1 that is in „agreement‟ that Letter of credit is more document
intensive than Bill discounting.
Sample populations responses were studied using various statistical parameters viz.
mean, standard deviation, Skewness and Kurtosis, as per details provided in the figure
below:
Table 13: Statistical Parameters: Documentation Intensity of LC

N Valid 50.000
Missing .000
Mean 2.040
Median 2.000
Mode 1.000
Std. Deviation 1.245
Variance 1.549
Skewness 1.046
Std. Error of Skewness .337
Kurtosis .037
Std. Error of Kurtosis .662
Range 4.000
Minimum 1.000
Maximum 5.000
It was observed that distributive curve has a bias towards the left side showing that
many respondents agree that Letter of credit is more document intensive than Bill
discounting. However standard deviation (σ) is high at 1.245 showing that there is
high variability in the responses received from the respondent. Using this information
we can be 68% confident that average response from all trading companies would be
on the scale of 0.795 (strongly agree) and 3.285(moderately agree). Range of the
distribution is 4 representing moderate dispersion. Distribution is highly skewed as
represented by „Skewness‟ (S) factor of 1.046. (with figures beyond the range of +1
being highly skewed). Curve is relatively flat as represented by kurtosis figure of -0.03
(with -3 being too flat distributions & +3 representing too peaked)
Inferential Statistical Analysis: Researcher also analysed the results to draw
conclusion for the overall population based on the result received for the sample
population using „goodness of fit test‟ or what is statistically call “Chi-Square Test”
(χ²). Researcher started with the null hypotheses (H0) by assuming that trading
companies who consider documentation requirements for bill discounting as extensive
as those for Letter of Credit to be equal to the trading companies that consider letter of
credit to be more extensive. Responses were evaluated on an ordinal scale (1, 2) and
frequencies were obtained as (f=32) for bill discounting and (f=18) for Letter of
Credit. Researcher then analysed the data using Chi-square goodness of fit test. The
results obtained are as under:
Table 14: Chi Square Statistics (χ²): Documentation Intensity of LC

LC documentation was most extensive
Chi-Square χ² Df
Asymp. Sig.
3.920a
1
0.048
The null hypothesis was rejected, χ² (1) = 3.920, p<0.048 since the „p‟ value is less
than 0.05 giving the probability of occurrence of the events envisaged in Null
Hypothesis(H0) as less than 5% at 4.8%. Research Hypothesis (H1) was proved as
correct confirming that documentation requirements for Letter of credit are more
extensive than Bill discounting.
Thus based on the chi-square goodness of fit test results it can be reasonably
deduced that the total population of the trading companies will have the tendency to
prefer bill discounting over letter of credit purely from the perspective of ease of
documentation
4.2.4. Do banks charge premium based on creditworthiness while pricing the
trade finance products to reflect the higher risk.
Descriptive statistical analysis: The responses received from 30 respondents of the
sample banks with varying size, span and level of trade finance operations were
analysed. Responses were mapped on the on the Likert scale of 1 to 7, with 1 meaning
„Strongly Agree‟ and 7 meaning „Strongly Disagree‟ and frequency distribution was
prepared as per below:
Table 15: Frequency Distribution Credit worthiness vs. Price
Valid Frequency Percent Valid Percent
Cumulative Percent
1 9 30.0 30.0 33.3
2 8 26.7 26.7 60.0
3 2 6.6 6.6 66.6
4 4 13.3 13.3 76.7
5 5 16.7 16.7 93.3
6 2 6.7 6.7 100.0
Total 30 100.0 100.0
It can be observed that 76.7% of the sample population, as represented by the right
most column in the table above, strongly agree that creditworthiness of the trading
company would have influence over the price premium charged by the bank
especially for trade finance products not supported by commercial documents viz.

Clean invoice finance. Histogram was plotted with normal curve superimposed on
histogram to present the visual representation of the frequency distribution chart
prepared as above.
FIG 14: Histogram – Creditworthiness vs. Price
PRICECREDIT represent the degree of agreement/ disagreement on a Likert scale of 1
to 7 that credit worthiness affects the price premium charged by the banks for the trade
finance facilities offered especially those not supported by the commercial documents
viz. Clean invoice finance with 1 representing strong agreement while 7 representing
strong disagreement on the Likert scale. As can be seen Normal curve moderately
Skewed towards the left representing more observations towards 1 that is in
„agreement‟ that Letter of credit is more document intensive than Bill discounting.
Sample populations responses were studied using various statistical parameters viz.
mean, standard deviation, Skewness and Kurtosis, as per details in the figure below:
Table 16: Statistical Parameters: Creditworthiness vs. Price
N Valid 30.000
Missing .000
Mean 2.700
Median 2.000
Mode 1.000
Std. Deviation 1.784
Variance 3.183
Skewness .487
Std. Error of Skewness .427
Kurtosis -1.165
Std. Error of Kurtosis .833
Range 6.000

Minimum .000
Maximum 6.000
It was observed that distributive curve has a slight bias towards the left side showing
that many respondents agree that creditworthiness somewhat determines price
premium charged by the banks for the trading companies especially where the
facilities requested for is not based on the commercial documents viz. Clean invoice
financing. However standard deviation (σ) is high at 1.784 showing that there is high
variability in the responses received from the respondent. Using this information we
can be 68% confident that average response from all trading companies would be on
the scale of 0.916 (strongly agree) and 4.484 (moderately disagree/ agree). Range of
the distribution is 4 representing moderate dispersion. Distribution is moderately
skewed as represented by „Skewness‟ (S) factor of 0.487 (with figures beyond the
range of +1 being highly skewed). Curve is relatively flat as represented by kurtosis
figure of -1.1653 (with -3 being too flat distributions & +3 representing too peaked)
Inferential Statistical Analysis: Researcher also analysed the results to draw
conclusion for the overall population based on the result received for the sample
population using correlation observed between the sample variables
“creditworthiness” and “price premium” charged by the bank. It was considered by
respondents price premium should be based on creditworthiness while pricing the
trade finance products which are not supported by commercial documents to reflect
the risk of the borrowing trade company. Accordingly spearman correlation coefficient
( or rs) was computed as 0.693. This represent fairly strong positive correlation
between the creditworthiness and pricing representing better the creditworthiness (low
risk) better the pricing (low price).
4.2.5. Do banks consider Country risk as more important factor for pricing
decision than the counterparty risk
Creditworthiness of the counterparty though does play role in price premium
determination by banks. However it was observed that Country risk element was also
strongly viewed by the respondents as more potent risk compared to counterparty risk
Descriptive statistical analysis: The responses received from 30 respondents of the
sample banks with varying size, span and level of trade finance operations were

analysed. Responses were mapped on the on the Likert scale of 1 to 7, with 1 meaning
„Strongly Agree‟ and 7 meaning „Strongly Disagree‟ and frequency distribution was
prepared as per below:
Table 17: Frequency Distribution – Country Risk Vs. Counterparty Risk
Frequency Percent Valid Percent
Cumulative Percent
Valid 1 13 43.3 43.3 43.3
2 10 33.3 33.3 76.7
3 5 16.7 16.7 93.3
4 2 6.7 6.7 100.0
Total 30 100.0 100.0
It can be observed that 93.3% of the sample population, as represented by the right
most column in the table above, strongly agree that country-risk as more potent risk
compared to the counterparty risk. Histogram was plotted with normal curve
superimposed on histogram to present the visual representation of the frequency
distribution chart prepared as above
FIG 15: Histogram- Country Risk vs. Counterparty Risk
“CountryRisk” represent the degree of agreement/ disagreement on a Likert scale of 1
to 7 that country risk is more important than the counterparty risk for trade finance
transaction. with 1 representing strong agreement while 7 representing strong
disagreement on the Likert scale. As can be seen Normal curve moderately Skewed

towards the left representing more observations towards 1 meaning thereby that
country risk is more important than the counterparty risk for trade finance products.
Sample populations responses were studied using various statistical parameters viz.
mean, standard deviation, Skewness and Kurtosis, as per details provided in the figure
below:
Table 18: Statistical Parameters- Country vs. Counterparty Risk
N Valid 30.000
Missing .000
Mean 1.867
Median 2.000
Mode 1.000
Std. Deviation .937
Variance .878
Skewness .820
Std. Error of Skewness .427
Kurtosis -.201
Std. Error of Kurtosis .833
Range 3.000
Minimum 1.000
Maximum 4.000
It was observed that distributive curve has a slight bias towards the left side showing
that many respondents agree that country risk is more important than the counterparty
risk for trade finance transaction. However standard deviation (σ) is high at 0.934,
showing that there is high variability in the responses received from the respondent.
Using this information we can be 68% confident that average response from all trading
companies would be on the scale of 0.930 (strongly agree) and 2.804 (moderately
agree). Range of the distribution is 3 representing moderate dispersion. Distribution is
moderately skewed as represented by „Skewness‟ (S) factor of 0.820 (with figures
beyond the range of +1 being highly skewed). Curve is relatively flat as represented
by kurtosis figure of -0.201 (with -3 being too flat distributions & +3 representing too
peaked)
Inferential Statistical Analysis: Researcher also analysed the results to draw
conclusion for the overall population based on the result received for the sample
population using „goodness of fit test‟ or what is statistically call “Chi-Square Test

(χ²)”. Researcher started with the null hypotheses (H0) by assuming that trading
companies who consider documentation requirements for bill discounting as extensive
as those for Letter of Credit to be equal to the trading companies that consider letter of
credit to be more extensive. Responses were evaluated on an ordinal scale (1, 2) and
frequencies were obtained as (f=22) for country risk and (f=8) for counterparty risk.
Researcher then analysed the data using Chi-square goodness of fit test. The results
obtained are as under:
Table 19: Chi -Square Statistics (χ²): Country vs. Counterparty Risk
LC documentation was most extensive
Chi-Square (χ²)
Df
Asymp. Sig.
6.533a
1
0.011
The null hypothesis was rejected, χ² (1) = 6.533, p<0.011 since the „p‟ value is less
than 0.05 giving the probability of occurrence of the events envisaged in Null
Hypothesis(H0) as less than 5% at 1.1%. Research Hypothesis (H1) was proved as
correct confirming that country risk is more important than the counterparty risk.
Thus based on the chi-square goodness of fit test results it can be reasonably
deduced that the total population of the trading companies will have the tendency to
rate country risk as a higher than the counterparty risk.
5. Conclusion & Recommendations
Research concluded that bill discounting is overall more effective than other
form of trade finance since it optimally balances the cost, documentation and risk
elements in favor of trading companies. Letter of credit on the other hand is preferred
where the risk element involved is on a higher side be it risk on account of counterpart
risk or country risk. However research concluded that despite robust risk management
features, lower use of letter of credit is on account of intensive documentation
involved. Research further concluded that country risk is more potent factor
considered by the banks where documentary credit like Letter of Credit is extended
while creditworthiness might influence pricing where trading company goes in for
other trade finance methods such as invoice financing.
Research concluded that bill discounting is overall more effective than other
form of trade finance since it optimally balances the cost, documentation and risk

elements in favor of trading companies. However it was observed that availability of
the bill discounting critically depend on the availability of existing credit lines with the
banks. Given that documentation is not extensive it can be reasonably argued that
bankers would have done due diligence while granting those credit lines to these
trading companies. Since the scope of the current result does not factor into account
the possible role of availability of the established line of credit from the banker, future
research in this area can review the role of established lines of credit in influencing the
overall choice of Trade finance methods employed by the trading companies.
Research has attempted to draw conclusions to the universe of trading
companies based on the observations made for the sample population selected with the
help of inferential statistical techniques such as “goodness of fit” test using Chi-Square
(χ²) method in respect of the findings viz. cost effectiveness of bill discounting,
effectiveness of LC in the risk mitigation and intensity of the documentation in the
Letter of credit. Conclusions of the inferential statistic confirm that the results of the
research are equally valid for the entire population since the p statistics of the Chi-
Square (χ²) test is less than 0.05.
While sample selected is representative of the industry and covered the cross
section of all significant participants in the industry in terms of size, span of operation,
business segment etc. in a fair manner so that the sample selected represents full proxy
to the Universe of trading companies i.e the entire population. However the research
included trading companies whose operations are global but the contacts have been
made to the representative based out of Singapore. For better global participation and
improve inferences at the global level future research may be done by including
representations from the Head office of the Global companies rather than their regional
offices.
Research focuses on areas where information sensitivity and confidentiality is
very high. Research has attempted to involve participant who have good
understanding, access and authority to reveal information on selective basis so that
research results are meaningful. However in view of the fact that information is
guarded and confidentiality is high in the research area, we feel that future research
would be more meaningful if conducted with the support of industry association or
self-regulatory body in terms of participation and willingness to share sensitive
information.

Researcher concluded that despite extensive documentation requirements for
Letter of credit, it remains the first choice where there is high risk perception of the
counterparty or where there is potentially strong country risk. However the possibility
of moral hazard cannot be completely ignored and there is a possibility that on account
of business exigencies, trading companies might be prone to choose riskier options
such as clean invoice finance for riskier counterparties or jurisdictions where letter of
credit would have been the ideal option. Given the criticality of this aspect future
research may focus on the moral hazard associated with various types of trade finance
sources.
REFERENCES
Berdies, D. & Anderson, J., 1974. Questionnaires: Design and Use. Metuchen, NJ:
Scarecrow Press.
Black, T. R., 1993, Evaluating Social Science Research, London: Sage.
British Chambers of Commerce, 1997. International Trade Manual, Oxford, UK:
Butterworth-Heinemann
Bryman, A., 2006. Integrating Quantitative and Qualitative Research: How it‟s done?,
Qualitative Research, Vol 6, pp.97-113.
Collis, Jill & Hussey, Roger, 2009. Business Research : A Practical Guide for
Graduate and Undergraduate Students, 3rd
ed. New York, NY: Palgrave
Macmillan
Coolican, H., 1992. Research Methods and Statistics in Psychology, London: Hodder
& Stoughton.
Creedy, J., 2001.Starting Research, The Australian Economic Review, 34(1), p.116.
Creswell, J. W., 2003. Research Design: Qualitative, Quantitative and Mixed Methods
Approaches, 2nd
ed., Thousand Oaks, CA: Sage.
Easterbay-Smith, M., Thorpe R. & Jackson Paul R., 2008, Management Research, 3rd
Ed. London: Sage Publications Ltd.
Easter-by Smith, M., Thorpe, R. & Lowe, A., 1991. Management Research: An
Introduction, London: Sage.
Edwards, P. et al, 2002. Increasing Response Rates to Postal Questionnaire:
Systematic Review, British Medical Journal, 324 May, pp.1183-91.
Fink, A., 1995. How to ask Survey Questions, Thousand Oaks, CA: Sage
Hair, Joseph F., Money Arthur H., Samouel, Phillip and Page, Mike, 2007. Research
Methods for business. England: John Wiley & Sons.
Hussey, R., 2007. The Application of personal construct theory in international
accounting research, Journal of Theoretical Accounting Research, 2(2), pp.34-
51.
Kerlinger, F. N., 1979, Behavioural Research: A Conceptual Approach, New York:
Holt, Rinehart & Winston.
Kuhn, T. S., 1962. The Structure of Scientific Revolutions, Chicago, IL: University of
Chicago Press.
Lovie, P., 1986. Identifying Outliers: New Developments in Statistics for Psychology
and Social Sciences 1, London: Methuen.

Morgan, G. & Smircich, L., 1980. The Case of Qualitative Research, Academy of
Management Review, 5, pp. 491-500.
Oppenheim, A.N., 2000. Questionnaire Design, Interviewing and Attitude
Measurement, London: Continuum International.
Patten, M., 1998. Questionnaire Research, Los Angeles, CA: Sage
Saunders, M., Lewis P. & Thornhill Adrian, 2009. Research Methods for Business
Students, 5th
ed. Harlow, England: Pearson Education Limited.
Vogt, W. P., 1993. Dictionary of Statistics and Methodology, Newbury Park, CA:
Sage.
Wallace, R.S.O. & Mellor, C. J., 1988. Non-response bias in mail accounting surveys:
A Pedagogical Note, British Accounting Review, 20, pp. 131-139.
Whiting, D. P., 1986. Finance of Foreign Trade. London: Pitman
Woodside, A.G. & Wilson, E. J. 1995., Applying Long Interview in Direct Marketing
Research, Journal of Direct Marketing Research, 9(1), 37-65