Embed Size (px)
Citation preview
Examine these primary sources of scientific evidence.
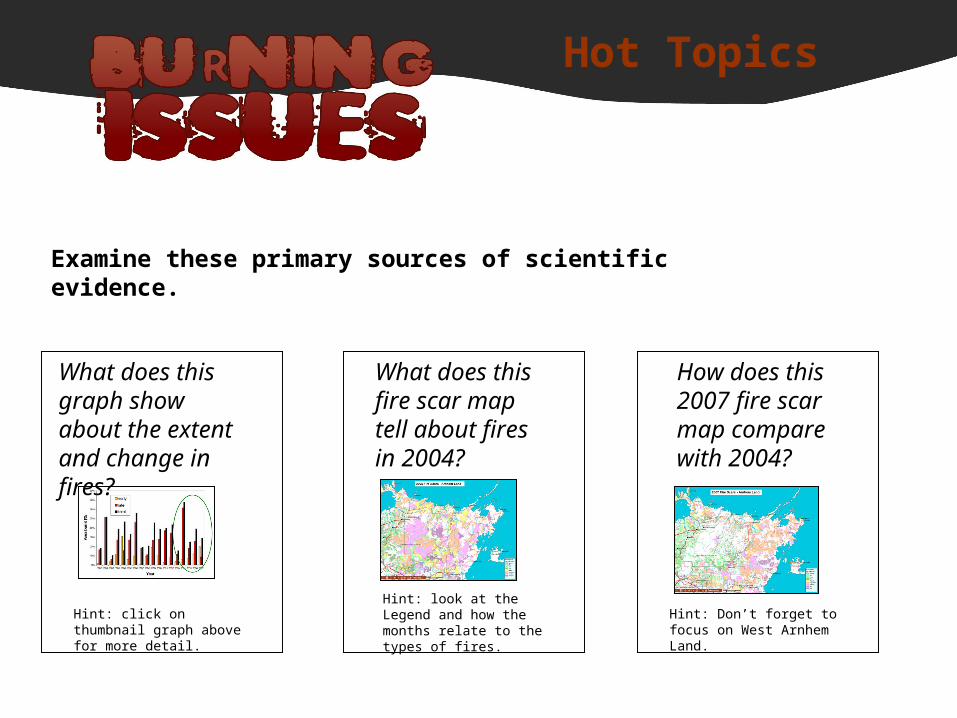
What does this graph show about the extent and change in fires?
Hint: click on thumbnail graph above for more detail.
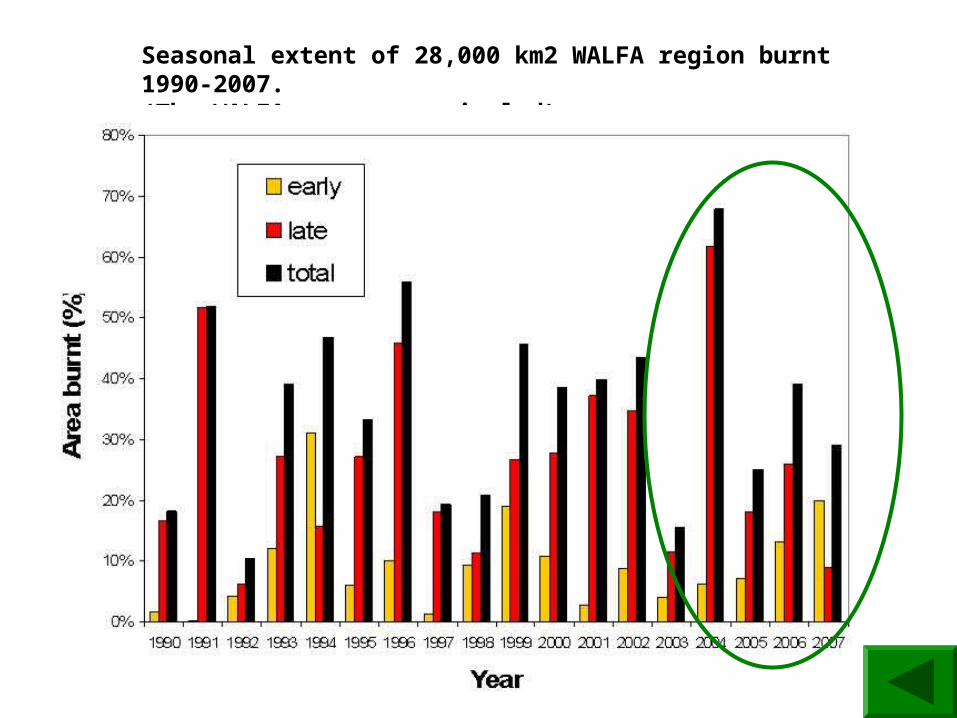
What does this fire scar map tell about fires in 2004?
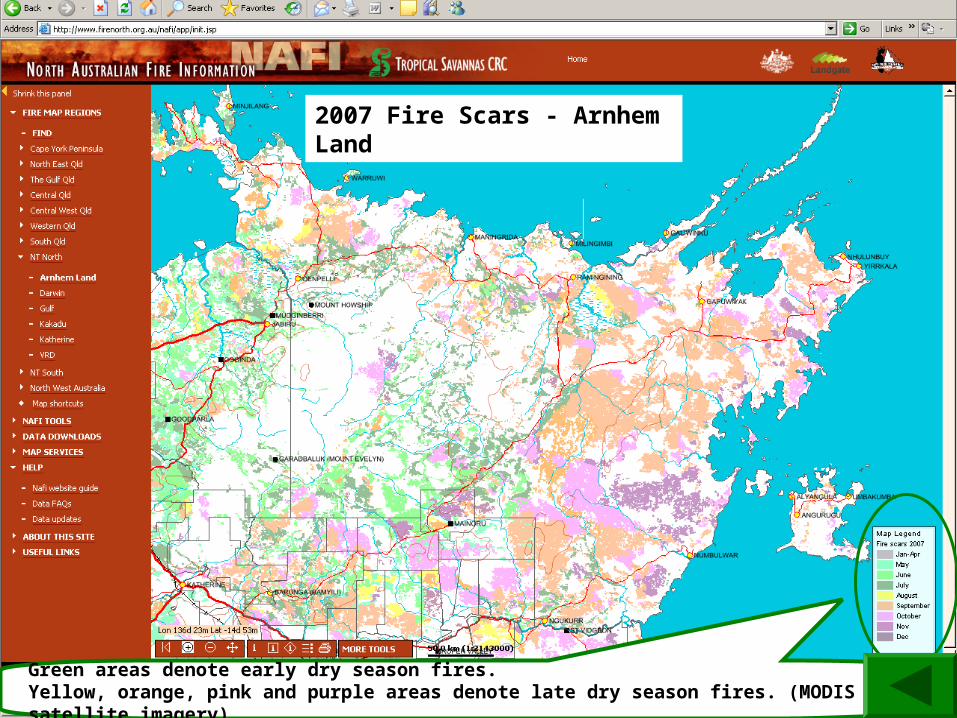
How does this 2007 fire scar map compare with 2004?
Hint: Don’t forget to focus on West Arnhem Land.
Hint: look at the Legend and how the months relate to the types of fires.
Hot Topics
Seasonal extent of 28,000 km2 WALFA region burnt 1990-2007. (The WALFA years are circled).
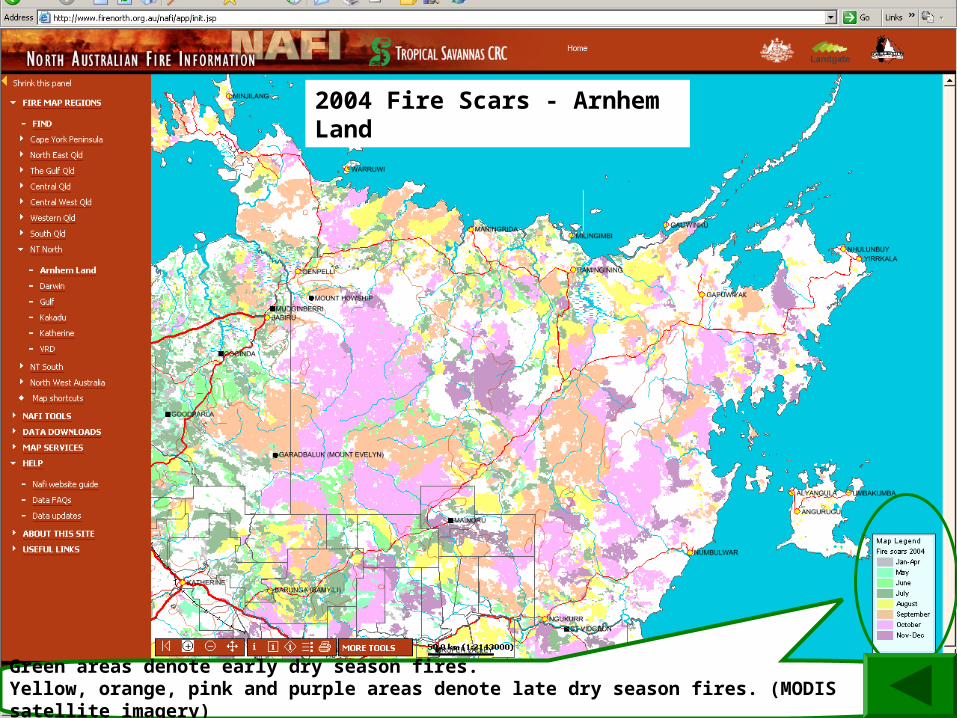
Figure 1 - 2004 Fire Scars (Arnhem Land)
Green areas denote early dry season fires. Yellow, orange, pink and purple areas denote late dry season fires. (MODIS satellite imagery)
2004 Fire Scars - Arnhem Land
Green areas denote early dry season fires. Yellow, orange, pink and purple areas denote late dry season fires. (MODIS satellite imagery)
2007 Fire Scars - Arnhem Land