Embed Size (px)
Citation preview
Examination of Thermal Examination of Thermal Impacts from Stormwater BMPs Impacts from Stormwater BMPs
Funded by: Funded by: USEPA Region 1 TMDL ProgramUSEPA Region 1 TMDL Program
Robert RoseenRobert Roseen PhD PE D WRE ;PhD PE D WRE ; Nicholas DiGennaro EIT;Nicholas DiGennaro EIT;
Project Team:Project Team: The UNH Stormwater Center The UNH Stormwater Center
Robert Roseen, Robert Roseen, PhD, PE, D.WRE ; PhD, PE, D.WRE ; Nicholas DiGennaro, EIT; Nicholas DiGennaro, EIT; Alison Alison Watts, PG, PhD; Watts, PG, PhD; Thomas Thomas Ballestero, PE, PhD, PH, CGWP; Ballestero, PE, PhD, PH, CGWP;
James James Houle, CPSWQHoule, CPSWQ; ; Timothy Timothy PulsPuls
UNH Stormwater Center, Department of Civil EngineeringUNH Stormwater Center, Department of Civil EngineeringUniversity of New HampshireUniversity of New Hampshire
18 201018 2010
11
Tuesday May 18, 2010Tuesday May 18, 2010
11
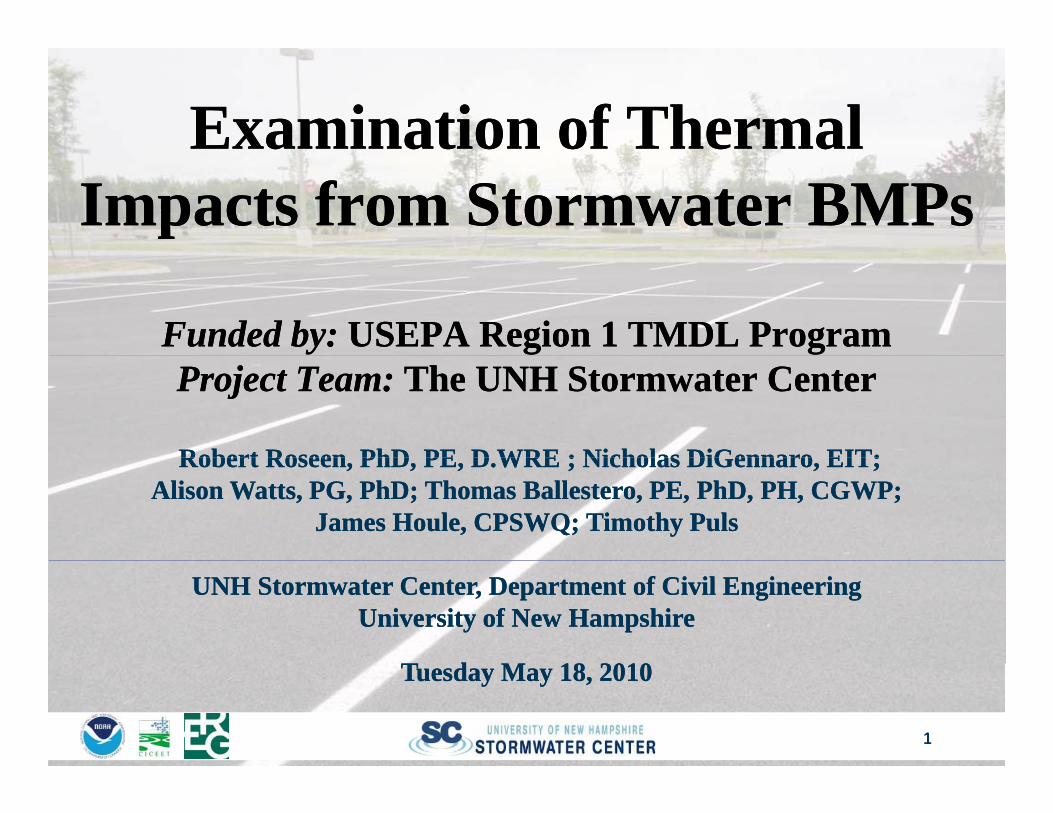
AAiirrHHeeaatt TTrraannssffeerr::
TT hh ee rr mmaa ll EE nn
IInnppuutt:: SSoollaarr RRaaddiiaattiioonn SSttoorrmmwwaatteerr BBMMPP
FFuunnccttiioonn ooff tthhee ttiimmee ooff ddaayy..
nn ee rr gg yy TThheerrmmaall EEnneerrggyy
IInnppuutt:: SSoollaarr RRaaddiiaattiioonn
TThheerrmmaall EEnneerrggyy
OOuuttppuutt:: HHeeaatt
SSttoorrmmwwaatteerr BBMMPP
HHeeaatt TTrraannssffeerr::
FFuunnccttiioonn ooff tthhee mmaassss ooff tthhee ssyysstteemm.. OOuuttppuutt:: HHeeaatt
H T ff
TT hh ee rr mm
GGrroouunndd HHeeaatt TTrraannssffeerr::
FFuunnccttiioonn ooff tthhee ddeepptthh ooff tthhee ssyysstteemm..
mmaa ll EE nn ee rr gg yy
22
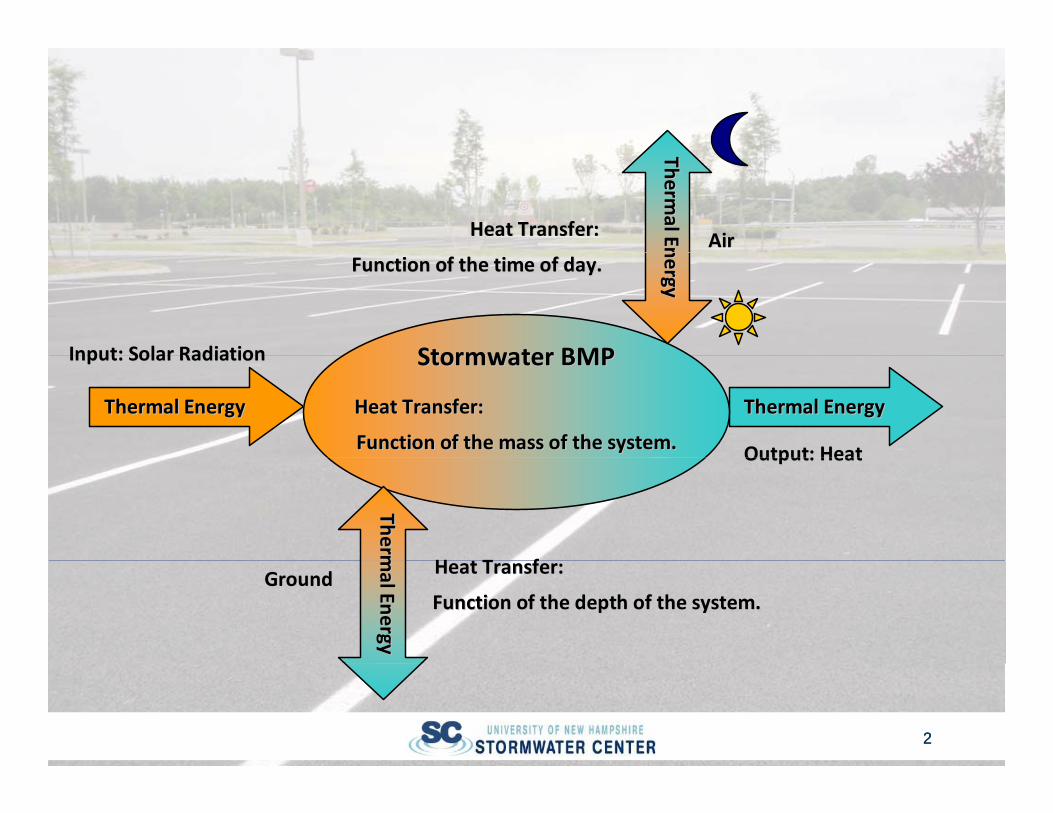
IntroductionIntroductionProject ObjectiveProject Objective
To quantify the effect of Best Management Practices To quantify the effect of Best Management Practices (BMPs n=8) on the temperature of(BMPs n=8) on the temperature of stormwaterstormwater runoffrunoff(BMPs, n 8) on the temperature of (BMPs, n 8) on the temperature of stormwaterstormwater runoff runoff in relation to established environmental indicators and in relation to established environmental indicators and lethality indices for fisheries and aquatic ecosystemslethality indices for fisheries and aquatic ecosystems
H pothesisH pothesisHypothesisHypothesisLarger surface systems will see greater thermal Larger surface systems will see greater thermal variationsvariationsvariationsvariationsLarger subsurface systems will see greater thermal Larger subsurface systems will see greater thermal bufferingbuffering
CCthth = m * C= m * CPP CCthth = heat capacity of a system (J/= heat capacity of a system (J/ooCC))m = mass of a system (kg)m = mass of a system (kg)
3333
CCPP = specific heat (J/= specific heat (J/kgkgooCC))
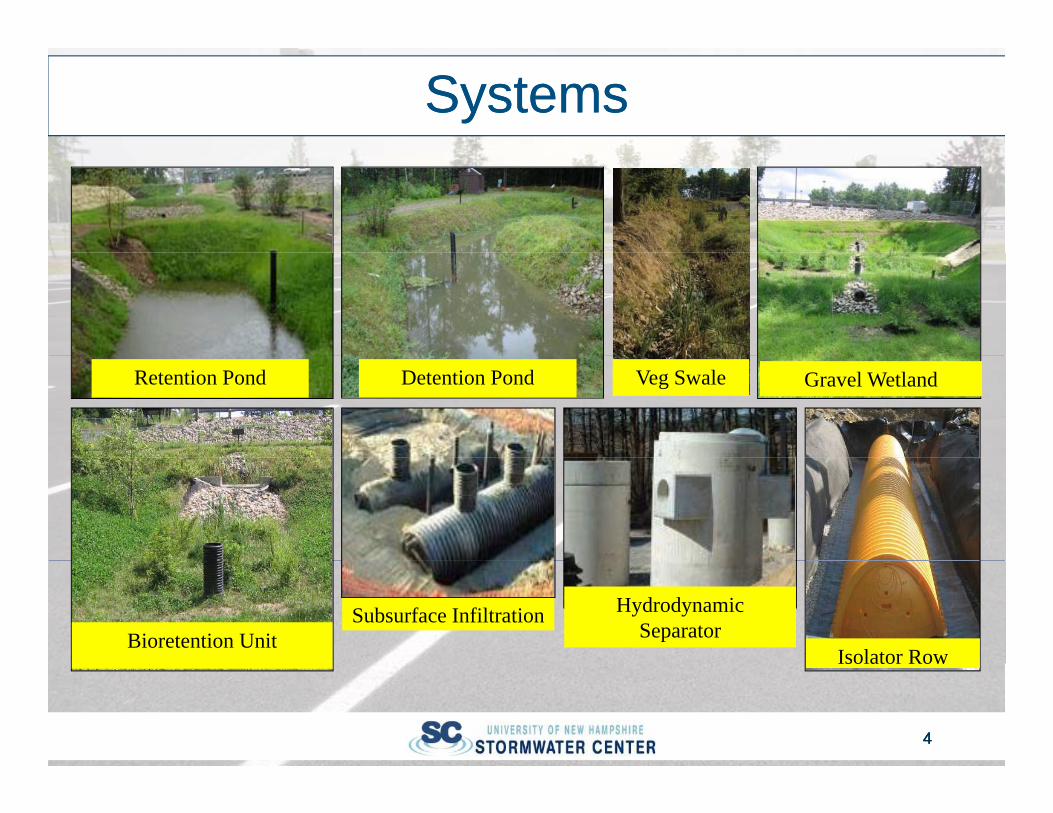
SystemsSystems
Retention Pond Gravel WetlandVeg SwaleDetention Pond
Hydrodynamic Separator
Subsurface Infiltration
Isolator RowBioretention Unit
4444
Isolator Row
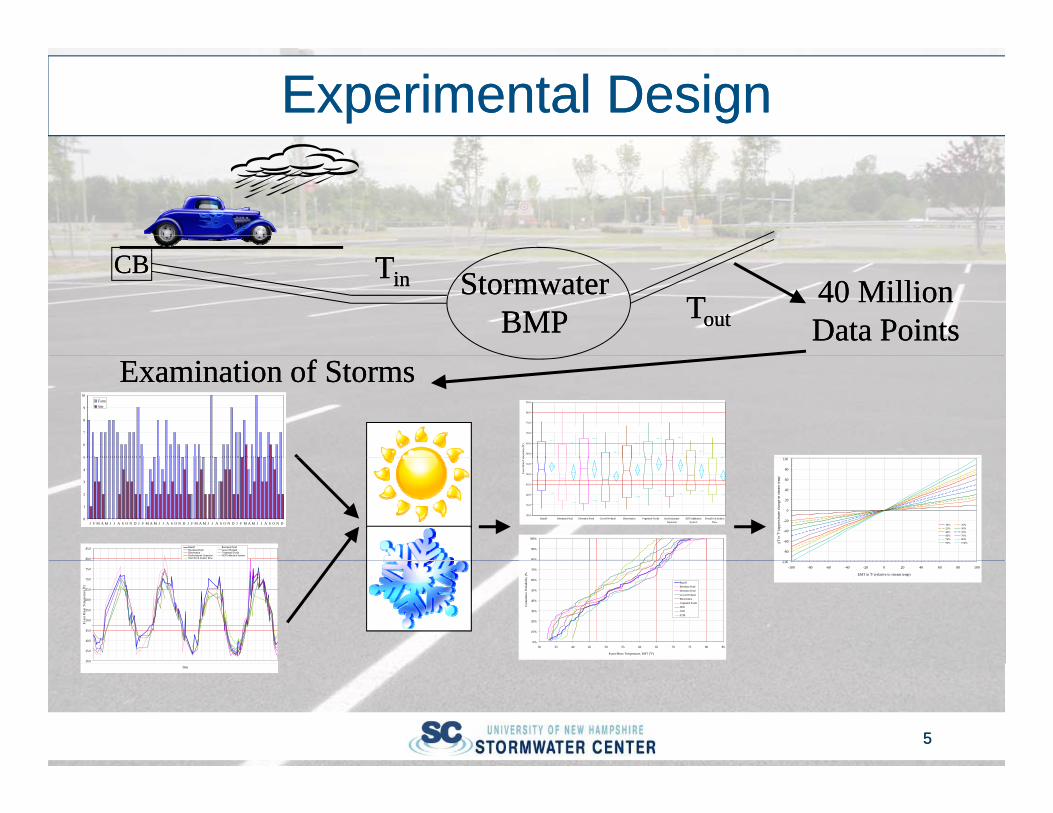
Experimental DesignExperimental Design
40 Million 40 Million Data PointsData Points
TTininTToutout
StormwaterStormwaterBMPBMP
CBCB
5
6
7
8
9
10FarmSite
60.0
65.0
70.0
75.0
80.0
85.0
mpe
ratu
re (o F)
Examination of StormsExamination of Storms
100
0
1
2
3
4
5
J F M A M J J A S O N D J F M A M J J A S O N D J F M A M J J A S O N D J F M A M J J A S O N D
`
80.0
85.0 Runoff Retention PondDetention Pond Gravel WetlandBioretention Vegetated SwaleHydrodynamic Separator ADS Infiltration SystemStormTech Isolator Row
30.0
35.0
40.0
45.0
50.0
55.0
Runoff Retention Pond Detention Pond Gravel Wetland Bioretention Vegetated Swale HydrodynamicSeparator
ADS InfiltrationSystem
StormTech IsolatorRow
Even
Mea
n Te
80%
90%
100%
100
-80
-60
-40
-20
0
20
40
60
80
100
ΔT in
o F (a
ppro
xim
ate
chan
ge in
stre
am te
mp)
10% 20%25% 30%40% 50%60% 70%75% 80%90% 100%
30.0
35.0
40.0
45.0
50.0
55.0
60.0
65.0
70.0
75.0
Even
t Mea
n Te
mpe
ratu
re (o F)
0%
10%
20%
30%
40%
50%
60%
70%
30 35 40 45 50 55 60 65 70 75 80 85
Event Mean Temperature, EMT (oF)
Cum
ulat
ive
Prob
abili
ty (%
RunoffRetention PondDetention PondGravel WetlandBioretentionVegetated SwaleHDSADSSTIR
-100-100 -80 -60 -40 -20 0 20 40 60 80 100
EMT in oF (relative to stream temp)
55
Date
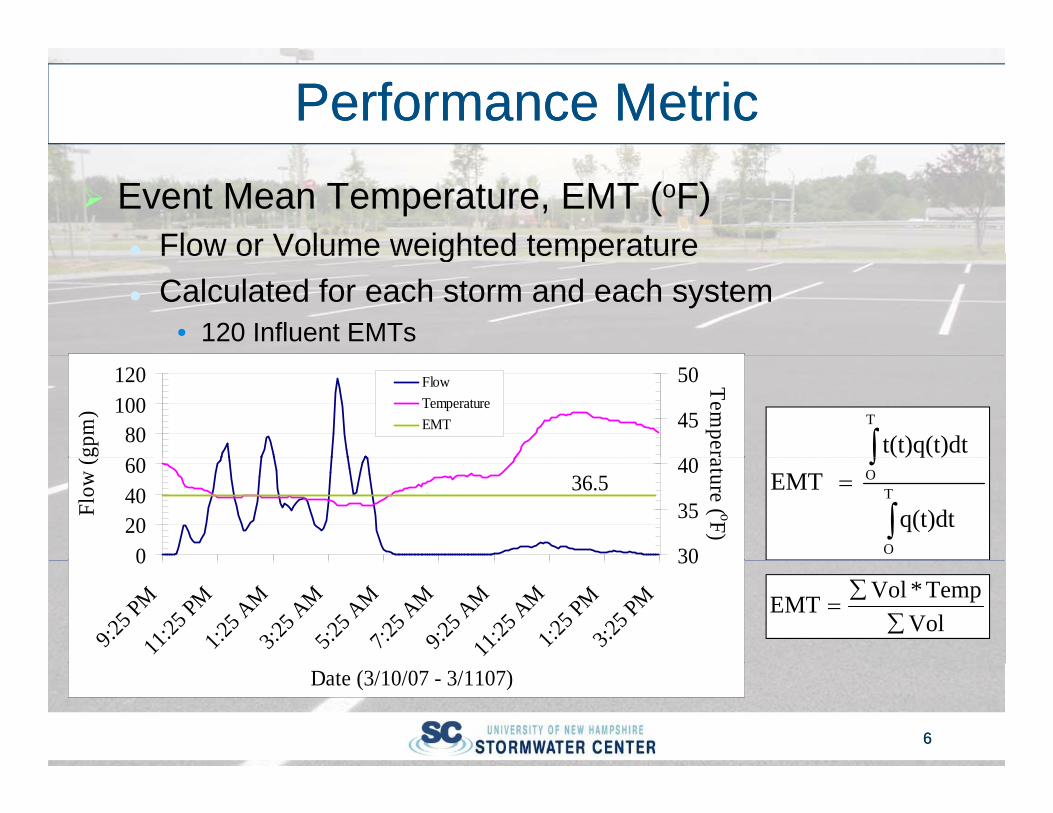
Performance MetricPerformance MetricEvent Mean Temperature, EMT (oF)
Flow or Volume weighted temperatureFlow or Volume weighted temperatureCalculated for each storm and each system
• 120 Influent EMTs
6080
100120
gpm
)
40
45
50 Temper
FlowTemperatureEMT
∫T
t(t)q(t)dt36.5
0204060
Flow
(
30
35
40
ature ( oF) ∫
∫= T
O
O
q(t)dtEMT
0
9:25 P
M11
:25 PM
1:25 A
M3:2
5 AM
5:25 A
M7:2
5 AM
9:25 A
M11
:25 A
M1:2
5 PM
3:25 P
M
30
VolTemp*VolEMT
∑∑
=
66
Date (3/10/07 - 3/1107)
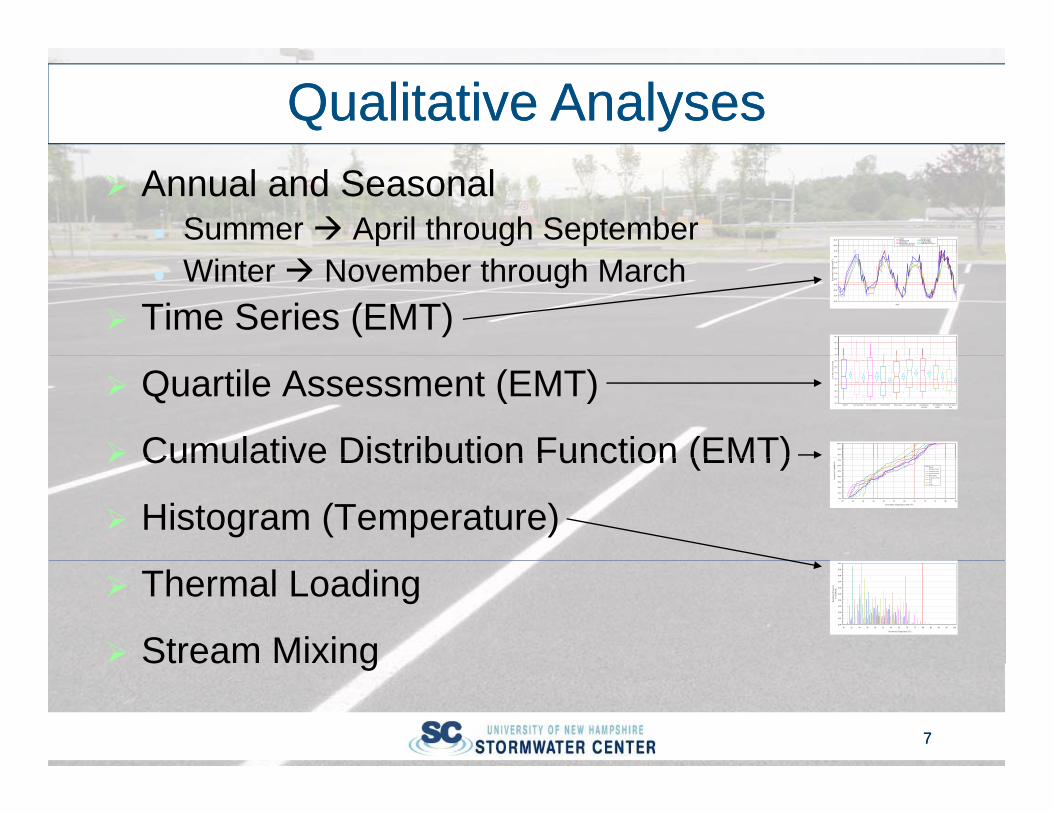
Qualitative AnalysesQualitative AnalysesAnnual and Seasonal
Summer April through September75.0
80.0
85.0 Runoff Retention PondDetention Pond Gravel WetlandBioretention Vegetated SwaleHydrodynamic Separator ADS Infiltration SystemStormTech Isolator Row
Winter November through MarchTime Series (EMT)
30.0
35.0
40.0
45.0
50.0
55.0
60.0
65.0
70.0
Date
Even
t Mea
n Te
mpe
ratu
re (o F)
70.0
75.0
80.0
85.0
Quartile Assessment (EMT)
Cumulative Distribution Function (EMT)30.0
35.0
40.0
45.0
50.0
55.0
60.0
65.0
Runoff Retention Pond Detention Pond Gravel Wetland Bioretention Vegetated Swale HydrodynamicSeparator
ADS InfiltrationSystem
StormTech IsolatorRow
Even
Mea
n Te
mpe
ratu
re (o F)
80%
90%
100%Cumulative Distribution Function (EMT)
Histogram (Temperature)0%
10%
20%
30%
40%
50%
60%
70%
30 35 40 45 50 55 60 65 70 75 80 85
Event Mean Temperature, EMT (oF)
Cum
ulat
ive
Prob
abili
ty (%
RunoffRetention PondDetention PondGravel WetlandBioretentionVegetated SwaleHDSADSSTIR
Thermal Loading
Stream Mixing0.00
0.01
0.02
0.03
0.04
0.05
0.06
0.07
0.08
0.09
0.10
30 35 40 45 50 55 60 65 70 75 80 85 90 95 100
Stormwater Temperature (oF)
Nor
mal
ized
Fre
quen
cy(C
ount
/Tot
al)
77
St ea g
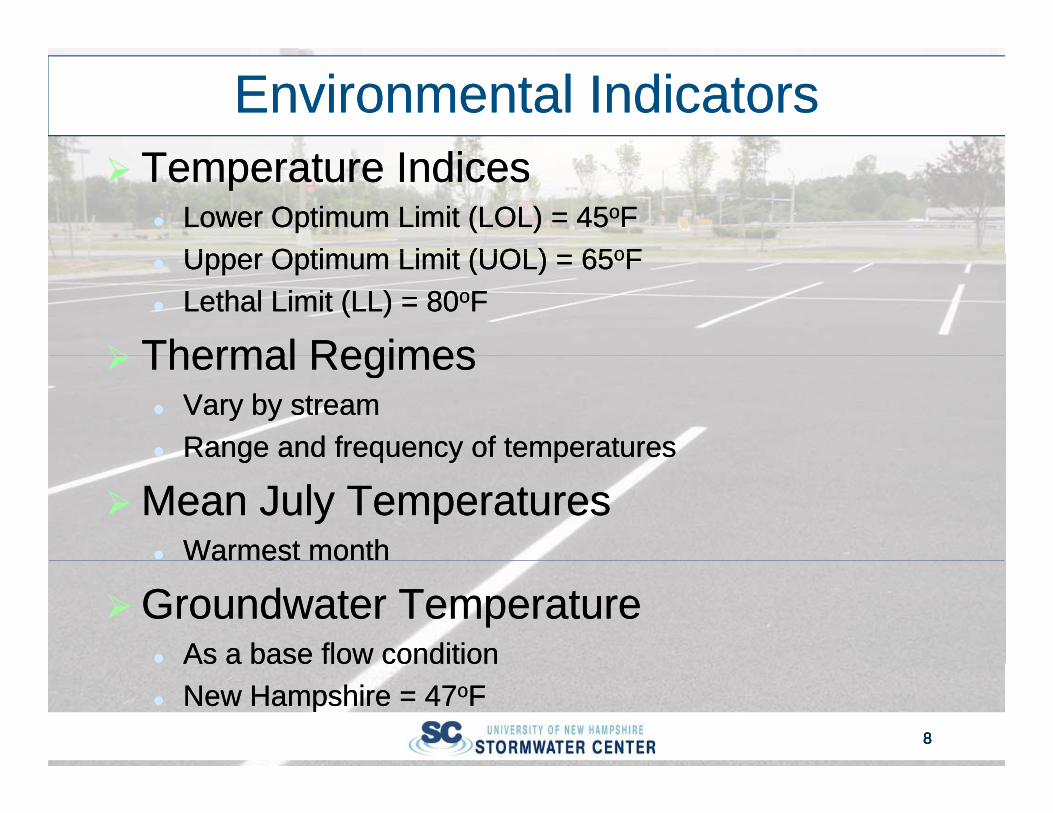
Environmental IndicatorsEnvironmental IndicatorsTemperature IndicesTemperature Indices
Lower Optimum Limit (LOL) = 45Lower Optimum Limit (LOL) = 45ooFFU O ti Li it (UOL) 65U O ti Li it (UOL) 65ooFFUpper Optimum Limit (UOL) = 65Upper Optimum Limit (UOL) = 65ooFFLethal Limit (LL) = 80Lethal Limit (LL) = 80ooFF
Thermal RegimesThermal RegimesThermal RegimesThermal RegimesVary by streamVary by streamRange and frequency of temperaturesRange and frequency of temperaturesg q y pg q y p
Mean July TemperaturesMean July TemperaturesWarmest monthWarmest montha es oa es o
Groundwater TemperatureGroundwater TemperatureAs a base flow conditionAs a base flow condition
88
As a base flow conditionAs a base flow conditionNew Hampshire = 47New Hampshire = 47ooFF
88
85 085 0 R ff R t ti P d85 0 Runoff Retention Pond85 0 Runoff Retention Pond
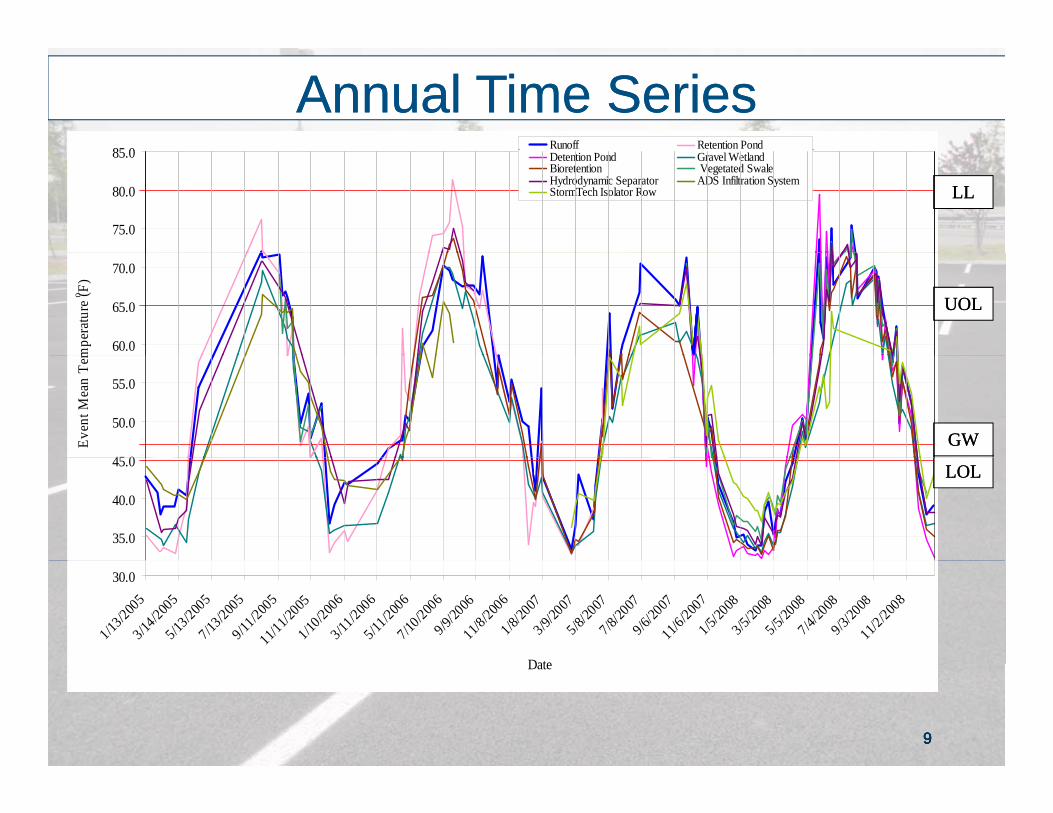
Annual Time SeriesAnnual Time Series
75.0
80.0
85.0Runoff
75.0
80.0
85.0 Runoff Retention Pond
Detention Pond Vegetated Swale
75.0
80.0
85.0 Runoff Retention Pond
Detention Pond Gravel Wetland
Bioretention Vegetated Swale
75.0
80.0
85.0 Detention Pond Gravel WetlandBioretention Vegetated SwaleHydrodynamic Separator ADS Infiltration SystemStormTech Isolator Row LLLL
60.0
65.0
70.0
mpe
ratu
re (o F)
60.0
65.0
70.0
mpe
ratu
re (o F)
60.0
65.0
70.0
mpe
ratu
re (o F)
60.0
65.0
70.0
mpe
ratu
re (o F)
UOLUOL
45 0
50.0
55.0
Even
t Mea
n Te
m
45 0
50.0
55.0
Even
t Mea
n Te
m
45 0
50.0
55.0
Even
t Mea
n Te
m
45 0
50.0
55.0
Even
t Mea
n Te
m
GWGW
35.0
40.0
45.0
35.0
40.0
45.0
35.0
40.0
45.0
35.0
40.0
45.0 LOLLOL
30.0
1/13/200
53/14
/2005
5/13/200
57/13
/2005
9/11/200
511/1
1/2005
1/10/200
63/11
/2006
5/11/200
67/10
/2006
9/9/20
0611/8
/2006
1/8/20
073/9/
2007
5/8/20
077/8/
2007
9/6/20
0711/6
/2007
1/5/20
083/5/
2008
5/5/20
087/4/
2008
9/3/20
0811/2
/2008
D t
30.0
1/13/200
53/14
/2005
5/13/200
57/13
/2005
9/11/200
511/1
1/2005
1/10/200
63/11
/2006
5/11/200
67/10
/2006
9/9/20
0611/8
/2006
1/8/20
073/9/
2007
5/8/20
077/8/
2007
9/6/20
0711/6
/2007
1/5/20
083/5/
2008
5/5/20
087/4/
2008
9/3/20
0811/2
/2008
D t
30.0
1/13/200
53/14
/2005
5/13/200
57/13
/2005
9/11/200
511/1
1/2005
1/10/200
63/11
/2006
5/11/200
67/10
/2006
9/9/20
0611/8
/2006
1/8/20
073/9/
2007
5/8/20
077/8/
2007
9/6/20
0711/6
/2007
1/5/20
083/5/
2008
5/5/20
087/4/
2008
9/3/20
0811/2
/2008
D t
30.0
1/13/200
53/14
/2005
5/13/200
57/13
/2005
9/11/200
511/1
1/2005
1/10/200
63/11
/2006
5/11/200
67/10
/2006
9/9/20
0611/8
/2006
1/8/20
073/9/
2007
5/8/20
077/8/
2007
9/6/20
0711/6
/2007
1/5/20
083/5/
2008
5/5/20
087/4/
2008
9/3/20
0811/2
/2008
Date
99
DateDateDateDate
99
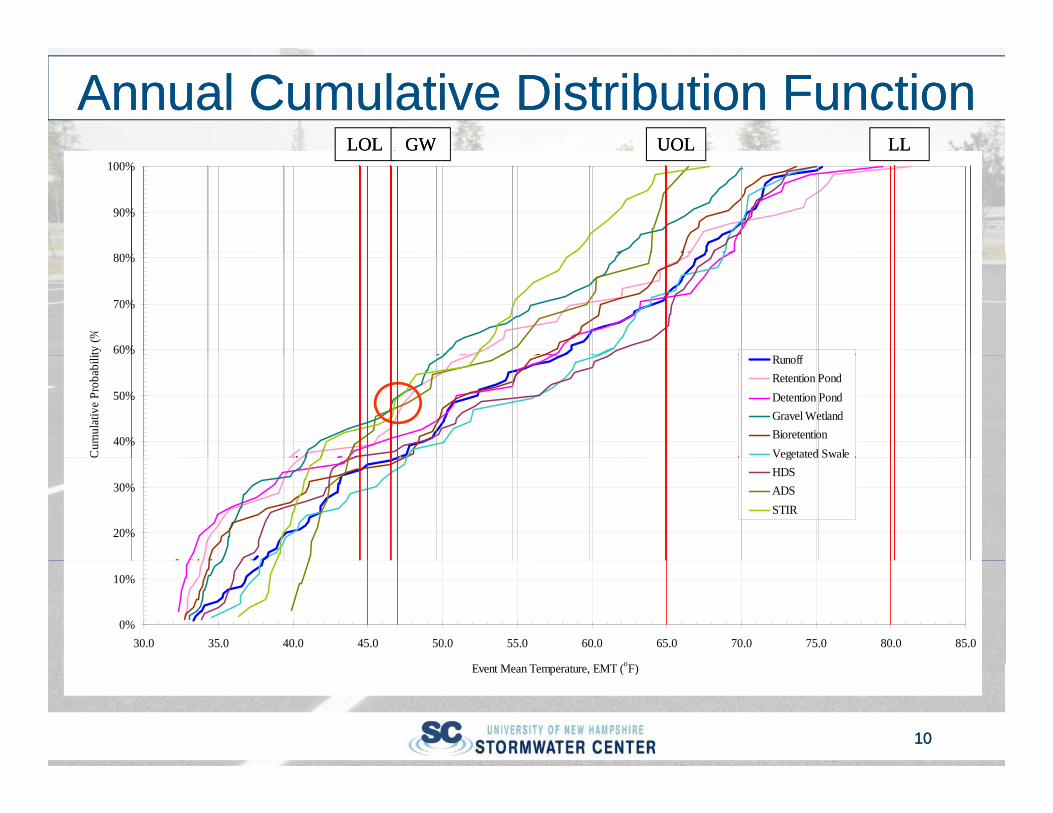
Annual Cumulative Distribution FunctionAnnual Cumulative Distribution FunctionLLLLUOLUOLLOLLOL GWGW
0.9
1
0 8
0.9
1
0.9
1
90%
100%LLLLUOLUOLLOLLOL GWGW
0.6
0.7
0.8
ity (% 0.6
0.7
0.8
lity
(%
0.6
0.7
0.8
ity (% 60%
70%
80%
ity (%
R ff
0.4
0.5
Cum
ulat
ive
Prob
abili
Runoff0.4
0.5
Cum
ulat
ive
Prob
abil Runoff
Retention Pond
Detention Pond0.4
0.5
Cum
ulat
ive
Prob
abili Runoff
Retention Pond
Detention Pond
Gravel Wetland40%
50%
Cum
ulat
ive
Prob
abili Runoff
Retention PondDetention PondGravel WetlandBioretentionVegetated Swale
0.2
0.3
C
0.2
0.3
C Detention Pond
Vegetated Swale
0.2
0.3
C
Bioretention
Vegetated Swale
20%
30%
gHDSADSSTIR
0
0.1
30 35 40 45 50 55 60 65 70 75 80 85o
0
0.1
30 35 40 45 50 55 60 65 70 75 80 85
E M T EMT (oF)
0
0.1
30 35 40 45 50 55 60 65 70 75 80 85o
0%
10%
30.0 35.0 40.0 45.0 50.0 55.0 60.0 65.0 70.0 75.0 80.0 85.0o
1010
Event Mean Temperature, EMT (oF)Event Mean Temperature, EMT (oF)Event Mean Temperature, EMT (oF)Event Mean Temperature, EMT (oF)
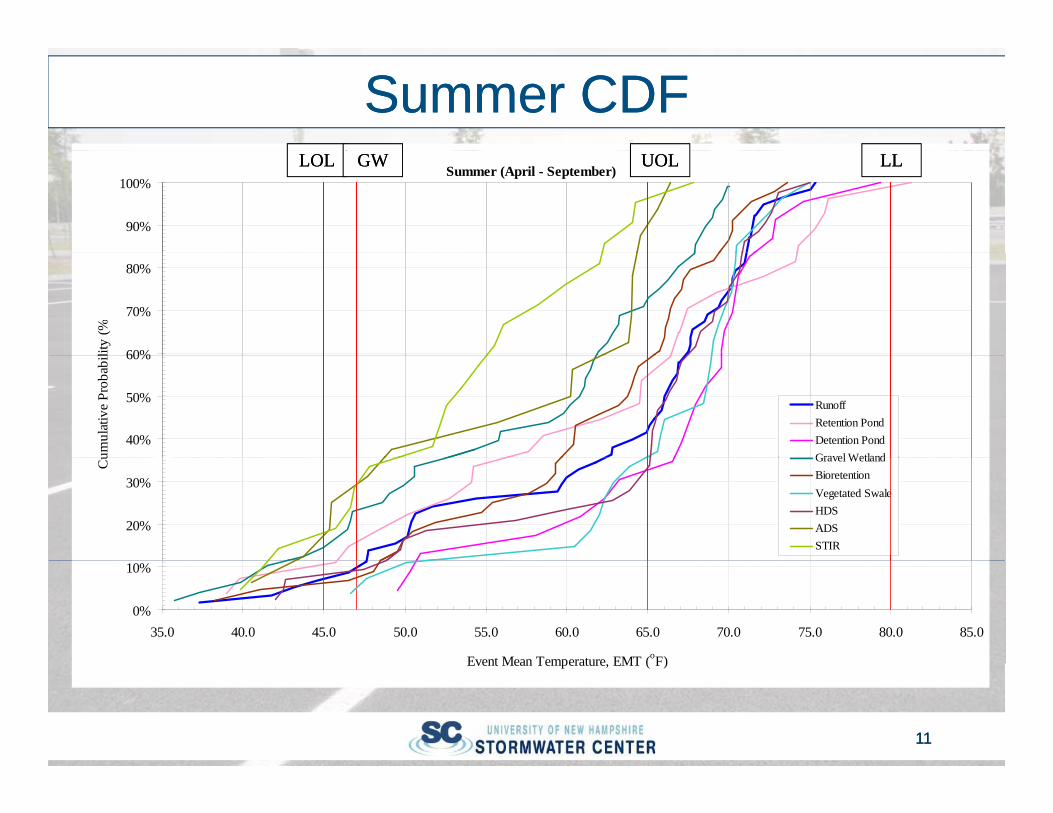
Summer CDFSummer CDFSummer (April - September)
90%
100%LLLLUOLUOLLOLLOL GWGW
60%
70%
80%
lity
(%
40%
50%
60%
umul
ativ
e Pr
obab
il
RunoffRetention PondDetention PondGravel Wetland
20%
30%
Cu Gravel Wetland
BioretentionVegetated SwaleHDSADSSTIR
0%
10%
35.0 40.0 45.0 50.0 55.0 60.0 65.0 70.0 75.0 80.0 85.0
Event Mean Temperature EMT (oF)
1111
Event Mean Temperature, EMT ( F)

Summer Quartile AssessmentSummer Quartile Assessment
LLLL
75.0
80.0
85.0
UOLUOL65.0
70.0
75.0
(o F)
55.0
60.0
nt M
ean
Tem
pera
ture
(o
LOLLOL
GWGW45.0
50.0Even
30 0
35.0
40.0
12121212
30.0Runoff Retention Pond Detention Pond Gravel Wetland Bioretention Vegetated Swale Hydrodynamic
SeparatorADS Infiltration
SystemStormTech Isolator
Row
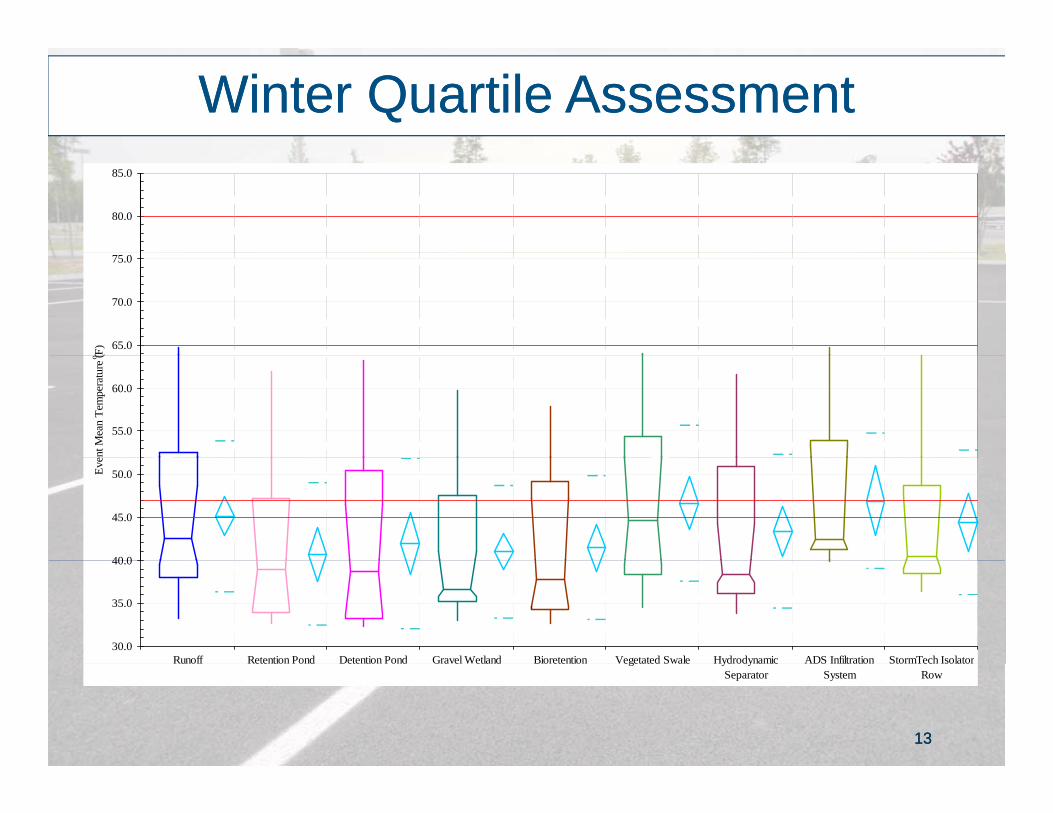
Winter Quartile AssessmentWinter Quartile Assessment
80.0
85.0
65.0
70.0
75.0
(F)
55.0
60.0
ent M
ean
Tem
pera
ture
(o
40 0
45.0
50.0Eve
30.0
35.0
40.0
Runoff Retention Pond Detention Pond Gravel Wetland Bioretention Vegetated Swale Hydrodynamic ADS Infiltration StormTech Isolator
1313
Runoff Retention Pond Detention Pond Gravel Wetland Bioretention Vegetated Swale HydrodynamicSeparator
ADS InfiltrationSystem
StormTech IsolatorRow
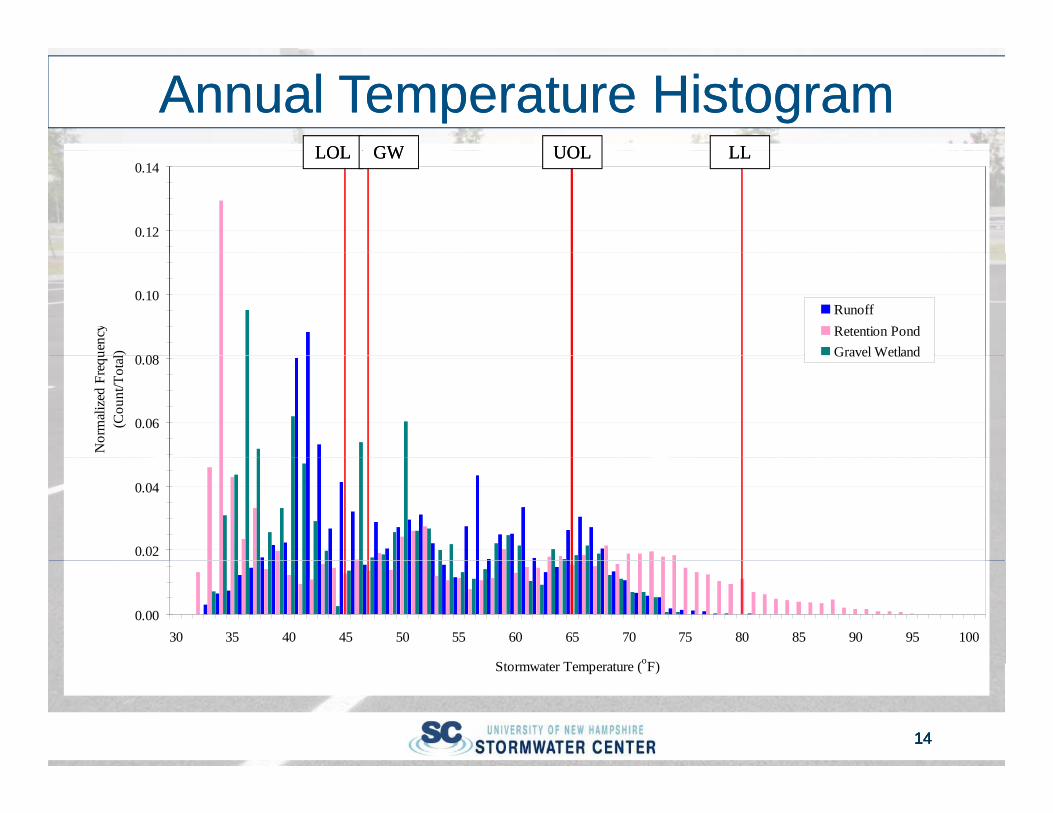
Annual Temperature HistogramAnnual Temperature HistogramLLLLUOLUOLLOLLOL GWGW
0.12
0.14LLLLUOLUOLLOLLOL GWGW
0 08
0.10
uenc
yl)
RunoffRetention PondGravel Wetland
0.06
0.08
Nor
mal
ized
Fre
qu(C
ount
/Tot
al Gravel Wetland
0.02
0.04
0.0030 35 40 45 50 55 60 65 70 75 80 85 90 95 100
St t T t (oF)
14141414
Stormwater Temperature (oF)
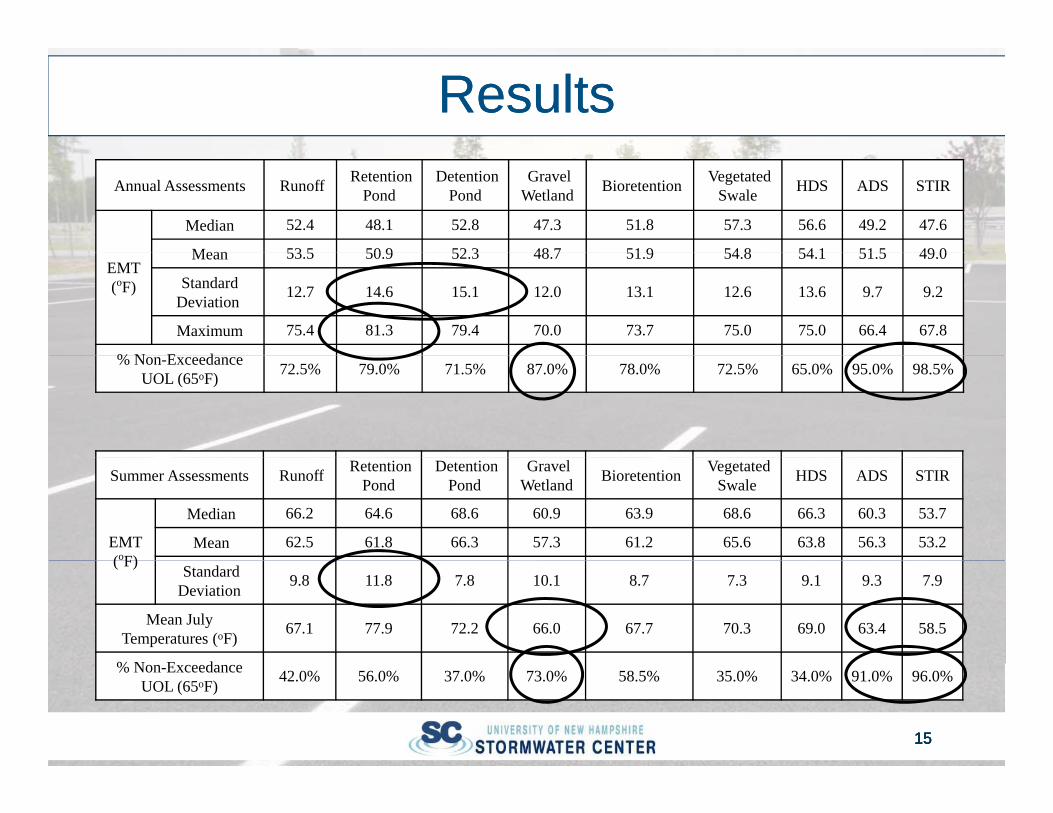
ResultsResultsAnnual Assessments Runoff Retention
Pond Detention
Pond Gravel
Wetland Bioretention VegetatedSwale HDS ADS STIR
Median 52.4 48.1 52.8 47.3 51.8 57.3 56.6 49.2 47.6
Mean 53 5 50 9 52 3 48 7 51 9 54 8 54 1 51 5 49 0EMT(oF)
Mean 53.5 50.9 52.3 48.7 51.9 54.8 54.1 51.5 49.0
StandardDeviation 12.7 14.6 15.1 12.0 13.1 12.6 13.6 9.7 9.2
Maximum 75.4 81.3 79.4 70.0 73.7 75.0 75.0 66.4 67.8
% N E d% Non-ExceedanceUOL (65oF) 72.5% 79.0% 71.5% 87.0% 78.0% 72.5% 65.0% 95.0% 98.5%
Summer Assessments Runoff RetentionPond
DetentionPond
GravelWetland Bioretention Vegetated
Swale HDS ADS STIR
EMT(oF)
Median 66.2 64.6 68.6 60.9 63.9 68.6 66.3 60.3 53.7
Mean 62.5 61.8 66.3 57.3 61.2 65.6 63.8 56.3 53.2( F) Standard
Deviation 9.8 11.8 7.8 10.1 8.7 7.3 9.1 9.3 7.9
Mean JulyTemperatures (oF) 67.1 77.9 72.2 66.0 67.7 70.3 69.0 63.4 58.5
% N E d
15151515
% Non-ExceedanceUOL (65oF) 42.0% 56.0% 37.0% 73.0% 58.5% 35.0% 34.0% 91.0% 96.0%
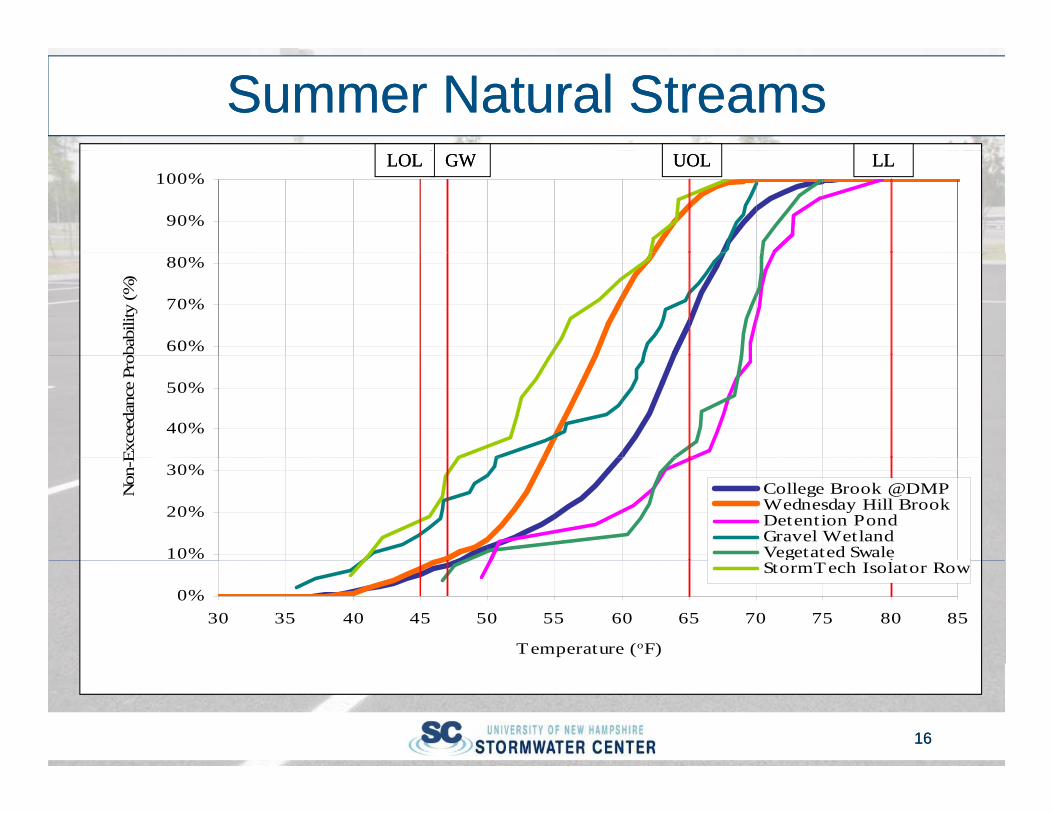
Summer Natural StreamsSummer Natural Streams
90%
100%LLLLUOLUOLGWGWLOLLOL
60%
70%
80%
obab
ility
(%)
40%
50%
Exce
edan
ce P
rob
10%
20%
30%
Non
-E
College Brook @DMPWednesday Hill BrookDetention PondGravel WetlandVegetated Swale
0%30 35 40 45 50 55 60 65 70 75 80 85
Temperature (oF)
StormTech Isolator Row
1616
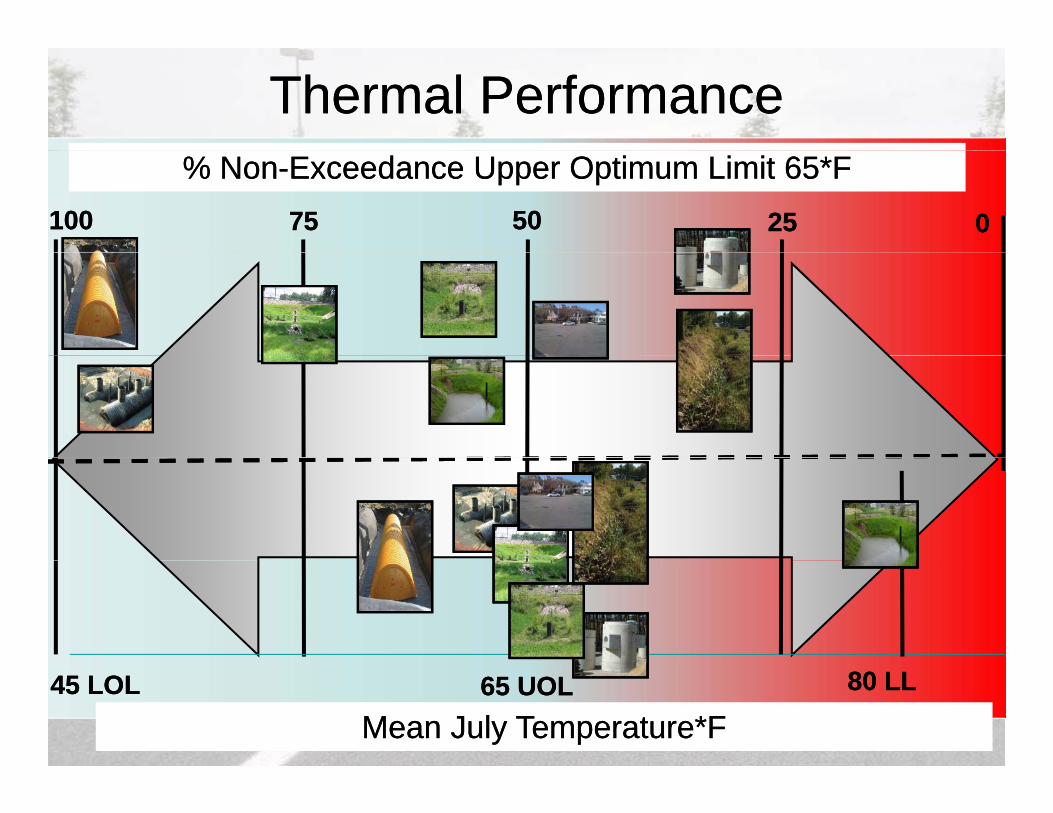
Thermal PerformanceThermal Performance% Non% Non--Exceedance Upper Optimum Limit 65*FExceedance Upper Optimum Limit 65*F
100100 0050507575 2525
1717Mean July Temperature*FMean July Temperature*F45 LOL45 LOL 80 LL80 LL665 UOL5 UOL
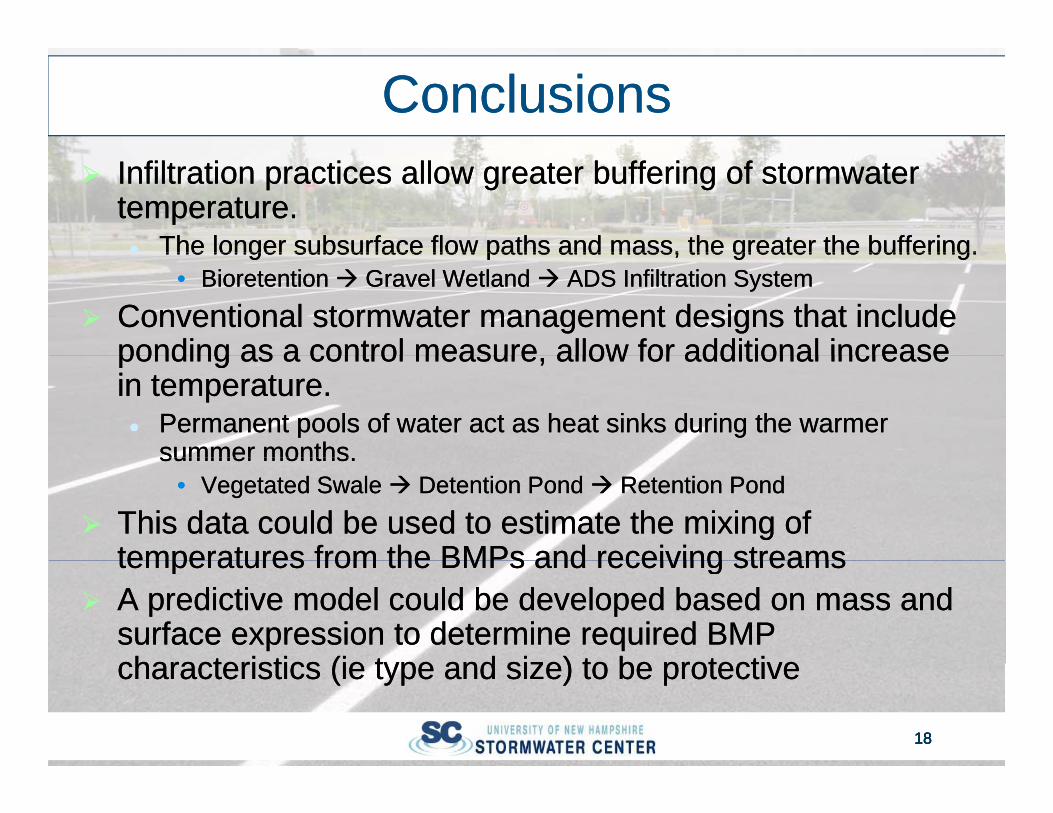
ConclusionsConclusionsInfiltration practices allow greater buffering of stormwater Infiltration practices allow greater buffering of stormwater temperature.temperature.
The longer subsurface flow paths and mass, the greater the buffering.The longer subsurface flow paths and mass, the greater the buffering.The longer subsurface flow paths and mass, the greater the buffering.The longer subsurface flow paths and mass, the greater the buffering.•• Bioretention Bioretention Gravel Wetland Gravel Wetland ADS Infiltration SystemADS Infiltration System
Conventional stormwater management designs that include Conventional stormwater management designs that include pondingponding as a control measure allow for additional increaseas a control measure allow for additional increasepondingponding as a control measure, allow for additional increase as a control measure, allow for additional increase in temperature.in temperature.
Permanent pools of water act as heat sinks during the warmer Permanent pools of water act as heat sinks during the warmer summer monthssummer monthssummer months.summer months.
•• Vegetated Swale Vegetated Swale Detention Pond Detention Pond Retention PondRetention Pond
This data could be used to estimate the mixing of This data could be used to estimate the mixing of temperatures from the BMPs and receiving streamstemperatures from the BMPs and receiving streamstemperatures from the BMPs and receiving streamstemperatures from the BMPs and receiving streamsA predictive model could be developed based on mass and A predictive model could be developed based on mass and surface expression to determine required BMP surface expression to determine required BMP characteristics (characteristics (ieie type and size) to be protectivetype and size) to be protective
18181818
characteristics (characteristics (ieie type and size) to be protectivetype and size) to be protective
QuestionsQuestions
19191919
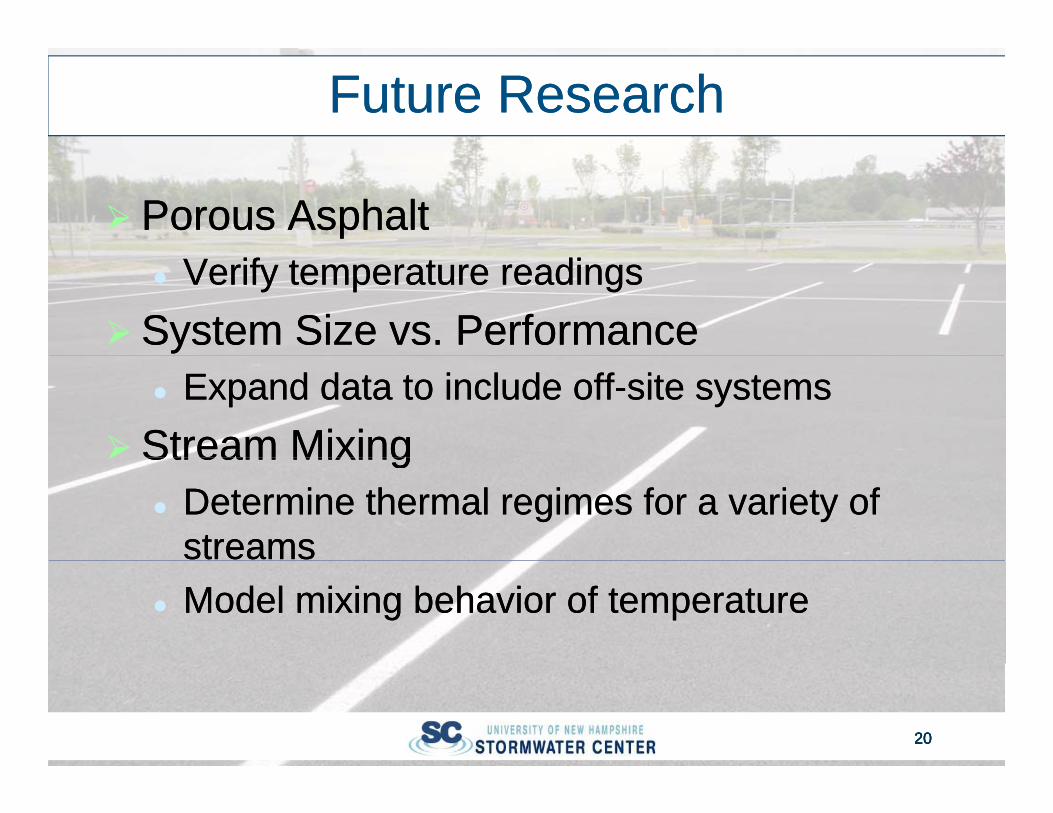
Future ResearchFuture Research
Porous AsphaltPorous AsphaltVerify temperature readingsVerify temperature readings
System Size vs. PerformanceSystem Size vs. PerformanceExpand data to include offExpand data to include off--site systemssite systems
Stream MixingStream MixingStream MixingStream MixingDetermine thermal regimes for a variety of Determine thermal regimes for a variety of streamsstreamsModel mixing behavior of temperatureModel mixing behavior of temperature
20202020