Embed Size (px)
Citation preview

This article was downloaded by: [Michigan State University]On: 11 March 2015, At: 09:27Publisher: Taylor & FrancisInforma Ltd Registered in England and Wales Registered Number: 1072954 Registeredoffice: Mortimer House, 37-41 Mortimer Street, London W1T 3JH, UK
Click for updates
Philosophical MagazinePublication details, including instructions for authors andsubscription information:http://www.tandfonline.com/loi/tphm20
Examination of the distribution of thetensile deformation systems in tensionand tension-creep of Ti-6Al-4V (wt.%)at 296 K and 728 KH. Lia, C.J. Boehlerta, T.R. Bielera & M.A. Crimpa
a Department of Chemical Engineering and Materials Science,Michigan State University, East Lansing, MI 48824, USAPublished online: 09 Feb 2015.
To cite this article: H. Li, C.J. Boehlert, T.R. Bieler & M.A. Crimp (2015) Examination of thedistribution of the tensile deformation systems in tension and tension-creep of Ti-6Al-4V (wt.%) at296 K and 728 K, Philosophical Magazine, 95:7, 691-729, DOI: 10.1080/14786435.2014.1001459
To link to this article: http://dx.doi.org/10.1080/14786435.2014.1001459
PLEASE SCROLL DOWN FOR ARTICLE
Taylor & Francis makes every effort to ensure the accuracy of all the information (the“Content”) contained in the publications on our platform. However, Taylor & Francis,our agents, and our licensors make no representations or warranties whatsoever as tothe accuracy, completeness, or suitability for any purpose of the Content. Any opinionsand views expressed in this publication are the opinions and views of the authors,and are not the views of or endorsed by Taylor & Francis. The accuracy of the Contentshould not be relied upon and should be independently verified with primary sourcesof information. Taylor and Francis shall not be liable for any losses, actions, claims,proceedings, demands, costs, expenses, damages, and other liabilities whatsoever orhowsoever caused arising directly or indirectly in connection with, in relation to or arisingout of the use of the Content.
This article may be used for research, teaching, and private study purposes. Anysubstantial or systematic reproduction, redistribution, reselling, loan, sub-licensing,systematic supply, or distribution in any form to anyone is expressly forbidden. Terms &

Conditions of access and use can be found at http://www.tandfonline.com/page/terms-and-conditions
Dow
nloa
ded
by [
Mic
higa
n St
ate
Uni
vers
ity]
at 0
9:27
11
Mar
ch 2
015

Examination of the distribution of the tensile deformation systems intension and tension-creep of Ti-6Al-4V (wt.%) at 296 K and 728 K
H. Li, C.J. Boehlert*, T.R. Bieler and M.A. Crimp
Department of Chemical Engineering and Materials Science, Michigan State University, EastLansing, MI 48824, USA
(Received 15 September 2014; accepted 16 December 2014)
The deformation behaviour of an α + β Ti–6Al–4V (wt.%) alloy was investi-gated during in situ deformation inside a scanning electron microscopy(SEM). Tensile experiments were performed at 296 and 728 K (~0.4Tm),while a tensile-creep experiment was performed at 728 K and 310 MPa(σ/σys = 0.74). The active deformation systems were identified using electronbackscattered diffraction-based slip-trace analysis and SEM images of thespecimen surface. The distribution of the active deformation systems varied asa function of temperature. Basal slip deformation played a major role in thetensile deformation behaviour, and the relative activity of basal slip increasedwith increasing temperature. For the 296 K tension deformation, basal slipwas less active than prismatic slip, whereas this was reversed at 728 K. Twin-ning was observed in both the 296 and 728 K tension experiments; however,no more than 4% of the total deformation systems observed was twins. Thetension-creep experiment revealed no slip traces, however grain boundaryledge formation was observed, suggesting that grain boundary sliding was anactive deformation mechanism. The results of this work were compared withthose from previous studies on commercially pure Ti, Ti–5Al–2.5Sn (wt.%)and Ti–8Al–1Mo–1V (wt.%), and the effects of alloying on the deformationbehaviour are discussed. The relative amount of basal slip activity increasedwith increasing Al content.
Keywords: titanium alloys; creep; tensile; microstructural characterization;metallurgy
Introduction
Compared with other structural metallic metals based on iron (Fe), nickel (Ni), alumin-ium (Al), and magnesium (Mg), titanium (Ti) has advantages of higher specific strengthand exceptional corrosion resistance with a low density (ρ) of ~4.5 g/cm3. Although Mgexhibits a density of ~1.8 g/cm3, the disadvantages of low corrosion resistance, lowmelting point (650 °C, 923 K) and relatively low yield strength (YS) make it less suit-able than Ti for many structural applications. Al (ρ~2.7 g/cm3) also exhibits the draw-backs of a low melting temperature (660 °C, 933 K) and a low YS. Fe and Ni canovercome these disadvantages but the densities are nearly twice that of Ti. Thus, Ti andTi alloys are currently employed in a variety of applications, including armor and
*Email: [email protected]
© 2015 Taylor & Francis
Philosophical Magazine, 2015Vol. 95, No. 7, 691–729, http://dx.doi.org/10.1080/14786435.2014.1001459
Dow
nloa
ded
by [
Mic
higa
n St
ate
Uni
vers
ity]
at 0
9:27
11
Mar
ch 2
015

portable electronic devices (due primarily to their high specific strength), biomedicaldevices (due primarily to their corrosion and fatigue resistance and their high specificstrength) and automobiles and aerospace components (due primarily to their high spe-cific strength and the ability to withstand high temperatures) [1]. Two-thirds of all theTi produced is used in the aerospace industry [1].
Tailoring of Ti alloys is done to achieve a desirable combination of strength, tough-ness, elongation to failure (εf ), and fatigue and creep resistance, and various Ti alloyshave been developed. Based on the composition and the resultant room temperature(RT) equilibrium constituent phase(s), Ti alloys are divided into four types, namelyfully-α Ti, near-α Ti alloys, α + β two-phase Ti alloys, and β Ti alloys [2,3]. Each ofthese alloy types is used for manufacturing certain aerospace components, depending onthe performance requirements. Two-phase α + β Ti alloys exhibit a good balance ofmechanical properties, such as high strength and stability at moderate temperature (upto 673 K), and good corrosion and fatigue resistance. The two-phase α + β alloy,Ti–6Al–4V, is the most used commercial Ti alloy, and it can be used in applications,such as blades, discs and wheels of turbine engines as well as cargo-handling andtorque tubes for rakes in airframe applications [4].
Because Ti and Ti alloys are often used in safety-critical applications, it is impera-tive to understand their deformation mechanisms. Furthermore, a thorough understand-ing of the deformation mechanisms is also required for the development of new Tialloys with higher strengths and better damage tolerance. The deformation mechanismsof the hexagonal close packed α-phase in commercially pure (CP) Ti and Ti alloyshave been studied over the past few decades [5–8]. Generally, there are three slipdirections with a Burgers vector (a-type), which have been observed to slip on basal{0 0 0 1}, prismatic f1 0 �1 0g and pyramidal f1 0 �1 1g planes. According to the vonMises criterion [9], five independent slip systems are required to accommodate anyarbitrary shape change during plastic deformation. Thus, in addition to the three a-typeslip directions on three families of planes, additional non-a-type deformation mecha-nisms must be activated during polycrystalline deformation. Pyramidal <c + a> slip, aswell as four twinning systems (i.e. f1 0 �1 2g\�1 0 1 1 > T1 tensile twinning,f1 1 �2 1g \�1 �1 2 6 > T2 tensile twinning, f1 1 �2 2g\1 1 �2 �3 > C1 compressive twin-ning and f1 0 �1 1g\1 0�1 2 > C2 compressive twinning) [10] allow α-Ti to meet thisrequirement. Of these, pyramidal <c + a> and f1 0 �1 2g\�1 0 1 1 > T1 tensile twin-ning are the most commonly reported for ambient temperature deformation of CP Ti.
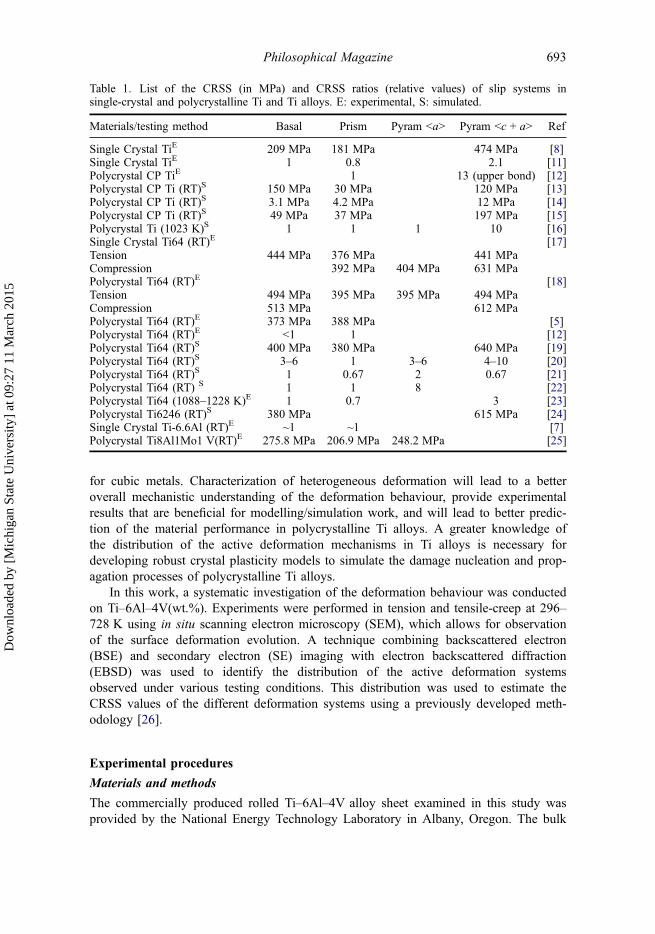
The ease of slip or twinning on a particular system is quantified by the criticalresolved shear stress (CRSS). Researchers have investigated the CRSS or the CRSSratios of Ti and Ti alloys under various conditions, both experimentally and computa-tionally. However, there is no consensus on the CRSS values or ratios, as they change asa function of alloy content and testing condition. Table 1 shows a number of reportedvalues for the CRSS and/or CRSS ratios for the different slip systems at RT and elevatedtemperatures for Ti and Ti alloys [5,7,8,11–25]. There are significant CRSS variationseven for the same nominal alloys under the same deformation temperature and testingcondition [8,13–15]. Much of the uncertainty in the CRSS and CRSS ratios can beattributed to the difficulty in directly measuring these parameters in non-cubic metals, aswell as microstructural features that affect nucleation and propagation of slip.
Overall, the intrinsic deformation mechanisms of Ti alloys activated in service con-ditions for targeted structural components have not been as well documented as those
692 H. Li et al.
Dow
nloa
ded
by [
Mic
higa
n St
ate
Uni
vers
ity]
at 0
9:27
11
Mar
ch 2
015
for cubic metals. Characterization of heterogeneous deformation will lead to a betteroverall mechanistic understanding of the deformation behaviour, provide experimentalresults that are beneficial for modelling/simulation work, and will lead to better predic-tion of the material performance in polycrystalline Ti alloys. A greater knowledge ofthe distribution of the active deformation mechanisms in Ti alloys is necessary fordeveloping robust crystal plasticity models to simulate the damage nucleation and prop-agation processes of polycrystalline Ti alloys.
In this work, a systematic investigation of the deformation behaviour was conductedon Ti–6Al–4V(wt.%). Experiments were performed in tension and tensile-creep at 296–728 K using in situ scanning electron microscopy (SEM), which allows for observationof the surface deformation evolution. A technique combining backscattered electron(BSE) and secondary electron (SE) imaging with electron backscattered diffraction(EBSD) was used to identify the distribution of the active deformation systemsobserved under various testing conditions. This distribution was used to estimate theCRSS values of the different deformation systems using a previously developed meth-odology [26].
Experimental procedures
Materials and methods
The commercially produced rolled Ti–6Al–4V alloy sheet examined in this study wasprovided by the National Energy Technology Laboratory in Albany, Oregon. The bulk
Table 1. List of the CRSS (in MPa) and CRSS ratios (relative values) of slip systems insingle-crystal and polycrystalline Ti and Ti alloys. E: experimental, S: simulated.
Materials/testing method Basal Prism Pyram <a> Pyram <c + a> Ref
Single Crystal TiE 209 MPa 181 MPa 474 MPa [8]Single Crystal TiE 1 0.8 2.1 [11]Polycrystal CP TiE 1 13 (upper bond) [12]Polycrystal CP Ti (RT)S 150 MPa 30 MPa 120 MPa [13]Polycrystal CP Ti (RT)S 3.1 MPa 4.2 MPa 12 MPa [14]Polycrystal CP Ti (RT)S 49 MPa 37 MPa 197 MPa [15]Polycrystal Ti (1023 K)S 1 1 1 10 [16]Single Crystal Ti64 (RT)E [17]Tension 444 MPa 376 MPa 441 MPaCompression 392 MPa 404 MPa 631 MPaPolycrystal Ti64 (RT)E [18]Tension 494 MPa 395 MPa 395 MPa 494 MPaCompression 513 MPa 612 MPaPolycrystal Ti64 (RT)E 373 MPa 388 MPa [5]Polycrystal Ti64 (RT)E <1 1 [12]Polycrystal Ti64 (RT)S 400 MPa 380 MPa 640 MPa [19]Polycrystal Ti64 (RT)S 3–6 1 3–6 4–10 [20]Polycrystal Ti64 (RT)S 1 0.67 2 0.67 [21]Polycrystal Ti64 (RT) S 1 1 8 [22]Polycrystal Ti64 (1088–1228 K)E 1 0.7 3 [23]Polycrystal Ti6246 (RT)S 380 MPa 615 MPa [24]Single Crystal Ti-6.6Al (RT)E ~1 ~1 [7]Polycrystal Ti8Al1Mo1 V(RT)E 275.8 MPa 206.9 MPa 248.2 MPa [25]
Philosophical Magazine 693
Dow
nloa
ded
by [
Mic
higa
n St
ate
Uni
vers
ity]
at 0
9:27
11
Mar
ch 2
015
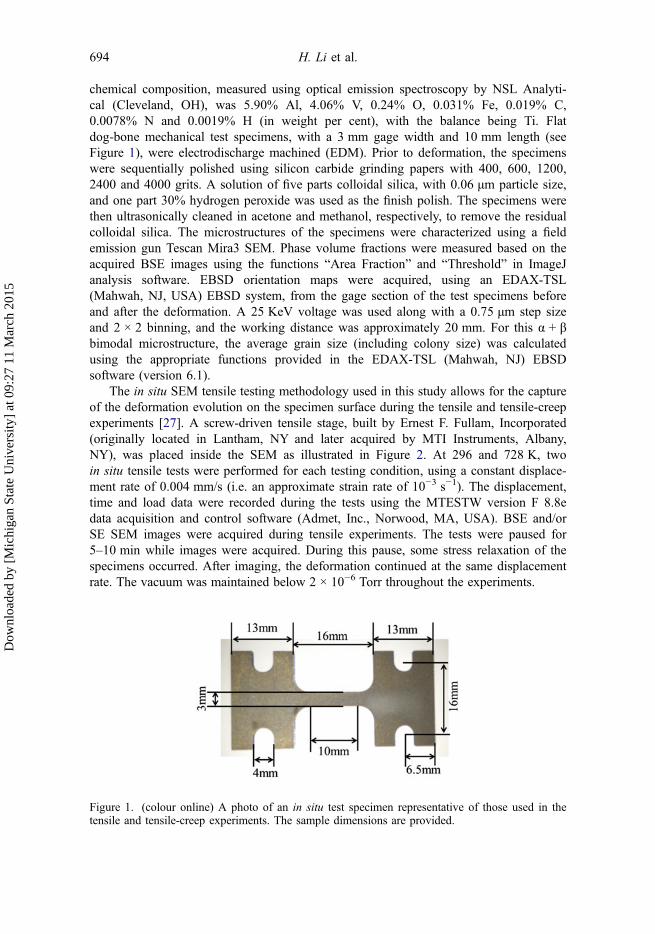
chemical composition, measured using optical emission spectroscopy by NSL Analyti-cal (Cleveland, OH), was 5.90% Al, 4.06% V, 0.24% O, 0.031% Fe, 0.019% C,0.0078% N and 0.0019% H (in weight per cent), with the balance being Ti. Flatdog-bone mechanical test specimens, with a 3 mm gage width and 10 mm length (seeFigure 1), were electrodischarge machined (EDM). Prior to deformation, the specimenswere sequentially polished using silicon carbide grinding papers with 400, 600, 1200,2400 and 4000 grits. A solution of five parts colloidal silica, with 0.06 μm particle size,and one part 30% hydrogen peroxide was used as the finish polish. The specimens werethen ultrasonically cleaned in acetone and methanol, respectively, to remove the residualcolloidal silica. The microstructures of the specimens were characterized using a fieldemission gun Tescan Mira3 SEM. Phase volume fractions were measured based on theacquired BSE images using the functions “Area Fraction” and “Threshold” in ImageJanalysis software. EBSD orientation maps were acquired, using an EDAX-TSL(Mahwah, NJ, USA) EBSD system, from the gage section of the test specimens beforeand after the deformation. A 25 KeV voltage was used along with a 0.75 μm step sizeand 2 × 2 binning, and the working distance was approximately 20 mm. For this α + βbimodal microstructure, the average grain size (including colony size) was calculatedusing the appropriate functions provided in the EDAX-TSL (Mahwah, NJ) EBSDsoftware (version 6.1).
The in situ SEM tensile testing methodology used in this study allows for the captureof the deformation evolution on the specimen surface during the tensile and tensile-creepexperiments [27]. A screw-driven tensile stage, built by Ernest F. Fullam, Incorporated(originally located in Lantham, NY and later acquired by MTI Instruments, Albany,NY), was placed inside the SEM as illustrated in Figure 2. At 296 and 728 K, twoin situ tensile tests were performed for each testing condition, using a constant displace-ment rate of 0.004 mm/s (i.e. an approximate strain rate of 10−3 s−1). The displacement,time and load data were recorded during the tests using the MTESTW version F 8.8edata acquisition and control software (Admet, Inc., Norwood, MA, USA). BSE and/orSE SEM images were acquired during tensile experiments. The tests were paused for5–10 min while images were acquired. During this pause, some stress relaxation of thespecimens occurred. After imaging, the deformation continued at the same displacementrate. The vacuum was maintained below 2 × 10⁻⁶ Torr throughout the experiments.
Figure 1. (colour online) A photo of an in situ test specimen representative of those used in thetensile and tensile-creep experiments. The sample dimensions are provided.
694 H. Li et al.
Dow
nloa
ded
by [
Mic
higa
n St
ate
Uni
vers
ity]
at 0
9:27
11
Mar
ch 2
015

The displacement data collected by the MTESTW software included the deforma-tion in the gage section as well as the grip section. Thus, the total strains calculatedbased on the specimen gage length did not accurately represent the actual strains of thein situ imaged areas. The displacement divided by the gage length tended to overesti-mate the strain achieved by the gage section alone. Strains in the observed gage sectionwere determined by measuring relative displacements of obvious features, such as triplepoints and polishing defects, on in situ collected SEM images acquired before, duringand after deformation. Therefore, the strains reported are local strains unless otherwisespecified. None of the samples were deformed to failure.
For the 728 K tensile experiments, a 6 mm diameter tungsten-based heating unit,powered by a constant voltage power supply, was used to heat the samples to thedesired temperature, which was maintained for a minimum of 30 min before loading.The temperature was monitored using a thermocouple spot-welded to the side of thegage section. For the in situ tensile-creep experiment, performed at 728 K and 310 MPa
Figure 2. (colour online) A photo showing the in situ testing setup in the Tescan Mira3 SEMchamber.
Philosophical Magazine 695
Dow
nloa
ded
by [
Mic
higa
n St
ate
Uni
vers
ity]
at 0
9:27
11
Mar
ch 2
015

(~0.74YS), the specimen was heated and monitored using the same configuration andconditions described in the previous section. The temperature was controlled within±10 K of the target temperature for the duration of the experiments. EBSD orientationmaps were acquired before starting the experiments and SE SEM images were acquiredwithin the EBSD mapped regions during the experiments without interruption of thetest. This sample was not taken to failure.
A slip/twin trace analysis was used to identify the active deformation systems. Thecrystallographic orientation of each individual grain with respect to the sample/lab coor-dinate system was given by the EBSD data in the form of three Euler angles (φ1, Φand φ2). The rotation matrix (g) between the crystal coordinate system and the sample/lab coordinate system was calculated by:
g ¼cosu2 sinu2 0� sinu2 cosu2 0
0 0 1
24
35
1 0 00 cos U sin U0 � sin U cos U
24
35
cosu1 sin u1 0�sin u1 cosu1 0
0 0 1
24
35 (1)
For a given slip/twin system, the slip plane and the slip direction can be expressedas (h k l) [u v w] in the crystal coordinate system using Miller indices. The transforma-tion of the slip plane and the slip direction from the crystal coordinate system to thesample/lab coordinate system can be achieved by:
n ¼ gT �hkl
24
35 (2)
b ¼ gT �uvw
24
35 (3)
where n and b are the corresponding slip plane normal and slip direction of a given slipsystem presented in the sample/lab coordinate system. The plane trace was then calcu-lated by the cross product of the slip/twin plane normal (n), expressed in the sample/labcoordinate, and the sample normal direction ([0 0 1]). The reason for using the crossproduct of the slip/twin plane normal and the sample normal to calculate the plane traceis that if slip/twin occurred, the intersection line between the slip/twin plane of a givendeformation system and the sample surface should be parallel to the experimentallyobserved slip/twin bands. A MatlabTM code was generated to calculate all the possibleplane traces of the deformation systems for a given grain orientation. The experimen-tally-observed deformation systems in a given grain were identified by comparing thecalculated plane traces with the slip/twin plane traces observed in the BSE/SE images.
Assuming a uniaxial tension stress state, represented as σ (transformed into thecrystal coordinate system), the global Schmid factor (m) of each slip/twin system in anindividual grain could be calculated by resolving the stress in the slip direction (Burgersvector direction) of a particular slip plane (both expressed in the crystal coordinatesystem), expressed as:
m ¼ n � r � bT (4)
696 H. Li et al.
Dow
nloa
ded
by [
Mic
higa
n St
ate
Uni
vers
ity]
at 0
9:27
11
Mar
ch 2
015

Because there are three different slip directions on the basal (three <a>) and pyramidal(one <a> and two <c + a>) planes, the slip direction cannot be unambiguously deter-mined by slip trace analysis, so the slip system with the highest Schmid factor wasassumed to be the active slip system when a basal or pyramidal plane trace wasobserved. When two deformation systems exhibited similar plane traces that did nothave the same plane, the deformation system with the highest Schmid factor waschosen. Because the local stress tensor is not known in a particular location, all of theSchmid factor values were calculated based on a uniaxial global stress state.
Both slip and twinning events were identified using the trace analysis approach.Twin system activity was confirmed by comparing the twin orientations with their par-ent orientations using EBSD, as each type of twin has a unique misorientation angleand rotation axis with respect to the parent orientation. Table 2 lists the slip and twindeformation systems available in Ti for trace analysis in this work.
The observed slip traces were a result of dislocation motion and/or twinning, but ingrains without slip traces, there are several reasons why some grains may not developobservable slip lines. This could happen when the Burgers vectors were parallel to thesample surface, if the slip was diffuse and not constrained to well-defined slip bands orif the magnitude of slip was small and the slip bands were not well developed. There-fore, not all of the activated deformation systems were detected.
Results
Microstructure
Figure 3 illustrates low- and high-magnification BSE images of the as-received two-phase α + β microstructure. The microstructure contained a combination of lamellar col-onies, 50.1 ± 3.4% by volume, and equiaxed primary alpha (αp) grains, 49.9 ± 3.4% byvolume. The colonies included secondary α (αs) platelets (dark phase, 31.9 ± 3.2% ofthe total volume) separated by thin layers of the β phase (light phase, 18.2 ± 3.2% of
Table 2. List of slip and twin systems used for the trace analysis.
Slip systems
Deformation system Slip system Number of variants
Basal <a> ½�2 1 1 0� 3Prismatic <a> f0 1 �1 0g\2 �1 �1 0 > 3Pyramidal <a> f0 1 �1 1g\�2 �1 �1 0[ ½2 �1 �1 0� 6Pyramidal <c + a> f1 0 �1 1g\2 �1 �1 3 > 12
Twin systems
Twin number Misorientation between parent grain andtwinning grain orientation
Twinning system
1 85.1° @ ½1 1 �2 0� ð�1 1 0 2Þ½1 �1 0 1�2 86.8° @ ½�21 1 0� ð�1 0 1 2Þ½1 0 �1 1�3 84.7° @ 2 �1 �1 0 ð0 �1 1 2Þ½0 1 �1 1�4 88.6° @ ½�1 2�1 0� ð0 1 �1 2Þ½0 �1 1 1�
Philosophical Magazine 697
Dow
nloa
ded
by [
Mic
higa
n St
ate
Uni
vers
ity]
at 0
9:27
11
Mar
ch 2
015

the total volume). In Figure 3, both αp and αs appear dark due to the enrichment by theα-phase stabilizer Al. The β phase appears white or gray due to the enrichment by therelatively heavy β-phase stabilizer, V. The average αp grain size was 6.4 ± 4.4 μm.
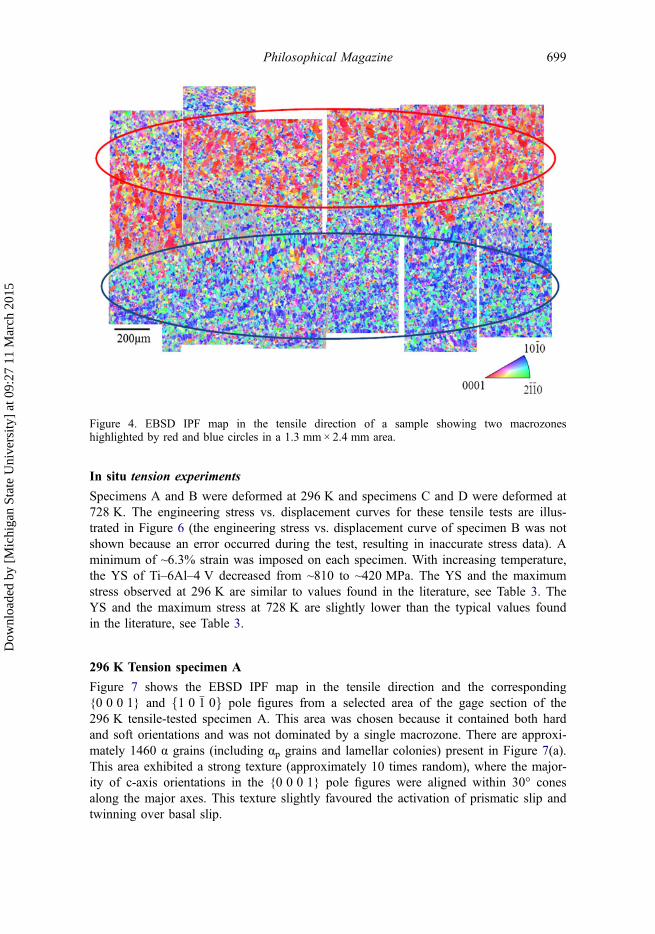
Two macrozones were observed, as illustrated in the 1.3 × 2.4 mm inverse polefigure (IPF) EBSD map in Figure 4, presented for the tensile direction. Hard (red)orientations dominated in the upper region highlighted by a red circle and soft (blueand green orientations) orientations dominated in the lower region and are highlightedby a blue circle. These macrozones can strongly affect the activation of the differentdeformation systems. For example, for a uniaxial tension test along the horizontaldirection, in the hard orientation dominated regions, both T1 twinning and pyramidal<c + a> slip had high Schmid factors, and therefore, were favoured for activationduring deformation. In contrast, in the soft-orientation dominated regions, prismatic slipexhibited high Schmid factors and was favoured for activation. Macrozones wereobserved across all the tested specimens. Therefore, to minimize the effects ofmacrozones, areas that were selected for performing slip trace analysis were intention-ally chosen to have a variety of crystal orientations.
Within α + β lamellar colonies, the β phase was often too thin to be indexed usingthe 0.75 μm step size. Thus, the resulting IPF EBSD maps exhibit only the α phase forthe α + β lamellar colonies. For example, Figure 5(a) shows an undeformed microstruc-tural patch with two lamellar colonies highlighted and labelled as “X” and “Y”. Thecorresponding EBSD IPF map in the tensile direction in Figure 5(b) shows that thesetwo lamellar colonies were indexed as α grains. In addition to the fact that the β-phasethin layers made the identification of the β-phase difficult, another reason was that theαs grains and the β thin layers within a single-colony structure usually maintained theBurgers relationship ({0 0 0 1}α||{1 1 0}β, \1 1 �2 0 >a k\1 1 1 >b), and the misorien-tations across αs platelets within a single-colony were less than 3° [28]. Similar resultshave also been reported by Bridier et al. [5].
Figure 3. (a) Low- and (b) high-magnification BSE SEM images of the as-received α + β twophase microstructure.
698 H. Li et al.
Dow
nloa
ded
by [
Mic
higa
n St
ate
Uni
vers
ity]
at 0
9:27
11
Mar
ch 2
015
In situ tension experiments
Specimens A and B were deformed at 296 K and specimens C and D were deformed at728 K. The engineering stress vs. displacement curves for these tensile tests are illus-trated in Figure 6 (the engineering stress vs. displacement curve of specimen B was notshown because an error occurred during the test, resulting in inaccurate stress data). Aminimum of ~6.3% strain was imposed on each specimen. With increasing temperature,the YS of Ti–6Al–4 V decreased from ~810 to ~420 MPa. The YS and the maximumstress observed at 296 K are similar to values found in the literature, see Table 3. TheYS and the maximum stress at 728 K are slightly lower than the typical values foundin the literature, see Table 3.
296 K Tension specimen A
Figure 7 shows the EBSD IPF map in the tensile direction and the corresponding{0 0 0 1} and f1 0 �1 0g pole figures from a selected area of the gage section of the296 K tensile-tested specimen A. This area was chosen because it contained both hardand soft orientations and was not dominated by a single macrozone. There are approxi-mately 1460 α grains (including αp grains and lamellar colonies) present in Figure 7(a).This area exhibited a strong texture (approximately 10 times random), where the major-ity of c-axis orientations in the {0 0 0 1} pole figures were aligned within 30° conesalong the major axes. This texture slightly favoured the activation of prismatic slip andtwinning over basal slip.
Figure 4. EBSD IPF map in the tensile direction of a sample showing two macrozoneshighlighted by red and blue circles in a 1.3 mm × 2.4 mm area.
Philosophical Magazine 699
Dow
nloa
ded
by [
Mic
higa
n St
ate
Uni
vers
ity]
at 0
9:27
11
Mar
ch 2
015

Figure 8 shows in situ SE SEM images acquired during the 296 K tension test ofthe Ti–6Al–4V specimen A. At ~2.4% strain, slip traces were first observed. These sliptraces are associated with basal and prismatic slip systems with the Schmid factorsgreater than 0.4. Only one prismatic slip trace was identified with a low Schmid factor(0.11) and basal slip was also observed in the same grain with a Schmid factor of 0.45.With increasing strain, more grains exhibited slip traces. After ~6.3% strain in
Figure 5. (a) A BSE SEM image showing an undeformed microstructure with two lamellar colo-nies highlighted as “X” and “Y”. (b) The corresponding IPF EBSD map in the tensile directionshowing that the orientations of the lamellar colonies, “X” and “Y”, were erroneously indexed asthe α phase only.
700 H. Li et al.
Dow
nloa
ded
by [
Mic
higa
n St
ate
Uni
vers
ity]
at 0
9:27
11
Mar
ch 2
015

Figure 9(d), slip traces were observed within ~50% of the αp grains. The slip traceswere planar and cross slip was not observed. Usually, only one slip system wasobserved for each grain that exhibited slip traces. Much fewer deformation systemswere activated in the α + β lamellar colonies compared to the equiaxed αp grains. Thiswas also the case for the other specimens tested, as will be presented later. Therefore,the analysis of deformation systems was focused on the αp grains. In Figure 8(d), a T1twin was observed with a Schmid factor of 0.48. This twin exhibited an 87.6° misorien-tation about the \2 �1 �1 0 > axis with respect to the parent grain.
A total of 313 deformation systems were determined for 297 grains, shown inFigure 9. It is important to note that if a given grain displayed the activation of twoprismatic slip systems and one pyramidal <c + a> slip system, this resulted in three
Figure 6. Stress vs. displacement plots for the tensile-tested specimens. The stress drops indicatethe stress relaxation that occurred when the tests were interrupted for imaging. The displacementvalues included displacements in both the gage section and the grip regions.
Table 3. Tensile property comparison between the experiments in the current work and the Tihandbook [4].
Test temperature YS (MPa) Max Stress (MPa) YS [4] (MPa) UTS [4] (MPa)
296 K ~810 915 760–1103 830–1172728 K ~420 572 ~500 ~650
Philosophical Magazine 701
Dow
nloa
ded
by [
Mic
higa
n St
ate
Uni
vers
ity]
at 0
9:27
11
Mar
ch 2
015

entries/counts in the total number of activated deformation systems. It is also importantto note that if a given grain exhibited a set of parallel slip lines, this was considered asone activated deformation system.
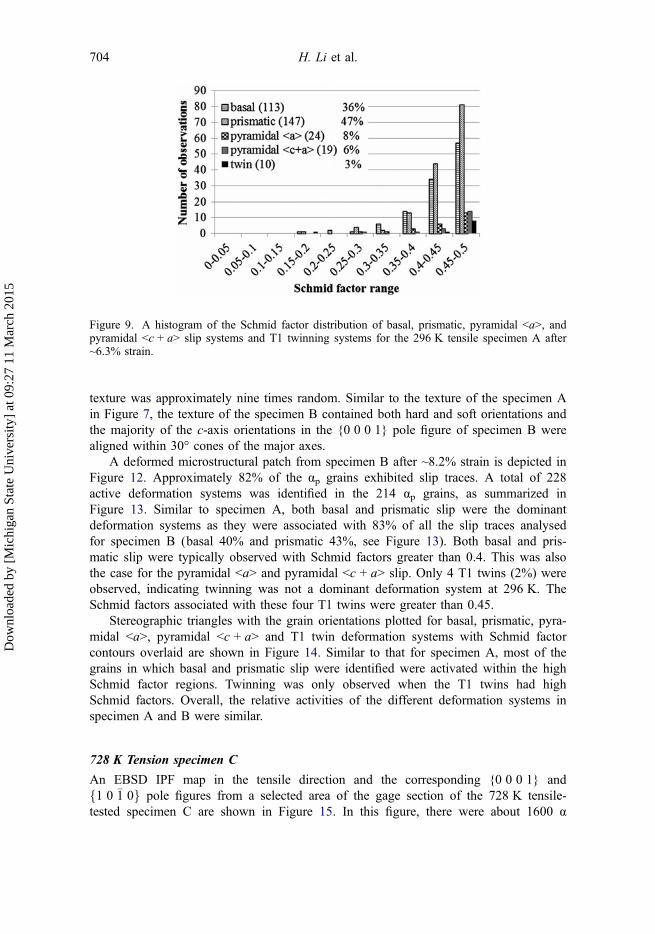
In the 297 grains analyzed, 113 basal slip systems (36%) and 147 prismatic slip sys-tems (47%) were observed, indicating that both of the basal and prismatic slip systemswere the dominant deformation systems during 296 K tension. Pyramidal <a> and pyra-midal <c + a> contributed 8% and 6% of the total deformation systems, respectively.Ten T1 twins (3%) were observed. This suggests that twinning was an active deforma-tion system but not a dominant deformation system at 296 K. As shown in Figure 9,the active deformation systems were associated with high Schmid factors and no slipsystems with Schmid factors lower than 0.15 were observed.
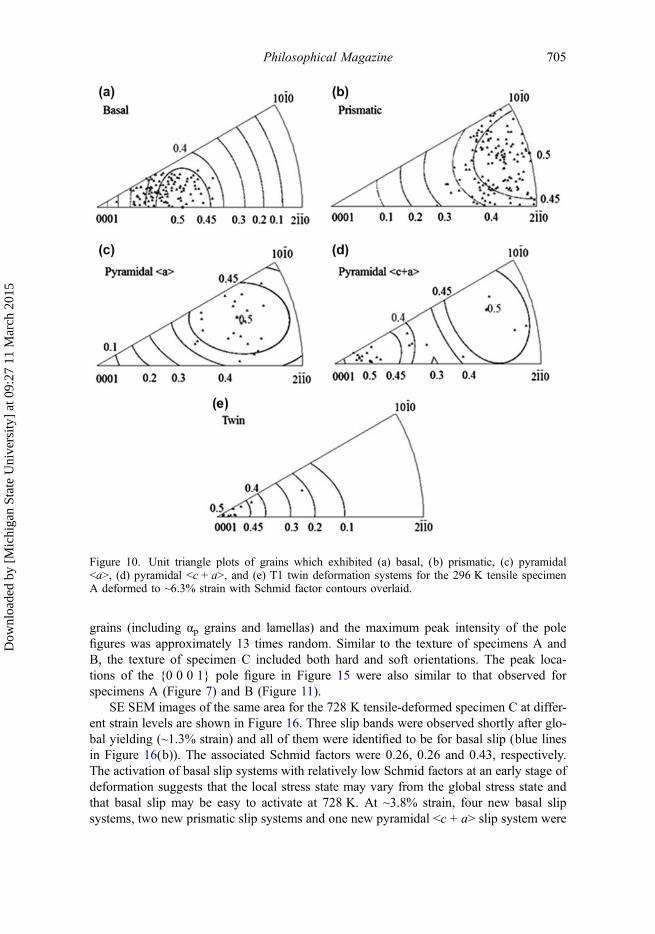
Figure 10 presents stereographic triangles with the grain orientations plotted for theobserved basal, prismatic, pyramidal <a>, pyramidal <c + a> and twinning deformationsystems with Schmid factor contours overlaid. Grains with prismatic slip were confined
Figure 7. EBSD data of the 296 K tensile-tested specimen A: (a) EBSD IPF map in the tensiledirection of the α-phase Ti containing approximately 1460 α grains, (b) the {0 0 0 1} and thef1 0 �1 0g pole figures with 30° cones along the major axes. The loading direction was horizontal.
702 H. Li et al.
Dow
nloa
ded
by [
Mic
higa
n St
ate
Uni
vers
ity]
at 0
9:27
11
Mar
ch 2
015

to the high Schmid factor regions. This is similar to that observed in 296 K tensiontests of Ti-3Al-2.5 V plates [29]. Unlike that for 296 K tension-deformed CP Ti andTi–5Al–2.5Sn, where some grains with Schmid factors below 0.1 were activated [30],prismatic slip was only observed when the Schmid factor was greater than 0.2. Most ofgrains that exhibited basal, pyramidal <a>, pyramidal <c + a> and twinning were alsowithin regions where the Schmid factor was high.
296 K Tension specimen B
The EBSD IPF map in the tensile direction and the corresponding {0 0 0 1} andf1 0 �1 0g pole figures from a selected area of the gage section of specimen B is shownin Figure 11. There were approximately 1480 α grains (including αp grains and α + βlamellar colonies) represented in Figure 11(a) and the maximum peak intensity of the
Figure 8. Sequential SE SEM images for specimen A tensile tested at 296 K: (a) undeformed,(b) 876 MPa (~2.4% strain), the color-coded planes traces for prismatic slip (red) and basal slip(blue) are labeled along with their Schmid factors (c) 901 MPa (~4.1% strain), and (d) 916 MPa(~6.3% strain). The black plane trace in (d) is for T1 twin and its Schmid factor was 0.48. Theloading direction was horizontal.
Philosophical Magazine 703
Dow
nloa
ded
by [
Mic
higa
n St
ate
Uni
vers
ity]
at 0
9:27
11
Mar
ch 2
015
texture was approximately nine times random. Similar to the texture of the specimen Ain Figure 7, the texture of the specimen B contained both hard and soft orientations andthe majority of the c-axis orientations in the {0 0 0 1} pole figure of specimen B werealigned within 30° cones of the major axes.
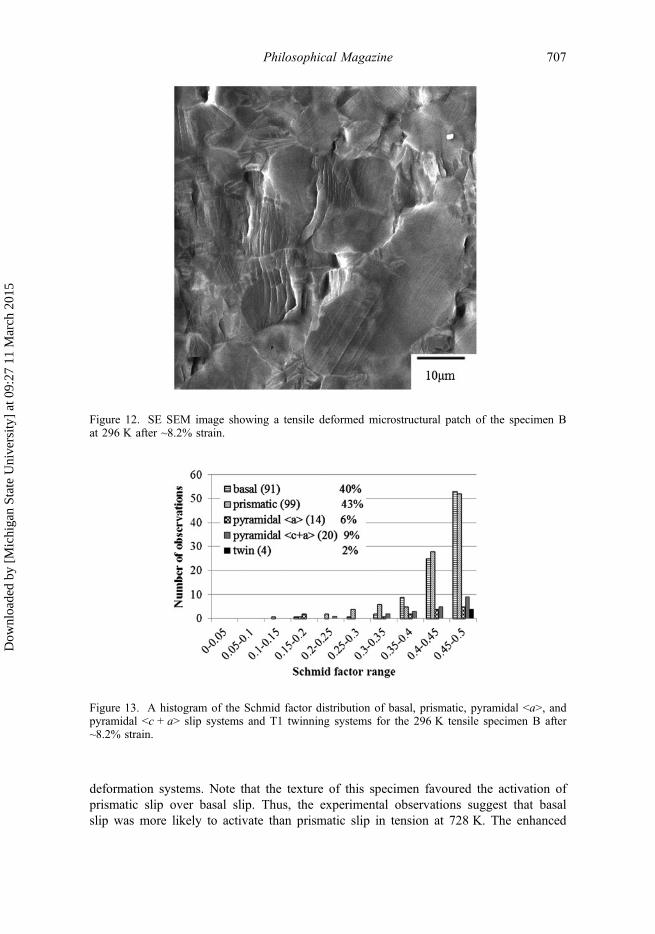
A deformed microstructural patch from specimen B after ~8.2% strain is depicted inFigure 12. Approximately 82% of the αp grains exhibited slip traces. A total of 228active deformation systems was identified in the 214 αp grains, as summarized inFigure 13. Similar to specimen A, both basal and prismatic slip were the dominantdeformation systems as they were associated with 83% of all the slip traces analysedfor specimen B (basal 40% and prismatic 43%, see Figure 13). Both basal and pris-matic slip were typically observed with Schmid factors greater than 0.4. This was alsothe case for the pyramidal <a> and pyramidal <c + a> slip. Only 4 T1 twins (2%) wereobserved, indicating twinning was not a dominant deformation system at 296 K. TheSchmid factors associated with these four T1 twins were greater than 0.45.
Stereographic triangles with the grain orientations plotted for basal, prismatic, pyra-midal <a>, pyramidal <c + a> and T1 twin deformation systems with Schmid factorcontours overlaid are shown in Figure 14. Similar to that for specimen A, most of thegrains in which basal and prismatic slip were identified were activated within the highSchmid factor regions. Twinning was only observed when the T1 twins had highSchmid factors. Overall, the relative activities of the different deformation systems inspecimen A and B were similar.
728 K Tension specimen C
An EBSD IPF map in the tensile direction and the corresponding {0 0 0 1} andf1 0 �1 0g pole figures from a selected area of the gage section of the 728 K tensile-tested specimen C are shown in Figure 15. In this figure, there were about 1600 α
Figure 9. A histogram of the Schmid factor distribution of basal, prismatic, pyramidal <a>, andpyramidal <c + a> slip systems and T1 twinning systems for the 296 K tensile specimen A after~6.3% strain.
704 H. Li et al.
Dow
nloa
ded
by [
Mic
higa
n St
ate
Uni
vers
ity]
at 0
9:27
11
Mar
ch 2
015
grains (including αp grains and lamellas) and the maximum peak intensity of the polefigures was approximately 13 times random. Similar to the texture of specimens A andB, the texture of specimen C included both hard and soft orientations. The peak loca-tions of the {0 0 0 1} pole figure in Figure 15 were also similar to that observed forspecimens A (Figure 7) and B (Figure 11).
SE SEM images of the same area for the 728 K tensile-deformed specimen C at differ-ent strain levels are shown in Figure 16. Three slip bands were observed shortly after glo-bal yielding (~1.3% strain) and all of them were identified to be for basal slip (blue linesin Figure 16(b)). The associated Schmid factors were 0.26, 0.26 and 0.43, respectively.The activation of basal slip systems with relatively low Schmid factors at an early stage ofdeformation suggests that the local stress state may vary from the global stress state andthat basal slip may be easy to activate at 728 K. At ~3.8% strain, four new basal slipsystems, two new prismatic slip systems and one new pyramidal <c + a> slip system were
Figure 10. Unit triangle plots of grains which exhibited (a) basal, (b) prismatic, (c) pyramidal<a>, (d) pyramidal <c + a>, and (e) T1 twin deformation systems for the 296 K tensile specimenA deformed to ~6.3% strain with Schmid factor contours overlaid.
Philosophical Magazine 705
Dow
nloa
ded
by [
Mic
higa
n St
ate
Uni
vers
ity]
at 0
9:27
11
Mar
ch 2
015

identified for this microstructural patch (see Figure 16(c)). Each of the newly activatedslip systems were associated with Schmid factors greater than 0.4. After 10.2% strain,~76% of the αp grains in the observed region exhibited slip traces. Usually, only onedeformation system was observed for each slipped grain. Grain boundary ledge formationwas also evident and this was more pronounced than that exhibited by the 296 K tensile-tested specimen B at a similar strain (see Figure 12).
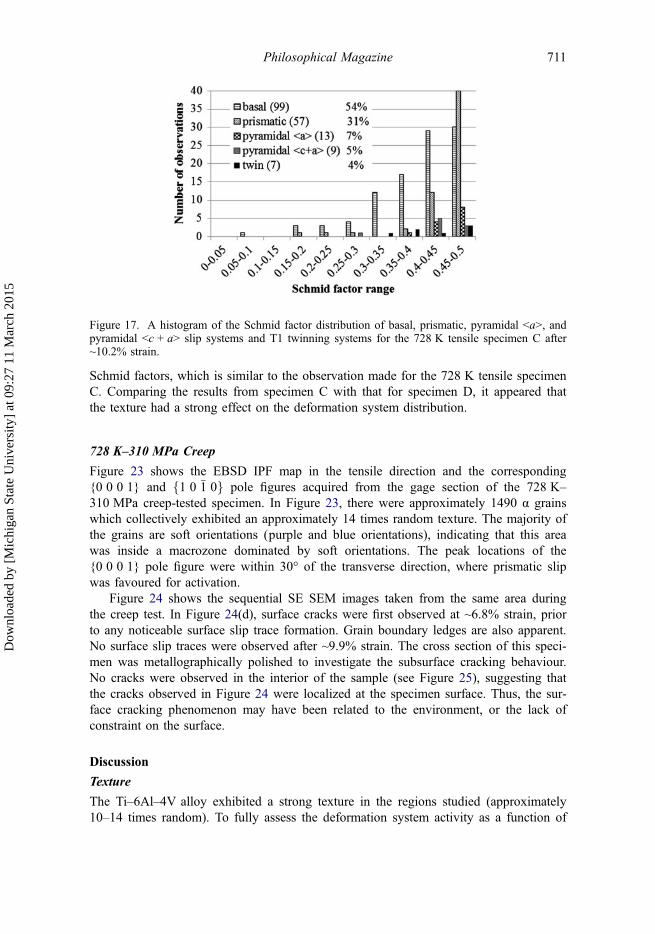
The slip-trace technique was used to identify a total of 185 active deformationsystems in 179 αp grains, as summarized in Figure 17. In the 179 grains analysed, 99basal slip systems were identified and comprised 54% of the total deformation systems.Fifty-seven prismatic slip systems were identified and comprised 31% of the total
Figure 11. EBSD data of the 296 K tensile-tested specimen B: (a) EBSD IPF map in the tensiledirection of the α-phase Ti containing approximately 1480 α grains, (b) the {0 0 0 1} and thef1 0 �1 0g pole figures with 30° cones along the major axes. The loading direction was horizontal.
706 H. Li et al.
Dow
nloa
ded
by [
Mic
higa
n St
ate
Uni
vers
ity]
at 0
9:27
11
Mar
ch 2
015
deformation systems. Note that the texture of this specimen favoured the activation ofprismatic slip over basal slip. Thus, the experimental observations suggest that basalslip was more likely to activate than prismatic slip in tension at 728 K. The enhanced
Figure 12. SE SEM image showing a tensile deformed microstructural patch of the specimen Bat 296 K after ~8.2% strain.
Figure 13. A histogram of the Schmid factor distribution of basal, prismatic, pyramidal <a>, andpyramidal <c + a> slip systems and T1 twinning systems for the 296 K tensile specimen B after~8.2% strain.
Philosophical Magazine 707
Dow
nloa
ded
by [
Mic
higa
n St
ate
Uni
vers
ity]
at 0
9:27
11
Mar
ch 2
015

basal slip activity relative to prismatic slip at 728 K in the current work is consistentwith the work of Williams et al. [7], who found that basal slip became more dominantduring higher-temperature deformation. Thirteen pyramidal <a> slip systems (13/185 =5%) and 9 pyramidal <c + a> slip systems (9/185 = 5%) were observed. Twinning wasalso observed to make up about 4% of the total deformation systems.
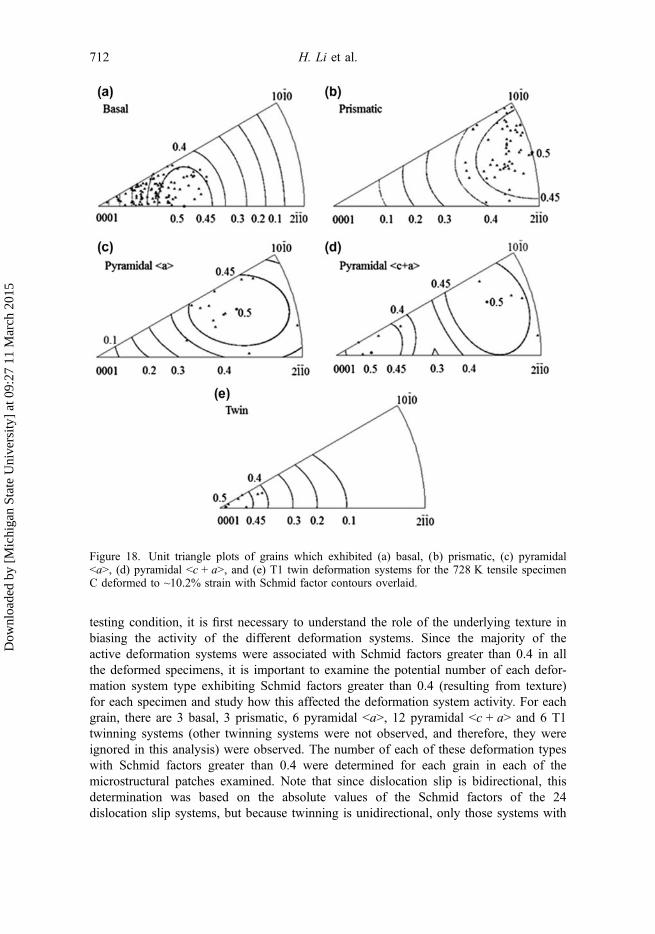
Figure 18 shows the stereographic triangles with the grain orientations plotted forbasal, prismatic, pyramidal <a>, pyramidal <c + a> and T1 twinning deformation sys-tems with the Schmid factor contours overlaid. Grains with prismatic slip, pyramidal<a> slip, pyramidal <c + a> slip and T1 twin were confined to the high Schmid factorregions (>0.4). Grains which exhibited basal slip were distributed over a large part ofthe stereographic triangle. Some hard oriented grains exhibited basal slip in a regionwhere the Schmid factor for basal slip was below 0.2.
Figure 14. Unit triangle plots of grains which exhibited (a) basal, (b) prismatic, (c) pyramidal<a>, (d) pyramidal <c + a>, and (e) T1 twin deformation systems for the 296 K tensile specimenB deformed to ~8.2% strain with Schmid factor contours overlaid.
708 H. Li et al.
Dow
nloa
ded
by [
Mic
higa
n St
ate
Uni
vers
ity]
at 0
9:27
11
Mar
ch 2
015

728 K Tension specimen D
The EBSD IPF map in the tensile direction and the corresponding {0 0 0 1} andf1 0 �1 0g pole figures from the gage section of specimen D are shown in Figure 19.There were approximately 980 grains and collectively they exhibited ~14 times randomtexture. In the {0 0 0 1} pole figure, the locations with maximum peak intensities werewithin the 30° arc of the transverse direction. Unlike that for the tensile specimens A,B and C, specimen D exhibited a texture dominated by purple grain orientations, wherepyramidal <a> slip system had high Schmid factors, see Figure 19(a).
A deformed microstructural patch from the 728 K tensile-tested specimen D after~11.6% strain is shown in Figure 20. Wavy slip lines indicated the development of
Figure 15. EBSD data of the 728 K tensile-tested specimen C: (a) EBSD IPF map in the tensiledirection of the α-phase Ti containing approximately 1600 α grains, (b) the {0 0 0 1} and thef1 0 �1 0g pole figures with 30° cones along the major axes. The loading direction was horizontal.
Philosophical Magazine 709
Dow
nloa
ded
by [
Mic
higa
n St
ate
Uni
vers
ity]
at 0
9:27
11
Mar
ch 2
015

cross slip. After ~11.6% strain, about 60% of αp grains exhibited slip traces, and grainboundary ledges formed along some grain boundaries, suggesting sliding. Seventy slipsystems were determined for a total of 63 αp grains. The histogram illustrating thedeformation systems with respect to the Schmid factor is provided in Figure 21. In the63 grains analysed, 26 basal slip, 19 prismatic slip, 21 pyramidal <a> slip and 4 pyra-midal <c + a> slip systems were identified, corresponding to 37, 27, 30 and 6% of thetotal deformation systems, respectively. No twinning was observed. This differs fromthe 728 K tensile test performed on specimen C, where some T1 twins were observed.Similar to the 728 K tensile-tested specimen C, most of the slip deformation systemsexhibited Schmid factors greater than 0.4.
Figure 22 shows the stereographic triangles with the grain orientations plotted forbasal, prismatic, pyramidal <a> and pyramidal <c + a> slip with Schmid factorcontours overlaid. The majority of the slip systems were activated in grains with high
Figure 16. Sequential SE SEM images for specimen C tensile tested at 728 K: (a) undeformed,(b) 463 MPa (~1.3% strain, when slip bands were first observed), (c) 523 MPa (~3.8% strain),and (d) 557 MPa (~10.2% strain). In (b) and (c), planes traces are color coded for prismatic slip(red), basal slip (blue), and pyramidal <c + a> (orange). The loading direction was horizontal.
710 H. Li et al.
Dow
nloa
ded
by [
Mic
higa
n St
ate
Uni
vers
ity]
at 0
9:27
11
Mar
ch 2
015
Schmid factors, which is similar to the observation made for the 728 K tensile specimenC. Comparing the results from specimen C with that for specimen D, it appeared thatthe texture had a strong effect on the deformation system distribution.
728 K–310 MPa Creep
Figure 23 shows the EBSD IPF map in the tensile direction and the corresponding{0 0 0 1} and f1 0 �1 0g pole figures acquired from the gage section of the 728 K–310 MPa creep-tested specimen. In Figure 23, there were approximately 1490 α grainswhich collectively exhibited an approximately 14 times random texture. The majority ofthe grains are soft orientations (purple and blue orientations), indicating that this areawas inside a macrozone dominated by soft orientations. The peak locations of the{0 0 0 1} pole figure were within 30° of the transverse direction, where prismatic slipwas favoured for activation.
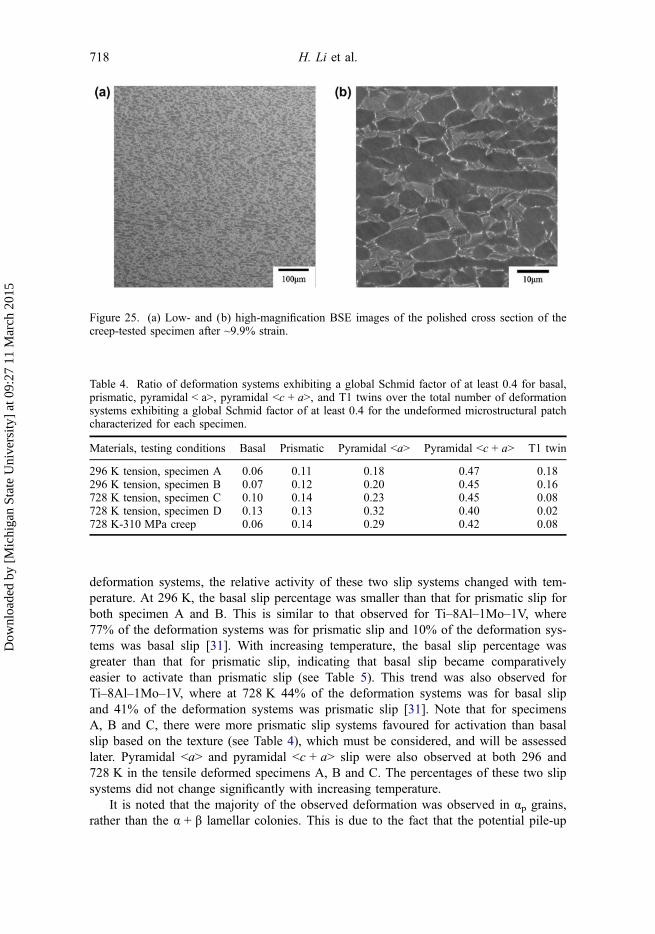
Figure 24 shows the sequential SE SEM images taken from the same area duringthe creep test. In Figure 24(d), surface cracks were first observed at ~6.8% strain, priorto any noticeable surface slip trace formation. Grain boundary ledges are also apparent.No surface slip traces were observed after ~9.9% strain. The cross section of this speci-men was metallographically polished to investigate the subsurface cracking behaviour.No cracks were observed in the interior of the sample (see Figure 25), suggesting thatthe cracks observed in Figure 24 were localized at the specimen surface. Thus, the sur-face cracking phenomenon may have been related to the environment, or the lack ofconstraint on the surface.
Discussion
Texture
The Ti–6Al–4V alloy exhibited a strong texture in the regions studied (approximately10–14 times random). To fully assess the deformation system activity as a function of
Figure 17. A histogram of the Schmid factor distribution of basal, prismatic, pyramidal <a>, andpyramidal <c + a> slip systems and T1 twinning systems for the 728 K tensile specimen C after~10.2% strain.
Philosophical Magazine 711
Dow
nloa
ded
by [
Mic
higa
n St
ate
Uni
vers
ity]
at 0
9:27
11
Mar
ch 2
015
testing condition, it is first necessary to understand the role of the underlying texture inbiasing the activity of the different deformation systems. Since the majority of theactive deformation systems were associated with Schmid factors greater than 0.4 in allthe deformed specimens, it is important to examine the potential number of each defor-mation system type exhibiting Schmid factors greater than 0.4 (resulting from texture)for each specimen and study how this affected the deformation system activity. For eachgrain, there are 3 basal, 3 prismatic, 6 pyramidal <a>, 12 pyramidal <c + a> and 6 T1twinning systems (other twinning systems were not observed, and therefore, they wereignored in this analysis) were observed. The number of each of these deformation typeswith Schmid factors greater than 0.4 were determined for each grain in each of themicrostructural patches examined. Note that since dislocation slip is bidirectional, thisdetermination was based on the absolute values of the Schmid factors of the 24dislocation slip systems, but because twinning is unidirectional, only those systems with
Figure 18. Unit triangle plots of grains which exhibited (a) basal, (b) prismatic, (c) pyramidal<a>, (d) pyramidal <c + a>, and (e) T1 twin deformation systems for the 728 K tensile specimenC deformed to ~10.2% strain with Schmid factor contours overlaid.
712 H. Li et al.
Dow
nloa
ded
by [
Mic
higa
n St
ate
Uni
vers
ity]
at 0
9:27
11
Mar
ch 2
015

positive Schmid factors were considered. Table 4 summarizes the potential fraction ofthe number of the deformation systems exhibiting a Schmid factor of at least 0.4 forbasal, prismatic, pyramidal <a>, pyramidal <c + a> and T1 twins over the total numberof deformation systems exhibiting a Schmid factor of at least 0.4 for all of the grains inthe EBSD mapped areas for each of the individual specimens. In each row of Table 4,the fractions add up to 1.
Figure 19. EBSD data of the 728 K tensile-tested specimen D: (a) EBSD IPF map in the tensiledirection of the α-phase Ti containing approximately 980 α grains, (b) the {0 0 0 1} and thef1 0 �1 0g pole figures with 30° cones along the major axes. The intentional scratch on the middleof the EBSD map was used as a fiducial marker. The loading direction was horizontal.
Philosophical Magazine 713
Dow
nloa
ded
by [
Mic
higa
n St
ate
Uni
vers
ity]
at 0
9:27
11
Mar
ch 2
015

Both prismatic slip and T1 twinning were more favoured (high Schmid factors) thanbasal slip for the 296 K tensile-tested specimens. For the 728 K tensile-tested specimenC, prismatic slip was more favoured than basal slip. Compared to specimens A and B,specimen C exhibited a smaller potential fraction for T1 twinning (0.08, as compared to
Figure 20. SE SEM image showing a tensile-deformed microstructural patch of specimen D at728 K after ~11.6% strain.
Figure 21. A histogram of the Schmid factor distribution of basal, prismatic, pyramidal <a>, andpyramidal <c + a> slip systems for the 728 K tensile specimen D after ~11.6% strain.
714 H. Li et al.
Dow
nloa
ded
by [
Mic
higa
n St
ate
Uni
vers
ity]
at 0
9:27
11
Mar
ch 2
015

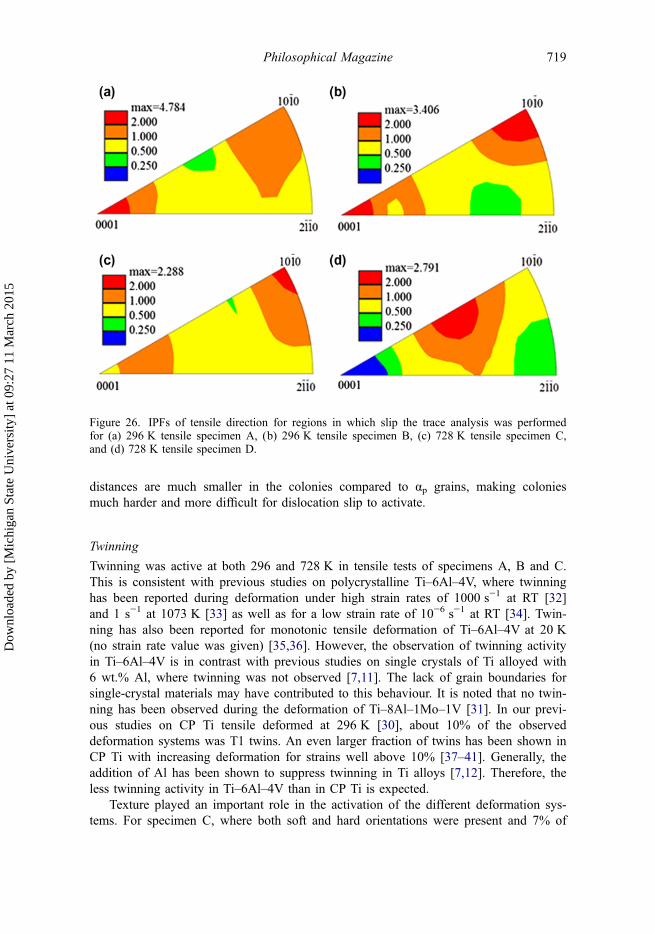
0.18 and 0.16 for specimens A and B). The 728 K tensile-tested specimen D exhibitedthe same ratio for basal and prismatic slip (0.13), but exhibited the smallest ratio for T1twinning (0.02) among all of the four tensile-tested specimens. Furthermore, specimenD exhibited the largest ratio (0.32) for pyramidal <a> slip among specimens A–D (seeTable 4). These observations indicate that the texture of specimen D was distinct fromspecimens A, B and C. This is also supported by Figure 26, where the IPFs of tensiledirection for regions in which the slip trace analysis was performed for specimens A–Dwere plotted. The grain orientations of specimens A, B and C were preferably distrib-uted near the <0 0 0 1> and \1 0 �1 0 > corners. However, the grain orientations ofspecimen D were more concentrated in the middle of the IPF, where the Schmid factorsof pyramidal <a> slip are high. Such texture differences should be taken into consider-ation when comparing the deformation systems of specimen D with the other tensile-tested specimens. In the next section, the results of specimens A, B and C were chosento compare the effect of temperature on the activation of the different deformation sys-tems at 296 and 728 K, respectively. The results of specimens C and D were chosen tocompare the effect of texture on the activation of the different deformation systems.
Deformation mechanisms
Slip bands and grain boundary ledges were the two main indicators of deformation inthis alloy. Table 5 summarizes the distribution of the observed deformation systems andidentifies qualitatively the amount of grain boundary sliding (GBS). During the 296 Ktension tests, at least 50% of the αp grains exhibited slip traces and GBS was not
Figure 22. A histogram of the Schmid factor distribution of basal, prismatic, pyramidal <a>, andpyramidal <c + a> slip systems for the 728 K tensile specimen D deformed to ~11.6% strain.
Philosophical Magazine 715
Dow
nloa
ded
by [
Mic
higa
n St
ate
Uni
vers
ity]
at 0
9:27
11
Mar
ch 2
015

prevalent. With increasing temperature from 296 to 728 K, both dislocation slip andGBS were active, indicating that GBS became more active at elevated temperature.However, below the yield stress in the 728 K–310 MPa creep test, no slip traces wereobserved; only GBS was observed.
For tensile tests A, B and C at 296 and 728 K, both basal and prismatic slip werethe primary deformation systems, as together they comprised at least 80% of the totaldeformation systems (see Table 5). For these three specimens, more than 95% of thebasal and prismatic slip systems were activated with Schmid factors greater than 0.3.
Figure 23. EBSD data of the creep-tested specimen: (a) EBSD IPF map in the tensile directionof the α-phase Ti containing approximately 1490 α grains, (b) the {0 0 0 1} and the f1 0 �1 0gpole figures with 30° cones along the major axes. The loading direction was horizontal.
716 H. Li et al.
Dow
nloa
ded
by [
Mic
higa
n St
ate
Uni
vers
ity]
at 0
9:27
11
Mar
ch 2
015

This suggests that the activation of these two deformation systems was highly influ-enced by the global stress state. Although both basal and prismatic slips are primary
Figure 24. Sequential SE SEM images for the creep-tested sample: (a) before loading; (b) ~3.2%strain, 16 h; (c) ~6.0% strain, 40 h; (d) ~6.8% strain, 64 h; (e) ~7.3% strain, 100 h; (f) ~9.9%strain, 148 h. The loading direction was horizontal.
Philosophical Magazine 717
Dow
nloa
ded
by [
Mic
higa
n St
ate
Uni
vers
ity]
at 0
9:27
11
Mar
ch 2
015
deformation systems, the relative activity of these two slip systems changed with tem-perature. At 296 K, the basal slip percentage was smaller than that for prismatic slip forboth specimen A and B. This is similar to that observed for Ti–8Al–1Mo–1V, where77% of the deformation systems was for prismatic slip and 10% of the deformation sys-tems was basal slip [31]. With increasing temperature, the basal slip percentage wasgreater than that for prismatic slip, indicating that basal slip became comparativelyeasier to activate than prismatic slip (see Table 5). This trend was also observed forTi–8Al–1Mo–1V, where at 728 K 44% of the deformation systems was for basal slipand 41% of the deformation systems was prismatic slip [31]. Note that for specimensA, B and C, there were more prismatic slip systems favoured for activation than basalslip based on the texture (see Table 4), which must be considered, and will be assessedlater. Pyramidal <a> and pyramidal <c + a> slip were also observed at both 296 and728 K in the tensile deformed specimens A, B and C. The percentages of these two slipsystems did not change significantly with increasing temperature.
It is noted that the majority of the observed deformation was observed in αp grains,rather than the α + β lamellar colonies. This is due to the fact that the potential pile-up
Figure 25. (a) Low- and (b) high-magnification BSE images of the polished cross section of thecreep-tested specimen after ~9.9% strain.
Table 4. Ratio of deformation systems exhibiting a global Schmid factor of at least 0.4 for basal,prismatic, pyramidal < a>, pyramidal <c + a>, and T1 twins over the total number of deformationsystems exhibiting a global Schmid factor of at least 0.4 for the undeformed microstructural patchcharacterized for each specimen.
Materials, testing conditions Basal Prismatic Pyramidal <a> Pyramidal <c + a> T1 twin
296 K tension, specimen A 0.06 0.11 0.18 0.47 0.18296 K tension, specimen B 0.07 0.12 0.20 0.45 0.16728 K tension, specimen C 0.10 0.14 0.23 0.45 0.08728 K tension, specimen D 0.13 0.13 0.32 0.40 0.02728 K-310 MPa creep 0.06 0.14 0.29 0.42 0.08
718 H. Li et al.
Dow
nloa
ded
by [
Mic
higa
n St
ate
Uni
vers
ity]
at 0
9:27
11
Mar
ch 2
015
distances are much smaller in the colonies compared to αp grains, making coloniesmuch harder and more difficult for dislocation slip to activate.
Twinning
Twinning was active at both 296 and 728 K in tensile tests of specimens A, B and C.This is consistent with previous studies on polycrystalline Ti–6Al–4V, where twinninghas been reported during deformation under high strain rates of 1000 s−1 at RT [32]and 1 s−1 at 1073 K [33] as well as for a low strain rate of 10−6 s−1 at RT [34]. Twin-ning has also been reported for monotonic tensile deformation of Ti–6Al–4V at 20 K(no strain rate value was given) [35,36]. However, the observation of twinning activityin Ti–6Al–4V is in contrast with previous studies on single crystals of Ti alloyed with6 wt.% Al, where twinning was not observed [7,11]. The lack of grain boundaries forsingle-crystal materials may have contributed to this behaviour. It is noted that no twin-ning has been observed during the deformation of Ti–8Al–1Mo–1V [31]. In our previ-ous studies on CP Ti tensile deformed at 296 K [30], about 10% of the observeddeformation systems was T1 twins. An even larger fraction of twins has been shown inCP Ti with increasing deformation for strains well above 10% [37–41]. Generally, theaddition of Al has been shown to suppress twinning in Ti alloys [7,12]. Therefore, theless twinning activity in Ti–6Al–4V than in CP Ti is expected.
Texture played an important role in the activation of the different deformation sys-tems. For specimen C, where both soft and hard orientations were present and 7% of
Figure 26. IPFs of tensile direction for regions in which slip the trace analysis was performedfor (a) 296 K tensile specimen A, (b) 296 K tensile specimen B, (c) 728 K tensile specimen C,and (d) 728 K tensile specimen D.
Philosophical Magazine 719
Dow
nloa
ded
by [
Mic
higa
n St
ate
Uni
vers
ity]
at 0
9:27
11
Mar
ch 2
015

the deformation systems favoured twinning activation based on the texture (Table 4),4% of the total active deformation systems were identified to be twins after ~10.2%strain. For specimen D, where soft orientations dominated and only 2% of the deforma-tion systems favoured twinning activation based on the texture (see Table 4), twinningwas not observed, even after ~11.6% strain. Therefore, the absence of twinning in spec-imen D was most likely due to the fact that the texture of specimen D did not favourtwinning. Furthermore, because pyramidal <a> slip systems were not strongly favouredfor activation in specimen C as compared with specimen D based on the texture(Figure 26 and Table 4), a higher fraction of pyramidal <a> slip activity was observedin specimen D than specimen C.
Comparison of the tensile deformation mechanisms with CP Ti, Ti–5Al–2.5Sn andTi–8Al–1Mo–1V
Tension
Dislocation slip was the primary tensile deformation mechanism observed in the tensiletests for each of the materials. However, the relative activity of the different deforma-tion systems changed as a function of alloy composition and temperature. Prismatic slipwas commonly observed in each material, and it comprised at least 61% of the totaldeformation systems for CP Ti, 47% for Ti–5Al–2.5Sn and 27% for Ti–6Al–4V. How-ever, basal slip was more active in Ti–5Al–2.5Sn and Ti–6Al–4V. Extensive basal sliphas also been observed in Ti–6Al–4V [5] and Ti–6Al [42]. These observations, alongwith the current work, are consistent with prior work that showed that as the c/a ratioincreases with increasing Al content [43,44], the basal plane becomes more closelypacked and thus, more favourable for slip, while the prismatic planes become less clo-sely packed and less favourable for slip. Increases in Al content also result in adecrease in the stacking fault energy on the basal planes. Guo et al. [45] found that thestacking fault energy decreases from 0.31 J/m2 for CP Ti to 0.082 J/m2 for Ti–5.3Al(wt.%). Zaefferer [12] found that the increase in Al content results in a decrease in the
Table 5. Distribution of the observed deformation systems.
Test mode, Approx. strain
(%) of αpgrainsshowingslip traces
Deformation system
Grainboundaryledges/sliding
Dislocation slip
Basal(%)
Prismatic(%)
Pyr<a>(%)
Pyr<c + a>(%)
T1twin(%)
296 K tension ~6.3%,specimen A
~50 36 47 8 6 3 Notprevalent
296 K tension ~8.2%,specimen B
~82 40 43 6 9 2 Notprevalent
728 K tension ~10.2%,specimen C
~76 54 31 7 5 4 Somewhatprevalent
728 K tension ~11.6%,specimen D
~60 37 27 30 6 0 Somewhatprevalent
763 K-310 MPa creep,~9.9%
~0 – – – – – Prevalent
720 H. Li et al.
Dow
nloa
ded
by [
Mic
higa
n St
ate
Uni
vers
ity]
at 0
9:27
11
Mar
ch 2
015
stacking fault energy on the basal planes, and as a consequence, dislocation movementis increasingly restricted to the basal planes when increased Al contents are presented.For these reasons, Ti–6Al–4V is expected to show the enhanced basal slip activity withrespect to prismatic slip activity compared with CP Ti.
The relative activity of pyramidal <a> and pyramidal <c + a> also changed withalloying. The pyramidal <a> slip system comprised less than 8% of the total deforma-tion systems in CP Ti [30], Ti–5Al–2.5Sn [30] and Ti–6Al–4V (specimens A, B and C)at both 296 and 728 K. Compared to these alloys and Ti–8Al–1Mo–1V [31], there wasslightly more pyramidal <c + a> slip activity in CP Ti at both 296 and 728 K, suggest-ing that the CRSS of pyramidal <c + a> slip increases with alloying content. The rela-tive CRSS ratios, shown in Table 6 (discussed in more detail below), justify thisstatement.
Alloying with Al suppresses twin formation. Twins only accounted for approxi-mately 1% of the deformation systems in Ti–5Al–2.5Sn deformed at 296 K. ForTi–6Al–4V deformed at both 296 and 728 K, twinning accounted for no more than 4%of the deformation systems. For Ti–8Al–1Mo–1V no twinning was observed [31].However, twinning accounted for over 9% of the deformation systems in CPTi deformed at 296 and 728 K. The observation of less deformation twinning in poly-crystalline Ti–5Al–2.5Sn, Ti–8Al–1Mo–1V and Ti–6Al–4V is, therefore, consistent withthe observations of Williams et al. [7], who showed that twinning decreased with theaddition of Al in the α phase.
In addition to the change in the relative activity of the different deformation systemsof these materials as a function of alloying, the relationship between the activation ofthese deformation systems and the associated global Schmid factors also varied.Although the local stress state can vary between individual grains and within grains dueto stress concentrations and inhomogeneities, the global Schmid factor is an importantparameter that is typically correlated with the activation of a particular deformation sys-tem. For Ti–6Al–4V, no more than 9% of the activated deformation systems in tensiontests exhibited Schmid factors below 0.3 (in some samples, it was less than 2%), whichis unlike that observed for the tension tests performed on Ti–5Al–2.5Sn (<1% β phase,39.5 ± 10.0 μm α grain size) and CP Ti (140.4 ± 25.7 μm α grain size), where 13–21%of the activated deformation systems activated with Schmid factors smaller than 0.3.This suggests that local stress concentrations are less likely to build up in the Ti–6Al–4V alloy, compared to the CP Ti and Ti–5Al–2.5Sn. This may be due to two reasons.First, Ti–6Al–4V (18.2 ± 3.2% β phase) exhibited a larger volume fraction of the pre-sumably softer β phase than CP Ti and Ti–5Al–2.5Sn (<1% β phase), and the presum-ably softer β phase may act to mitigate stress concentrations during deformation.Indeed, observations have shown that the β phase, with a large number of slip systems,can readily accept slip transfer from the presumably harder α phase [46]. Second, com-pared to CP Ti and Ti–5Al–2.5Sn, Ti–6Al–4V exhibited a finer grain size, which is alsoeffective in reducing stress concentrations [47]. More observations of slip system activa-tion associated with high Schmid factors for Ti–6Al–4V in the present study are alsoconsistent with previous work on Ti–6Al–4V by Bridier et al. [5]. Their alloy exhibiteda grain size similar to that for the Ti–6Al–4V evaluated in this study, and they foundthat less than 5% of the basal and prismatic slip systems was activated with Schmidfactors below 0.3. It is noted that less than 10% of the activated deformation systems intension tests for Ti–8Al–1Mo–1V (consistent with the larger grain size of 15 ± 3 μm)
Philosophical Magazine 721
Dow
nloa
ded
by [
Mic
higa
n St
ate
Uni
vers
ity]
at 0
9:27
11
Mar
ch 2
015

exhibited Schmid factors below 0.3 [31], which is consistent with the results of the cur-rent work.
Creep
This section compares the tensile-creep deformation behaviour of the currently exam-ined Ti–6Al–4V to that for CP Ti and Ti–5Al–2.5Sn [30] and Ti–8Al–1Mo–1V [31].During the elevated temperature tensile-creep tests, the relative activity of dislocationslip and GBS varied from material to material. During the 728 K–250 MPa creep defor-mation of Ti–5Al–2.5Sn, 728 K–315 MPa deformation of Ti–8Al–1Mo–1V and 728 K–310 MPa creep deformation of Ti–6Al–4V, GBS appeared to be the primary deforma-tion mechanism rather than dislocation slip. Although the ratio of the applied creepstress to the YS was similar in CP Ti (0.73), Ti–5Al–2.5Sn (0.76), Ti–8Al–1Mo–1V(0.6) and Ti–6Al–4V (0.74), dislocation slip, rather than GBS, was the dominant defor-mation mechanism in CP Ti creep. It has been reported that finer grain sizes enhanceGBS [48–50]. Thus, the deformation mechanism difference between these materials dur-ing creep may depend more strongly on the grain size difference. CP Ti exhibited thelargest grain size (d = 140.4 ± 25.7 μm) followed by Ti–5Al–2.5Sn (d = 39.5 ±10.0 μm) then Ti–8Al–1Mo–1V (d = 15 ± 3 μm) and 6.4 ± 4.4 μm for Ti–6Al–4V.
The percentage of grains exhibiting slip traces out of the total number of grains andthe preferred slip systems when slip occurred also varied from material to material. Dur-ing the 728 K–45 MPa creep test of CP Ti, ~97% of the total grains exhibited sliptraces and prismatic slip dominated (64%). Thus, dislocation slip was the dominantdeformation mechanism in the tensile-creep test of CP Ti, and when slip occurred pris-matic slip was preferred. In contrast, in the 728 K–250 MPa creep test of Ti–5Al–2.5Sn, only ~10% of the total grains exhibited slip traces, where 78% of deformationsystems was basal slip and 16% of the deformation systems was prismatic slip. Simi-larly, in the 728 K–315 MPa creep test of Ti–8Al–1Mo–1V [31], 84% of deformationsystems was basal slip and prismatic slip only comprised 3%. Therefore, for Ti–5Al–2.5Sn and Ti–8Al–1Mo–1V, GBS was the primary deformation mechanism and whenslip occurred, basal slip was the preferred system. No slip traces were observed duringthe 728 K–310 MPa creep test of Ti–6Al–4V, and GBS was clearly a dominantdeformation mechanism to accommodate plastic deformation.
CRSS ratios
Recently, the authors developed a methodology for estimating the CRSS ratios forα-phase Ti based on slip trace analysis of in situ deformed CP Ti and Ti–5Al–2.5Sn[26]. Following this methodology, the number of observations of each of the five defor-mation system types (i.e. basal, prismatic, pyramidal <a>, pyramidal <c + a> and T1twinning) as a function of the global Schmid factor, which was binned with incrementsof 0.05, was recorded and placed into 10 Schmid factor bins for each of the five defor-mation system types. This distribution is called the experimentally-observed deforma-tion system-Schmid factor distribution. Next, for all the grains in a givenmicrostructural patch of a given test, the number of potential deformation systems of agiven deformation type and Schmid factor bin were calculated, regardless of whetherthe deformation system was activated or not. These data account for the texture and
722 H. Li et al.
Dow
nloa
ded
by [
Mic
higa
n St
ate
Uni
vers
ity]
at 0
9:27
11
Mar
ch 2
015
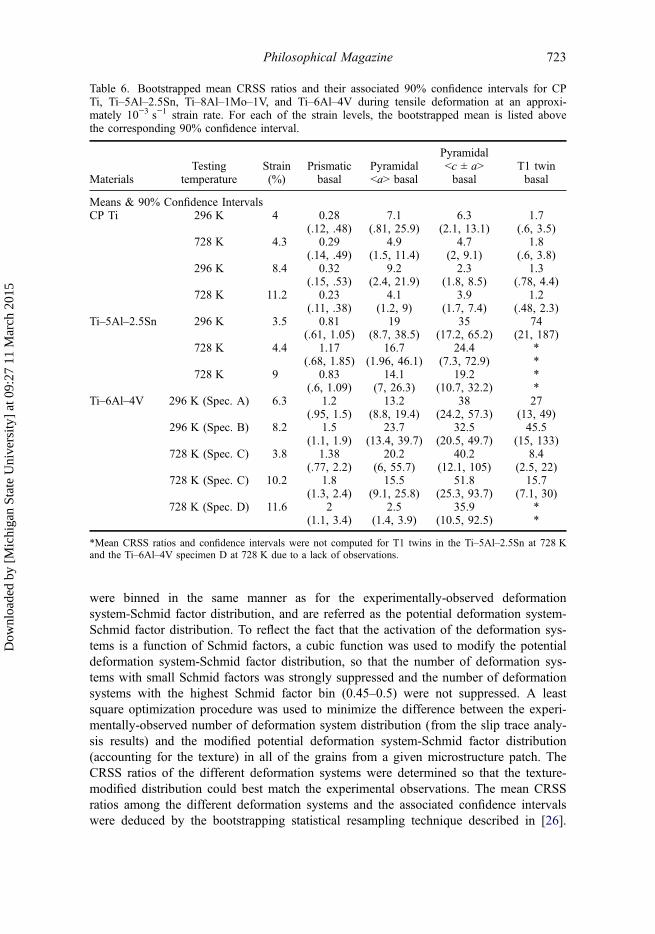
were binned in the same manner as for the experimentally-observed deformationsystem-Schmid factor distribution, and are referred as the potential deformation system-Schmid factor distribution. To reflect the fact that the activation of the deformation sys-tems is a function of Schmid factors, a cubic function was used to modify the potentialdeformation system-Schmid factor distribution, so that the number of deformation sys-tems with small Schmid factors was strongly suppressed and the number of deformationsystems with the highest Schmid factor bin (0.45–0.5) were not suppressed. A leastsquare optimization procedure was used to minimize the difference between the experi-mentally-observed number of deformation system distribution (from the slip trace analy-sis results) and the modified potential deformation system-Schmid factor distribution(accounting for the texture) in all of the grains from a given microstructure patch. TheCRSS ratios of the different deformation systems were determined so that the texture-modified distribution could best match the experimental observations. The mean CRSSratios among the different deformation systems and the associated confidence intervalswere deduced by the bootstrapping statistical resampling technique described in [26].
Table 6. Bootstrapped mean CRSS ratios and their associated 90% confidence intervals for CPTi, Ti–5Al–2.5Sn, Ti–8Al–1Mo–1V, and Ti–6Al–4V during tensile deformation at an approxi-mately 10−3 s−1 strain rate. For each of the strain levels, the bootstrapped mean is listed abovethe corresponding 90% confidence interval.
MaterialsTesting
temperatureStrain(%)
Prismaticbasal
Pyramidal<a> basal
Pyramidal<c ± a>basal
T1 twinbasal
Means & 90% Confidence IntervalsCP Ti 296 K 4 0.28 7.1 6.3 1.7
(.12, .48) (.81, 25.9) (2.1, 13.1) (.6, 3.5)728 K 4.3 0.29 4.9 4.7 1.8
(.14, .49) (1.5, 11.4) (2, 9.1) (.6, 3.8)296 K 8.4 0.32 9.2 2.3 1.3
(.15, .53) (2.4, 21.9) (1.8, 8.5) (.78, 4.4)728 K 11.2 0.23 4.1 3.9 1.2
(.11, .38) (1.2, 9) (1.7, 7.4) (.48, 2.3)Ti–5Al–2.5Sn 296 K 3.5 0.81 19 35 74
(.61, 1.05) (8.7, 38.5) (17.2, 65.2) (21, 187)728 K 4.4 1.17 16.7 24.4 *
(.68, 1.85) (1.96, 46.1) (7.3, 72.9) *728 K 9 0.83 14.1 19.2 *
(.6, 1.09) (7, 26.3) (10.7, 32.2) *Ti–6Al–4V 296 K (Spec. A) 6.3 1.2 13.2 38 27
(.95, 1.5) (8.8, 19.4) (24.2, 57.3) (13, 49)296 K (Spec. B) 8.2 1.5 23.7 32.5 45.5
(1.1, 1.9) (13.4, 39.7) (20.5, 49.7) (15, 133)728 K (Spec. C) 3.8 1.38 20.2 40.2 8.4
(.77, 2.2) (6, 55.7) (12.1, 105) (2.5, 22)728 K (Spec. C) 10.2 1.8 15.5 51.8 15.7
(1.3, 2.4) (9.1, 25.8) (25.3, 93.7) (7.1, 30)728 K (Spec. D) 11.6 2 2.5 35.9 *
(1.1, 3.4) (1.4, 3.9) (10.5, 92.5) *
*Mean CRSS ratios and confidence intervals were not computed for T1 twins in the Ti–5Al–2.5Sn at 728 Kand the Ti–6Al–4V specimen D at 728 K due to a lack of observations.
Philosophical Magazine 723
Dow
nloa
ded
by [
Mic
higa
n St
ate
Uni
vers
ity]
at 0
9:27
11
Mar
ch 2
015
Using this methodology, the mean CRSS ratios and the corresponding 90% confidenceinterval for the four different tensile specimens of Ti–6Al–4V are listed in Table 6 alongwith those for CP Ti, Ti–5Al–2.5Sn and Ti–8Al–1Mo–1V deformed under the sameconditions as Ti–6Al–4V.
The CRSS ratio values in the rest of the discussion refer to the mean CRSS ratios.It is noted that although application of the bootstrap method to the raw experimentaldata provides a robust way to estimate the mean CRSS ratios for various deformationsystem pairs in the CP Ti and the Ti–5Al–2.5Sn, Ti–8Al–1Mo–1V and Ti–6Al–4Valloys, it cannot remove uncertainty in the original observations. Nevertheless, suchuncertainty is quantified using the confidence intervals computed from the sampling dis-tributions. Based on these calculations, the following two comparisons of the differentpairs of CRSS ratios across experiments and deformation systems can be made with atleast 90% confidence:
(1) Increasing temperature resulted in an increase in the mean prismatic-to-basalCRSS ratio in the Ti–6Al–4V alloy at ~10% strain. For Ti–6Al–4V, the meanprismatic-to-basal CRSS ratio increased from 1.5 at 296 K with 8.2% strain to1.8 at 728 K with 10.2% strain.
(2) Under all conditions in CP Ti, the CRSS of prismatic slip is no more than 53%of the CRSS of basal slip, respectively, while in Ti-5Al-2.5Sn and Ti–6Al–4Vthe CRSS of prismatic slip is at least 60 and 77% of the CRSS of basal slip,respectively. This suggests that basal slip is more likely to activate in alloyscontaining high-Al content.
Comparison of the CRSS ratios of the deformation systems at low tensile strains
In this section, the relative activity of the different deformation systems is compared atlow strain (~4%) with respect to alloy composition and deformation temperature. Com-parisons of the mean prismatic/basal CRSS ratios determined at 296 K show that whileprismatic slip is strongly favoured in CP Ti (0.28), prismatic slip becomes less favour-able in the alloys (0.81 for Ti–5Al–2.5Sn and 1.2 for Ti–6Al–4V). The lower slip resis-tance of prismatic slip relative to basal slip is unaffected by temperature for CP Ti(prismatic/basal CRSS ratios of 0.28 and 0.29, respectively). In contrast, for both theTi-5Al-2.5Sn and Ti–6Al–4V alloys, similar analysis suggests that basal slip becomesmore favourable with increasing deformation temperature (from 0.81 to 1.17 forTi–5Al–2.5V, from 1.2 to 1.38 for Ti–6Al–4V). The CRSS of basal slip was even lowerthan prismatic slip for Ti–5Al–2.5Sn, Ti–8Al–1Mo–1V [31] at 728 K, and Ti–6Al–4Vat both 296 and 728 K. These trends agree with earlier observations indicating thatprismatic slip is favoured in unalloyed Ti and that basal activity increases with Aladditions and temperature [7].
The activity of the other deformation systems relative to the activity of basal slip isalso affected by alloying and temperature. With increasing temperature for CP Ti, therelative CRSS of pyramidal <a> and pyramidal <c + a> slip decreases slightly (7.1 and6.3 at 296 K, 5.4 and 4.7 at 728 K, see Table 6). For Ti–5Al–2.5Sn, a similar decreasein the activity of pyramidal <a> and pyramidal <c + a> slip was also observed withincreasing temperature. In contrast, for Ti–6Al–4V, with increasing temperature, the
724 H. Li et al.
Dow
nloa
ded
by [
Mic
higa
n St
ate
Uni
vers
ity]
at 0
9:27
11
Mar
ch 2
015

relative CRSS of pyramidal <a> and pyramidal <c + a> slip increases (13.2 and 38 at296 K, 20.2 and 40.2 at 728 K). Overall, the mean pyramidal/basal CRSS ratio in CPTi (4.7–7.1) is much lower than for Ti–5Al–2.5Sn (16.7–35.5) and Ti–6Al–4V (13.2–40.2), as indicated in Table 6.
The relative activity of twinning also changes with alloying and temperature. ForCP Ti, twinning is an active deformation system at both 296 and 728 K, and the rela-tive activity of twinning is not significantly affected by temperature (1.7 at 296 K and1.8 at 728 K, see Table 6). However, Ti–5Al–2.5Sn exhibits a very high resistance totwinning (74, see Table 6) compared to other deformation systems at 296 K. Further-more, as twinning was not observed in the Ti–5Al–2.5Sn at elevated temperature, noCRSS ratio value was calculated. Twinning was observed in a few grains in Ti–6Al–4V, but the relative CRSS of twinning to basal slip in Ti–6Al–4V was still much higherthan that for CP Ti at both 296 and 728 K. This low twinning activity in both Ti–5Al–2.5Sn and Ti–6Al–4V is consistent with the observations of Williams et al. [7], where itwas reported that twinning can be restricted by the ordering of Al in the α phase andthat twinning can be further suppressed with increasing temperature for Ti–Al alloys. Itis noted that no twinning was observed in Ti-8Al-1Mo-1V at any temperature between296 and 728 K [31].
The present work ignores any influences that the β phase may have on the mechani-cal response of the microstructure and how such influences may affect the deformationresponse of the α phase. As the β phase makes up less than 1% of the microstructure ofthe Ti–5Al–2.5Sn alloy, it may be reasonable to assume that the β phase of the Ti–5Al–2.5Sn alloy does not significantly affect the relationship between the activation of defor-mation in the α phase and the associated CRSSs. For the Ti–8Al–1Mo–1V alloy, the βphase only consisted of 4% of the microstructure [31]. Another justification to ignorethe β phase is that the statistical approach used in the present work does not considerthe geometry of the microstructure. That is, the orientations and mechanical responsesof neighbouring grains are not taken in to account when identifying the activated defor-mation systems in a given grain. This lack of dependence on the local grain environ-ment leads to the potential use of the method outlined here to assess the CRSS ratios ofdifferent phases in complex multiphase materials, if the effects of microstructural detailsaverage out with a sufficiently large population.
Analysis of the effect of strain on the CRSS ratios
The relative activity of the different deformation systems for Ti–6Al–4V, Ti–5Al–2.5Snand CP Ti is also compared for tensile tested samples deformed at strains around 10%,and the corresponding mean CRSS ratios are provided in Table 6. In agreement withprevious study [30], with increasing strain more deformation systems were observed inTi–6Al–4V. Some variation in the calculated ratios for a given set of material/tempera-ture conditions as a function of strain is observed. For example, when deformed at highstrains and high temperature, both the CP Ti and the Ti–5Al–2.5Sn show a decrease inthe CRSS ratios for basal-to-prismatic slip from their lower strain values, decreasingfrom 0.29 to 0.23 and 1.17 to 0.83, respectively. However, Ti–6Al–4V exhibits anincrease in the CRSS ratios of basal to prismatic slip (from 1.38 at 3.8% strain and728 K to 1.8 at 10.2% strain and 728 K). A similar trend was exhibited by Ti–8Al–1Mo–1V [31].
Philosophical Magazine 725
Dow
nloa
ded
by [
Mic
higa
n St
ate
Uni
vers
ity]
at 0
9:27
11
Mar
ch 2
015
In addition to statistical uncertainty, there may be other reasons to expect the ratiosto change as a function of strain. First, it is expected that as the polycrystalline samplesdeform, the individual grains will rotate. The resulting change in texture with deforma-tion has not been accounted for in this methodology, with the texture corrections beingbased only on the texture in the undeformed state. Second, as the strain increases, thestress increases, so some of the lower activity systems may have sufficiently high stres-ses to become more active, and contribute to the deformation system-Schmid factor dis-tributions (representing actual experimentally-observed deformation events). Asdeformation continues, additional deformation on the systems initially observed in thedeformation system-Schmid factor distribution is not quantified as a change in the table,but activation of additional deformation systems will be reflected in the deformationsystem-Schmid factor distribution. Third, while the current analysis assesses the Schmidfactors relative to the global state of stress, the local state of stress varies to somedegree due to the constraints of polycrystalline deformation [36,51–53]. While thesevariations should average out with large data-sets, the biases associated with localdeviations from the global state of stress are complex, and will evolve as the rate ofdeformation in neighbouring grains varies. Finally, it is possible that the changes in theobserved CRSS ratios with strain reflect a real change in materials behaviour in that thework hardening for the different deformation system types is expected to be different[15,52–54], and consequently, the stress necessary to activate these different systemswill vary with strain. If this is in fact the case, the developed CRSS ratio determinationmethod has the potential to assess these differences in the work-hardening behaviour,allowing access to evolving work-hardening parameters critical to crystal plasticitymodels used for anisotropic deformation studies.
Summary and conclusions
In situ tensile and tensile-creep of Ti–6Al–4V at 296 and 728 K were examined usingan EBSD-based slip-trace analysis, showing that the distribution of the deformation sys-tems varied as a function of the testing condition (i.e. temperature and stress). Observa-tions indicated that basal slip was almost as equally active as prismatic slip at 296 K,and for the 728 K tension tests, basal slip was more active than prismatic slip. Twinningwas also an active deformation system in both the 296 and 728 K tension experiments;however, no more than 4% of the total deformation systems observed was twins. Thedeformation behaviour of Ti–6Al–4V was compared to CP Ti Ti–5Al–2.5Sn andTi–8Al–1Mo–1V.
The following conclusions on the deformation behaviour of Ti–6Al–4V can bemade:
(1) With increasing temperature from 296 to 728 K, the YS of Ti–6Al–4Vdecreased from ~810 to ~420 MPa, which represents a decrease by a factor of~2.
(2) Both basal and prismatic slip systems were the primary deformation systemsobserved during the 296 and 728 K tensile tests. When compensated for the tex-ture, the CRSS analysis indicated that the CRSS of basal slip was the lowest inall the deformation systems for all of the tensile tests, while the CRSS of pris-matic slip was slightly higher. This is different from CP Ti, where the CRSS of
726 H. Li et al.
Dow
nloa
ded
by [
Mic
higa
n St
ate
Uni
vers
ity]
at 0
9:27
11
Mar
ch 2
015

prismatic slip was significantly lower than that for basal slip. For both Ti–5Al–2.5Sn and Ti–8Al–1Mo–1V, the CRSS of prismatic slip was lower than that forbasal slip at 298 K but this was reversed at 728 K.
(3) Similar to Ti–5Al–2.5Sn and Ti–8Al–1Mo–1V, twinning was observed to amuch lesser extent in Ti–6Al–4V than CP Ti. This is explained by the presenceof relatively high Al content which suppresses mechanical twin formation.
(4) Compared with the other materials, Ti–6Al–4V exhibited the highest YS at both296 and 728 K. This is mainly because of the solid-solution strengthening andgrain boundary strengthening (relatively fine grain size compared to CP Ti,Ti–5Al–2.5Sn, and Ti–8Al–1Mo–1V).
(5) The mean CRSS ratios of basal, prismatic, pyramidal <a>, pyramidal <c + a>,and T1 twin were 1: 1.2: 13.2: 38: 27, respectively, for the 296 K tensile defor-mation after 6.3% strain and were 1: 1.38: 20.2: 40.2: 8.4, respectively, for the728 K tensile deformation after 3.8% strain.
(6) During creep, grain boundary sliding was a highly active deformation mecha-nism, and no surface slip traces were observed.
AcknowledgementsThe authors are grateful to Professor Darren Mason of Albion College for his assistance in thedevelopment of the CRSS ratio methodology. The authors are grateful to Dr. Christopher Cowen,previously at National Energy Technology Laboratory, Albany, Oregon and currently at UnitedStates Mint, West Point, NY, who provided the alloy used in this study.
Funding
The research was supported by the US Department of Energy, Office of Basic Energy Sciencethrough grant number DE-FG02-09ER46637.
References
[1] C. Leyens and M. Peters, Titanium and titanium alloys, Wiley–VCH GmbH & Co. KGaA,New York, 2003.
[2] R. Boyer, Mater. Sci. Eng. A 213(1–2) (1996) p.103.[3] M.J. Donachie, Titanium – A Technical Guide 2nd ed., ASM International, Materials Park,
OH, 1988.[4] R. Boyer, G. Welsch and E.W. Collings, eds., Materials Properties Handbook: Titanium
Alloys, Materials Park, OHASM International, 1994.[5] F. Bridier, P. Villechaise and J. Mendez, Acta Mater. 53(3) (2005) p.555.[6] L. Wang, Y. Yang, P. Eisenlohr, T.R. Bieler, M.A. Crimp and D.E. Mason, Metal. Mater.
Trans. A 41(2) (2010) p.421.[7] J.C. Williams, R.G. Baggerly and N.E. Paton, Deformation behavior of HCP Ti-Al alloy sin-
gle crystals: Metal. Mater. Trans. A 33(13) (2002) p.837.[8] J. Gong and A.J. Wilkinson, Acta Mater. 57(19) (2009) p.5693.[9] R. Von Mises, Math-Phys. 1 (1913) p.582.[10] J.W. Christian and S. Mahajan, Progr. Mater. Sci. 39(1–2) (1995) p.1.
Philosophical Magazine 727
Dow
nloa
ded
by [
Mic
higa
n St
ate
Uni
vers
ity]
at 0
9:27
11
Mar
ch 2
015

[11] N.E. Paton, R.G. Baggerly and J.C. Williams, 1976, Deformation and Solid SolutionStrengthening of Titanium-Aluminum Single Crystals, DTIC Document.
[12] S. Zaefferer, Mater. Sci. Eng. A 344(1–2) (2003) p.20.[13] X. Wu, S.R. Kalidindi, C. Necker and A.A. Salem, Acta Mater. 55(2) (2007) p.423.[14] A. Poty, J.M. Raulot, H. Xu, J. Bai and C. Schuman, J. App. Phys. 110(1) (2011) p.014905.[15] A.A. Salem, S.R. Kalidindi and S.L. Semiatin, Acta Mater. 53(12) (2005) p.3495.[16] S. Balasubramanian and L. Anand, Acta Mater. 50(1) (2002) p.133.[17] I.P. Jones and W.B. Hutchinson, Acta Metall. 29 (1981) p.951.[18] J.A. Medina Perilla and J. Gil Sevillano, Mater. Sci. Eng. A 201 (1995) p.103.[19] T. Dick and G. Cailletaud, Comput. Mater. Sci. 38(1) (2006) p.113–125.[20] Fundenberger JJ, Philippe MJ, Wagner F, Esling C, Acta Mater. 45 (10) (1997) p. 4041.[21] D. Dunst and H. Mecking, Z. Metallkde 87 (1996) p.498.[22] R.A. Lebensohn and G.R. Canova, Acta Mater. 45(9) (1997) p.3687.[23] T.R. Bieler and S.L. Semiatin, Int. J. Plasticity 18(9) (2002) p.1165.[24] X. Feaugas, P. Pilvin and M. Clavel, Acta Mater. 45(7) (1997) p.2703.[25] K.S. Chan, Metall. Mater. Trans. A 35(11) (2004) p.3409.[26] H. Li, D.E. Mason, T.R. Bieler, C.J. Boehlert and M.A. Crimp, Acta Mater. 61 (2013)
p.7555.[27] C.J. Boehlert, C.J. Cowen, S. Tamirisakandala, D.J. McEldowney and D.B. Miracle, Scr.
Mater. 55 (2006) p.465–468.[28] A.A. Salem, M.G. Glavicic and S.L. Semiatin, Mater. Sci. Eng. A 494(1–2) (2008) p.350.[29] H. Li, T.R. Bieler, C.J. Boehlert and M.A. Crimp, Metall. Mater. Trans. A. 45A (2014)
p. 6053–6066.[30] H. Li, D.E. Mason, Y. Yang, T.R. Bieler, M.A. Crimp and C.J. Boehlert, Philos. Mag. 93
(21) (2013) p.2875–2895.[31] I. Dastidar, In-situ scanning electron microscopy (sem) observations of the tensile and
tensile-creep deformation of Ti-8Al-1mo-1V (wt.%) alloy, Master thesis, Michigan StateUniversity, 2014.
[32] A.J.W. Wagoner Johnson, C.W. Bull, K.S. Kumar and C.L. Briant, Metall. Mater. Trans. A34(2) (2003) p.295.
[33] G.G. Yapici, I. Karaman and Z.P. Luo, Acta Mater. 54(14) (2006) p.3755.[34] D.G. Prakash, R. Ding, R.J. Moat, I. Jones, P.J. Withers, J. Fonseca and M. Preuss, Mater.
Sci. Eng. A 527(21–22) (2010) p.5734.[35] S. Di Iorio, L. Briottet, C. Cayron, E.F. Rauch and D. Guichard, J. Mater. Sci. Technol. 20
(2004) p.15.[36] S. Diiorio, L. Briottet, E Rauch, D Guichard and D. Guichard, Acta Mater. 55(1) (2007)
p.105.[37] M. Knezevic, R.A. Lebensohn, O. Cazacu, B. Revil-Baudard, G. Proust, S.C. Vogel and
M.E. Nixon, Mater. Sci. Eng. A 564 (2013) p.116.[38] W. Tirry, S. Bouvier, N. Benmhenni, W. Hammami, A.M. Habraken, F. Coghe, D. Schryvers
and L. Rabet, Mater. Character. 72 (2012) p.24.[39] S. Bouvier, N. Benmhenni, W. Tirry, F. Gregory, M.E. Nixon, O. Cazacu and L. Rabet,
Mater. Sci. Eng. A 535 (2012) p.12.[40] W. Tirry, M. Nixon, O. Cazacu, F. Coghe and L. Rabet, Scr. Mater. 64 (2011) p.840.[41] A.A. Salem, S.R. Kalidindi and R.D. Doherty, Acta Mater. 51 (2003) p.4225.[42] T. Neeraj, D.H. Hou, G.S. Daehn and M.J. Mills, Acta Mater. 48(6) (2000) p.1225.[43] D.G. Teer and F.B. Salem, Thin Solid Films 45(3) (1977) p.583.[44] D. Buckley and R. Johnson, NASA Tech. Note, 1966, TN-D-3235, Old 47 is gone.[45] Z. Guo, A.P. Miodownik, N. Saunders and J-Ph Schillé, Scr. Mater. 54(12) (2006) p.2175.[46] J.R. Seal, M.A. Crimp, T.R. Bieler and C.J. Boehlert, 2012, Mater. Sci. Eng. A 552 (2012)
p. 61.
728 H. Li et al.
Dow
nloa
ded
by [
Mic
higa
n St
ate
Uni
vers
ity]
at 0
9:27
11
Mar
ch 2
015

[47] A. Lasalmonie and J.L. Strudel, J. Mater. Sci. 21(6) (1986) p.1837.[48] M.G. Zelin, H.S. Yang, R.Z. Valiev and A.K. Mukherjee, Metall. Trans. A 23(11) (1992)
p.3135.[49] A.H. Chokshi, J. Mater. Sci. 25(7) (1990) p.3221.[50] T.G. Langdon, Philos. Mag. 22 (178) (1970) p.689.[51] A. Molinari, G.R. Canova and S. Ahzi, Acta Mater. 35(12) (1987) p.2983.[52] S.R. Kalidindi, A. Bhattacharyya and R.D. Doherty, Proc. Royal Soc. A 460(2047) (2004)
p.1935.[53] S.R. Kalidindi, C.A. Bronkhorst and L. Anand, J. Mech. Phys. Solids 40(3) (1992) p.537.[54] C. Zambaldi, Y. Yang and T.R. Bieler, Raabe D., J. Mater. Res. 27 (2012) p.356.
Philosophical Magazine 729
Dow
nloa
ded
by [
Mic
higa
n St
ate
Uni
vers
ity]
at 0
9:27
11
Mar
ch 2
015