Embed Size (px)
Citation preview

Examination of Health Care Cost Trends and Cost Drivers
Pursuant to G.L. c. 12, § 11NReport for Annual Public Hearing Under G.L. c. 6D, § 8
CO
MM
ON
WEALTH OF MASSACH
USE
TT
S
OFF
ICE
OF THE ATTORNEY GENER
AL
September 18, 2015

Examination of Health Care Cost Trends and Cost Drivers Pursuant to G.L. c. 12, § 11N

Examination of Health Care Cost Trends and Cost Drivers Pursuant to G.L. c. 12, § 11N
Table of ContentsExecutive Summary ....................................................................................................................1
I. Recent Cost Containment Efforts: Progress and Challenges ...................................4A. Consumer Directed Initiatives .......................................................................................................................... 4
B. Provider Oriented Initiatives ........................................................................................................................... 14
II. Continuing Market Dysfunction ...................................................................................... 19A. Continuing Price Variation .............................................................................................................................. 19
B. Payment Differentials and Provider Resources ......................................................................................... 21
C. Payment Differentials and Provider Volume ............................................................................................. 23
D. The Urgency of Addressing Market Dysfunction ..................................................................................... 24
III. Recommendations ............................................................................................................28
Acknowledgements ...............................................................................................................30
Table of Contents

Examination of Health Care Cost Trends and Cost Drivers Pursuant to G.L. c. 12, § 11N
Examination of Health Care Cost Trends and Cost Drivers Pursuant to G.L. c. 12, § 11N
Executive SummaryThis is the Office of the Attorney General’s (“AGO”) fifth report examining health care cost growth in Massachusetts and its impact on consumers. Recognizing that excessive health care costs crowd out other economic needs of Massachusetts residents, the Commonwealth has taken significant steps in the last decade to measure and moderate health care cost growth. These steps have been as diverse as increasing consumer access to information on the cost and quality of health care services, to launching annual cost trend hearings before state health care agencies, including new authority for the AGO to investigate health care cost drivers. Almost six years ago, this office’s inaugural review documented significant dysfunction in how health care is paid for in the Commonwealth. We found wide variation in the prices health insurance companies pay providers for similar services, unexplained by differences in quality, complexity of services, or other common measures of consumer value. We found that increases in these prices negotiated between insurers and providers have been a major reason for escalating health care premiums. And we found that higher priced providers are drawing patient volume from lower priced providers. This further increases costs as care is shifted from less expensive settings to more expensive settings.
Through the leadership of the Legislature, sister agencies, and health care stakeholders, Massachusetts is advancing a range of initiatives to lower health care costs, improve quality, and address market dysfunction. Many of these efforts seek to strengthen effective market operation by improving the information and incentives available to consumers to choose insurance plans and health care providers based on cost and quality. This includes new requirements to provide real time information to consumers on the cost of health care services and to offer incentives like lower premiums or copayments for obtaining care at lower cost, high quality providers. Throughout this report, we characterize these efforts as “consumer directed” or “demand side” initiatives.
Massachusetts has also encouraged providers to deliver care more efficiently. These efforts include new approaches to paying providers, such as global budget arrangements, where providers face financial penalties if care is too costly in comparison to a target “budget” negotiated with insurers. Providers are also experimenting with a range of organizational approaches to improving health care delivery, such as accountable care organizations and patient centered medical homes. We characterize those efforts as “provider oriented” or “supply side” initiatives.
The office’s current examination1 focused on two interrelated goals: we sought to (1) review the performance of recent consumer directed and provider oriented cost containment initiatives and (2) assess whether those initiatives and other developments have ameliorated market dysfunction. We found there has been progress in demand side and supply side
1 This report relies on information obtained through civil investigative demands issued to Massachusetts health insurers and providers pursuant to Mass. Gen. Laws ch. 12C, § 17 (2012). We reviewed detailed information on health care premiums, prices, utilization, and spending and consulted with health care experts, insurers, providers, consumer advocates, and other key stakeholders. To assist in its review, the AGO engaged experts with extensive experience in the Massachusetts health care sector, including experts in accounting and financial analysis, actuarial sciences, clinical quality measurement and evaluation, population health management and insurer-provider contracting.
Executive Summary -1-

Examination of Health Care Cost Trends and Cost Drivers Pursuant to G.L. c. 12, § 11N
-2- Executive Summary
efforts, including expansion of tiered network products and global payment arrangements. At the same time, unwarranted price variation among providers persists. More expensive providers continue to draw greater patient volume, adding to health care costs. Global payments, while having positive effects, have tended to entrench historic payment differentials, and have thus sustained disparities in the resources available for patient care. These trends, coupled with new growth in pharmacy costs and utilization of health care services, point to a likely failure to hold health care spending increases below the 3.6% benchmark the Commonwealth set for 2015. This suggests that additional efforts to address underlying market dysfunction may be warranted.
We suggest that longer-term solutions require continued investment in innovations that strengthen the operation of health care markets. We propose ways to strengthen and expand consumer incentives, particularly by leveraging the critical role of employers in shaping the cost and quality of health care options available to their employees. We also suggest ways to improve existing initiatives to help ameliorate rather than entrench historic disparities. We recognize that more direct regulatory interventions merit consideration as well, and may help set some guideposts for meaningful improvement of continuing market problems. We summarize below our principal findings and set forth recommendations for enhanced interventions, market based as well as regulatory, to address continuing market dysfunction.
Our principal findings:
A. There has been progress in both consumer directed and provider oriented initiatives, but important challenges remain:
1. Consumers are interested in obtaining information on the price of health care services but experience challenges in doing so.
2. Enrollment in tiered insurance products has increased, but the presence of these products has not resulted in an overall shift in patient volume away from higher priced providers. Current approaches appear hampered by inconsistent incentives for consumers to obtain care at higher value providers.
3. Massachusetts has continued to expand its use of global payment arrangements and is a national leader in adoption of these types of alternative payment approaches. However, like fee-for-service payments, global payments continue to vary in ways unexplained by patient health need. This results in widely differing dollars available to care for similar patient populations.
B. Market dysfunction persists, with continued cost and access consequences for consumers:
1. Price variation unexplained by quality persists, contributing to providers having different levels of resources to carry out their mission.
2. Across the state and within specific regions, higher priced providers continue to draw greater patient volume.
3. Projected growth in health care spending underscores the urgency of addressing market dysfunction. Given projected increases in pharmacy costs and utilization

Examination of Health Care Cost Trends and Cost Drivers Pursuant to G.L. c. 12, § 11N
of health care services, to meet the state’s cost growth benchmark, provider price increases will need to be limited. If the distribution of price increases follows historic patterns, provider price disparities will likely persist or worsen.
Our principal recommendations:
A. Simplify and expand demand side efforts:
1. Require clear, easily compared information on the cost and quality of different insurance plans and provider systems for (a) employers at the time an employer determines the health insurance options that will be available to its employees and (b) consumers at the time of plan enrollment and selection of the consumer’s primary care provider system.
2. Simplify and strengthen how tiered networks are designed, such as by tiering affiliated providers together as a system and increasing the difference in consumer cost sharing between tiers to better reflect the actual cost of obtaining care at different systems.
3. Promote consumer access to and understanding of health care cost and billing information.
B. Consider ways to implement supply side incentives and penalties more evenly:
1. Monitor variation in health status adjusted global budgets.
2. Evaluate provider performance under the statewide cost growth benchmark in ways that take into account differences in provider efficiency, such that more efficient providers are given more room to grow under the benchmark than less efficient providers.
C. Monitor and address disparities in the distribution of health care resources:
1. Consider forms of directly regulating the level of variation in provider prices and/or medical spending to reduce disparities in the resources available to care for similar patient populations.
2. Monitor income and health status adjusted medical spending by zip code on an annual basis.
3. Promote the development of population health status metrics that better account for socioeconomic risk factors.
This report does not address all of the efforts underway to improve the Commonwealth’s health care system. Our goal was to focus on those aspects of health care cost growth that relate to the fundamental market dysfunction identified in our inaugural report, to evaluate current efforts to combat that dysfunction, and to encourage continued consideration of these persistent marketplace features as the Commonwealth presses forward with reform efforts. The AGO greatly appreciates the courtesy and cooperation of the market participants who provided information for this examination. We look forward to our continued collective efforts to ensure that affordable, high quality health care is available to all Massachusetts residents.
Executive Summary -3-
Examination of Health Care Cost Trends and Cost Drivers Pursuant to G.L. c. 12, § 11N
I. Recent Cost Containment Efforts: Progress and Challenges
Health care stakeholders in recent years have engaged in a variety of efforts to address rising health care costs, including implementing groundbreaking initiatives found in Chapter 288 of the Acts of 2010 and Chapter 224 of the Acts of 2012. These cost containment efforts include both consumer directed (demand side) and provider oriented (supply side) approaches. Below, we review several prominent examples of each approach to highlight areas of progress and document continuing challenges.
A. Consumer Directed Initiatives
Well-functioning markets are premised on consumer access to sufficient information and incentives to allow them to choose among competing options for services. In health care, employers and individual consumers play important roles in selecting insurance plans, benefit designs, providers, and services. Prior to consumers’ enrollment in specific insurance plans (known as the “point of enrollment”), employers make important decisions regarding the types of plans and scope of benefits that will be available to their employees. From these options, individuals select specific plans and, upon enrollment, usually select a primary care provider (“PCP”).2 At the point when a patient needs care (the “point of service”), his or her PCP serves as an important guide, consulting on decisions like which services to obtain and where to seek care. Most PCPs have some form of affiliation with a broader network of specialists and hospitals with whom they coordinate patient care, and to whom they refer patients when specialty or hospital services are needed. Thus, a consumer’s choice of PCP usually connects the consumer to a broader provider system that can serve as the medical “home” for the consumer.
The point of enrollment, PCP selection, and point of service all represent important opportunities to provide clear, comparable information to employers and consumers on the cost and quality of different insurance plans, providers, and services. To date, demand side initiatives in Massachusetts have not focused strongly on employer and consumer decisions at the point of enrollment and PCP selection. This is a missed opportunity. With improved information, more employers could actively weigh the cost and quality of the insurance options available to their employees, including engaging with insurers to demand more efficient products. This would benefit businesses as well as consumers, both of which are burdened by rising health insurance premiums.
Similarly, when selecting PCPs, many consumers (whether or not they are aware) are opting into an entire system of care, and would benefit from clear, comparable information on the cost and quality of their PCP’s affiliated provider system before making their initial selection. As documented in our earlier reports, there are significant differences in the cost of care
2 Reports indicate that about 90% of adult Massachusetts residents identify as having a “personal health provider.” Div. Of Health Care Fin. & Policy, Mass. Exec. Office Of Health & Human Servs., Health Care In Massachusetts: Key Indicators, at 18 (Nov. 2010), available at http://archives.lib.state.ma.us/bitstream/handle/2452/69933/ocn232606916-2010-11.pdf?sequence=1.
-4- I. Recent Cost Containment Efforts
Examination of Health Care Cost Trends and Cost Drivers Pursuant to G.L. c. 12, § 11N
I. Recent Cost Containment Efforts -5-
associated with different provider systems, which can affect consumers’ out-of-pocket costs at the point of service.3 Additionally, from the perspective of a well-functioning market, consumers who choose to affiliate with lower cost, high quality systems should be financially rewarded for that choice in the form of lower premiums or other reduced out-of-pocket costs. Massachusetts should prioritize making clear, comparable metrics of cost and quality widely available at the point of enrollment to support the development of stronger financial incentives for consumers to obtain care at more efficient providers.
Below, we examine two demand side initiatives4 found in Chapter 224 and Chapter 288, both of which focus on incentives at the point of service. The two initiatives are: (1) Chapter 224 requirements that insurers and providers inform consumers about the costs associated with different health care services; and (2) Chapter 288’s focus on tiered insurance products, which reward consumers with lower copayments for obtaining care at lower cost, high quality providers. We found that consumers are interested in obtaining information about the costs associated with health care services, but, at times, experience challenges in doing so. We also found that enrollment in tiered insurance products has increased, but their effectiveness appears hampered by inconsistent incentives for obtaining care at higher value providers.
1. Consumers are interested in obtaining information on the price of health care services but experience challenges in doing so.
Chapter 224 requires insurers and providers to make certain information on health care prices available to consumers upon request. Chapter 224 focuses on the “prices” that are relevant to consumers at the point of service. These include (1) the out-of-pocket costs the consumer is directly responsible for (e.g., copayments, coinsurance); (2) the allowed amount negotiated by insurers and providers; and, as applicable, (3) the provider’s list “charges” for its services. To provide this price information, Chapter 224 requires that insurers maintain a website and toll-free telephone number. 5 Providers, including hospitals and physician groups, must also be able to supply consumers with information on estimated allowed amounts or charges and assist consumers in obtaining information on their cost share for a proposed service. 6
Massachusetts consumers are beginning to show an interest in obtaining price information, particularly information on their potential out-of-pocket expenses. In written testimony for the state’s 2014 Cost Trends Hearing, insurers, hospitals, and physician groups reported on the volume of requests they received from consumers
3 Office of Att’y Gen., Examination of Health Care Costs Trends & Cost Drivers Pursuant to G.L. C. 6D, § 8: Report for Annual Public Hearing, at 22-24 (Apr. 2013) [hereinafter AGO 2013 Report], available at http://www.mass.gov/ago/docs/healthcare/2013-hcctd.pdf; Office of Att’y Gen., Examination of Health Care Costs Trends & Cost Drivers Pursuant to G.l. C. 118G, § 6 ½ (b): Report for Annual Public Hearing, at 20-21 (June 2011) [hereinafter AGO 2011 report], available at http://www.mass.gov/ago/docs/healthcare/2011-hcctd.pdf.
4 For additional discussion of demand side incentives, including reference pricing and high deductible insurance products, see Health Policy Comm’n, Mass., 2014 Cost Trends Report, at 62 [hereinafter 2014 Cost Trends Report], available at http://www.mass.gov/anf/budget-taxes-and-procurement/oversight-agencies/health-policy-commission/2014-cost-trends-report.pdf.
5 Mass. Gen. Laws ch. 176O, § 23 (2014).6 MASS. GEN. LAWS ch. 111, § 228 (2014).

Examination of Health Care Cost Trends and Cost Drivers Pursuant to G.L. c. 12, § 11N
for price information. The three largest commercial insurers in Massachusetts7 reported that in the first nine months of 2014, they collectively received 2,417 inquiries from Massachusetts consumers for estimates of allowed amounts, charges, and/or member cost sharing expenses.8 One large national insurer that has had a web-based cost estimator tool in place since 2010 reported that it responded to 10,856 cost inquiries from Massachusetts consumers in that same time frame.9 Although many hospitals and physician groups did not or reportedly were not able to track the number of consumer price inquiries received, those that did collectively reported receiving 9,392 inquiries.10 The testimony of these stakeholders coupled with recent Massachusetts reports11 suggest consumers are interested in learning about the price of their health care, but are only beginning to utilize the transparency tools mandated under Chapter 224.
Recent reports shed light on challenges consumers may experience in seeking to obtain price information directly from their providers. In two reviews of hospitals and physicians, respectively, the Pioneer Institute found that while certain types of specialty physician groups were able to quickly and completely respond to requests for price information, most physicians and hospitals were not able to do so. 12 The reviews also suggest that most physicians and hospitals do not have standardized procedures for responding to such requests, and are sometimes unaware of their statutory obligations.13 This is consistent with written testimony for the 2014 Cost Trends Hearing, in which two providers reported directing consumers to their insurers
7 Throughout this report, we refer to the three largest commercial insurers in Massachusetts, Blue Cross Blue Shield of Massachusetts (“BCBS”), Harvard Pilgrim Health Care (“HPHC”), and Tufts Health Plan (“THP”), as the three “major” Massachusetts insurers.
8 Health Policy Comm’n, Mass Exec. Office for Admin. & Finance, 2014 Health Care Cost Trends Hearing, Pre-Filed Testimony [hereinafter HPC Pre-Filed Testimony]: Blue Cross Blue Shield (2014), available at http://www.mass.gov/anf/budget-taxes-and-procurement/oversight-agencies/health-policy-commission/annual-cost-trends-hearing/2014/testimony/2014-pre-filed-testimony-bcbsma-exhibits-and-questions.pdf; HPC Pre-Filed Testimony: Harvard Pilgrim (Sept. 2014), available at http://www.mass.gov/anf/budget-taxes-and-procurement/oversight-agencies/health-policy-commission/annual-cost-trends-hearing/2014/testimony/2014-pre-filed-testimony-harvard-pilgrim-health-care-exhibits-and-questions.pdf; HPC Pre-Filed Testimony: Tufts Health Plan (Sept. 2014), available at http://www.mass.gov/anf/budget-taxes-and-procurement/oversight-agencies/health-policy-commission/annual-cost-trends-hearing/2014/testimony/2014-pre-filed-testimony-tufts-health-plan-exhibits-and-questions.pdf.
9 HPC Pre-Filed Testimony: AETNA (2014), available at http://www.mass.gov/anf/budget-taxes-and-procurement/oversight-agencies/health-policy-commission/annual-cost-trends-hearing/2014/testimony/2014-pre-filed-testimony-aetna-exhibits-and-questions.pdf.
10 See HPC Pre-Filed Testimony (hospitals and provider organizations), available at http://www.mass.gov/anf/budget-taxes-and-procurement/oversight-agencies/health-policy-commission/annual-cost-trends-hearing/2014/testimony/.
11 See, e.g., Mass Insight Global Partnerships, Poll: MA Residents Perceive Healthcare Costs to be Less Burdensome; Few Consumers Access New Healthcare Data Sources (June 2014), available at http://massinsight.com/wp-content/uploads/2014/06/CCI-Healthcare-2014_Final.pdf (surveying 450 Massachusetts residents in the spring of 2014 and finding that 87% of respondents felt it was important to have information about health care costs).
12 Pioneer Institute, Mass Hospitals Weak on Price Transparency, at 2 (June 2015) [hereinafter Mass Hospitals], available at http://pioneerinstitute.org/download/mass-hospitals-weak-on-price-transparency/; Pioneer Institute, Bay State Specialists and Dentists Get Mixed Reviews on Price Transparency, at 11 (Aug. 2015) [hereinafter Bay State Specialists], available at http://pioneerinstitute.org/download/bay-state-specialists-and-dentists-get-mixed-reviews-on-price-transparency. Pioneer Institute suggested that dentists and ophthalmologists were the most transparent with price information, which may be explained by historic limitations on dental and eye care benefits. As a result, these provider types may be more used to providing price information to self-pay patients. Bay State Specialists, at 7-8.
13 Mass Hospitals, supra note 12, at 2; Bay State Specialists, supra note 12, at 11.
-6- I. Recent Cost Containment Efforts
Examination of Health Care Cost Trends and Cost Drivers Pursuant to G.L. c. 12, § 11N
I. Recent Cost Containment Efforts -7-
for price information instead of providing the information directly.14 In terms of insurer transparency, insurers have provided more consistent access to price information through their web-based transparency tools, though in some cases improvements are needed to meet the goals of Chapter 224.15 For example, a recent review of insurers’ web-based tools by Health Care For All identified limitations such as lack of access to information on estimated out-of-pocket costs by procedure for all consumers.16
The Commonwealth has been moving toward health care price transparency for consumers since as early as 2008.17 Chapter 224 requires insurers and providers to develop new administrative functions and web-based tools to enable consumers to access relevant price information at the point of service. Although there have been advances in the development of these tools, more work is needed to address limitations in accessing relevant price information, and to make the information itself clearer and more useful to consumers.
2. Tiered network products hold promise, but current approaches are weakened by mixed incentives for consumers to obtain care at higher value providers.
In this section, we examine another demand side initiative: insurance products that reward consumers with lower copayments and/or coinsurance for obtaining care at lower cost, high quality providers (called “better value” or “higher value” providers). These products classify providers into “tiers” based on their cost and quality, and reward consumers with lower out-of-pocket costs when they obtain care at higher value providers. We found that membership in tiered products has grown, but the presence of these products has not resulted in an overall shift in patient volume away from hospitals that insurers have identified as lower value. Current approaches to tiering appear hampered by inconsistent incentives for consumers to obtain care at higher value providers. We close by offering some thoughts on how clearer and stronger incentives might increase the effectiveness of these products in improving market function.
14 HPC Pre-Filed Testimony: Acton Medical Associates, (Sept. 2013), available at http://www.mass.gov/anf/docs/hpc/acton-medical-written-testimony.pdf; HPC Pre-Filed Testimony: Central MA Independent Physicians Association (Sept. 2013), available at http://www.mass.gov/anf/docs/hpc/hcp-answers-cost-trend-final-9-27-13.pdf.
15 C.f. Catalyst for Payment Reform, 2015 Report Card on State Price Transparency Laws, at 2 (July 2015), available at http://www.hci3.org/sites/default/files/files/2015_Report_PriceTransLaws_06.pdf (suggesting that a stronger approach would be for Massachusetts to require a uniform price information website, and downgrading Massachusetts’s grade for price transparency to an “F” primarily due to moving away from a previously mandated uniform public website).
16 Health Care for All, Consumer Cost Transparency Report Card, at 1 (July 2015), available at https://www.hcfama.org/sites/default/files/consumer_cost_estimation_report_card.pdf.
17 In 2008 the Commonwealth introduced a price transparency website called “MyHealthCareOptions” that was a first step towards making price information available to consumers. This website made the median and range in price and associated quality information for select inpatient and outpatient hospital services available to consumers. See 2008 Mass. Acts 305 § 3.

Examination of Health Care Cost Trends and Cost Drivers Pursuant to G.L. c. 12, § 11N
a. Membership in tiered network products has grown, about half of which is GIC membership.
Chapter 288 required an expansion in the availability of “value based” products like tiered network products for certain segments of the insurance market, and established minimum premium discounts for these products (initially, a minimum 12% discount compared to equivalent non-tiered products, later increased to a 14% discount). In response to this requirement, the major insurers, each of whom had offered tiered products before 2010, brought new tiered options to the market. Consistent with our 2013 Report, which reviewed data through mid-2012, we show below how there has been continued growth in the number of enrollees in tiered network products in 2013. Across the three major insurers, about half of the members in tiered products in 2013 were government employees insured through the Group Insurance Commission (“GIC”), which administers the Commonwealth’s self-insured health benefit plan.
Notes:1. BCBS data reflect enrollment in Blue Options and Hospital Choice Cost Sharing.2. HPHC data reflect enrollment in Tiered Choice Net, GIC Independence, GIC Primary
Choice (limited and tiered network) and Hospital Prefer to the extent the product was in place in a given year (e.g., HPHC introduced Hospital Prefer in 2012).
3. THP data reflect enrollment in Your Choice, GIC Navigator and GIC Spirit (limited and tiered network).
-8- I. Recent Cost Containment Efforts

Examination of Health Care Cost Trends and Cost Drivers Pursuant to G.L. c. 12, § 11N
I. Recent Cost Containment Efforts -9-
b. For one major insurer, inpatient discharges indicate modest movement toward hospitals identified as better value; but for much of the commercial market, hospitals identified as lower value have maintained or increased market share.
In addition to tracking the extent of consumer enrollment in tiered network products, we assessed their impact in steering consumers to higher value providers. We considered two questions: (1) whether consumers in tiered network products have shifted from seeking care at lower value providers to better value providers, and (2) whether the availability of tiered network products has resulted in a market where overall patient volume is shifting toward better value providers.
On the first question, a recent study of members in BCBS’s tiered products yielded some promising findings. The study found that members enrolled in tiered products were associated with higher use of better value hospitals compared to members enrolled in non-tiered products.18 These findings are broadly consistent with a 2012 study conducted directly by BCBS and discussed in our 2013 Report. That study also observed an increase in the use of better value providers for members in tiered products compared to members in non-tiered products. The study estimated that the savings from tiered members’ increased use of better value providers resulted in 0.5% to 1% in premium savings over the 30-month study period.19
We also examined whether the availability of tiered network products has resulted in overall shifts in patient volume away from lower value providers. In considering this second question, we focused on inpatient services. This is largely because some of the tiered products in Massachusetts with the most significant membership only tier inpatient services, and not hospital outpatient services. As tiered products evolve, and better data become available for other service categories, it will be equally important to examine trends in outpatient and physician services, especially as patient care increasingly moves to outpatient settings and inpatient volume declines.20
The chart below analyzes inpatient discharges for all commercial members (tiered and non-tiered) from 2009 to 2014. It groups hospitals into two or three tiers as defined by the insurer. It then displays the share of inpatient discharges for each group, or tier, of hospitals. The red line represents the share of discharges over time at those hospitals identified by the insurer as being lower value. The blue line represents the share of discharges for hospitals identified by the insurers as better value, and the green line represents the share of discharges at hospitals identified as best value.
18 Matthew B. Frank et al., The Impact of a Tiered Network on Hospital Choice, Health Servs. Research, at 11-12 (2015). The study addressed potential self-selection bias in three ways: (1) though a longitudinal analysis where tier definitions changed over time; (2) emphasizing employer (and not consumer) choice of health insurance plan; and (3) normalizing the probability of a tiered network member being enrolled in a tiered network group through a weight.
19 AGO 2013 Report, supra note 3, at 41.20 See Ctr. for Health Info. & Analysis, Massachusetts Hospital Profiles, Industry Overview, at 2 (Jan. 2015), available
at http://www.chiamass.gov/assets/docs/r/hospital-profiles/2013/hospprofileindustryoverview.pdf.

Examination of Health Care Cost Trends and Cost Drivers Pursuant to G.L. c. 12, § 11N
-10- I. Recent Cost Containment Efforts
Notes:1. Tiering based on 2014 tiering for each insurer’s tiered network product with the most
membership as of December 2013. 2. BCBS tiering reflects tiering for Hospital Choice Cost Sharing, which only has two tiers.3. HPHC tiering reflects tiering for GIC Independence.4. THP tiering reflects tiering for GIC Navigator.5. Non-tiered hospitals were not included in this analysis.6. Discharges exclude normal newborns.
This chart shows that for HPHC, there was modest overall movement away from hospitals identified as lower value (represented by the red line), principally from 2009 to 2011. For BCBS and THP, the share of discharges at lower value hospitals either remained the same, or increased slightly from 2009 to 2014. These findings raise important questions for further review. For example, given evidence that tiered products can shift member utilization toward higher value providers, what dynamics are at play across the broader market such that lower value providers are able to maintain their overall market share? Also, recognizing that tiered network membership continues to account for a minority of each major insurer’s total membership (13% to 28% of total membership in 2013, depending on the insurer), are there steps we can take to improve the effectiveness of these products? In this next section, we turn to this latter question, suggesting ways in which the current design of these products might be simplified and strengthened.
Examination of Health Care Cost Trends and Cost Drivers Pursuant to G.L. c. 12, § 11N
I. Recent Cost Containment Efforts -11-
c. Inconsistent tiering methodologies result in mixed consumer incentives to obtain care at higher value providers.
This section examines the design of tiered network products to assess whether insurers, employers, and other stakeholders can improve their effectiveness. The design of tiered products includes three main elements: (1) the scope of services and providers tiered, (2) the size and type of cost sharing differentials across tiers (e.g. how much copayments vary by tier, and whether premiums vary), and (3) the methodology used to tier providers (i.e., what metrics are used and how providers are categorized). The design of each of these elements can influence the accessibility and effectiveness of tiered products.
Regarding the scope of services tiered, some tiered products include cost sharing differentials for physician services while others do not. Some tier inpatient stays, outpatient services, and/or high tech imaging, while others do not. Cost sharing differentials also vary, but are generally triggered at the point of service, and can range from ten dollars to over a thousand dollars. It is an open question whether the size and timing of these differentials, coupled with potentially fragmented approaches to which services are or are not subject to tiering, are clear and compelling enough to persuade consumers to consistently choose better value providers.
Indeed, such a fragmented approach to tiering runs the risk of confusing consumers and diffusing the product’s effectiveness. As discussed above, most consumers do not navigate the health care system on their own. Many consult with experts like their PCPs on what services to obtain and where to seek care, and most PCPs have some affiliation with a broader network of providers with which they coordinate patient care and to which they refer patients for specialty or hospital services. Where there is variation in the efficiency of different provider types within the same system, it may be unrealistic to expect consumers to seek care outside their “home” system, especially if their actions contradict their PCP’s recommendation. It is even more unrealistic to expect consumers to do so at the point of service (when they are in need of medical care), which is when current tiering approaches often rely on consumers to make these detailed cost and quality assessments.
Tiering hospitals and physicians at the ACO level, based on overall system efficiency, may be simpler (and therefore more effective) for the consumer than tiering individual PCPs, specialists, physician groups, and/or hospitals. Tiering ACOs would also move decision making to an earlier, less sensitive point in time – the point of enrollment or the point of PCP selection. This would allow stronger cost sharing differentials to be explored, such as applying different premiums for consumers in tiered network products based on whether they select a more efficient or less efficient system for their care. Finally, and perhaps most importantly, instead of expecting consumers to assess the individual efficiency of specific provider types over multiple points of service, tiering at the system level
Examination of Health Care Cost Trends and Cost Drivers Pursuant to G.L. c. 12, § 11N
-12- I. Recent Cost Containment Efforts
would simplify the cost and quality calculus to once a year and focus only on the PCP/system-level affiliation decision that consumers make. Such approaches would require strong safeguards, like network adequacy, but would also have the benefit of potentially catalyzing a range of secondary market decisions, such as how desirable it becomes to affiliate with certain providers because of their efficient performance.
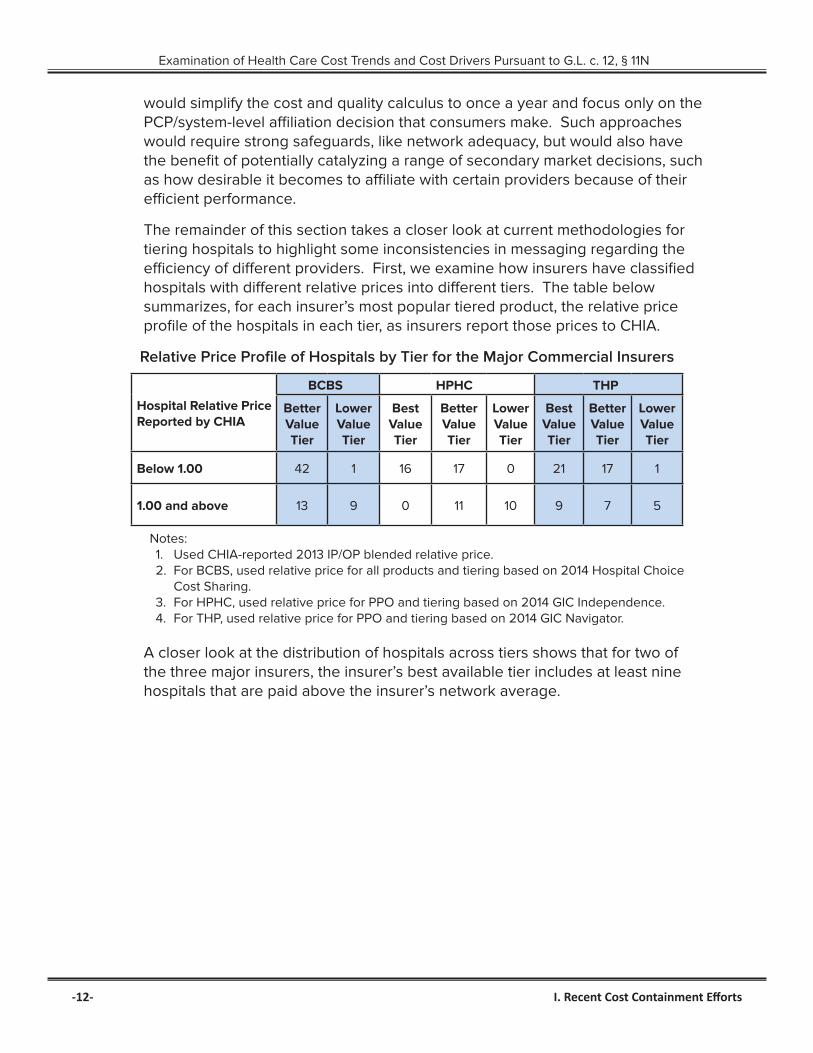
The remainder of this section takes a closer look at current methodologies for tiering hospitals to highlight some inconsistencies in messaging regarding the efficiency of different providers. First, we examine how insurers have classified hospitals with different relative prices into different tiers. The table below summarizes, for each insurer’s most popular tiered product, the relative price profile of the hospitals in each tier, as insurers report those prices to CHIA.
Relative Price Profile of Hospitals by Tier for the Major Commercial Insurers
Hospital Relative Price Reported by CHIA
BCBS HPHC THP
Better Value Tier
Lower Value Tier
Best Value Tier
Better Value Tier
Lower Value Tier
Best Value Tier
Better Value Tier
Lower Value Tier
Below 1.00 42 1 16 17 0 21 17 1
1.00 and above 13 9 0 11 10 9 7 5
Notes:1. Used CHIA-reported 2013 IP/OP blended relative price.2. For BCBS, used relative price for all products and tiering based on 2014 Hospital Choice
Cost Sharing.3. For HPHC, used relative price for PPO and tiering based on 2014 GIC Independence.4. For THP, used relative price for PPO and tiering based on 2014 GIC Navigator.
A closer look at the distribution of hospitals across tiers shows that for two of the three major insurers, the insurer’s best available tier includes at least nine hospitals that are paid above the insurer’s network average.

Examination of Health Care Cost Trends and Cost Drivers Pursuant to G.L. c. 12, § 11N
I. Recent Cost Containment Efforts -13-
The inclusion of these higher priced hospitals in the insurer’s best available tier is not explained by quality.21 Nor is the classification of these higher priced hospitals fully explained by geography. Although some of the higher priced hospitals in the insurers’ best available tiers are geographically isolated, most are not.
For at least one insurer, one factor that likely explains the classification of some of these hospitals in the insurer’s best available tier is differences between the price measures the insurer reports to CHIA and the price measures the insurer uses to tier hospitals. This seems potentially in tension with aspects of Chapter 288. That law requires insurers, in offering a tiered product in the merged market, to tier providers based on standardized and transparent cost and quality measures. Massachusetts stakeholders have sought to develop centralized transparency in provider prices, total medical expenses, and quality performance through standardized measures reported to CHIA. Insurers’ use of non-transparent approaches that vary from insurer to insurer results in a confusing landscape for consumers, which ultimately weakens the operation of these tiered products.
21 For all three major insurers, quality is a pass or fail element of the tiering methodology and no weight is given to the overall quality of a provider once it passes the initial threshold. Almost all hospitals, higher and lower priced, passed the quality test and were “eligible” to be included in the best available tier.

Examination of Health Care Cost Trends and Cost Drivers Pursuant to G.L. c. 12, § 11N
B. Provider Oriented Initiatives
Provider oriented (supply side) initiatives include a range of organizational approaches to improving health care delivery, such as accountable care organizations and patient centered medical homes, which seek to improve how providers across the care continuum come together to support the care of patients over time, across specialties, and across sites of care. Examples of how Chapter 224 encourages these types of efforts include new provider certification programs22 and preferential contracting for certified providers with state funded insurance programs (e.g., MassHealth, GIC).23 Other provider oriented initiatives focus on changing the way providers are paid for health care services, moving away from strictly fee-for-service payments to value based payments (or alternative payment methodologies) that seek to incent high quality, efficient care. This section examines the implementation of global payment arrangements in Massachusetts, the most common form of alternative payment arrangement in the state.
1. Adoption of global payment arrangements by commercial insurers has increased.
Massachusetts is a national leader in the adoption of alternative payment approaches. According to CHIA, from 2012 to 2014, the proportion of commercial members whose care was managed under an alternative payment arrangement increased from 32.8% to 37.9%.24 In Massachusetts, global payments are the most common form of alternative payment arrangement. In 2014, 98% of the commercial members whose care was managed under some form of alternative payment arrangement were managed under global payment contracts, including contracts with downside risk as well as those with upside risk alone.25 For some insurers, about half of their providers in global payment contracts are subject only to upside, rather than material downside risk. There has been positive evidence in this state that these types of payment arrangements can help shift patient care to lower cost providers and care settings.26
22 Mass. Gen. Laws ch. 6D, §§14, 15 (2014) (certification of patient centered medical homes and accountable care organizations, respectively).
23 Under § 268 of Chapter 224 of the Acts of 2012, to the extent any Commonwealth-funded insurance program determines that ACOs offer cost-effective and high quality opportunities, these programs “shall prioritize provider organizations which have been certified by the [HPC] as ACOs, and designated as Model ACOs, for the delivery of publicly funded health services, provided that such ACOs, to the extent possible, assure the continuity of patient care.”
24 See Ctr. for Health Info. & Analysis, Performance of the Massachusetts Health Care System Annual Report September 2015, at 21 (Sept. 2015) [hereinafter 2015 CHIA Annual Report] available at http://www.chiamass.gov/assets/2015-annual-report/2015-Annual-Report.pdf; Ctr. For Health Info. & Analysis, Performance Of The Massachusetts Health Care System Series: Adoption of Alternative Payment Methods in Massachusetts, 2012-2013, at 2 (Jan. 2015), available at http://www.chiamass.gov/assets/2015-annual-report/2015-Annual-Report.pdf.
25 2015 CHIA Annual Report at 21, supra note 24.26 See Zirui Song et al., The ‘Alternative Quality Contract,’ Based on a Global Budget, Lowered Medical Spending and
Improved Quality, Health Affairs, (July 2012) (finding lower claims expenditures among some AQC provider groups due in part to services shifting to facilities with lower fees).
-14- I. Recent Cost Containment Efforts

Examination of Health Care Cost Trends and Cost Drivers Pursuant to G.L. c. 12, § 11N
2. Global HMO risk budgets continue to vary in ways unexplained by patient need.
A continuing challenge in the implementation of global payments is the manner in which these payment arrangements have maintained historic differentials in provider reimbursement. Insurers and providers have negotiated global budgets largely based on providers’ historic spending levels, which vary in ways unexplained by patient health needs.27 This variation in negotiated budgets results in uneven incentives for providers to deliver efficient care.
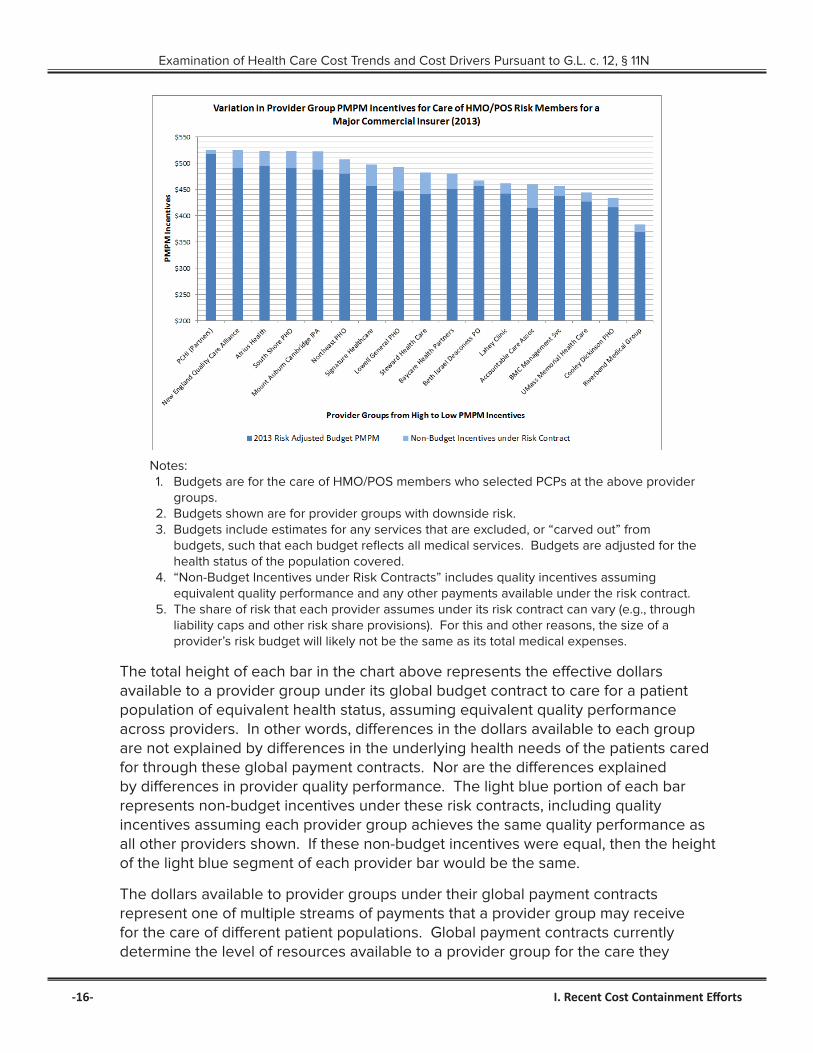
There have been important improvements in the design of global budgets – for example, in the implementation of incentives rewarding providers for quality performance.28 Notwithstanding these improvements, the dollars available under global budget contracts continue to vary significantly from provider group to provider group. This includes variation in the size of the quality incentives negotiated for equivalent quality performance. The chart below provides an example of variation in global budgets for one major Massachusetts insurer, and is consistent with our finding that variation in budgets persists for all three major Massachusetts insurers.29
27 Under a global payment arrangement, the insurer and provider negotiate a “global budget” for the care of members in the provider’s risk contract (generally HMO and POS members who have selected a PCP at the provider organization). The global budget is a targeted maximum amount the insurer will pay for the cost of all of the care these members receive in a given year (including the cost of care the members receive from other providers). Throughout the year, the insurer pays the provider on a fee-for-service basis for the services it directly provides to its risk members. At the end of the year, the insurer totals all of the fee-for-service payments it made to the risk provider and other providers for the care of these members to determine the total annual cost of care for these members. If the total cost of care is less than the negotiated global budget, the provider may “earn” a surplus payment from the insurer. If the total cost of care exceeds the budget, the provider may owe a deficit payment to the insurer. For more information on global risk arrangements, see AGO 2013 Report, supra note 3, at 47.
28 For example, BCBS has moved away from paying providers for quality performance based on a percent of the provider’s budget, which results in differential payouts for equivalent performance based on the size of the provider’s underlying budget.
29 To compare the effective size of provider budgets, we reviewed global risk contracts, annual settlement reports, standardized health status scores that reflect differences in the demographics and sickness of each provider’s risk population, the value of medical services excluded from global budgets, quality incentives, and any other payments available under risk contracts. As described more fully in our 2013 Report, it is important to monitor trends in health status and adjust for differences in health status when comparing provider performance. See AGO 2013 Report, supra note 3, at 21. As further discussed in that report, variations in health status scores may be shaped by many factors, such as geography and local demographics. Health status measurement tools are also not completely accurate, and certain factors that they exclude may impact health care costs. See infra at page 18. It is important to continue to develop health status adjustment tools that help us better understand the interplay of health status and population care management, as well as identify any undesired incentives for providers to manage budgets by avoiding higher risk, vulnerable populations.
I. Recent Cost Containment Efforts -15-
Examination of Health Care Cost Trends and Cost Drivers Pursuant to G.L. c. 12, § 11N
Notes:1. Budgets are for the care of HMO/POS members who selected PCPs at the above provider
groups.2. Budgets shown are for provider groups with downside risk.3. Budgets include estimates for any services that are excluded, or “carved out” from
budgets, such that each budget reflects all medical services. Budgets are adjusted for the health status of the population covered.
4. “Non-Budget Incentives under Risk Contracts” includes quality incentives assuming equivalent quality performance and any other payments available under the risk contract.
5. The share of risk that each provider assumes under its risk contract can vary (e.g., through liability caps and other risk share provisions). For this and other reasons, the size of a provider’s risk budget will likely not be the same as its total medical expenses.
The total height of each bar in the chart above represents the effective dollars available to a provider group under its global budget contract to care for a patient population of equivalent health status, assuming equivalent quality performance across providers. In other words, differences in the dollars available to each group are not explained by differences in the underlying health needs of the patients cared for through these global payment contracts. Nor are the differences explained by differences in provider quality performance. The light blue portion of each bar represents non-budget incentives under these risk contracts, including quality incentives assuming each provider group achieves the same quality performance as all other providers shown. If these non-budget incentives were equal, then the height of the light blue segment of each provider bar would be the same.
The dollars available to provider groups under their global payment contracts represent one of multiple streams of payments that a provider group may receive for the care of different patient populations. Global payment contracts currently determine the level of resources available to a provider group for the care they
-16- I. Recent Cost Containment Efforts

Examination of Health Care Cost Trends and Cost Drivers Pursuant to G.L. c. 12, § 11N
provide to HMO and POS patients with PCPs affiliated with the provider group. Payment rates for these HMO/POS patients underlie these global payment contracts. For other types of patients that the provider group treats – such as patients enrolled in PPO insurance products, and patients enrolled in HMO/POS insurance products but whose PCPs are affiliated with a different provider group – the provider often receives a different payment rate. Providers may also receive different payment rates for fully-insured and self-insured patients. If our goal were to evaluate how well-paid one provider group is compared to another, it would be important to synthesize all of these payment streams and payment rates – HMO, POS, and PPO, as well as fully-insured and self-insured – and compare an “all-in” or “total” rate of reimbursement. In our 2013 report, we presented information on 2010 HMO/POS rates and PPO rates separately, to provide a sense of how widely these rates can vary for the same provider group.30 Consistent with those findings, in comparing 2012 information on HMO versus PPO rates we found that among the five provider groups shown in the above chart with the highest effective HMO/POS budgets, two (Mount Auburn Cambridge IPA and New England Quality Care Alliance) were not among the five provider groups with the highest PPO rates for the same insurer.
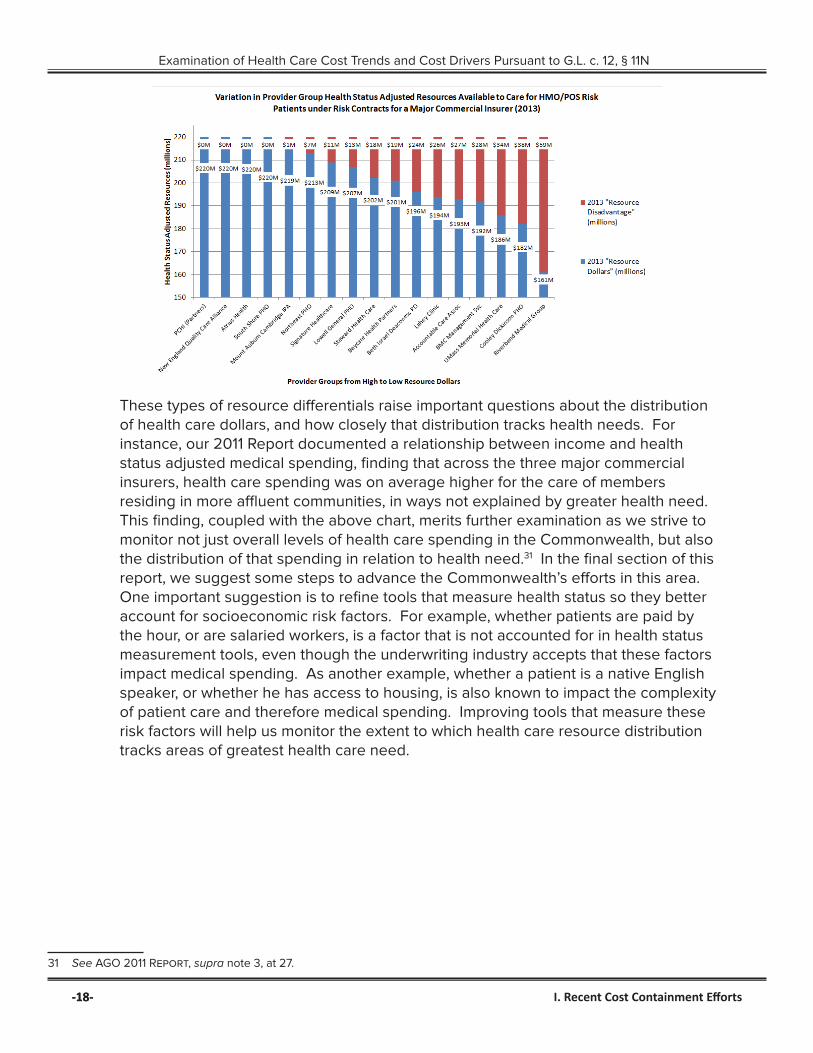
3. Variations in HMO risk budgets result in widely different dollars available to care for similar patient populations.
Variation in HMO/POS budgets translates into different levels of resources available for the care of similar patient populations. The following chart shows differences in the effective resources available for the care of equivalent HMO populations. In determining effective resources, we took into account all dollars available under the applicable risk contracts. The resources shown reflect those available to each provider group to manage the care of 35,000 patients of comparable health, assuming each of those provider groups all performed at the same level of quality. In other words, the variation in resource levels cannot be explained by differences in quality performance across the provider groups, or differences in the underlying health needs of the patient populations. Instead, for 35,000 patients with the same health needs, the provider group at the far right of the chart would simply have $59 million less to care for those patients than the provider group on the far left of the chart.
As above, this chart serves as an exemplar of findings that are consistent across the three major insurers. Also as discussed above, this chart displays resource differentials in the care of HMO/POS risk members. As provider groups often receive different levels of payments to care for their PPO and HMO/POS patients, the below exemplar does not portray how well resourced one provider group is compared to another overall.
30 AGO 2013 Report, supra note 3, at 28-31.
I. Recent Cost Containment Efforts -17-
Examination of Health Care Cost Trends and Cost Drivers Pursuant to G.L. c. 12, § 11N
-18-
These types of resource differentials raise important questions about the distribution of health care dollars, and how closely that distribution tracks health needs. For instance, our 2011 Report documented a relationship between income and health status adjusted medical spending, finding that across the three major commercial insurers, health care spending was on average higher for the care of members residing in more affluent communities, in ways not explained by greater health need. This finding, coupled with the above chart, merits further examination as we strive to monitor not just overall levels of health care spending in the Commonwealth, but also the distribution of that spending in relation to health need.31 In the final section of this report, we suggest some steps to advance the Commonwealth’s efforts in this area. One important suggestion is to refine tools that measure health status so they better account for socioeconomic risk factors. For example, whether patients are paid by the hour, or are salaried workers, is a factor that is not accounted for in health status measurement tools, even though the underwriting industry accepts that these factors impact medical spending. As another example, whether a patient is a native English speaker, or whether he has access to housing, is also known to impact the complexity of patient care and therefore medical spending. Improving tools that measure these risk factors will help us monitor the extent to which health care resource distribution tracks areas of greatest health care need.
31 See AGO 2011 Report, supra note 3, at 27.
-18- I. Recent Cost Containment Efforts

Examination of Health Care Cost Trends and Cost Drivers Pursuant to G.L. c. 12, § 11N
II. Continuing Market DysfunctionIn evaluating progress and identifying areas of continuing challenge for health care cost containment, an equally important focus of this report is to assess the extent to which the fundamentals of certain cost-increasing market dynamics have changed over time. In revisiting the market dysfunction identified in our inaugural report, we found, consistent with CHIA’s February 2015 report, that unwarranted price variation persists in Massachusetts. As sister agencies have observed, this unwarranted variation contributes to widely varying levels of resources for providers to invest in their facilities and physicians. It is perhaps unsurprising then that higher priced providers continue to attract significant patient volume, both statewide and in specific regions. These trends, coupled with new growth in pharmacy costs and utilization of health care services, point to a likely failure to hold health care spending increases below the 3.6% benchmark the Commonwealth set for 2015. This suggests that additional efforts to address underlying market dysfunction may be warranted, which we explore in the final section of this report.
A. Continuing Price Variation
As CHIA recently reported, variation in prices across all provider types persists in the Commonwealth.32 This section documents the lack of meaningful improvement in price variation since the AGO first reported on this issue in early 2010.33 Specifically, wide variation in hospital and physician prices continued through 2013, with variation in physician prices increasing for one major insurer. Additionally, many of the same providers that have benefited from higher prices in the past continue to do so relative to their peers in 2013. If future price increases are distributed according to historic patterns, even if they are consistent with state health care cost growth goals or other benchmarks, price variation will not improve.
The table below summarizes our findings from examining the range and standard deviation in relative prices from 2010 to 2013 by hospital peer group, which reflect CHIA’s hospital cohorts: Academic Medical Centers (“AMCs”), Major Teaching Hospitals (excluding AMCs), Community Disproportionate Share Hospitals (“DSH”), and Community Non-DSH.34 These cohorts exclude specialty hospitals. While price variation narrowed slightly for teaching hospitals, it stayed the same or increased for AMCs and most community hospitals. Even where the range in prices slightly narrowed, the price of the highest priced hospital in the cohort was at least 58% higher than that of the lowest priced hospital.
32 Ctr. For Health Info. & Analysis, Performance Of The Massachusetts Health Care System Series: Provider Price Variation In The Massachusetts Health Care Market (Cy 2013 Data), at 3 (Feb. 2015), available at http://www.chiamass.gov/assets/Uploads/relative-price-brief-2013.pdf.
33 Office Of Att’y Gen., Examination Of Health Care Costs Trends & Cost Drivers Pursuant To G.L. C. 118g, § 6 ½ (b): Report For Annual Public Hearing, at 10 (Mar. 2010) [hereinafter AGO 2010 report], available at http://www.mass.gov/ago/docs/healthcare/2010-hcctd-full.pdf; AGO 2011 Report, supra note 3, at 15.
34 Ctr. for Health Info. & Analysis, Massachusetts Acute Hospital Financial Performance, Fiscal Year 2013, at 4 (May 2014), available at http://www.chiamass.gov/assets/docs/r/qtr/2013-09-30/2014-04-29/fy13-hospital-financial-report.pdf (identifying hospital peer cohorts).
II. Continuing Market Dysfunction -19-

Examination of Health Care Cost Trends and Cost Drivers Pursuant to G.L. c. 12, § 11N
Change in Relative Price Variation by Hospital Peer Cohort from 2010 to 2013
AMCs Teaching Hospitals Community Non-DSH Community DSH%
Variations in 2013
Change in Variation
Since 2010
% Variations
in 2013
Change in Variation
Since 2010
% Variations
in 2013
Change in Variation
Since 2010
% Variations
in 2013
Change in Variation
Since 2010
BCBS 66% None 58%Slight
Decrease225%
Moderate Increase
107%Slight
Increase
HPHC 43% None 94%Moderate Decrease
107%Slight
Decrease144% None
THP 95% None 77%Slight
Decrease109%
Slight Decrease
129% None
Notes:1. Analysis includes hospitals for which payers reported relative price data to CHIA for each year
2010 to 2013. 2. Rating of “Same” is equivalent to maximum to minimum relative price ratio within 0.1; standard
deviation change is within 0.02.3. “Slight” decrease or increase is a change in maximum to minimum relative price ratio that is
between 0.1 to 0.5; standard deviation change is between 0.02 to 0.05.4. “Moderate” decrease or increase is a change in maximum to minimum relative price ratio that is
between 0.5 to 1.0; change in standard deviation between 0.05 to 0.10.5. “Strong” decrease or increase is a change in maximum to minimum relative price ratio that is
between 1.0 to 1.5; standard deviation change is between 0.10 to 0.15. 6. This analysis does not include specialty hospitals or hospitals that did not have four years of
relative price data for each insurer.
The two charts below show how price variation has not narrowed for two exemplar provider types: DSHs and physician groups. The horizontal bars on each chart reflect the range in relative prices paid by the insurer that year, with the earliest year at the bottom of the chart and the most recent available year at the top. If price variation had improved over time, the width of the bars would narrow as the bars ascend (approximating a pyramid). Instead, we see a rectangular shape, with little change in the range of variation from 2010 to 2013. Each chart is representative of similar findings for the three major insurers, except that for HPHC, the range in physician prices increased over time.
-20- II. Continuing Market Dysfunction

Examination of Health Care Cost Trends and Cost Drivers Pursuant to G.L. c. 12, § 11N
In addition to examining variation in provider prices, we revisited measures of provider clinical quality to assess whether differences in quality scores across multiple measure sets could explain continued variation in prices. We found that they could not. To assess the overall quality of Massachusetts providers, we compared their performance on a wide variety of clinical quality measures.35 Our findings indicate that, consistent with CHIA’s 2015 Annual Report,36 there is some variability in quality performance across providers.37 Specifically, when looking at hospital performance, no hospital consistently performed better or worse than any other across all measures.38 We found a slightly positive correlation between hospital performance on a single quality measure and the relative prices of the three major insurers.39 Otherwise, across a wide variety of measures, we continued to observe no correlation between provider prices and reported differences in quality.
B. Payment Differentials and Provider Resources
As discussed in Part II.A above, some hospitals and physician groups have consistently received higher prices for reasons unexplained by quality or other common measures of consumer value. While these higher prices may be associated with higher reported costs at these providers, they contribute to resource differentials not tied to value, and ultimately influence providers’ financial position. For example, a review of provider financial statements from 2013 indicates that hospitals and provider systems with higher than average relative prices tend to have stronger financial conditions and balance sheets.40 This generally reflects greater resources to invest in facilities, infrastructure, physician recruitment, and develop future business.41
35 For hospitals these measures include Mass-DAC cardiac procedure outcomes, AHRQ quality indicators, patient experience scores (HCAHPS), mortality and readmission rates, and a process measure composite. For physicians, these measures include 2012 HEDIS Adult and Pediatric Clinical Quality Measures and 2013 Adult and Pediatric Patient Experience Survey Measures (CG-CAHPS).
36 2015 CHIA Annual Report, supra note 24, at 14.37 For example, performance on AHRQ measures IQI 90 Mortality Composite for Select Conditions, IQI 91 Mortality Composite
for Select Procedures, and PSI 90 Patient Safety Composite varies from hospital to hospital across Massachusetts.38 Specifically, across all studied measures, a plurality of hospitals was among the top performers on at least one measure
while also among the bottom performers on at least one measure. Fewer than 10% of hospitals had at least three top performances, and similarly, fewer than 10% of hospitals had at least three bottom performances.
39 A slightly positive correlation was found between hospital performance on the IQI 90, Mortality Composite for Select Conditions, and relative price. However, this metric was not previously analyzed, so we are unable to determine whether or not this slightly positive correlation reflects movement towards more value based payments.
40 Relative prices were found to be correlated with Days Cash on Hand and Equity Financing Ratios for all hospitals. Among hospital systems, there was a strong correlation between Operating Margin and relative prices.
41 The correlation between relative prices and operating margins across all hospitals was not strong, meaning that hospitals with higher relative prices tend to have higher operating expenses. Some portion of operating expense variation may be caused by factors that can warrant higher hospital payments, such as the costs of graduate medical education and the costs of unusually complex patient care. Our review did not address the extent to which variation in operating expenses should translate to relative price differences, especially in light of research suggesting that relative price differences enable variation in operating expenses. See, e.g., AGO 2010 Report, supra note 33, at 26 (“It appears that higher prices are reflected in higher cost structures, but are not caused by them.”); MedPAC March 2009 Report to Congress: Medicare Payment Policy, at xiv (Feb. 2009), available at http://www.medpac.gov/documents/reports/Mar09_ExecSummary.pdf?sfvrsn=0 (finding that “unusually high hospital margins on private-payer patients can lead to more construction, higher hospital costs, and lower Medicare margins”).
II. Continuing Market Dysfunction -21-
Examination of Health Care Cost Trends and Cost Drivers Pursuant to G.L. c. 12, § 11N
Sister agencies have documented this differential ability of providers to reinvest in their businesses.42 For example, in evaluating its community hospital investment program, HPC noted that “[h]istoric rate inequalities have impacted the ability of some community hospitals to invest in transformation. In some cases, community hospitals do not have access to capital to meaningfully invest in people, process, and technology to remain sufficiently competitive.”43 Likewise, the HPC’s monitoring of health care market trends has reflected the significant level of interest and activity around physician recruitment and investment. In tracking the frequency of different types of market changes, the HPC has found that physician-related transactions, including acquisitions and affiliations, remain the most frequent type of market change.44 Similarly, recent reviews of significant health care transactions reflect that physician reimbursement and the funds available to provider systems to attract and retain them have been central considerations.45
42 See, e.g.,Health Policy Comm’n, Mass., Review of Partners HealthCare System’s Proposed Acquisition of Hallmark Health Corporation (HPC-CMIR-2013-4) Pursuant to M.G.L. c. 6D, § 13, at 66 (Sept. 2014), available at http://www.mass.gov/anf/docs/hpc/material-change-notices/phs-hallmark-final-report-final.pdf; Health Policy Comm’n, Mass., Community Hospital Acceleration, Revitalization, And Transformation Program, Phase 1 – Foundational Investments For Transformation, at 8 (Oct. 2013) [hereinafter HPC CHART], available at http://www.mass.gov/anf/budget-taxes-and-procurement/oversight-agencies/health-policy-commission/chart/chart-report-final.pdf.
43 HPC CHART, supra note 42 at 8 (also describing how many CHART hospitals have an older average age of plant than the median for the state, “reflecting the capital challenges these hospitals are facing in funding near term replacement of their physical plants”).
44 See, e.g., Health Policy Comm’n, Mass., Commission Meetings Presentations from 2013-2015, available at http://www.mass.gov/anf/budget-taxes-and-procurement/oversight-agencies/health-policy-commission/public-meetings/board-meetings.
45 See Health Policy Comm’n, Mass., Review of Partners HealthCare System’s Proposed Acquisitions of South Shore Hospital (HPC-CMIR-2013-1) and Harbor Medical Associates (HPC-CMR-2013-2), Pursuant to M.G.L. c. 6D, §13, Final Report, at 9-10 (Feb. 2013), available at http://www.mass.gov/anf/docs/hpc/20140219-final-cmir-report-phs-ssh-hmc.pdf.
-22- II. Continuing Market Dysfunction
Examination of Health Care Cost Trends and Cost Drivers Pursuant to G.L. c. 12, § 11N
C. Payment Differentials and Provider Volume
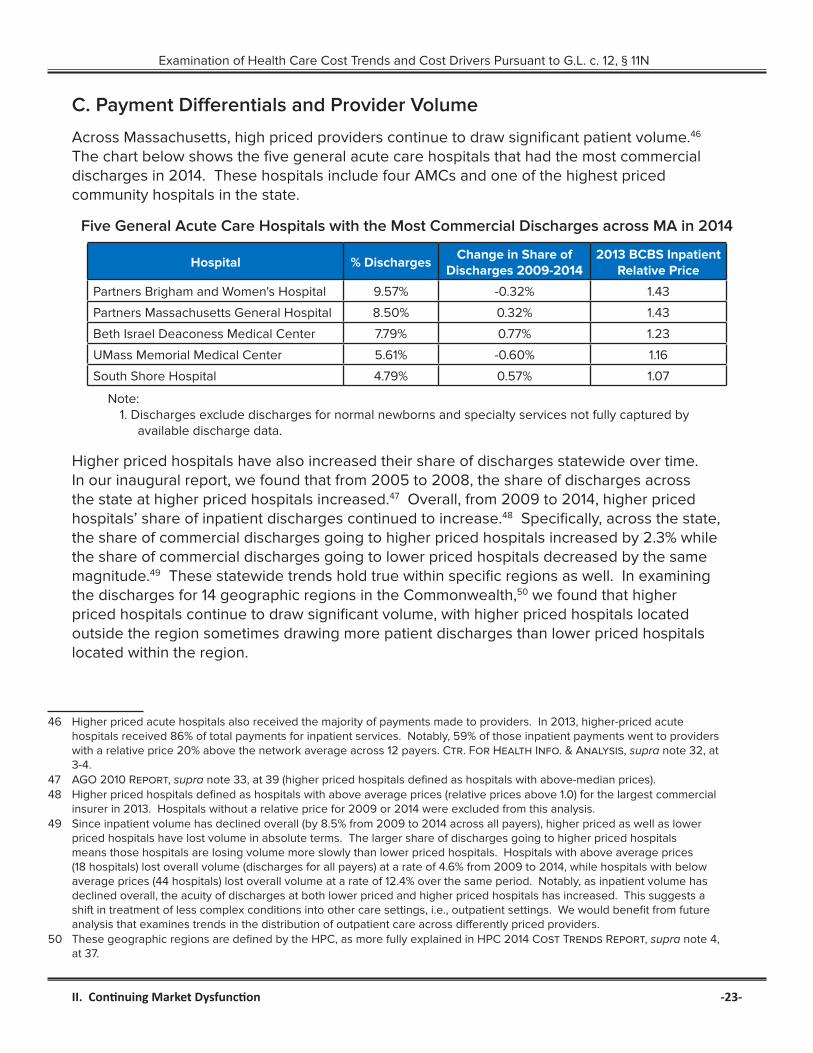
Across Massachusetts, high priced providers continue to draw significant patient volume.46 The chart below shows the five general acute care hospitals that had the most commercial discharges in 2014. These hospitals include four AMCs and one of the highest priced community hospitals in the state.
Five General Acute Care Hospitals with the Most Commercial Discharges across MA in 2014
Hospital % DischargesChange in Share of
Discharges 2009-20142013 BCBS Inpatient
Relative Price
Partners Brigham and Women's Hospital 9.57% -0.32% 1.43
Partners Massachusetts General Hospital 8.50% 0.32% 1.43
Beth Israel Deaconess Medical Center 7.79% 0.77% 1.23
UMass Memorial Medical Center 5.61% -0.60% 1.16
South Shore Hospital 4.79% 0.57% 1.07
Note:1. Discharges exclude discharges for normal newborns and specialty services not fully captured by
available discharge data.
Higher priced hospitals have also increased their share of discharges statewide over time. In our inaugural report, we found that from 2005 to 2008, the share of discharges across the state at higher priced hospitals increased.47 Overall, from 2009 to 2014, higher priced hospitals’ share of inpatient discharges continued to increase.48 Specifically, across the state, the share of commercial discharges going to higher priced hospitals increased by 2.3% while the share of commercial discharges going to lower priced hospitals decreased by the same magnitude.49 These statewide trends hold true within specific regions as well. In examining the discharges for 14 geographic regions in the Commonwealth,50 we found that higher priced hospitals continue to draw significant volume, with higher priced hospitals located outside the region sometimes drawing more patient discharges than lower priced hospitals located within the region.
46 Higher priced acute hospitals also received the majority of payments made to providers. In 2013, higher-priced acute hospitals received 86% of total payments for inpatient services. Notably, 59% of those inpatient payments went to providers with a relative price 20% above the network average across 12 payers. Ctr. For Health Info. & Analysis, supra note 32, at 3-4.
47 AGO 2010 Report, supra note 33, at 39 (higher priced hospitals defined as hospitals with above-median prices).48 Higher priced hospitals defined as hospitals with above average prices (relative prices above 1.0) for the largest commercial
insurer in 2013. Hospitals without a relative price for 2009 or 2014 were excluded from this analysis.49 Since inpatient volume has declined overall (by 8.5% from 2009 to 2014 across all payers), higher priced as well as lower
priced hospitals have lost volume in absolute terms. The larger share of discharges going to higher priced hospitals means those hospitals are losing volume more slowly than lower priced hospitals. Hospitals with above average prices (18 hospitals) lost overall volume (discharges for all payers) at a rate of 4.6% from 2009 to 2014, while hospitals with below average prices (44 hospitals) lost overall volume at a rate of 12.4% over the same period. Notably, as inpatient volume has declined overall, the acuity of discharges at both lower priced and higher priced hospitals has increased. This suggests a shift in treatment of less complex conditions into other care settings, i.e., outpatient settings. We would benefit from future analysis that examines trends in the distribution of outpatient care across differently priced providers.
50 These geographic regions are defined by the HPC, as more fully explained in HPC 2014 Cost Trends Report, supra note 4, at 37.
II. Continuing Market Dysfunction -23-
Examination of Health Care Cost Trends and Cost Drivers Pursuant to G.L. c. 12, § 11N
Patterns are similar for outpatient services. As documented by CHIA, hospital outpatient payments continue to be significantly concentrated among higher priced hospitals.51 For example, in 2013, higher priced hospitals received 72.7% of statewide payments for hospital outpatient services.52 CHIA and the HPC have also reported on significant concentration in physician services and payments in the state.53
D. The Urgency of Addressing Market Dysfunction
For 2015 and 2016, insurers are projecting higher rates of growth for commercial medical spending, particularly on prescription drugs. In light of these trends, provider price increases will necessarily have to be limited or cost growth will exceed the state’s benchmark. If the distribution of these price increases follows historic patterns, price disparities will only persist or worsen. This underscores the urgency of considering additional measures to address market dysfunction. The remainder of this section summarizes recent rates of growth in medical spending, as well as insurer projections for this year and next year. It then turns to explaining how limited price increases would need to be in order to meet the health care cost growth benchmark.
In recent years, growth in commercial medical spending in Massachusetts, as measured by full claims expenditures,54 has compared favorably to national trends.55 In Massachusetts, commercial full claims total medical expenditures (“TME”) increased 1.5% from 2011 to 2012 and 1.2% from 2012 to 2013,56 whereas nationally, commercial TME reportedly increased 3.7% from 2011 to 2012 and 3.9% from 2012 to 2013.57 This is good news for Massachusetts.
At the same time, one component of recent low trends in Massachusetts (and, to a lesser extent, nationally) has been unusually low (and sometimes negative) growth in utilization of health care services. Each of the three major Massachusetts insurers provided information showing low or negative utilization trends from 2012 to 2014. For example, one insurer reported utilization and mix trends58 for their HMO population from 2011 to 2014 that ranged from negative 3.3% to positive 2.4%.
51 Defined as providers with outpatient relative prices in the top two relative price quartiles. Ctr. for Health Info. & Analysis, Relative Price: Health Care Provider Price Variation in the Massachusetts Commercial Market, at 5, figure 2 (Feb. 2015), available at http://www.chiamass.gov/assets/Uploads/relative-price-chartbook-2013.pdf.
52 This value decreased from 75.2% in 2011 and 74.7% in 2012. Id.53 See id. at 6; HPC CHART, supra note 42, at 7 (finding total payments for hospital services highly concentrated among more
expensive providers across all payer networks, with no substantial change in recent years).54 Full claims represent claims for which insurers are able to report information on all medical claims. In contrast, partial claims
represent claims for which an insurer is not able to collect all claims information (e.g., where a self-insured employer carves out pharmacy or behavioral health benefits).
55 Over this same period, trends in total health care expenditures in Massachusetts have been consistent with national trends, and in 2014 exceeded the projected trend of total health care expenditures nationally. Ctr. for Health Info. & Analysis, 2014 Annual Report on the Performance of the Massachusetts Health Care System, at 8 (2014), available at http://www.chiamass.gov/assets/Uploads/chia-annual-business-report.pdf; 2015 CHIA Annual Report, supra note 24, at 9.
56 Ctr. for Health Info. & Analysis, 2015 CHIA Annual Report Databook, at 13 (2015), available from http://www.chiamass.gov/assets/2015-annual-report/2015-Annual-Report-Data-Books.zip.
57 Health Care Cost Institute, 2013 Health Care Cost And Utilization Report, at 1 (Oct. 2014), available at http://www.healthcostinstitute.org/2013-health-care-cost-and-utilization-report.
58 Mix trend includes provider mix and service mix. Provider mix is the impact on trend due to a change in provider (e.g., from a lower priced provider to a higher priced provider). Service mix is the impact on trend due to the change in the types of services used (e.g., knee replacement surgery instead of physical therapy).
-24- II. Continuing Market Dysfunction

Examination of Health Care Cost Trends and Cost Drivers Pursuant to G.L. c. 12, § 11N
Additionally, while data show that price increases have also slowed during this timeframe, they have not slowed in a way that has reduced the disparities documented in Part II.A of this report. For example, some hospitals with higher than average prices are getting the same (or greater) price increases as lower priced hospitals, exacerbating the existing variation in provider prices. In reviewing information on HMO and PPO prices for inpatient services, we found that from 2009 to 2013, one major insurer negotiated higher than average price increases for higher priced hospitals such as Massachusetts General Hospital and South Shore Hospital, and lower than average increases for lower priced hospitals such as Lowell General Hospital and Noble Hospital. This holds true when specifically examining trends in prices paid for inpatient services from 2012 to 2013, the first year in which the state cost growth benchmark was in effect.
Meanwhile, insurers project these low spending trends will end. Data we reviewed indicate that increases in utilization and pharmacy costs alone will likely consume most of the growth in medical spending “permitted” under the benchmark in 2015. This means that, to meet the benchmark, fewer dollars will be available for increases in unit prices.
The table below combines 2014 spending statistics with trends described by insurers to illustrate the impact of growth in pharmacy expenses on the maximum growth in hospital and physician prices that would be available in order to meet the 3.6% benchmark. The purpose of this exhibit is not to suggest what unit price increases for 2015 should be. Nor is it meant to endorse the rate of growth in pharmacy expenses included for illustrative purposes. Rather, the purpose of this exhibit is to illustrate interactions between different components of health care spending in an environment focused on meeting a 3.6% benchmark and to inform discussions of provider and insurer performance under that benchmark. Given this purpose of exploring the interplay between different components of health care spending, we do not introduce changes to other variables, such as the size or health status of the population.
The exhibit below shows that total commercial medical expenses in Massachusetts were about $18.9 billion in 2014.59 To meet the 3.6% benchmark, 2015 total commercial medical expenses should not exceed $19.6 billion. The table breaks out these total expenses into two categories: pharmacy expenses and all other medical expenses, which include hospital, physician, home health, dental, and all other non-pharmacy expenses. As shown in the table, pharmacy expenses were 16.7% of total commercial medical expenses in 2014.60 For illustrative purposes, we assume that pharmacy expenses will increase by 12.5% from 2014 to 2015. This is the same rate of growth that pharmacy expenses experienced from 2013 to 2014, and lower than the rate of growth for these expenses projected by the major commercial insurers for 2015 and 2016.61 To meet the benchmark, there would then be $16.1 billion “available” for all non-pharmacy expenses in 2015. This translates into a permissible rate of growth of 1.8% for all of these other expenses in 2015, which must encompass
59 See 2015 CHIA Annual Report, supra note 24, at 12.60 Id. at 18. 61 DOI cites increased levels of drug costs as one of three primary factors causing 2016 premium increases in the small group
and individual markets. Commonwealth of Massachusetts, Office of Consumer Affairs and Business Regulation, Division of Insurance, Information Sheet: First Quarter 2016 Merged Market Health Insurance Rate Increases, available at http://www.mass.gov/ocabr/docs/doi/media/info-sheet-merged-market-rates.pdf.
II. Continuing Market Dysfunction -25-
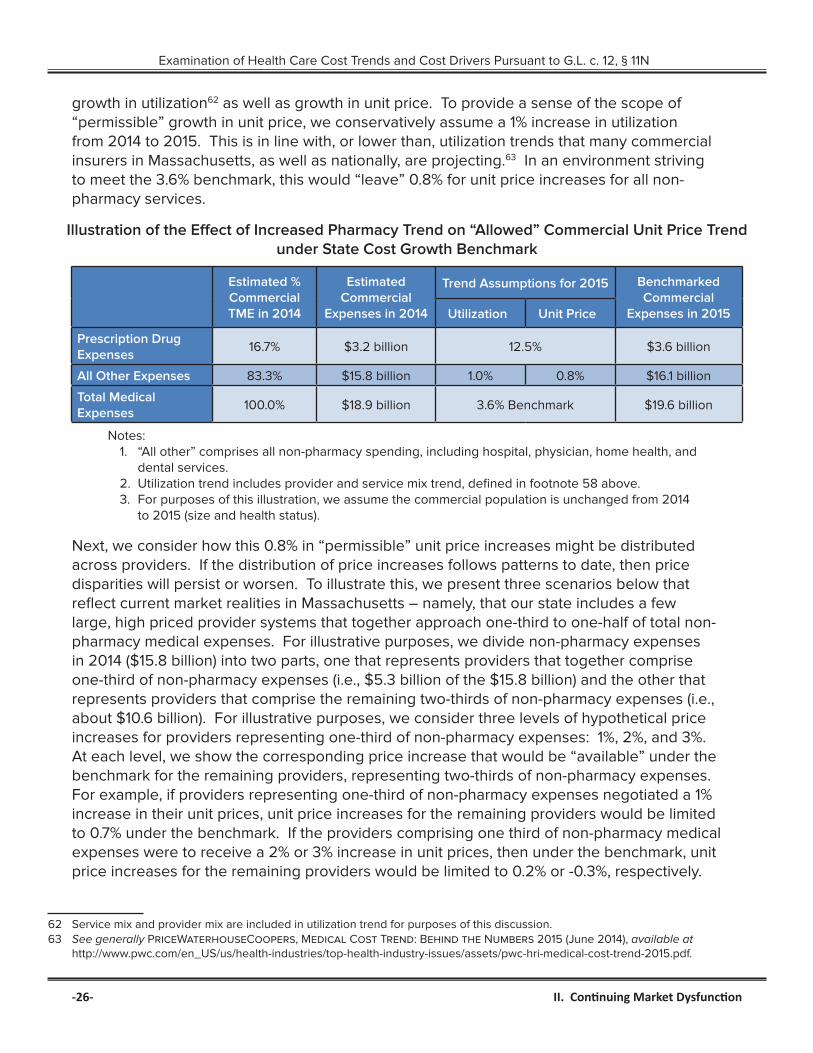
Examination of Health Care Cost Trends and Cost Drivers Pursuant to G.L. c. 12, § 11N
growth in utilization62 as well as growth in unit price. To provide a sense of the scope of “permissible” growth in unit price, we conservatively assume a 1% increase in utilization from 2014 to 2015. This is in line with, or lower than, utilization trends that many commercial insurers in Massachusetts, as well as nationally, are projecting.63 In an environment striving to meet the 3.6% benchmark, this would “leave” 0.8% for unit price increases for all non-pharmacy services.
Illustration of the Effect of Increased Pharmacy Trend on “Allowed” Commercial Unit Price Trend under State Cost Growth Benchmark
Estimated % Commercial TME in 2014
Estimated Commercial
Expenses in 2014
Trend Assumptions for 2015 Benchmarked Commercial
Expenses in 2015Utilization Unit Price
Prescription Drug Expenses
16.7% $3.2 billion 12.5% $3.6 billion
All Other Expenses 83.3% $15.8 billion 1.0% 0.8% $16.1 billion
Total Medical Expenses
100.0% $18.9 billion 3.6% Benchmark $19.6 billion
Notes:1. “All other” comprises all non-pharmacy spending, including hospital, physician, home health, and
dental services.2. Utilization trend includes provider and service mix trend, defined in footnote 58 above. 3. For purposes of this illustration, we assume the commercial population is unchanged from 2014
to 2015 (size and health status).
Next, we consider how this 0.8% in “permissible” unit price increases might be distributed across providers. If the distribution of price increases follows patterns to date, then price disparities will persist or worsen. To illustrate this, we present three scenarios below that reflect current market realities in Massachusetts – namely, that our state includes a few large, high priced provider systems that together approach one-third to one-half of total non-pharmacy medical expenses. For illustrative purposes, we divide non-pharmacy expenses in 2014 ($15.8 billion) into two parts, one that represents providers that together comprise one-third of non-pharmacy expenses (i.e., $5.3 billion of the $15.8 billion) and the other that represents providers that comprise the remaining two-thirds of non-pharmacy expenses (i.e., about $10.6 billion). For illustrative purposes, we consider three levels of hypothetical price increases for providers representing one-third of non-pharmacy expenses: 1%, 2%, and 3%. At each level, we show the corresponding price increase that would be “available” under the benchmark for the remaining providers, representing two-thirds of non-pharmacy expenses. For example, if providers representing one-third of non-pharmacy expenses negotiated a 1% increase in their unit prices, unit price increases for the remaining providers would be limited to 0.7% under the benchmark. If the providers comprising one third of non-pharmacy medical expenses were to receive a 2% or 3% increase in unit prices, then under the benchmark, unit price increases for the remaining providers would be limited to 0.2% or -0.3%, respectively.
62 Service mix and provider mix are included in utilization trend for purposes of this discussion.63 See generally PriceWaterhouseCoopers, Medical Cost Trend: Behind the Numbers 2015 (June 2014), available at
http://www.pwc.com/en_US/us/health-industries/top-health-industry-issues/assets/pwc-hri-medical-cost-trend-2015.pdf.
-26- II. Continuing Market Dysfunction
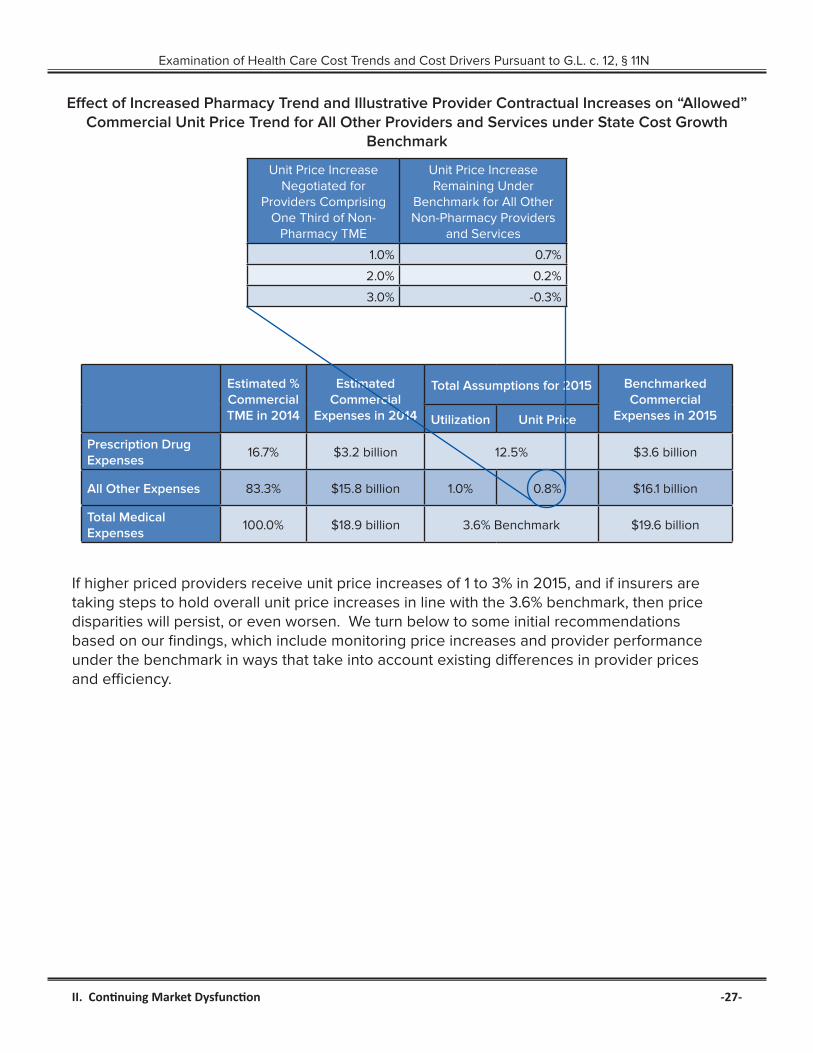
Examination of Health Care Cost Trends and Cost Drivers Pursuant to G.L. c. 12, § 11N
Effect of Increased Pharmacy Trend and Illustrative Provider Contractual Increases on “Allowed” Commercial Unit Price Trend for All Other Providers and Services under State Cost Growth
Benchmark
Unit Price Increase Negotiated for
Providers Comprising One Third of Non-
Pharmacy TME
Unit Price Increase Remaining Under
Benchmark for All Other Non-Pharmacy Providers
and Services
1.0% 0.7%
2.0% 0.2%
3.0% -0.3%
Estimated % Commercial TME in 2014
Estimated Commercial
Expenses in 2014
Total Assumptions for 2015 Benchmarked Commercial
Expenses in 2015Utilization Unit Price
Prescription Drug Expenses
16.7% $3.2 billion 12.5% $3.6 billion
All Other Expenses 83.3% $15.8 billion 1.0% 0.8% $16.1 billion
Total Medical Expenses
100.0% $18.9 billion 3.6% Benchmark $19.6 billion
If higher priced providers receive unit price increases of 1 to 3% in 2015, and if insurers are taking steps to hold overall unit price increases in line with the 3.6% benchmark, then price disparities will persist, or even worsen. We turn below to some initial recommendations based on our findings, which include monitoring price increases and provider performance under the benchmark in ways that take into account existing differences in provider prices and efficiency.
II. Continuing Market Dysfunction -27-
Examination of Health Care Cost Trends and Cost Drivers Pursuant to G.L. c. 12, § 11N
III. RecommendationsOur findings highlight several areas of continuing challenges in supporting the Commonwealth’s health care reform goals. Although there has been progress in demand side and supply side efforts, including increased membership in tiered network products and global payment arrangements, unwarranted price variation among providers persists. More expensive providers continue to draw greater patient volume, adding to health care costs. These trends, coupled with new growth in pharmacy costs and utilization of health care services, point to a likely failure to hold health care spending increases below the 3.6% benchmark the Commonwealth set for 2015. This suggests that additional efforts to address underlying market dysfunction may be warranted.
Regarding demand side efforts, we recommend simplifying and strengthening existing initiatives, and developing new efforts that target clear, robust information and incentives at the point of enrollment and PCP selection. Specifically, we recommend:
1. Requiring clear, easily compared information on the cost and quality of different insurance plans and provider systems for (a) employers at the time an employer determines the health insurance options that will be available to its employees and (b) consumers at the time of plan enrollment and selection of the consumer’s primary care provider system.
2. Simplifying and strengthening how tiered networks are designed, such as by tiering affiliated providers together as a system (by “accountable care organization”) and increasing the difference in consumer cost sharing between tiers to better reflect the actual cost of obtaining care at different provider systems.
3. Promoting consumer access to and understanding of health care cost and billing information. This includes educating consumers about how to make informed decisions about the health care services they obtain. Providers and insurers should take steps to address the challenges consumers are experiencing in accessing relevant price information, and make the information itself clearer and more useful to consumers.
Our findings also underscore the importance of implementing supply side incentives and penalties more evenly. Specifically, we recommend:
1. Monitoring variation in health status adjusted global budgets. This could be achieved by advancing current efforts to monitor the relative size of global budgets, or incorporated into the processes for certification of risk bearing provider organizations, approval of insurance rates for market segments cared for through global budget contracts, or certification of ACOs.
2. Evaluating provider performance under the statewide cost growth benchmark in ways that take into account differences in provider efficiency, such that more efficient (less costly) providers are given more room to grow under the benchmark than less efficient providers. For example, when measuring whether provider total medical expenses are excessive under G.L. c. 12C, § 18, the state could index provider cost growth by the provider’s relative price. The state could also consider such indexed cost growth in
-28- III. Recommendations

Examination of Health Care Cost Trends and Cost Drivers Pursuant to G.L. c. 12, § 11N
evaluating which providers would benefit from “performance improvement plans.”64 We also note the importance of expanding measures of provider efficiency beyond physician-based measures of efficiency, so that more categories of providers can be measured and evaluated (e.g., hospitals).
Finally, it is equally important for Massachusetts to monitor and address disparities in health care resource distribution. Specifically, we recommend:
1. Considering direct regulation of the level of variation in provider prices and/or medical spending, to reduce disparities in the resources available to care for similar patient populations.
2. Monitoring income and health status adjusted medical spending by zip code on an annual basis.
3. Promoting the development of population health status metrics that better account for socioeconomic risk factors.
The Office of the Attorney General looks forward to continued collaboration with the Legislature, sister agencies, health care market participants, and other stakeholders in advancing health care reform efforts in this state. We share the responsibility to promote a value based health care system that controls cost growth while maintaining quality and access. We look forward to continuing to work together to ensure that affordable, high quality health care is available to all Massachusetts residents.
64 Mass. Gen. Laws ch. 6D, §10 (2015).
III. Recommendations -29-

Examination of Health Care Cost Trends and Cost Drivers Pursuant to G.L. c. 12, § 11N
AcknowledgementsExamination and Report by Attorney General Healey’s Health Care Division: Assistant Attorneys General Courtney Aladro and Emily Gabrault, Division Chief Karen Tseng, Legal Analysts Robert Ciccia and Tara Ruttle, with expert assistance from Damokosh Consulting, LLC, Freedman Healthcare, LLC, Gorman Actuarial, Inc., and Health Management Associates.
The Attorney General’s Office thanks the insurers and providers who provided information for this examination for their courtesy and cooperation.
-30- Acknowledgements

Examination of Health Care Cost Trends and Cost Drivers Pursuant to G.L. c. 12, § 11N

Office of Attorney General Maura Healey
One Ashburton Place
Boston, MA 02108
(617) 727-2200
www.mass.gov/ago/