Embed Size (px)
Citation preview
NEWER MRI TECHNIQUES

HISTORY
¢ In 1973,Paul Lauterbur published the first nuclear magnetic resonance image.
¢ Prof Peter Mansfield (Nottingham University,UK) was awarded Nobel in 2003 for his discoveries in MRI ( with Prof Paul C Lauterbur )
en.wikipedia.org

¢ Magnetic resonance imaging was developed from knowledge gained in the study of nuclear magnetic resonance.
¢ In early years the technique- referred to as nuclear
magnetic resonance imaging (NMRI). ¢ However, it is now referred to simply as MRI

BASICS OF MRI
¢ Based on complex interaction between � Protons in human body � Magnetic field � Radiofrequency energy

BASICS OF MRI
¢ Object to be imaged is placed in a powerful, uniform magnetic field,(B0).
¢ The spins of atomic Nuclei are characterized by – Nuclei align parallel or anti-parallel to B0 – Precession : Wobbling sort of motion undergone by spinning object ,frequency of precession is called the Larmor frequency.

¢ Brief exposure to pulses of electromagnetic field B1 (RF pulse at LARMOR frequency) at 90° to B0.
¢ As the RF pulse continues, the spins change lower energy to higher energy state.
¢ This leads to “tipping” of the net magnetization toward the transverse plane.
¢ Spins phases are coherent (aligned with
each other).
¢ When Rf is shut off - Spins lose their phase coherence & the signal decays. This process is called transverse relaxation (because it happens while the spins are in the transverse plane).
¢ Characterized by an exponential time constant, T2 (tens to hundreds of ms).
¢ T1 is time taken by protons to return to normal equilibrium (longitudinal relaxation).

¢ SPIN ECHO � TR (Repetition Time ): Interval between Rf pulses. � TE (Echo time): Time between Rf pulse & signal
reception.

BASIC IMAGING SEQUENCES
¢ T 1 WI ¢ T 2 WI ¢ T2 * WI ¢ GRADIENT ECHO ¢ FLAIR ¢ STIR

IMAGING CHARACTERISTICS
¢ T1 WI: TR & TE short T2 WI: TR & TE long
¢ T1 WI: Dark - Water, CSF, edema, Calcium(can be pradoxically bright because of crystalline structure of calcium) Bright - Lipid ,Gadolinium,subacute blood, protein, Mn, melanin
¢ T2 WI: Dark - Calcium, bone
Bright - CSF, water, edema
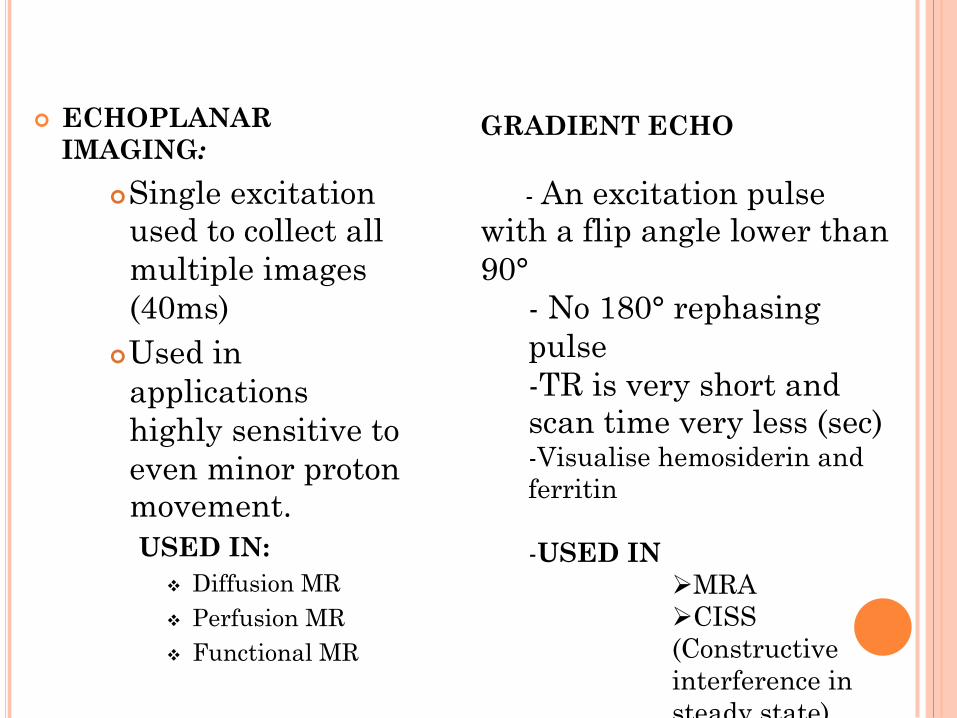
¢ ECHOPLANAR IMAGING:
¢ Single excitation used to collect all multiple images(40ms)
¢ Used in applications highly sensitive to even minor proton movement. USED IN:
v Diffusion MR v Perfusion MR v Functional MR
GRADIENT ECHO - An excitation pulse with a flip angle lower than 90°
- No 180° rephasing pulse - TR is very short and scan time very less (sec) - Visualise hemosiderin and ferritin - USED IN
Ø MRA Ø CISS (Constructive interference in steady state).

T1-WEIGHTED MRI
¢ Use a (GRE) sequence - short TE and TR. ¢ Due to the short repetition time (TR) this scan can be run
very fast allowing the collection of high resolution 3D datasets.
¢ Basic types of MR , contrast used, is a commonly run clinical scan.
¢ The T1 weighting can be increased (improving contrast) with the use of an inversion pulse as in an MP-RAGE sequence.
¢ Provide good gray matter/white matter contrast.(ANATOMY)
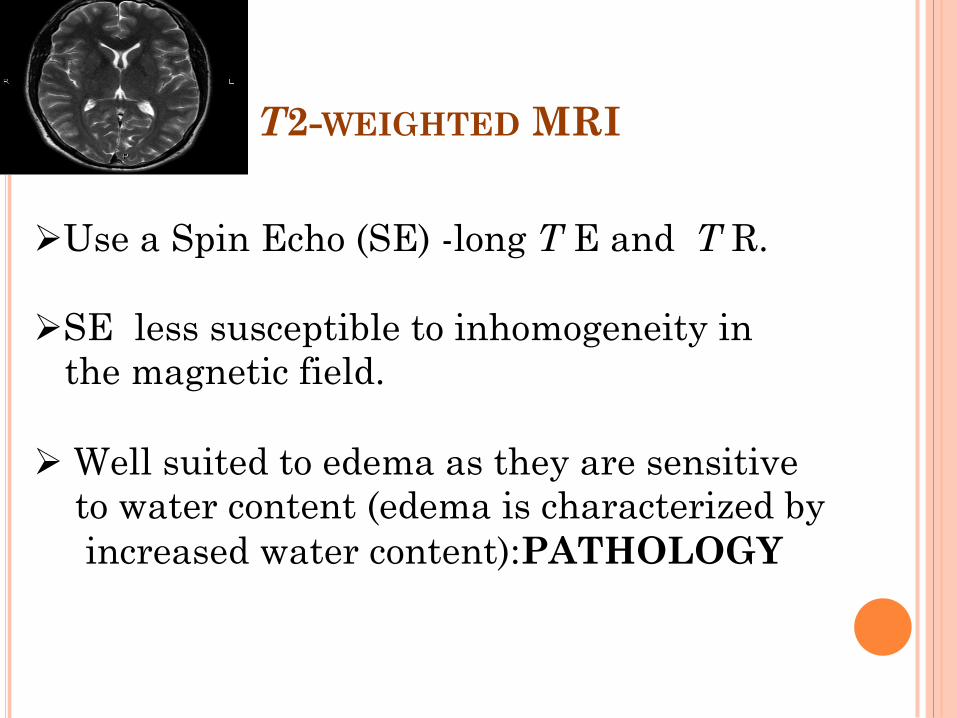
T2-WEIGHTED MRI
Ø Use a Spin Echo (SE) -long T E and T R.
Ø SE less susceptible to inhomogeneity in the magnetic field. Ø Well suited to edema as they are sensitive to water content (edema is characterized by increased water content):PATHOLOGY

T*2-WEIGHTED MRI
¢ T*2 - (GRE) sequence- long TE and long TR. ¢ Gradient echo sequence used. ¢ Does not have the extra refocusing pulse used in spin echo ¢ So it is subjected to additional losses above the normal
T2 decay (referred to as T2′), these taken together are called T*2.
¢ Increase contrast for certain types of tissue, such as
venous blood

FLUID ATTENUATED INVERSION
RECOVERY(FLAIR) ¢ Sequence used to null signal from fluids.
E.g.CSF so as to bring out lesions at fluid-parenchyma interface
¢ Choosing the inversion time TI (the time
between the inversion and excitation pulses), the signal from any particular tissue can be suppressed
¢ CLEAR FLUID in a CLOSED SPACE will
be supressed ¢ FAST FLAIR: Fast spin echo plus flair

USES 1. For periventricular & subcortical
abnormalities: (Cortical & juxtacortical multiple sclerosis lesions, degenerative diseases).
2. In seizure disorders (e.g MTS): � Sensitive for detecting signal abnormalities
demonstrating size asymmetry & abnormal signal within the atrophied hippocampus.

3. Differentiating epidermoid from arachnoid
cyst - Signals of epidermoid being similar to brain parenchyma ,arachnoids cyst signal suppressed.
5. Diffuse axonal injury: White matter lesion volume can be quantitatively assessed.
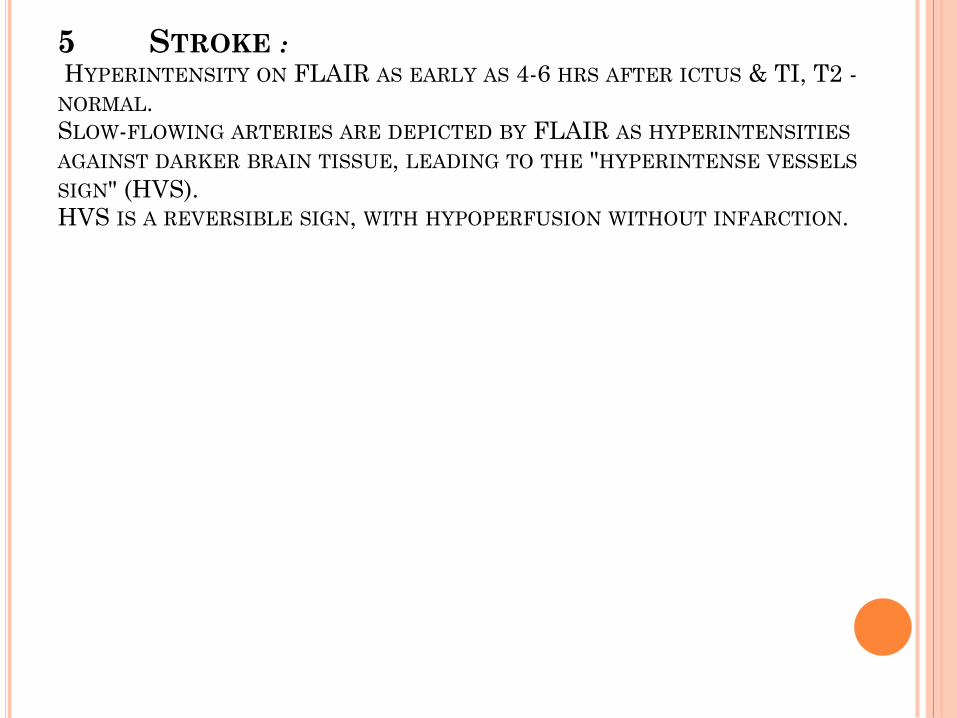
5 STROKE : HYPERINTENSITY ON FLAIR AS EARLY AS 4-6 HRS AFTER ICTUS & TI, T2 - NORMAL. SLOW-FLOWING ARTERIES ARE DEPICTED BY FLAIR AS HYPERINTENSITIES AGAINST DARKER BRAIN TISSUE, LEADING TO THE "HYPERINTENSE VESSELS SIGN" (HVS). HVS IS A REVERSIBLE SIGN, WITH HYPOPERFUSION WITHOUT INFARCTION.

DISADVANTAGE ¢ Artifactual increased signal in and around CSF
spaces, limits its role in posterior fossa.
¢ Incomplete nulling of CSF signals due to CSF inflow effects produces imaging artifacts. � Areas of prominent CSF pulsatility, such as inferiorly located sections and those containing foramina of the CSF ventricular system. � May not detect lesions located in the brain stem.
¢ Poor lesion contrast may be present � In the basal ganglia & posterior fossa (particularly
MS plaques), & the inability to clearly depict cystic lesions.
FAT SUPPRESSION SEQUENCE
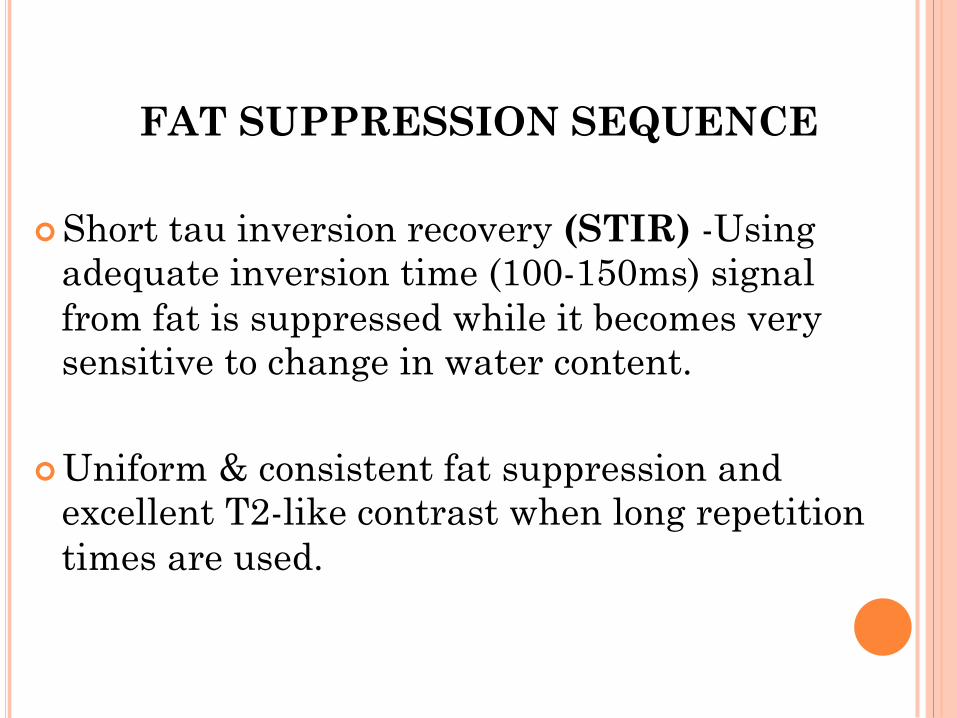
¢ Short tau inversion recovery (STIR) -Using adequate inversion time (100-150ms) signal from fat is suppressed while it becomes very sensitive to change in water content.
¢ Uniform & consistent fat suppression and
excellent T2-like contrast when long repetition times are used.

USES 1. Lesions in the optic nerve can be visualized
e.g. traumatic, demyelinating. 2. Metastasis to vertebral body in fatty marrow
� These can be missed on T2.
3. Useful for fractures of vertebral body. 4. Musculoskeletal imaging.
5. Useful in carpal tunnel syndrome . Carpal tunnel syn. – flattened median nerve & signal from denervated muscles
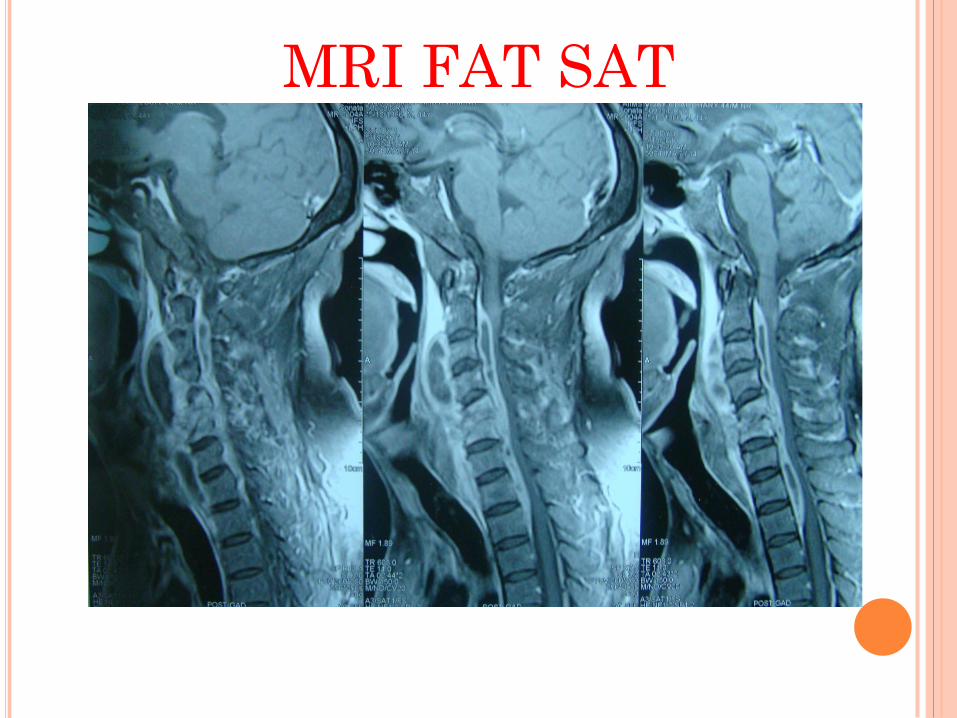
MRI FAT SAT
plasmacytoma on percutaneous biopsy
plasmacytoma on percutaneous biopsy

NEWER MRI TECHNIQUES Factors in development of Newer
Techniques
¢ High Strength of Magnet ( upto 7.5 T) ¢ Improved Gradient Coil ¢ Software Development ¢ Understanding of molecular biology of lesion

NEWER MRI TECHNIQUES
¢ Improvement Resolution : e.g. MPRAGE, CISS
¢ Short Scanning Time: e.g. Echo planner imaging
¢ Functional Imaging: e.g. FmRI, PWI(ASL)
¢ Microstructural imaging : e.g. DWI, DTI
¢ Biochemical Structures: MRS
¢ Fusion images : PET MR
¢ Tissue contrast : SWI
¢ Intraoperative/ Interventional MR

CONSTRUCTIVE INTERFERENCE IN STEADY STATE (CISS)
¢ Heavily weighted T2 sequence with a strong
and constant signal for cerebrospinal fluid. ¢ 3-D gradient technique, where signal from
brain parenchyma is suppressed. ¢ Fluid appears bright.
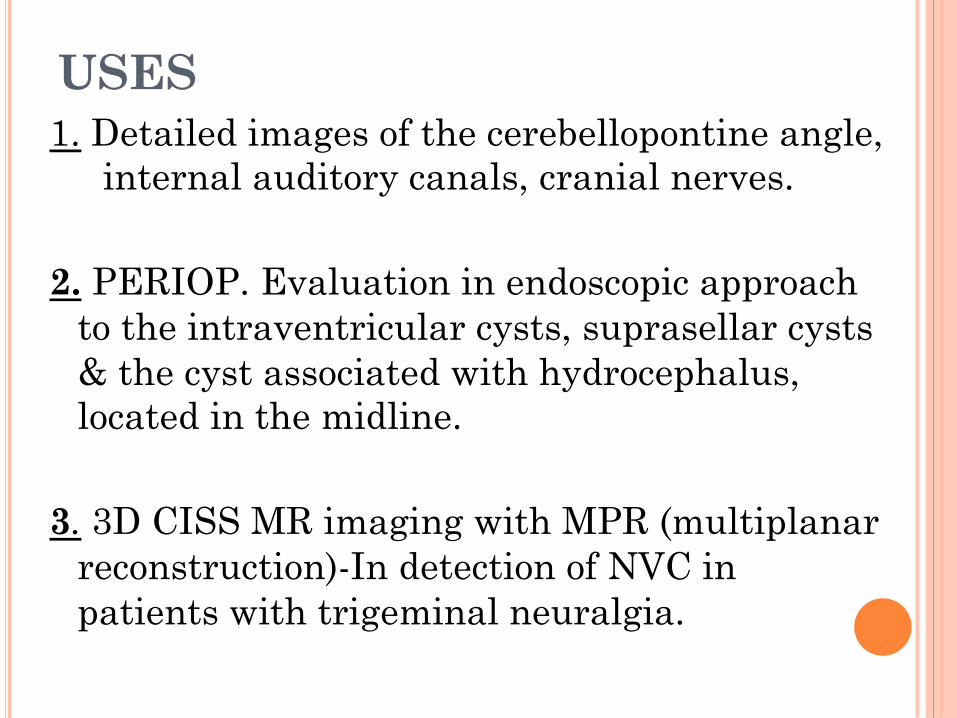
USES 1. Detailed images of the cerebellopontine angle,
internal auditory canals, cranial nerves. 2. PERIOP. Evaluation in endoscopic approach
to the intraventricular cysts, suprasellar cysts & the cyst associated with hydrocephalus, located in the midline.
3. 3D CISS MR imaging with MPR (multiplanar
reconstruction)-In detection of NVC in patients with trigeminal neuralgia.

4. In evaluation of brachial plexus injuries, if root avulsion is suspected, CISS is used to perform 3-D MR myelography.
� Uniform signal intensity and high contrast between CSF &
neural structures are obtained. � Enabled detection of meningoceles, avulsed or intact nerve
roots, dural sleeve abnormalities & dural scars. � Evaluation of nerve root integrity -89% sensitivity, 95%
specificity.

5. Used for evaluation of CSF rhinorrhea (MR cisternography)
� The sensitivity & specificity of the MR method
(88.9% & 95.1%) is higher compared with CT cisternography (77.8% & 87.8%).
� Less than 2mm,multiple defects. � Noninvasive. � Administration of contrast & agent is no longer
necessary.

SWI SEQUENCES
¢ SWI measures susceptibility differences between tissues, offering a new form of contrast enhancement.
¢ When phase effects are caused by small pixel-sized objects, signals from substances with different magnetic susceptibilities can become out of phase at long echo times (TE) compared to neighbouring tissues.
¢ SWI is combination of magnitude images and phase images merged into a new image.

SWI SEQUENCES ¢ In the brain, the goal of an SWI exam would be to
look for changes in venous vasculature, microbleeds, and changes in local iron content.
¢ SWI may even serve as an important morphological scan to go along with T1-weighted images for functional MRI studies as well.
¢ The imaging of venous blood with SWI is called blood-oxygen-level dependent (BOLD) technique.
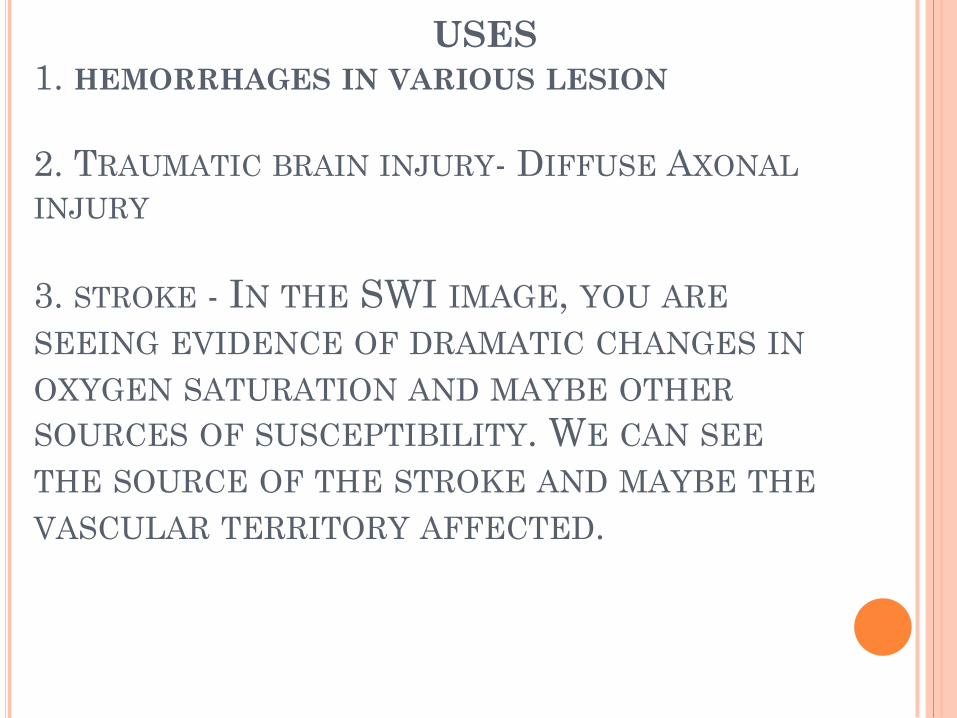
USES 1. HEMORRHAGES IN VARIOUS LESION 2. TRAUMATIC BRAIN INJURY- DIFFUSE AXONAL INJURY 3. STROKE - IN THE SWI IMAGE, YOU ARE SEEING EVIDENCE OF DRAMATIC CHANGES IN OXYGEN SATURATION AND MAYBE OTHER SOURCES OF SUSCEPTIBILITY. WE CAN SEE THE SOURCE OF THE STROKE AND MAYBE THE VASCULAR TERRITORY AFFECTED.

4. In Brain Tumors : ¢ Understanding the angiographic behaviour of lesions both
from the perspective of angiogenesis and micro-hemorrhages. ¢ Leads to better contrast in detecting tumor boundaries and
tumor hemorrhage 5. Multiple sclerosis ¢ SWI adds by revealing the venous connectivity in some
lesions and presents evidence of iron in some lesions. 6. Vascular dementia and cerebral amyloid angiopathy (CAA) 7. Sturge-Weber disease:

DIFFUSION MRI ¢ Based on echo planar imaging.
¢ Diffusion of contrast depends on Brownian motion of free proton.
¢ Restriction of motion appears as high signal intensity.
¢ Water molecules that are not “restricted” will have greater net diffusion over a given period of time than water molecules surrounded by cell organelles membranes, large proteins etc.
¢ High signal is inversely proportional to ADC.
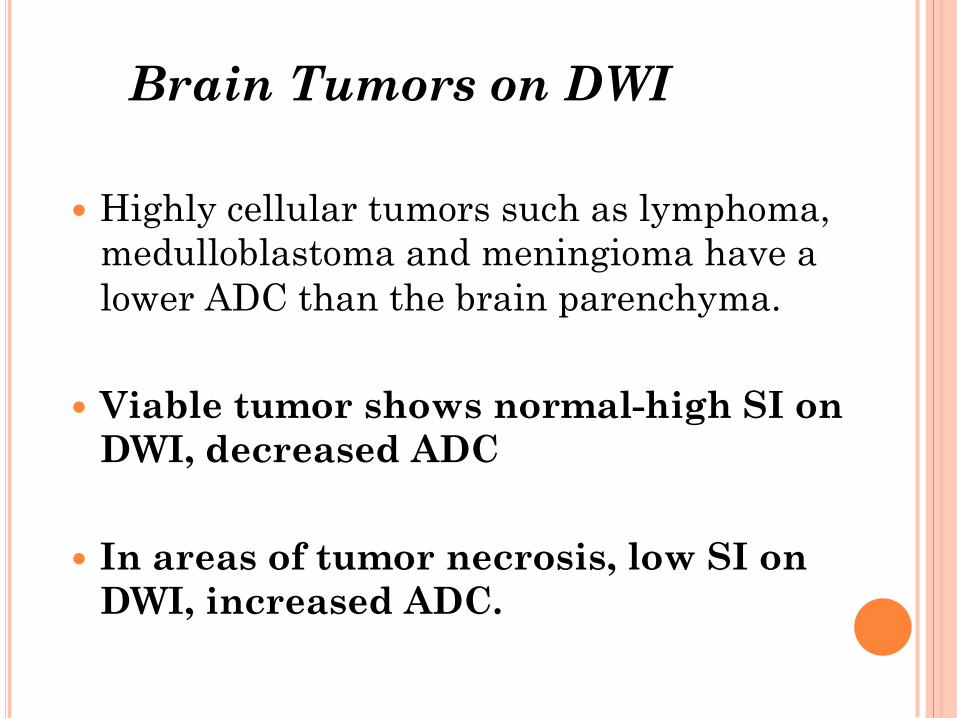
Brain Tumors on DWI
� Highly cellular tumors such as lymphoma, medulloblastoma and meningioma have a lower ADC than the brain parenchyma.
� Viable tumor shows normal-high SI on
DWI, decreased ADC
� In areas of tumor necrosis, low SI on DWI, increased ADC.

USES ¢ DWI is highly sensitive in identifying hyperacute(0-6hr)
& acute infarction(6-24hr), within minutes of occlusion, while conventional MRI takes 6-10 hours. MRI can help to define : � acutely ischemic region (DWI) � the tissue at risk for further ischemia (PWI) � vascular anatomy (MRA)

� Abscess shows : decreased diffusion & increased signal intensity.
� As Abscess cavity: numerous WBCs & proteinaceous fluid with high viscosity.
� Restricted
diffusion -low ADC values high signal intensity on DWI.

• Necrotic or cystic tumors (low SI, high apparent diffusion coefficient (ADC)
� In contrast, the cystic or
necrotic portions of brain tumors : less cellular and have less viscous fluid consistency.
� Tumors show low signal
intensity on DWI and higher ADC values.

• DIFFERENTIATION OF THE ARACHNOID CYST VS EPIDERMOID ARACHNOID CYST -LOW SIGNAL INTENSITY EPIDERMOID CYSTS - HIGH SIGNAL
a, Echo-planar DW imaging reveals the tumor as a sharply
hyperintense lesion (arrows) relative to the brain and CSF.
b, ADC map shows that the intensity of the tumor is similar to that of surrounding brain tissue but much different from that of CSF.

DIFFUSION TENSOR IMAGING
¢ Special diffusion technique capable of demonstrating white matter tracts and their relationship to lesions.
¢ BASIS: Detection of preferential motion of water
along white matter fiber tracts. ¢ FRACTIONAL ANISOTROPY(FA)-ALIGNMENT OF
INTEGRITY ¢ Tensor is a map of directional vectors in 3d space

USES
¢ Intraoperative Neuronavigation Using Diffusion Tensor Tractography e.g. Tract, optic radiation. Resection of a deep tumor adjacent to the Corticospinal tract.
¢ This enables researchers to make brain maps
of fiber directions to examine the connectivity of different regions in the brain.
¢ To examine areas of neural degeneration &
demyelination in diseases like Multiple Sclerosis (white matter diseases).

PERFUSION MRI
¢ Perfusion MRI techniques are sensitive to microscopic levels of blood flow.
¢ CONTRAST PASSAGE CAUSES SIGNAL LOSS
¢ Gadolinium causes loss of MR signal, � most marked on T2* (gradient echo) - weighted � T2 (spin echo) weighted sequences – � caused by the magnetic field distorting effects of
paramagnetic substances.

¢ Passage of contrast causes drop in signal intensity –calculate rate of change of T2* � LINEARLY PROPORTIONAL TO CONTRAST
CONCENTRATION.
¢ Contrast concentration time course in each voxel is analysed.
¢ Data is analysed to calculate
� Relative cerebral blood volume (rCBV). � Mean transit time (contrast arrival time to time to peak
contrast concentration) – MTT. � Relative cerebral blood flow (rCBF).

USES Infarction: Delay in mean transit time, reduction in cerebral blood volume, reduced cerebral blood flow.

¢ Perfusion MRI may be a valuable tool for characterizing and monitoring ischemia in Moya Moya disease.
¢ Has potential role comparable to SPECT in
the evaluation of Moya Moya disease.
MAGNETIC RESONANCE ANGIOGRAPHY
1. Time of Flight MR Angiography
2. Phase Contrast MR Angiography
3. Contrast Enhanced MR Angiography
1. TIME-OF-FLIGHT SEQUENCES • 2D & 3D "flow-related
enhancement“ • where most of the signal on
an image is due to blood which has recently moved into that plane.
• Vascular flow map rather than anatomic map.

2.PHASE CONTRAST MRA :
� Utilizing the change in the phase shifts of the flowing protons. two data sets with a different amount of flow sensitivity are acquired.
� longer acquisition time than TOF.
� It can produce anatomic information ,velocity & direction of blood flow.
� Selective venous & arterial images can be obtained.

3. ADMINISTRATION OF A PARAMAGNETIC CONTRAST AGENT (GADOLINIUM) MRA
• Standard for extracranial vascular MRA.
During bolus infusion TOF sequence is used. • Better evaluates intracranial aneurysms and
post coiling follow up of aneurysm. • Also good in delineating draining veins and
nidus of AVM

USES
1. Excellent for screening of stenosis, occlusion, dissections in carotids of neck.
2. Useful for noninvasive diagnosis of
intracranial aneurysm/vascular malformations.
3. ICA & initial branches of ACA, MCA & PCA can be assessed.

DRAWBACKS ¢ Spatial resolution is poor compared to
conventional angiography. Detection of small vessel diseases is problematic.
¢ MRA is also less sensitive to slow flowing blood
and may not reliably differentiate complete from near- complete occlusion.
¢ Motion artifacts by patient or anatomic structure
may distort image.
¢ Signal loss in complex flow.
MAGNETIC RESONANCE SPECTROSCOPY
¢ Measure the levels of different metabolites in body tissues-Provides ‘metabolic signature' of tissue. ¢ Studying the chemical composition of living tissue NON INVASIVELY. ¢ Chemical elements used: hydrogen, phosphorus, carbon. ¢ Proton (1H) resonance is nowadays the method
most frequently used in neuro spectroscopy.
� Most abundant atom in the human body nucleus. � Emits the most intense radiofrequency signal, when in
an external magnetic field.

¢ Chemical shift is measured
in Hz or parts per million (ppm). The preferred unit is ppm.
¢ NAA 2.0 ppm ¢ Cr 3.0 ¢ Cho 3.2 ¢ Lac 1.3 ¢ Lip0 0.8-1.4

¢ N-acetyl aspartate : NEURONAL INTEGRITY ¢ Choline : CELL TURNOVER ¢ Myoinositol –ASTROCYTE MARKER ¢ Amino acids are encountered in brain abscesses.
Astrocyte marker ¢ Lipids-always pathological-The presence of lipids
is related to necrotic processes. ¢ Creatine-marker of intact brain metabolism ¢ lactate: ANAEROBIC GLYCOLYSIS
USES ¢ Differential diagnosis of focal brain lesions (neoplastic & non-neoplastic diseases).
� Gliomas : Decreased intensity of the N-acetyl aspartate peak and increased choline occur. � Lactate peaks may be found ,independent of their malignancy grade, indicating hypoxia.
� Most non- glial tumors have little or no NAA. � High grade glioma – exhibit higher Cho/Cr and Cho/
NAA ratio.
§ Multi- voxel spectroscopy is best to detect infiltration of malignant cells beyond the enhancing margins of tumors.
TUMOR RECURRENCE VS. RADIATION EFFECTS � Elevated choline is a marker for recurrent tumor. � Radiation change generally exhibits low NAA, creatine & choline . � If radiation necrosis is present, the spectrum may reveal elevated
lipids & lactate.

INFLAMMATORY & INFECTIOUS PROCESSES
§ Tuberculosis
v MRS shows a broad lipid peak & occasionally a lactate peak, with a decrease or absence of N-acetyl aspartate & slight
increase of choline.

PYOGENIC ABSCESS
• Amino acid peaks, especially succinate, acetate.-due to the great quantity of hydrolytic enzymes produced by bacteria.
• Lactate peak-due to anaerobic metabolism
• N-acetyl aspartate, creatine and choline peaks are not detected.
ISCHEMIC LESIONS
• Early appearance of a lactate peak. –anaerobic metabolism
• Decrease of N-acetyl aspartate-neuronal loss
• Slight increase of choline-membrane degradation
FUNCTIONAL MRI ¢ Functional MRI (fMRI) measures signal changes in
the brain that are due to changing neural activity.
¢ Scanning low resolution but at a rapid rate (typically once every 2-3 seconds).
¢ Increases in neural activity cause changes in the MR signal via T2* changes.
¢ BOLD (blood-oxygen-level dependent):
imaging examines changes in local tissue oxygenation to exploit the magnetic property changes of Hb as an intrinsic contrast agent.
¢ Activity increases demand for O2, vascular system over compensates for this, increasing the amount of oxygenated Hb relative to deoxygenated Hb.
¢ Because deoxygenated Hb attenuates the
MR signal (less paramagnetic), the vascular response leads to a signal increase.
¢ Change in intensity at 1.5T images are
repeatedly acquired at same location over course of stimulus using EPI sequence.

INITIAL 10 PRE-STIMULATION (BASELINE) IMAGES ARE FOLLOWED BY 10 ACTIVATION IMAGES (LEFT HAND STIMULATION) AND 10 POST-STIMULATION IMAGES

¢ LOCALISES: 1. Visual cortex 2. Motor cortex 3. Somatosensory cortex 4. Broca's area of speech 5. language-related activities. 6. Memory area

ADVANTAGES OF FMRI
1. Does not require injections of radioactive isotopes, (PET requires it).
2. The total scan time required can be very short, i.e. in
the order of 1.5 to 2.0 min per run.

1. ROLE IN NEUROSURGICAL PLANNING:
� When the presence of a tumor alters the expected location .
� Uncertain function such as association cortex or language-related processes.

2. FUTURE ROLE IN PAIN MANAGEMENT
Identification of cortical areas that are modified by the reduction of pain following pain therapy using fMRI to investigate cortical representations of specific pain types.
3. ROLE IN UNDERSTANDING THE
PHYSIOLOGICAL BASIS FOR NEUROLOGICAL DISORDERS
fMRI may contribute to improved precision of seizure localization & understanding of seizure progression & suggests a future direction for investigation.

INTRAOPERTATIVE MRI
¢ Provides real time image guidance . ¢ Open magnet design/horizontal flat plane design. ¢ Patient is wheeled In & out for imaging. ¢ All anesthesia equipment & microscope has to be MR
compatible.

USES
¢ For craniotomy- gliomas , especially near eloquent cortex, deep seated. ¢ For biopsy of deep seated lesions.
¢ Transsphenoidal surgery : MR used to optimize angle of entry in sella. � Intraop normal gland versus tumor can be identified. � Resection guided in large tumors with parasellar extension.
¢ Surgery for Intracranial cysts :

ADVANTAGES
¢ Accurate real time localization. ¢ Increased safety of approach through choice of optimal
trajectory. ¢ Definite intraoperative identification of surrounding
structures & their relationship to surgical anatomy. ¢ Immediate evaluation of extent of resection. ¢ Monitoring of any intraoperative complication e.g.
hemorrhage.
IMAGE FUSION
¢ Image fusion (exactly overlapping the images in three dimensional space) bring all of the above information together in the operating room.
¢ Intra operative image fusion. gives a "road map“ showing unique features of the tumor as well as the location of critical structures that is must to preserve speech, walking and other functions. ¢ MP-RAGE: 3D T1 WT with contrast to make a surgical road map for IMAGE GUIDANCE SURGERY.
CINE PHASE CONTRAST MRI
• Can demonstrate qualitatively & quantitatively alterations in CSF flow during the cardiac cycle.
• Synchronizes MR data acquisition to a motion cycle to enable imaging of moving tissue.
• Cine MRI collects image data over many cycles of periodic motion.
• Used for evaluating cranial & spinal CSF flow.

USES
1. Physiology of the normal CSF circulation.
2. Pathological CSF flow dynamics in communicating & obstructive hydrocephalus, Chiari malformation, syrinx.
3. Cine MR imaging has been recommended for evaluating the patency of third ventriculostomies.
4. Cerebrospinal Fluid Flow After Endoscopic Aqueductoplasty.

¢ Cine MRI, return of CSF flow represented by the white space behind the cerebellar tonsils after decompression(white arrow)
¢ Cine MRI: On the left,no posterior flow(arrow) in a patient before decompressionof their Chiari I malformation

MP-RAGE
¢ MP-RAGE (magnetization-prepared rapid acquisition with gradient echo):
¢ Volume Sequence with High Resolution ¢ Decrease Acquisition time ¢ Reconstruction is possible ¢ Useful : - Neuronavigation - Gamma Knife Therapy - Multiple sclerosis cortical lesions ¢ Disadvantage- Leptomeningeal enhancement less

POST CONTRAST MP RAGE BRONCHOGENIC CA WITH MULTIPLE METS

M T ( MAGNETISATION TRANSFORMATION) AND MTR
¢ The water with restricted motion is generally conceived as being bound to macromolecules, such as proteins and lipids through a series of hydrogen bonds.
¢ Hydrated water molecules are slowed down by extensive interactions with the protons in the local macromolecules and hence magnetic field inhomogeneities are created that lead to wider resonance frequency spectrum.
¢ MT is believed to be a nonspecific indicator of the structural integrity of the tissue being imaged.

¢ An extension of MT, the magnetization transfer ratio (MTR) has been used in neuroradiology to highlight abnormalities in brain structures.
USES : ¢ Multiple Sclerosis ¢ Stroke ,Ischemic vascular dementia ¢ CNS tuberculosis ¢ Brain tumours ¢ Mild head trauma ¢ Frontal lobe epilepsy ¢ Muscular dystrophy , ¢ Alzheimer’s disease .

THANKYOU