Embed Size (px)
Citation preview
Results for year ended 31 December 2016
Ewan Phillips, CEOJonathan Shaw, FD
April 2017
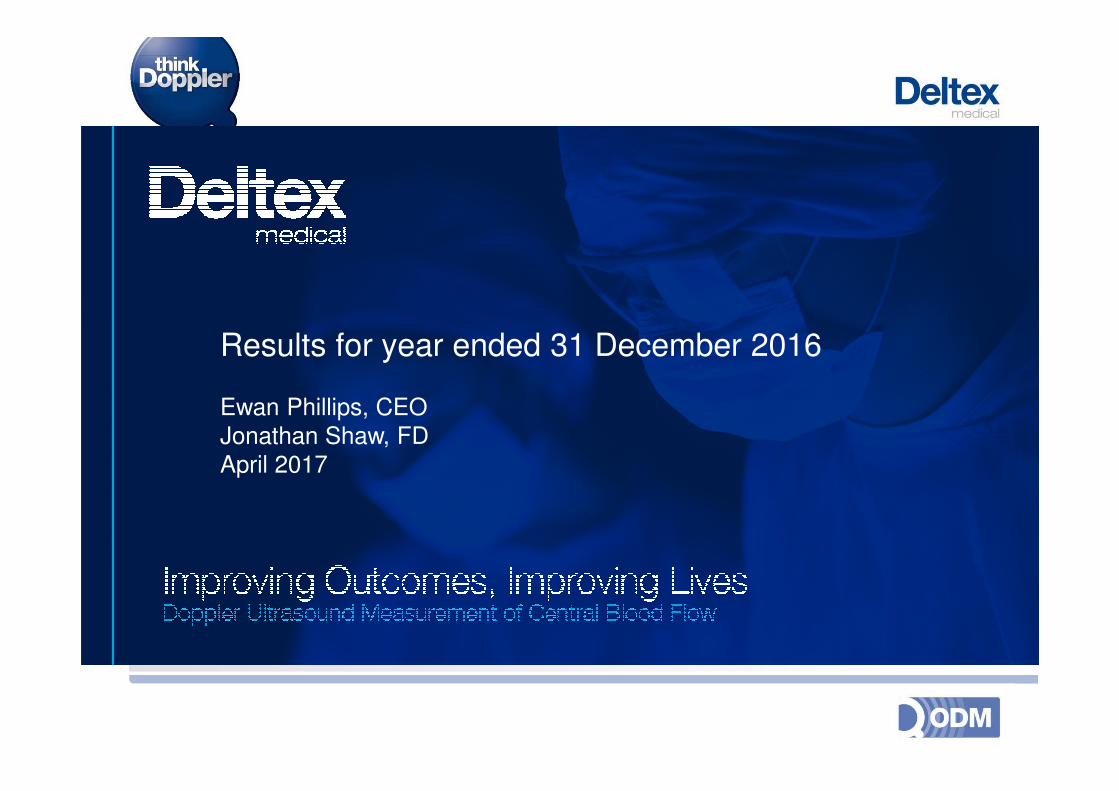
Proven: ODM fluid management halves
post-op complications
2© 2016
© 2017
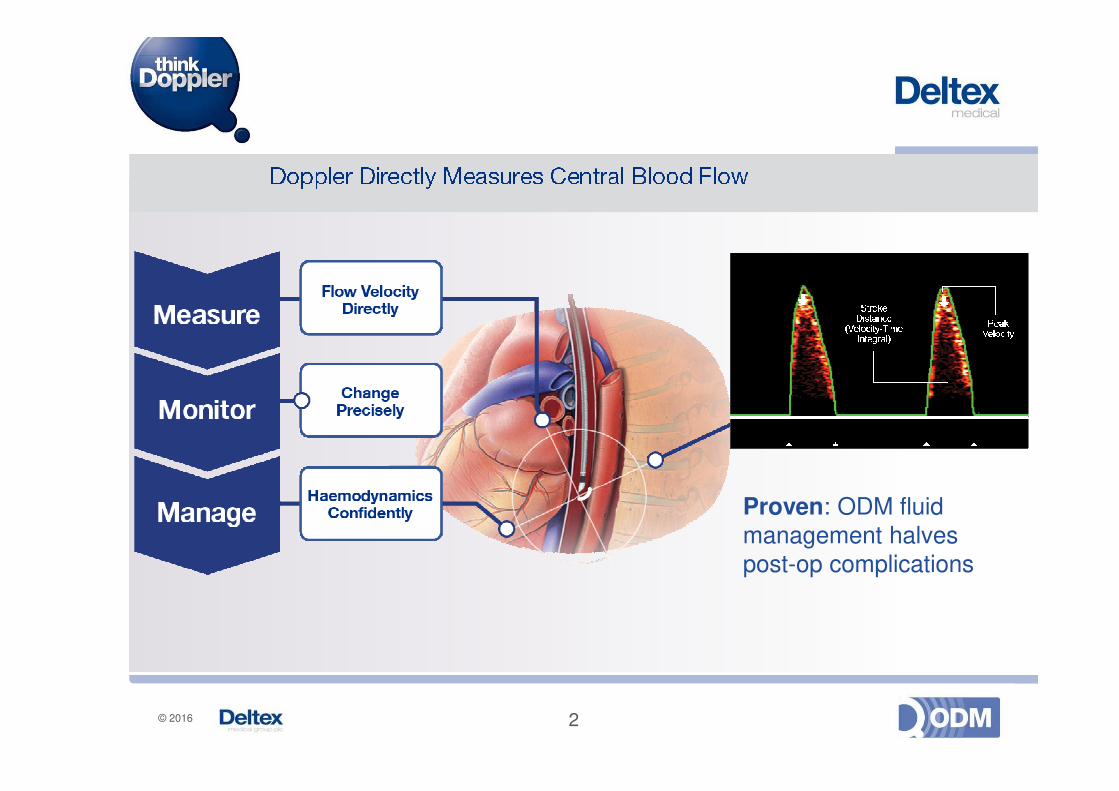
• Consumable revenues up 5% at £5.8m (2015: £5.5m)
• US probe revenues up 40% to £1.9m• 28 platform a/cs at 31 December, up from 17
• 25% growth in local currency with sterling sales overtaking UK
• International probe revenues up 25% at £1.7m
• UK probe revenues down 26% at £1.9m• Signs of stabilisation: new probes and new evidence
• Gross margin on consumables up to 74% (2015: 70%)
• Monitor revenues down £0.2m at £0.4m
• Cash position £0.6m: additional £0.4m raised in March
Financial highlights – 2016 progress
3
© 2017
• Probe revenues returned to growth: up 14% on H2 15• Strong growth in export markets: volumes up plus pound weaker
• H2: US up 40%, International up 30%
• H2 UK down 17% (H1: down 36%)
• Substantially reduced operating loss• H2 operating loss £0.6m down >50% (H2 15: £1.3m)
• £1m+ annualised cost savings before forex came through in H2
• Substantially reduced cash consumption• H2 operating loss before non-cash costs of £0.2m (H2 15: £1.0m)
• H2 total cash consumption halved to <£0.4m
Financial highlights – second half progress
4
© 2017
• 30th US platform account in place from January• Redeploying US resources to better match platform distribution
• March probe margin higher than fixed staff costs for first time
• UK Q1 2017 revenues slightly ahead of Q1 2016• 10% fall in probe revenues offset by monitor sales and 3rd party
• International on track but behind Q1 2016• Increased monthly probe order from France; other regulars up or maintained
• Timing differences on low margin monitor orders
• All probe tip assembly in-house from January: £30,000+ per month saving
• Successful field trials of embedded impedance technology: launch pending
• EU pilot grant €50,000 awarded re VP loop Graphical User Interface
YTD 2017 progress
5
© 2017
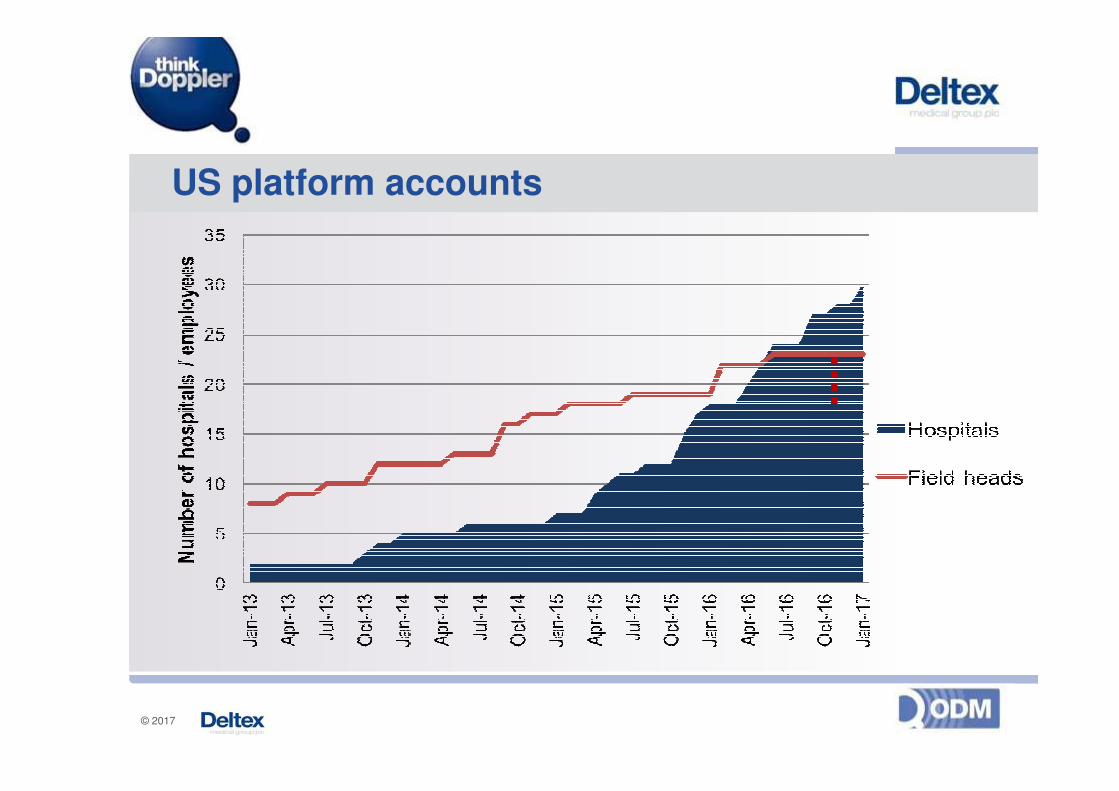
US platform accounts
© 2017
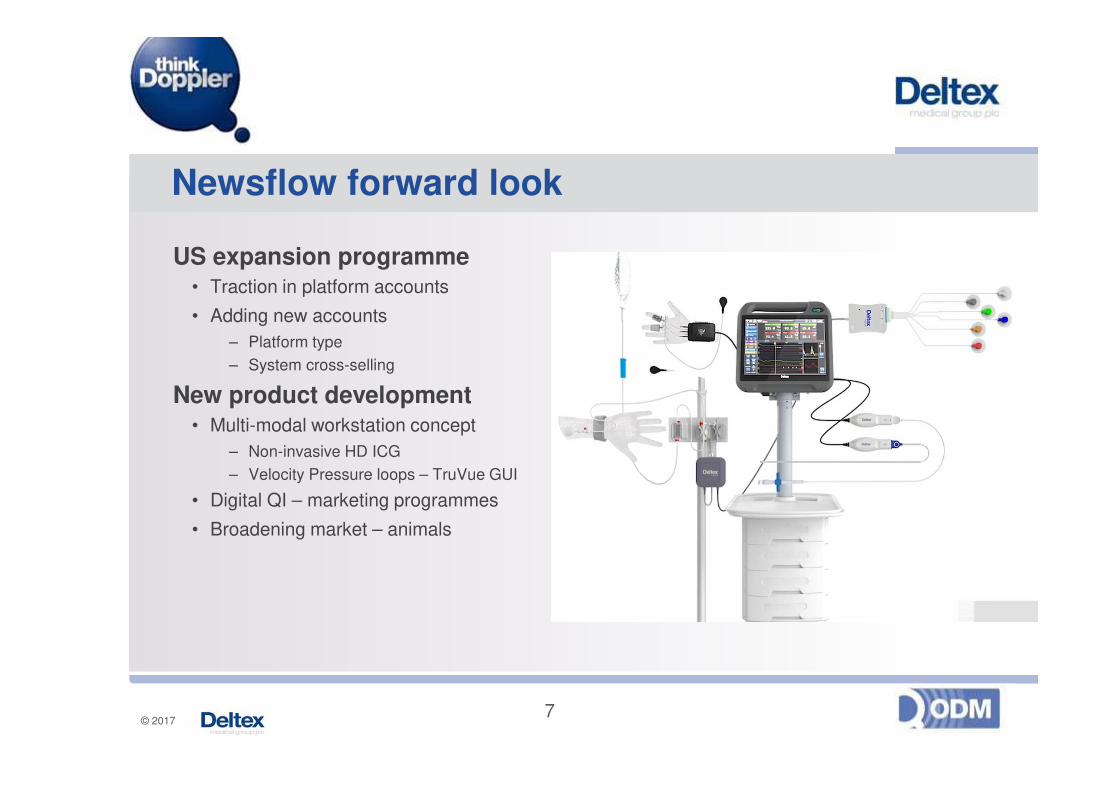
Newsflow forward look
US expansion programme• Traction in platform accounts
• Adding new accounts
– Platform type
– System cross-selling
New product development• Multi-modal workstation concept
– Non-invasive HD ICG
– Velocity Pressure loops – TruVue GUI
• Digital QI – marketing programmes
• Broadening market – animals
7
© 2017
Summary
• US growth rate continuing to improve
• Target of 30 platform accounts• Achieved in January: 28 at year end
• Focus shift from evaluations to implementations: spread best practice
• Redeploying resources to match platform constituents
• March first month where probe margin covered regular US staff costs
• UK trends improving, signs of stabilising
• Manufacturing margin improvement validated and underway
• Positioned for returns from investment in product development
8
© 2017
Appendices
9
© 2017
Appendix A
Summary financial information
10
© 2017
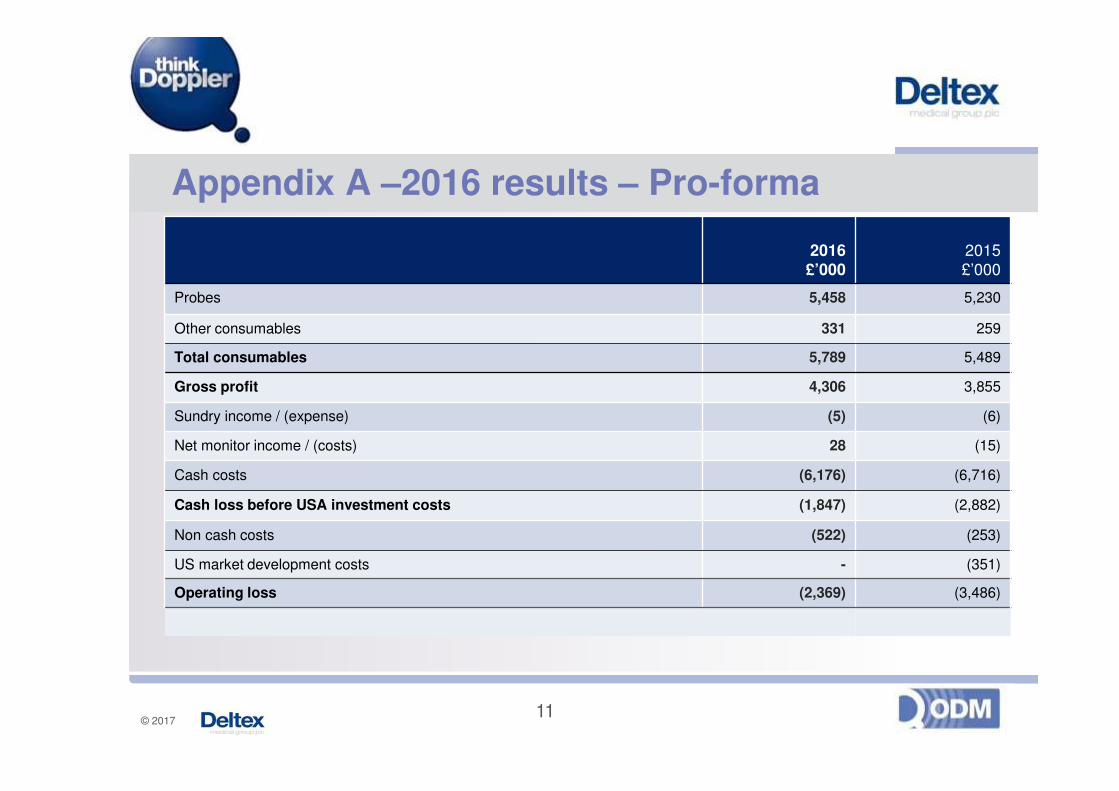
Appendix A –2016 results – Pro-forma
11
2016£’000
2015£’000
Probes 5,458 5,230
Other consumables 331 259
Total consumables 5,789 5,489
Gross profit 4,306 3,855
Sundry income / (expense) (5) (6)
Net monitor income / (costs) 28 (15)
Cash costs (6,176) (6,716)
Cash loss before USA investment costs (1,847) (2,882)
Non cash costs (522) (253)
US market development costs - (351)
Operating loss (2,369) (3,486)
© 2017
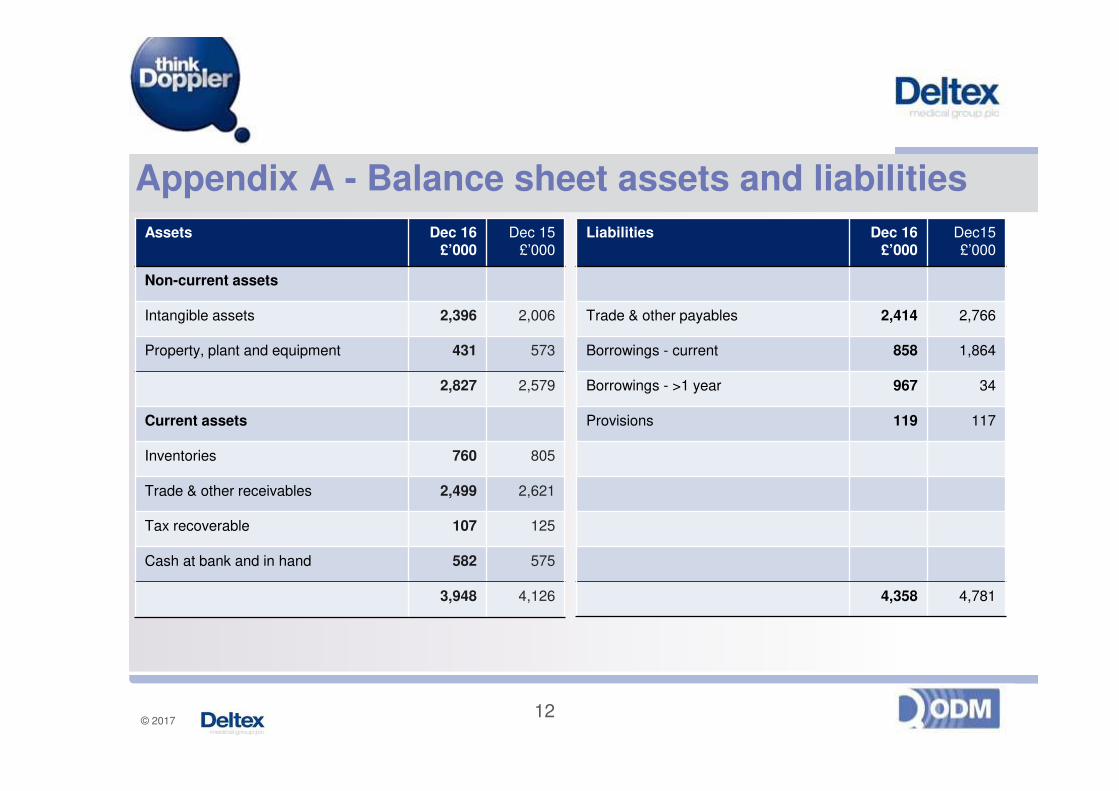
Appendix A - Balance sheet assets and liabilities
12
Liabilities Dec 16£’000
Dec15£’000
Trade & other payables 2,414 2,766
Borrowings - current 858 1,864
Borrowings - >1 year 967 34
Provisions 119 117
4,358 4,781
Assets Dec 16£’000
Dec 15£’000
Non-current assets
Intangible assets 2,396 2,006
Property, plant and equipment 431 573
2,827 2,579
Current assets
Inventories 760 805
Trade & other receivables 2,499 2,621
Tax recoverable 107 125
Cash at bank and in hand 582 575
3,948 4,126
© 2017
Appendix B
13
Addressing previously unmet clinical need


Proven: ODM fluid management halves
post-op complications