Embed Size (px)
Citation preview
NURSES IN NEW JERSEY NEW JERSEY NURSE WORKFORCE REPORT
NEW JERSEY COLLABORATING CENTER FOR NURSING
2013-2014
NJCCN delivering Leadership, Education, Research, and Innovation for a strong nursing workforce dedicated to quality care for New Jersey citizens.
NURSES IN NEW JERSEY
NEW JERSEY NURSE WORKFORCE REPORT
2013-2014
NJCCN Staff
Edna Cadmus PhD, RN, NEA-BC, FAAN Executive Director
Mary L. Johansen, PhD,RN, NE-BC Associate Director
Pamela B. de Cordova, PhD, RN-BC Research Faculty
Miguel Martinez, MA, PhD Candidate Project Analyst
Allison Creary -Cornelius Department Administrator
1
NEW JERSEY COLLABORATING CENTER FOR NURSING BOARD
NEW JERSEY COLLABORATING CENTER FOR NURSING ADVISORY GROUP
ACKNOWLEDGEMENT The New Jersey Collaborating Center for Nursing would like to thank the New Jersey Board of Nursing for its support and all of the licensed New Jersey registered nurses who took the time to complete the survey that provided data for this report. Without their efforts it would not be possible to estimate the findings that are included in this report.
NJCCN BOARD MEMBER REPRESENTING
Maria Brennan, MSN, RN, CPHQ New Jersey Organization of Nurse Executives Evadne Adina Harrison-Madu, Ph.D., MSN, RN. Practical Nurse Educators Council of NJ Vicki Hasser, MSW, LCSW Consumer of Health Aline Holmes, DNP, RN, APNC New Jersey Hospital Association Barbara George Johnson, Esq. Consumer of Health
Michele McLaughlin, RN, MSN, CPAN HealthCare Facility Staff Nurse Ann Painter, RN, MSN Association New Jersey Home Care Linda Parry-Carney, MA, RN-BC New Jersey State Nurses Association
Carol Patterson, MSN, RN, CNE New Jersey League for Nursing
Neddie Serra, EdD, CNE, MSN, RN New Jersey Baccalaureate and Higher Degree Programs in Nursing
Muriel M. Shore, EdD, RN, NEA-BC, DPNAP New Jersey State Nurses Association
Donna Stankiewicz, MSN, RN New Jersey Council of Associate Degree Nursing Programs
Susanne Sorace, MSN, RN, CNE Association of Diploma Schools of Professional Nursing
Susan H. Weaver, MSN, RN, CRNI, NEA-BC New Jersey State Nurses Association (NJSNA)
NJCCN ADVISORY COUNCIL MEMBER REPRESENTING Darlene Cox, MS, RN, FACHE New Jersey Council of Teaching Hospitals Karen Gentile, RN, DON Health Care Association of New Jersey Laura Mularz, DNP, RN, APRN, ACNS-BC, NE-BC Organization of Nurse Executives of New Jersey Yvonne Wesley RN, PhD, FAAN New Jersey State Nurses Association Teri Wurmser, PhD, MPH, RN New Jersey State Nurses Association
2
TABLE OF CONTENTS
NJCCN BOARD MEMBER ........................................................................................................................... 2
REPRESENTING ............................................................................................................................................ 2
NEW JERSEY COLLABORATING CENTER FOR NURSING BOARD ............................................................. 2
NEW JERSEY COLLABORATING CENTER FOR NURSING ADVISORY GROUP........................................... 2
ACKNOWLEDGEMENT ................................................................................................................................. 2
LIST OF TABLES ............................................................................................................................................ 4
LIST OF FIGURES .......................................................................................................................................... 4
DISTRIBUTION OF RN RESPONDENTS BY REGION ................................................................................... 7
DISTRIBUTION OF RN RESPONDENTS BY COUNTY .................................................................................. 8
RN EMPLOYMENT CHARACTERISTICS ..................................................................................................... 10
UNEMPLOYMENT REASONS AND INTENTIONS AMONG RNS ................................................................ 14
LICENSED PRACTICAL NURSE (LPN) PROFILE ....................................................................................... 16
DISTRIBUTION OF LPN RESPONDENTS BY REGION .............................................................................. 17
DISTRIBUTION OF LPN RESPONDENTS BY COUNTY .............................................................................. 18
NUMBER OF STATES LPN PRACTICING ................................................................................................... 19
LPN EMPLOYMENT CHARACTERISTICS ................................................................................................... 20
EMPLOYMENT INTENTIONS AMONG UNEMPLOYED LPNS .................................................................. 24
FIGURE 14. LPN NATIONAL STATISTICS ................................................................................................. 25
ADVANCED PRACTICE NURSE (APN) PROFILE ...................................................................................... 26
DISTRIBUTION OF APN RESPONDENTS BY REGION .............................................................................. 27
REGIONAL/COUNTY APN DATA ............................................................................................................ 27
DISTRIBUTION OF APN RESPONDENTS BY COUNTY ............................................................................. 28
NUMBER OF STATES APN PRACTICING ................................................................................................... 29
APN EMPLOYMENT CHARACTERISTICS ................................................................................................... 30
EMPLOYMENT INTENTIONS AMONG UNEMPLOYED APNS ................................................................. 34
LIMITATIONS .............................................................................................................................................. 36
RECOMMENDATIONS ................................................................................................................................. 36
SUMMARY ................................................................................................................................................... 36
WORKFORCE SURVEY QUESTIONS ........................................................................................................... 37
3
LIST OF TABLES TABLE 1. REGISTERED NURSE DEMOGRAPHIC CHARACTERISTICS……………………………………………………6 TABLE 2. RN EMPLOYMENT PROFILE…………………………………………………………………………………… 10 TABLE 3. RN PRIMARY & SECONDARY SETTING……………………………………………………………………….12 TABLE 4. RN INTENTIONS AMONG UNEMPLOYED.………………………………………………………………… 14 TABLE 5. RN REASON FOR UNEMPLOYED………………………………………………………… ……………………14 TABLE 6. REGISTERED NURSE DEMOGRAPHIC CHARACTERISTICS………………………………………..………...16 TABLE 7. LPN EMPLOYMENT PROFILE………………………………………………………………..………………....20 TABLE 8. LPN PRIMARY & SECONDARY SETTING……………………………………………...………………………22 TABLE 9. INTENTIONS AMONG LPN UNEMPLOYED………………………………………..………………………...24 TABLE 10. REASON FOR LPNS UNEMPLOYED………………………………………………………………………….24 TABLE 11. APN DEMOGRAPHIC CHARACTERISTICS…………………………………………………………..……….26 TABLE 12. APN EMPLOYMENT PROFILE……………………………………………………………………….……….30 TABLE 13. APN PRIMARY & SECONDARY SETTING……………………………………………………….…………..32 TABLE 14. INTENTIONS AMONG UNEMPLOYED……………………………………………………………………….34 TABLE 15. REASONS FOR UNEMPLOYED………………………………………………………………………..………..34
LIST OF FIGURES FIGURE 1. DISTRIBUTION OF RN RESPONDENTS REGION……………………………………………………………..7 FIGURE 2. RN MAP BY COUNTY…………………………………………………………………………………………......8 FIGURE 3. RN NUMBER OF STATE CURRENTLY PRACTICE……………………………………………………………..9 FIGURE 4. RN PRIMARY SETTING…………………………………………………………………………….…………...11 FIGURE 5. RN SECONDARY SETTING……………………………………………………………………………………..11 FIGURE 6. RN AVERAGE AGE BY PRIMARY SETTING……………………………………….………………..………..13 FIGURE 7. RN NATIONAL STATISTICS………………………………………………………………………...………….15 FIGURE 8. DISTRIBUTION OF LPN RESPONDENTS REGION………………………………………………….………17 FIGURE 9. LPN MAP BY COUNTY……………………………………………………………………………………….…18 FIGURE 10. NUMBER OF STATE CURRENTLY PRACTICE……………………………………………………….………19 FIGURE 11. LPN PRIMARY SETTING …………………………………………………………………………...……….21 FIGURE 12. LPN SECONDARY SETTING………………………..………………………………………………………...21 FIGURE 13. LPN AVERAGE AGE BY PRIMARY SETTING…………………………………….………………………...23 FIGURE 14. LPN NATIONAL STATISTICS……………………………………………………………………….………..25 FIGURE 15. DISTRIBUTION OF APN RESPONDENTS REGION………………………………………………………..27 FIGURE 16. APN MAP BY COUNTY………………………………………………………………………………………..28 FIGURE 17. APN NUMBER OF PRACTICING STATES……………………………………….…………………….……29 FIGURE 18. APN PRIMARY SETTING……………………………………………………………..…………….………...31 FIGURE 19. APN SECONDARY SETTING………………………………………………………….…………….………..31 FIGURE 20. APN AVERAGE AGE BY PRIMARY SETTING...………….…………………………………….…………..33 Figure 21. APN National Statistics ………………………………………………………………………………...35 Figure 22. Prescriptive Authority....………………………………………………………………………………..35
4
INTRODUCTION The New Jersey Collaborating Center for Nursing was established by legislation on December 12, 2002. The Center works on behalf of nurses to provide evidence-based recommendations regarding the nursing workforce and its impact on patient care. The Center is in Rutgers University, School of Nursing, Newark and New Brunswick Campuses. We are guided by a 17-member board representing New Jersey nursing and healthcare stakeholders.
VISION To be the dominant voice on nursing workforce solutions for New Jersey citizens.
MISSION • Ensure that competent future oriented, diverse nursing providers are available in sufficient numbers and preparation to meet the demand of the evolving healthcare system in New Jersey • Transform the healthcare system through research and innovative model programs. • Create a central repository for education practice, and research related to nursing workforce. • Engage academic/practice partners, inter-professional colleagues, government and legislative agencies, consumers, business and industry in workforce solutions. • Promote a positive image for nursing.
PURPOSE The purpose of this report is to provide data on the current nursing workforce, i.e. current supply of nurses in New Jersey that are licensed. This report encompasses the years 2013 and 2014 to ensure a full picture of the licensed workforce METHODOLOGY Each year a third party vendor hired by the New Jersey Board of Nursing collects data on nursing workforce in New Jersey. The NJCCN is responsible for the analysis of this data. This report is broken down by licensure levels, Licensed Practical Nurse, Registered Nurse and Advanced Practice Nurse. In each licensure level demographics, regional and county distribution, employment characteristics and employment intentions among those unemployed were analyzed.
This is the first time a report on the nursing workforce in New Jersey has been analyzed and reported since 2007. Therefore, no trends can be derived. Additionally, there were responses in several questions that did not appear to be clear to the respondents, therefore data received were not reported.
5
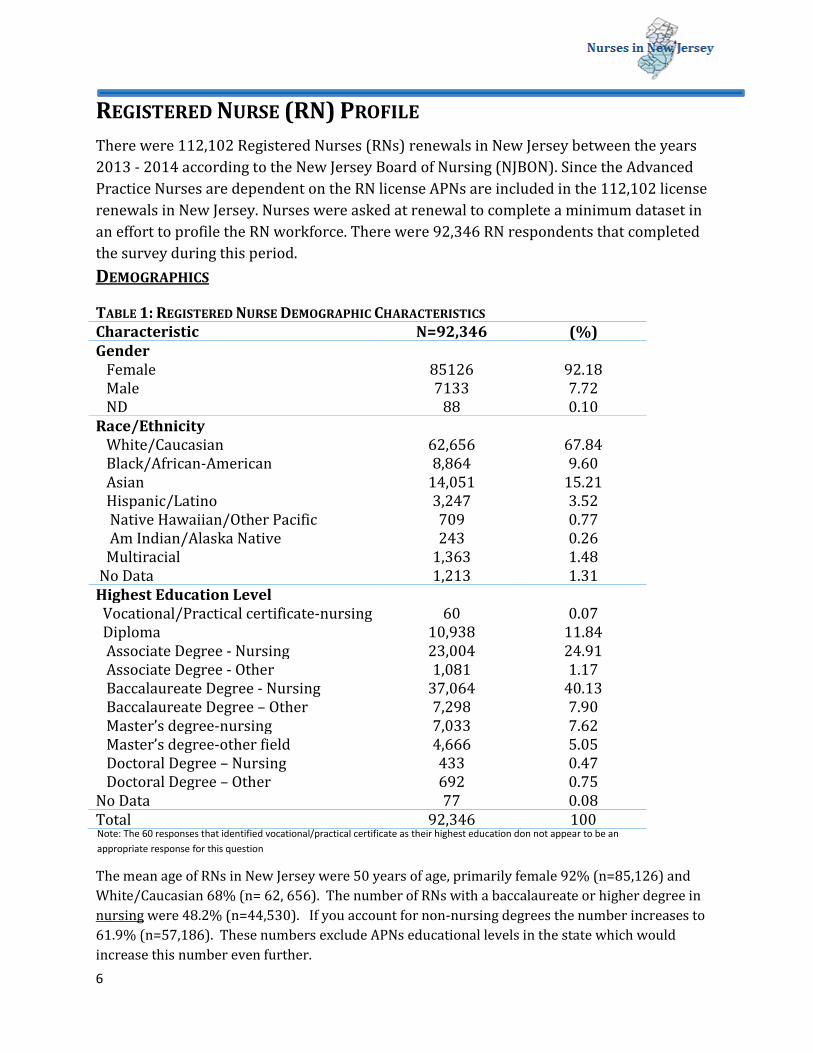
REGISTERED NURSE (RN) PROFILE There were 112,102 Registered Nurses (RNs) renewals in New Jersey between the years 2013 - 2014 according to the New Jersey Board of Nursing (NJBON). Since the Advanced Practice Nurses are dependent on the RN license APNs are included in the 112,102 license renewals in New Jersey. Nurses were asked at renewal to complete a minimum dataset in an effort to profile the RN workforce. There were 92,346 RN respondents that completed the survey during this period. DEMOGRAPHICS
The mean age of RNs in New Jersey were 50 years of age, primarily female 92% (n=85,126) and White/Caucasian 68% (n= 62, 656). The number of RNs with a baccalaureate or higher degree in nursing were 48.2% (n=44,530). If you account for non-nursing degrees the number increases to 61.9% (n=57,186). These numbers exclude APNs educational levels in the state which would increase this number even further.
TABLE 1: REGISTERED NURSE DEMOGRAPHIC CHARACTERISTICS Characteristic N=92,346 (%) Gender Female 85126 92.18 Male 7133 7.72 ND 88 0.10 Race/Ethnicity White/Caucasian 62,656 67.84 Black/African-American 8,864 9.60 Asian 14,051 15.21 Hispanic/Latino 3,247 3.52 Native Hawaiian/Other Pacific 709 0.77 Am Indian/Alaska Native 243 0.26 Multiracial 1,363 1.48 No Data 1,213 1.31 Highest Education Level Vocational/Practical certificate-nursing 60 0.07 Diploma 10,938 11.84 Associate Degree - Nursing 23,004 24.91 Associate Degree - Other 1,081 1.17 Baccalaureate Degree - Nursing 37,064 40.13 Baccalaureate Degree – Other 7,298 7.90 Master’s degree-nursing 7,033 7.62 Master’s degree-other field 4,666 5.05 Doctoral Degree – Nursing 433 0.47 Doctoral Degree – Other 692 0.75 No Data 77 0.08 Total 92,346 100 Note: The 60 responses that identified vocational/practical certificate as their highest education don not appear to be an appropriate response for this question
6
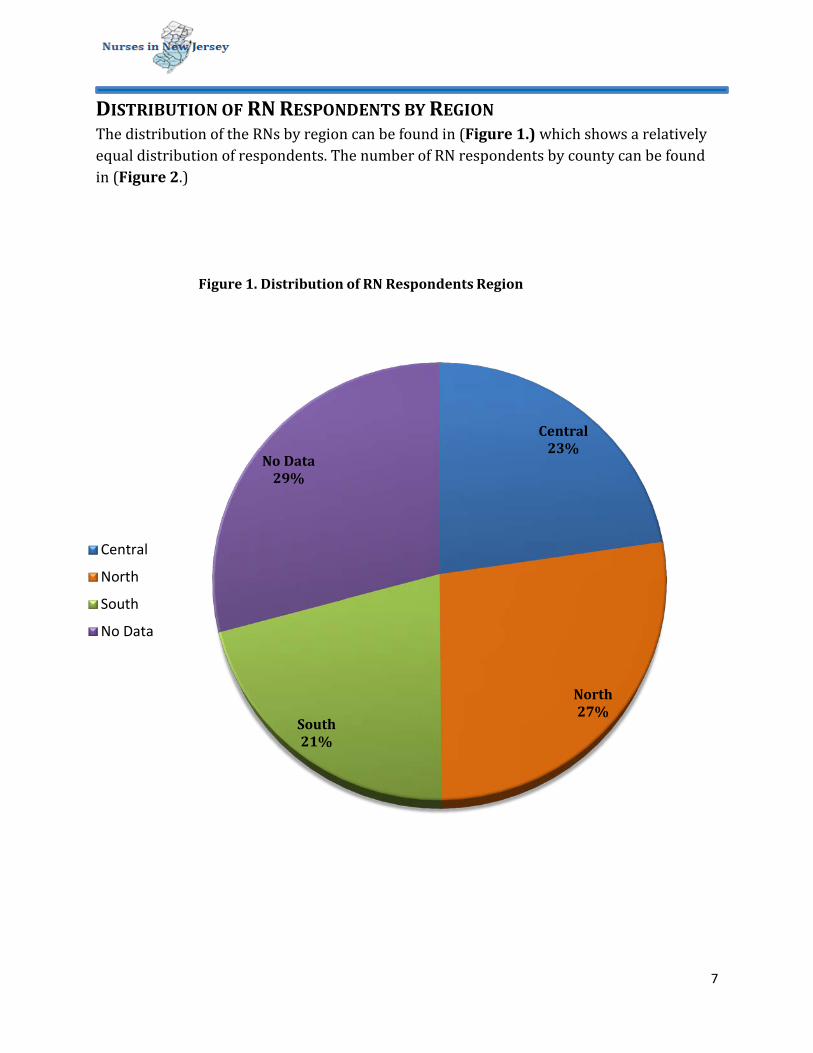
DISTRIBUTION OF RN RESPONDENTS BY REGION The distribution of the RNs by region can be found in (Figure 1.) which shows a relatively equal distribution of respondents. The number of RN respondents by county can be found in (Figure 2.)
Central 23%
North 27%
South 21%
No Data 29%
Figure 1. Distribution of RN Respondents Region
Central
North
South
No Data
7
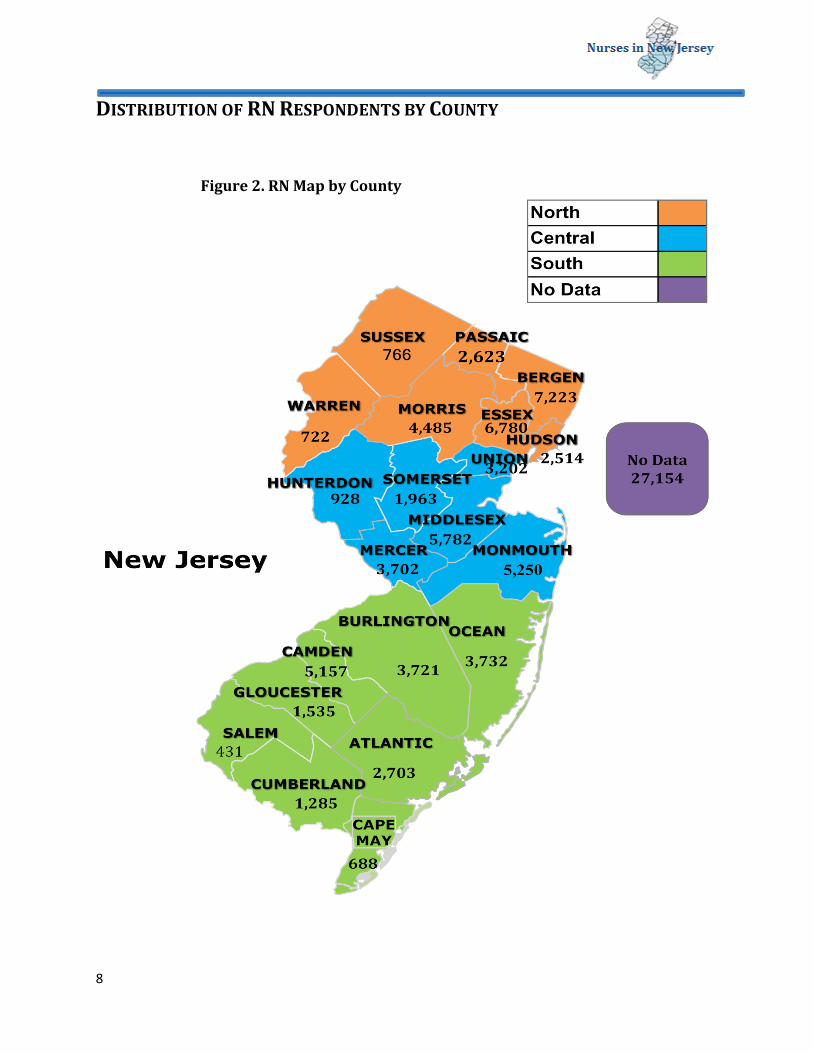
DISTRIBUTION OF RN RESPONDENTS BY COUNTY
Figure 2. RN Map by County
8
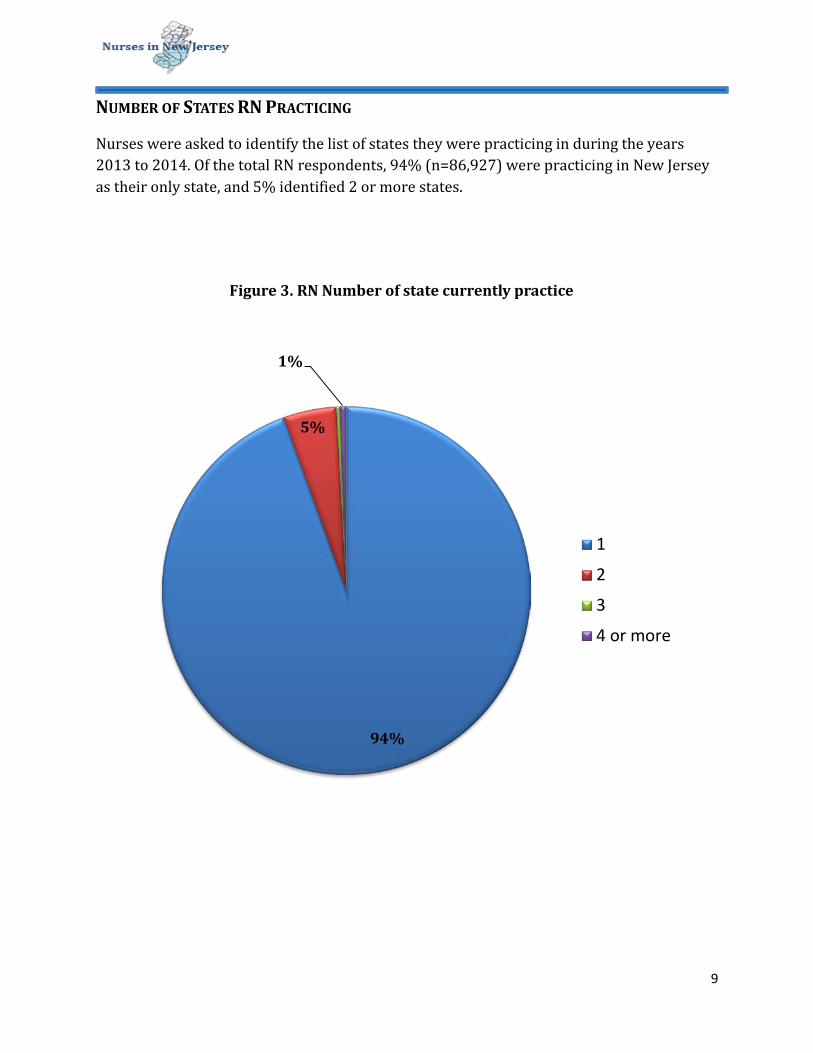
NUMBER OF STATES RN PRACTICING
Nurses were asked to identify the list of states they were practicing in during the years 2013 to 2014. Of the total RN respondents, 94% (n=86,927) were practicing in New Jersey as their only state, and 5% identified 2 or more states.
94%
5%
1%
Figure 3. RN Number of state currently practice
1
2
3
4 or more
9
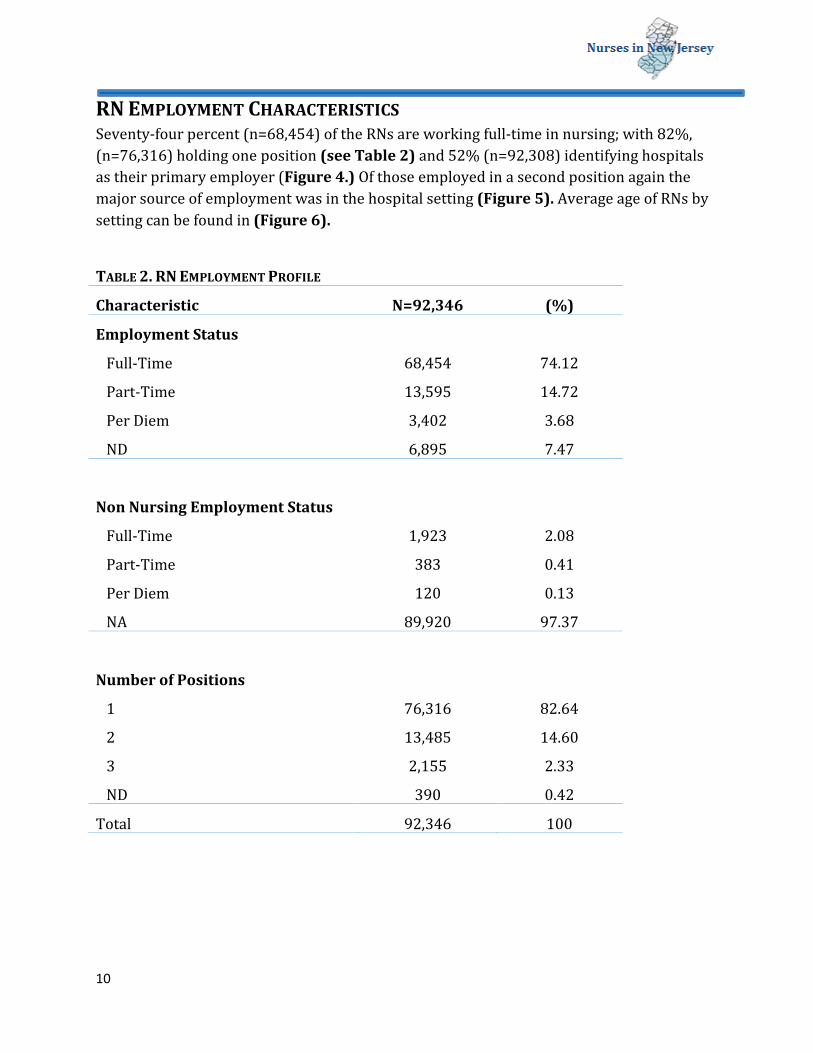
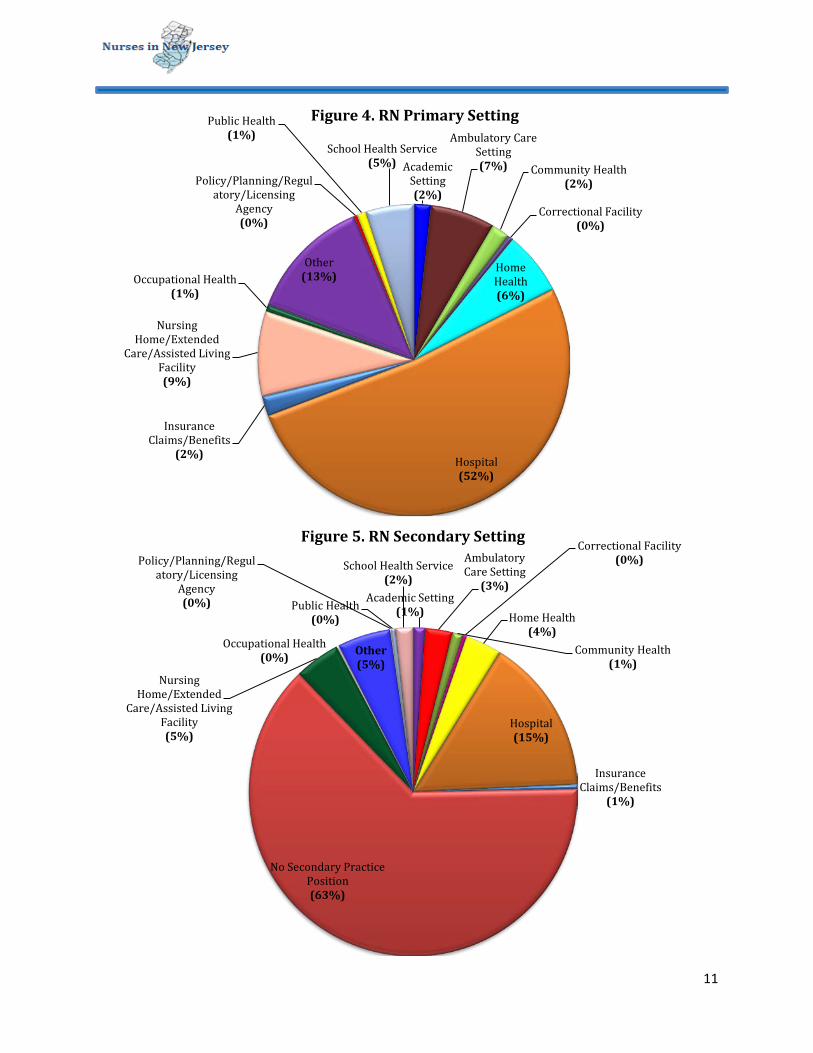
RN EMPLOYMENT CHARACTERISTICS Seventy-four percent (n=68,454) of the RNs are working full-time in nursing; with 82%, (n=76,316) holding one position (see Table 2) and 52% (n=92,308) identifying hospitals as their primary employer (Figure 4.) Of those employed in a second position again the major source of employment was in the hospital setting (Figure 5). Average age of RNs by setting can be found in (Figure 6).
TABLE 2. RN EMPLOYMENT PROFILE Characteristic N=92,346 (%)
Employment Status
Full-Time 68,454 74.12
Part-Time 13,595 14.72
Per Diem 3,402 3.68
ND 6,895 7.47
Non Nursing Employment Status
Full-Time 1,923 2.08
Part-Time 383 0.41
Per Diem 120 0.13
NA 89,920 97.37
Number of Positions
1 76,316 82.64
2 13,485 14.60
3 2,155 2.33
ND 390 0.42
Total 92,346 100
10
Academic Setting (2%)
Ambulatory Care Setting (7%) Community Health
(2%)
Correctional Facility (0%)
Home Health (6%)
Hospital (52%)
Insurance Claims/Benefits
(2%)
Nursing Home/Extended
Care/Assisted Living Facility (9%)
Occupational Health (1%)
Other (13%)
Policy/Planning/Regulatory/Licensing
Agency (0%)
Public Health (1%)
School Health Service (5%)
Figure 4. RN Primary Setting
Academic Setting (1%)
Ambulatory Care Setting
(3%)
Community Health (1%)
Correctional Facility (0%)
Home Health (4%)
Hospital (15%)
Insurance Claims/Benefits
(1%)
No Secondary Practice Position (63%)
Nursing Home/Extended
Care/Assisted Living Facility (5%)
Occupational Health (0%) Other
(5%)
Policy/Planning/Regulatory/Licensing
Agency (0%) Public Health
(0%)
School Health Service (2%)
Figure 5. RN Secondary Setting
11
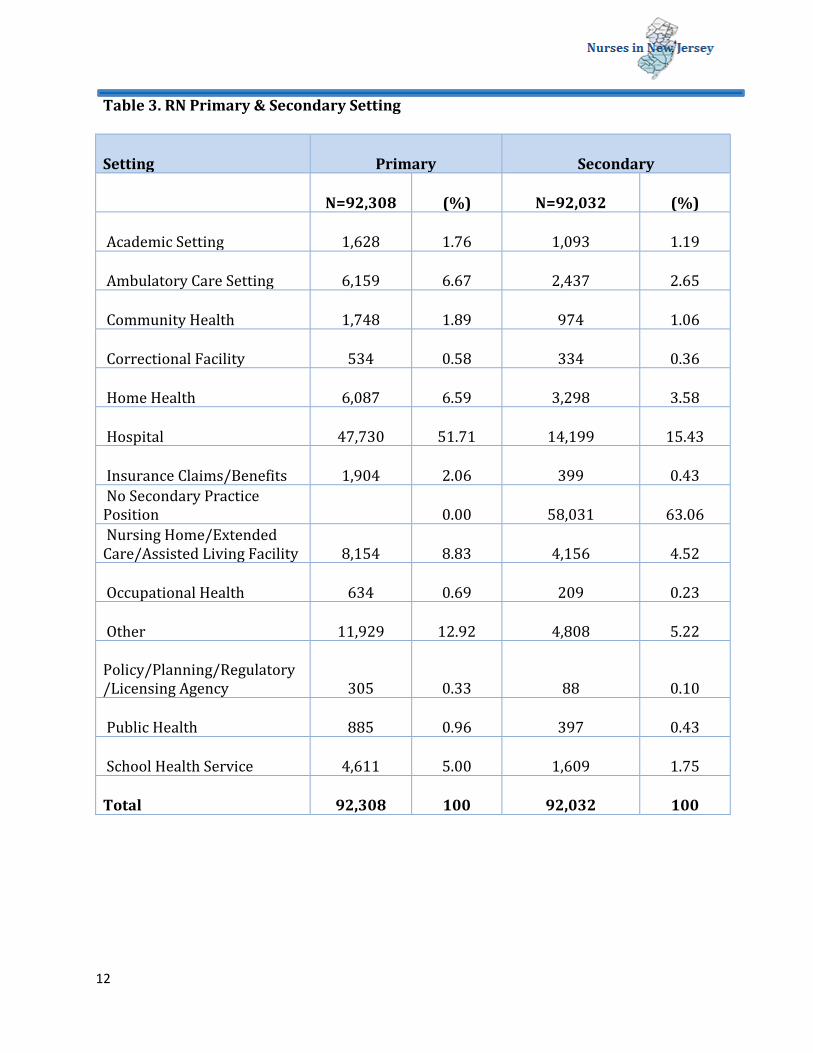
Table 3. RN Primary & Secondary Setting
Setting Primary Secondary
N=92,308 (%) N=92,032 (%)
Academic Setting 1,628 1.76 1,093 1.19
Ambulatory Care Setting 6,159 6.67 2,437 2.65
Community Health 1,748 1.89 974 1.06
Correctional Facility 534 0.58 334 0.36
Home Health 6,087 6.59 3,298 3.58
Hospital 47,730 51.71 14,199 15.43
Insurance Claims/Benefits 1,904 2.06 399 0.43 No Secondary Practice Position 0.00 58,031 63.06 Nursing Home/Extended Care/Assisted Living Facility 8,154 8.83 4,156 4.52
Occupational Health 634 0.69 209 0.23
Other 11,929 12.92 4,808 5.22 Policy/Planning/Regulatory/Licensing Agency 305 0.33 88 0.10
Public Health 885 0.96 397 0.43
School Health Service 4,611 5.00 1,609 1.75
Total 92,308 100 92,032 100
12
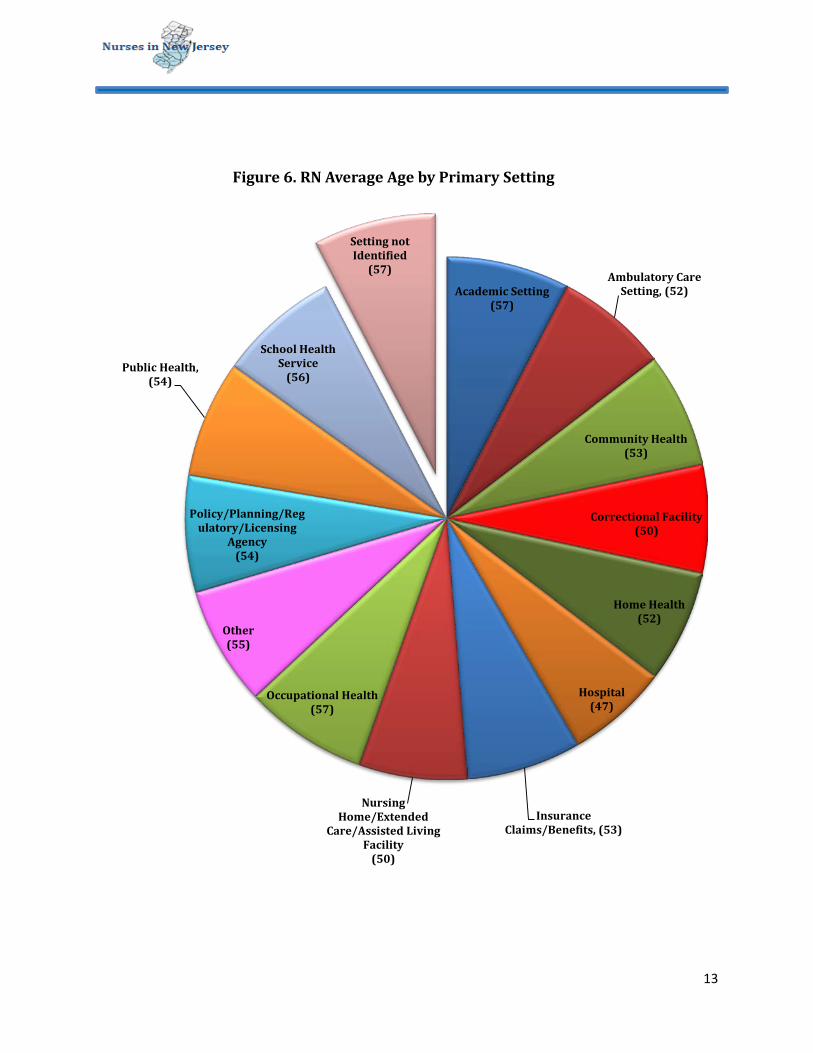
Academic Setting (57)
Ambulatory Care Setting, (52)
Community Health (53)
Correctional Facility (50)
Home Health (52)
Hospital (47)
Insurance Claims/Benefits, (53)
Nursing Home/Extended
Care/Assisted Living Facility
(50)
Occupational Health (57)
Other (55)
Policy/Planning/Regulatory/Licensing
Agency (54)
Public Health, (54)
School Health Service
(56)
Setting not Identified
(57)
Figure 6. RN Average Age by Primary Setting
13
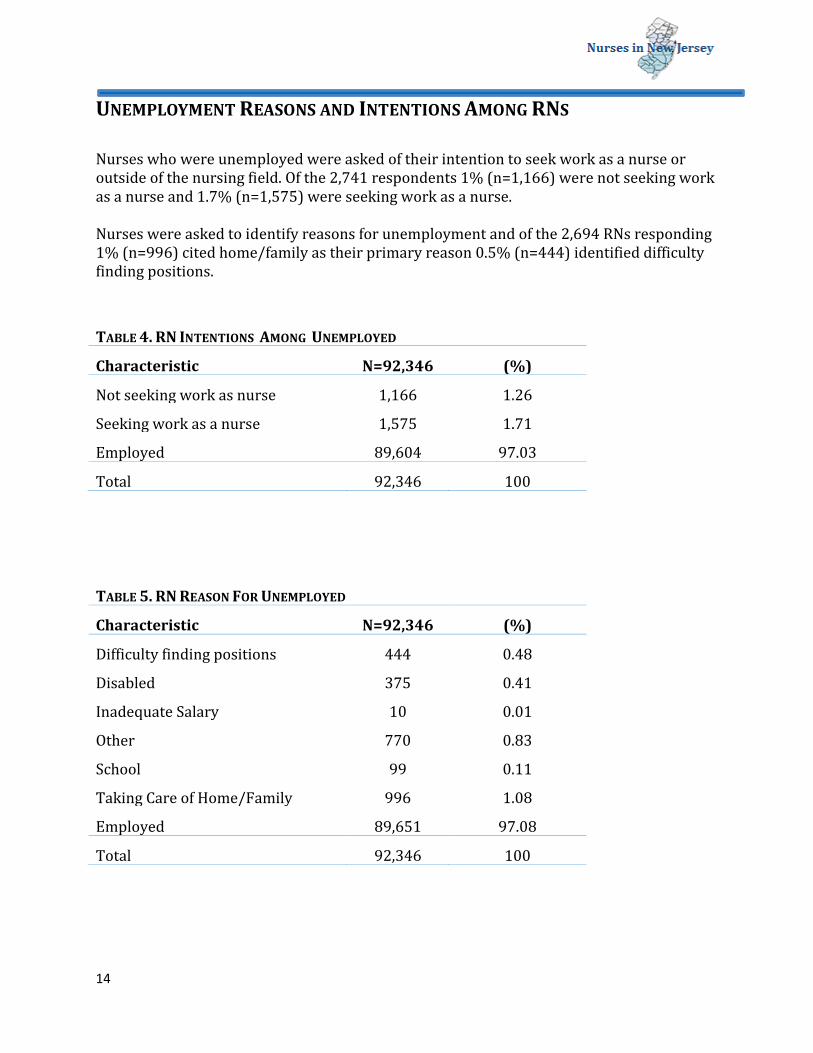
UNEMPLOYMENT REASONS AND INTENTIONS AMONG RNS Nurses who were unemployed were asked of their intention to seek work as a nurse or outside of the nursing field. Of the 2,741 respondents 1% (n=1,166) were not seeking work as a nurse and 1.7% (n=1,575) were seeking work as a nurse. Nurses were asked to identify reasons for unemployment and of the 2,694 RNs responding 1% (n=996) cited home/family as their primary reason 0.5% (n=444) identified difficulty finding positions.
TABLE 4. RN INTENTIONS AMONG UNEMPLOYED
Characteristic N=92,346 (%)
Not seeking work as nurse 1,166 1.26
Seeking work as a nurse 1,575 1.71
Employed 89,604 97.03
Total 92,346 100
TABLE 5. RN REASON FOR UNEMPLOYED
Characteristic N=92,346 (%)
Difficulty finding positions 444 0.48
Disabled 375 0.41
Inadequate Salary 10 0.01
Other 770 0.83
School 99 0.11
Taking Care of Home/Family 996 1.08
Employed 89,651 97.08
Total 92,346 100
14
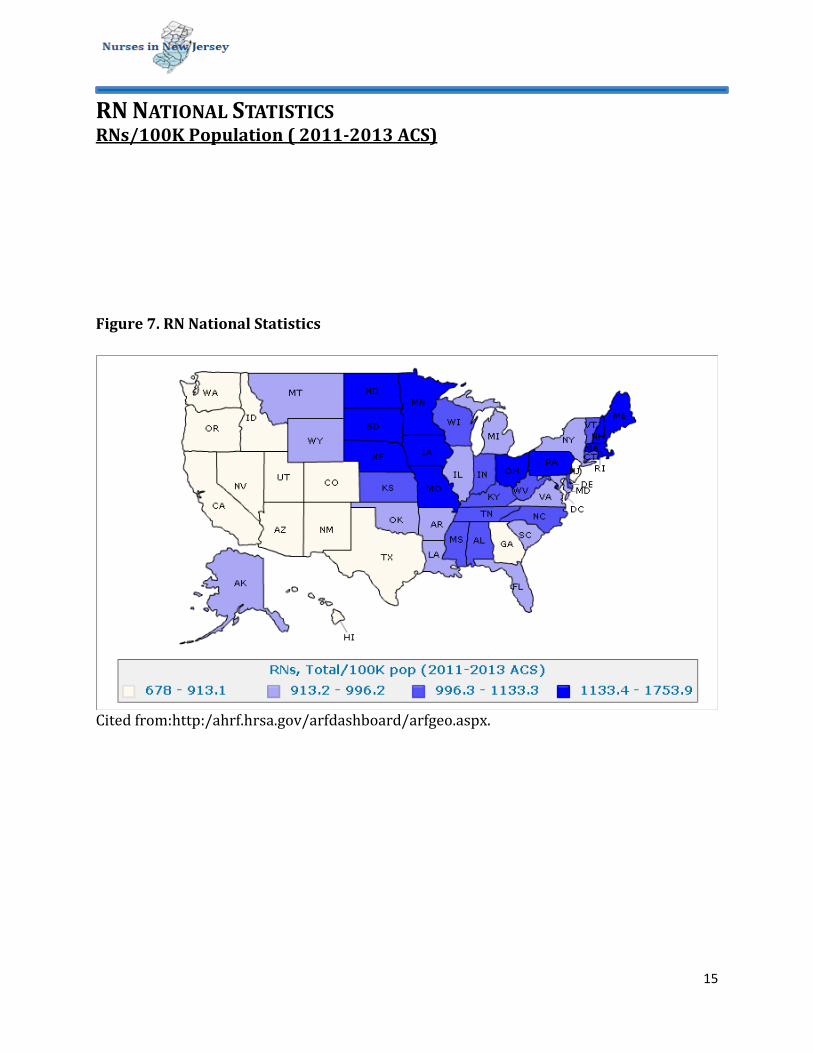
RN NATIONAL STATISTICS RNs/100K Population ( 2011-2013 ACS) Figure 7. RN National Statistics
Cited from:http:/ahrf.hrsa.gov/arfdashboard/arfgeo.aspx.
15
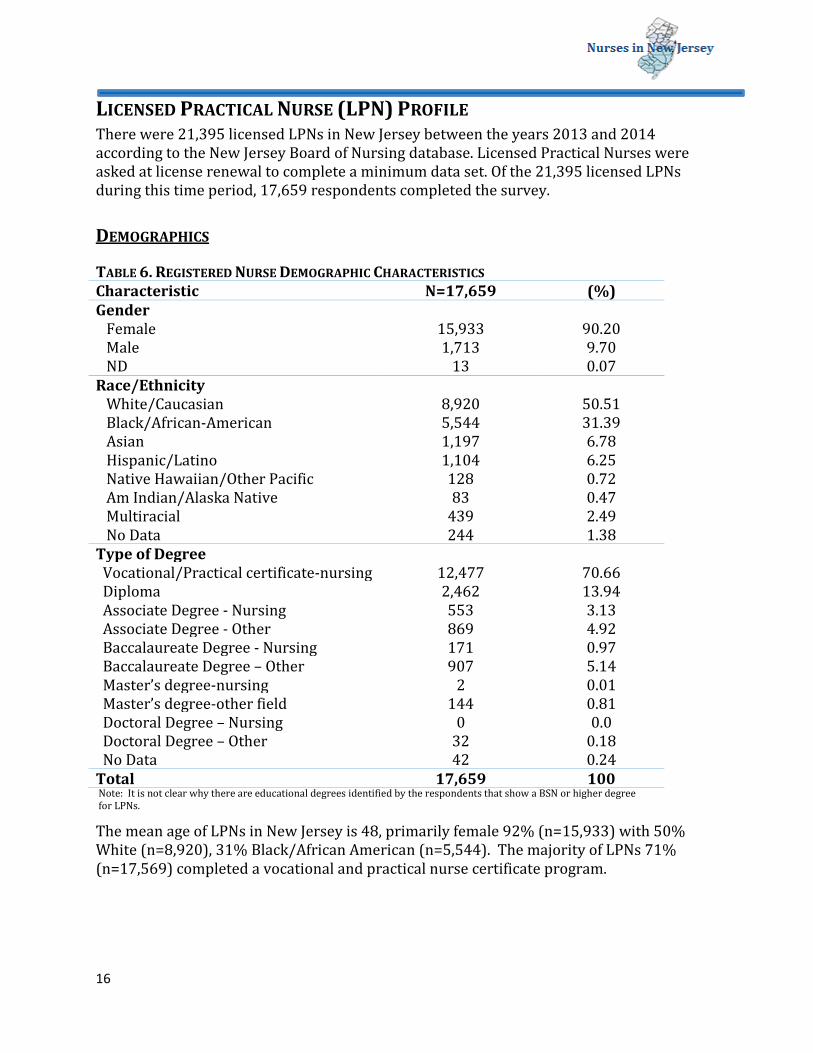
LICENSED PRACTICAL NURSE (LPN) PROFILE There were 21,395 licensed LPNs in New Jersey between the years 2013 and 2014 according to the New Jersey Board of Nursing database. Licensed Practical Nurses were asked at license renewal to complete a minimum data set. Of the 21,395 licensed LPNs during this time period, 17,659 respondents completed the survey. DEMOGRAPHICS
The mean age of LPNs in New Jersey is 48, primarily female 92% (n=15,933) with 50% White (n=8,920), 31% Black/African American (n=5,544). The majority of LPNs 71% (n=17,569) completed a vocational and practical nurse certificate program.
TABLE 6. REGISTERED NURSE DEMOGRAPHIC CHARACTERISTICS Characteristic N=17,659 (%) Gender Female 15,933 90.20 Male 1,713 9.70 ND 13 0.07 Race/Ethnicity White/Caucasian 8,920 50.51 Black/African-American 5,544 31.39 Asian 1,197 6.78 Hispanic/Latino 1,104 6.25 Native Hawaiian/Other Pacific 128 0.72 Am Indian/Alaska Native 83 0.47 Multiracial 439 2.49 No Data 244 1.38 Type of Degree Vocational/Practical certificate-nursing 12,477 70.66 Diploma 2,462 13.94 Associate Degree - Nursing 553 3.13 Associate Degree - Other 869 4.92 Baccalaureate Degree - Nursing 171 0.97 Baccalaureate Degree – Other 907 5.14 Master’s degree-nursing 2 0.01 Master’s degree-other field 144 0.81 Doctoral Degree – Nursing 0 0.0 Doctoral Degree – Other 32 0.18 No Data 42 0.24 Total 17,659 100 Note: It is not clear why there are educational degrees identified by the respondents that show a BSN or higher degree for LPNs.
16
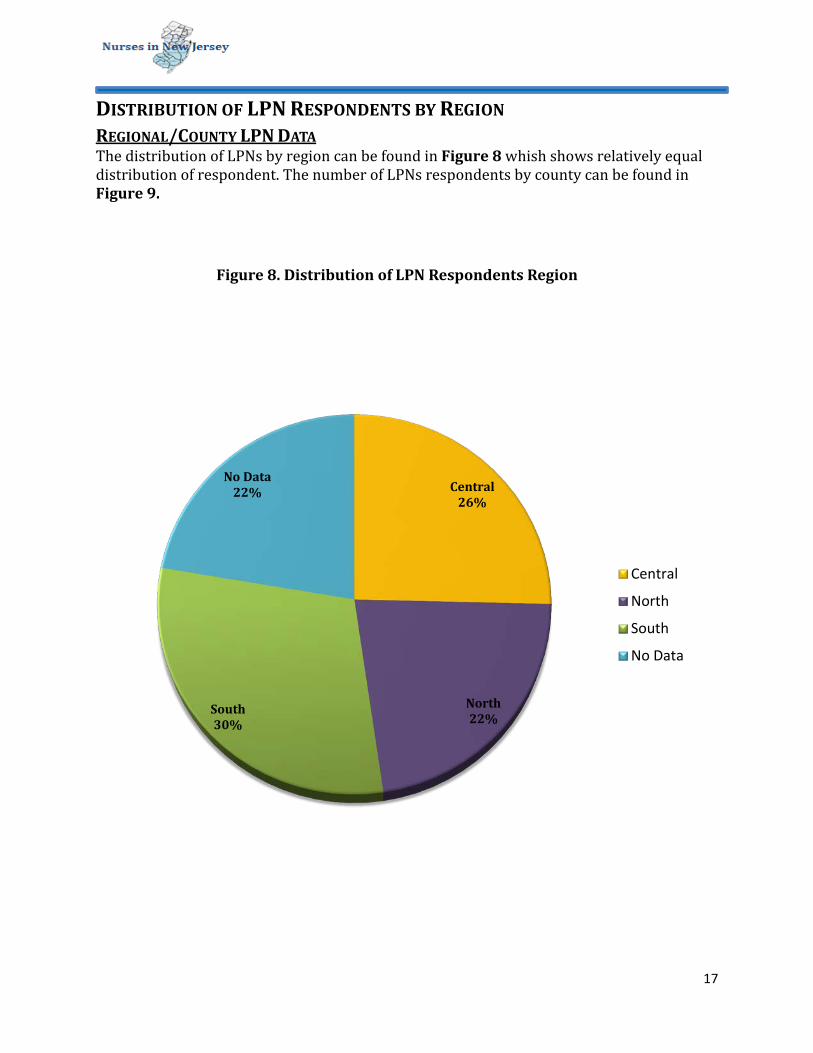
DISTRIBUTION OF LPN RESPONDENTS BY REGION REGIONAL/COUNTY LPN DATA The distribution of LPNs by region can be found in Figure 8 whish shows relatively equal distribution of respondent. The number of LPNs respondents by county can be found in Figure 9.
Central 26%
North 22%
South 30%
No Data 22%
Figure 8. Distribution of LPN Respondents Region
Central
North
South
No Data
17
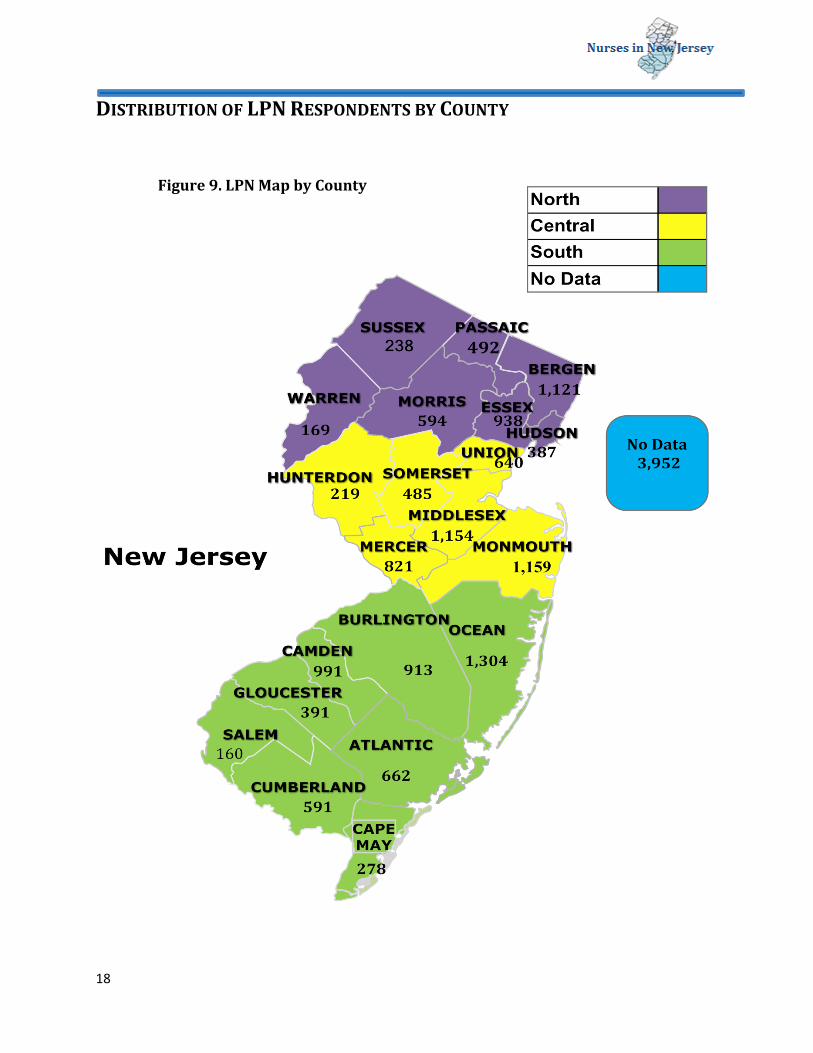
DISTRIBUTION OF LPN RESPONDENTS BY COUNTY
Figure 9. LPN Map by County
18
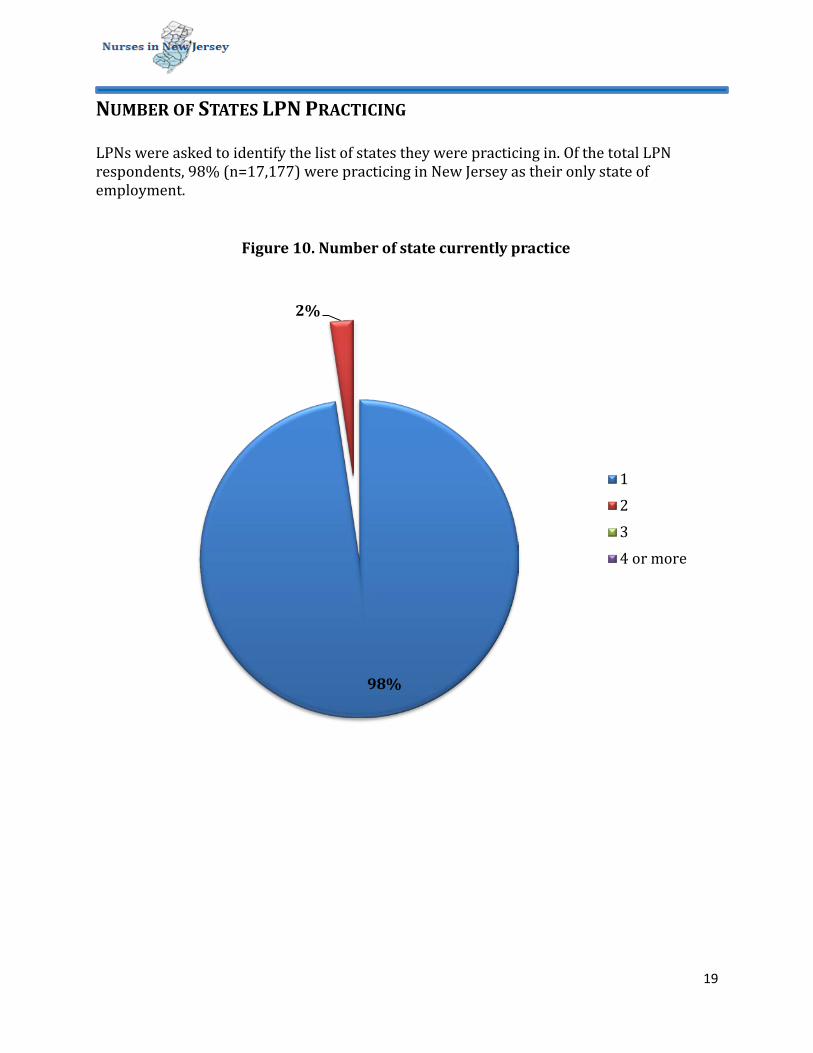
NUMBER OF STATES LPN PRACTICING LPNs were asked to identify the list of states they were practicing in. Of the total LPN respondents, 98% (n=17,177) were practicing in New Jersey as their only state of employment.
98%
2%
Figure 10. Number of state currently practice
1234 or more
19
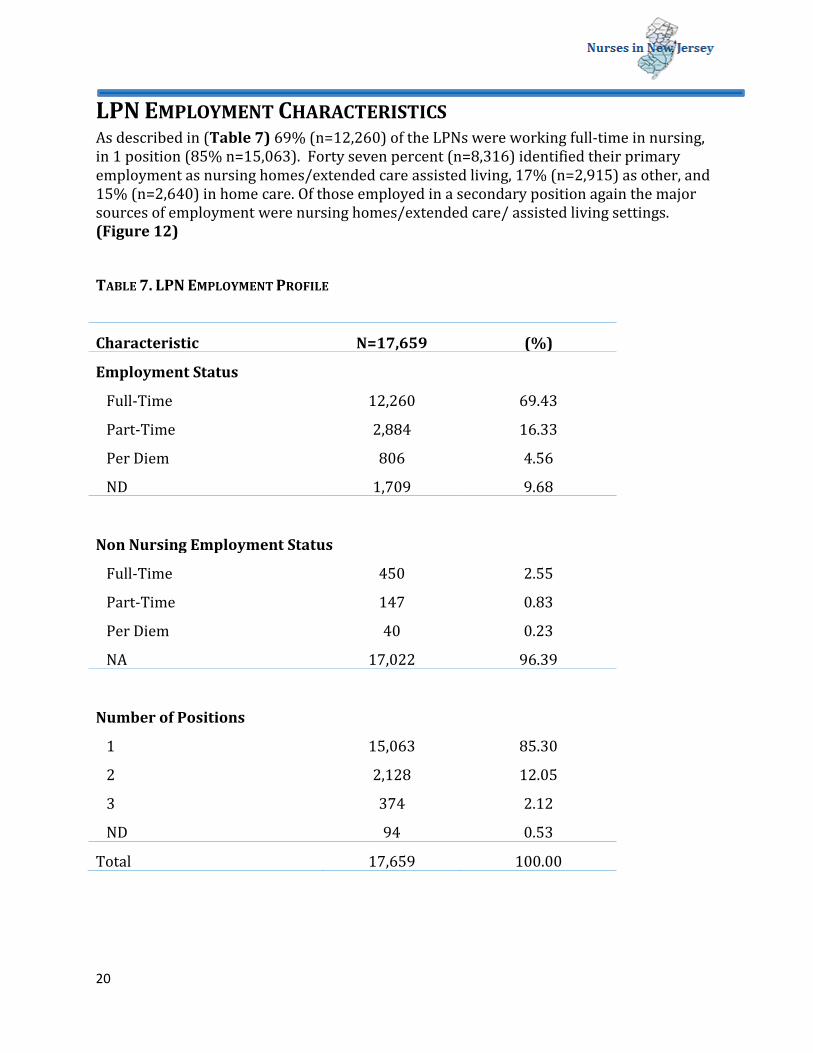
LPN EMPLOYMENT CHARACTERISTICS As described in (Table 7) 69% (n=12,260) of the LPNs were working full-time in nursing, in 1 position (85% n=15,063). Forty seven percent (n=8,316) identified their primary employment as nursing homes/extended care assisted living, 17% (n=2,915) as other, and 15% (n=2,640) in home care. Of those employed in a secondary position again the major sources of employment were nursing homes/extended care/ assisted living settings. (Figure 12)
TABLE 7. LPN EMPLOYMENT PROFILE
Characteristic N=17,659 (%)
Employment Status
Full-Time 12,260 69.43
Part-Time 2,884 16.33
Per Diem 806 4.56
ND 1,709 9.68
Non Nursing Employment Status
Full-Time 450 2.55
Part-Time 147 0.83
Per Diem 40 0.23
NA 17,022 96.39
Number of Positions
1 15,063 85.30
2 2,128 12.05
3 374 2.12
ND 94 0.53
Total 17,659 100.00
20
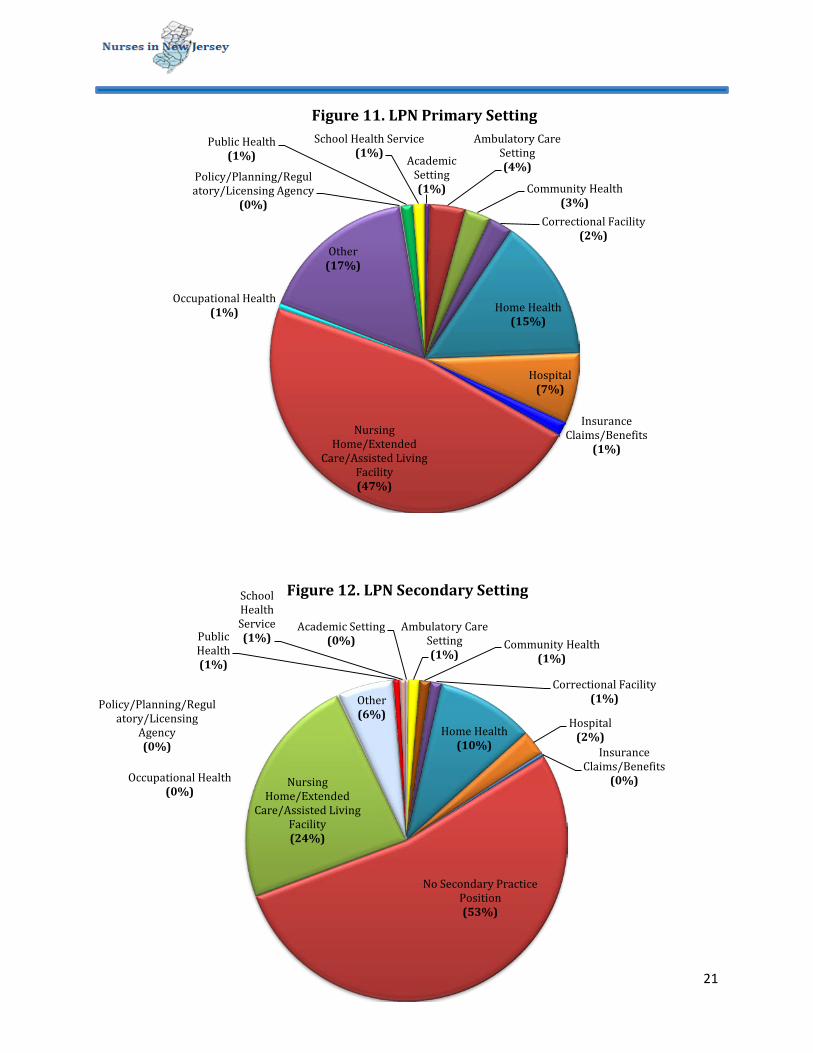
Academic Setting (1%)
Ambulatory Care Setting (4%)
Community Health (3%)
Correctional Facility (2%)
Home Health (15%)
Hospital (7%)
Insurance Claims/Benefits
(1%) Nursing
Home/Extended Care/Assisted Living
Facility (47%)
Occupational Health (1%)
Other (17%)
Policy/Planning/Regulatory/Licensing Agency
(0%)
Public Health (1%)
School Health Service (1%)
Figure 11. LPN Primary Setting
Academic Setting (0%)
Ambulatory Care Setting (1%)
Community Health (1%)
Correctional Facility (1%)
Home Health (10%)
Hospital (2%)
Insurance Claims/Benefits
(0%)
No Secondary Practice Position (53%)
Nursing Home/Extended
Care/Assisted Living Facility (24%)
Occupational Health (0%)
Other (6%)
Policy/Planning/Regulatory/Licensing
Agency (0%)
Public Health (1%)
School Health Service (1%)
Figure 12. LPN Secondary Setting
21

Table 8. LPN Primary & Secondary Setting
Setting Primary Secondary
N=17,651 (%) N=17583 (%)
Academic Setting 89 0.50 29 0.16
Ambulatory Care Setting 659 3.73 200 1.14
Community Health 478 2.71 192 1.09
Correctional Facility 440 2.49 202 1.15
Home Health 2,640 14.96 1,724 9.80
Hospital 1,304 7.39 441 2.51
Insurance Claims/Benefits 253 1.43 62 0.35 No Secondary Practice Position 0.00 9,343 53.14 Nursing Home/Extended Care/Assisted Living Facility 8,316 47.11 4,137 23.53
Occupational Health 93 0.53 38 0.22
Other 2,915 16.51 972 5.53 Policy/Planning/Regulatory/Licensing Agency 22 0.12 11 0.06
Public Health 223 1.26 113 0.64
School Health Service 219 1.24 119 0.68
Total 17,651 100 17,583 100
22
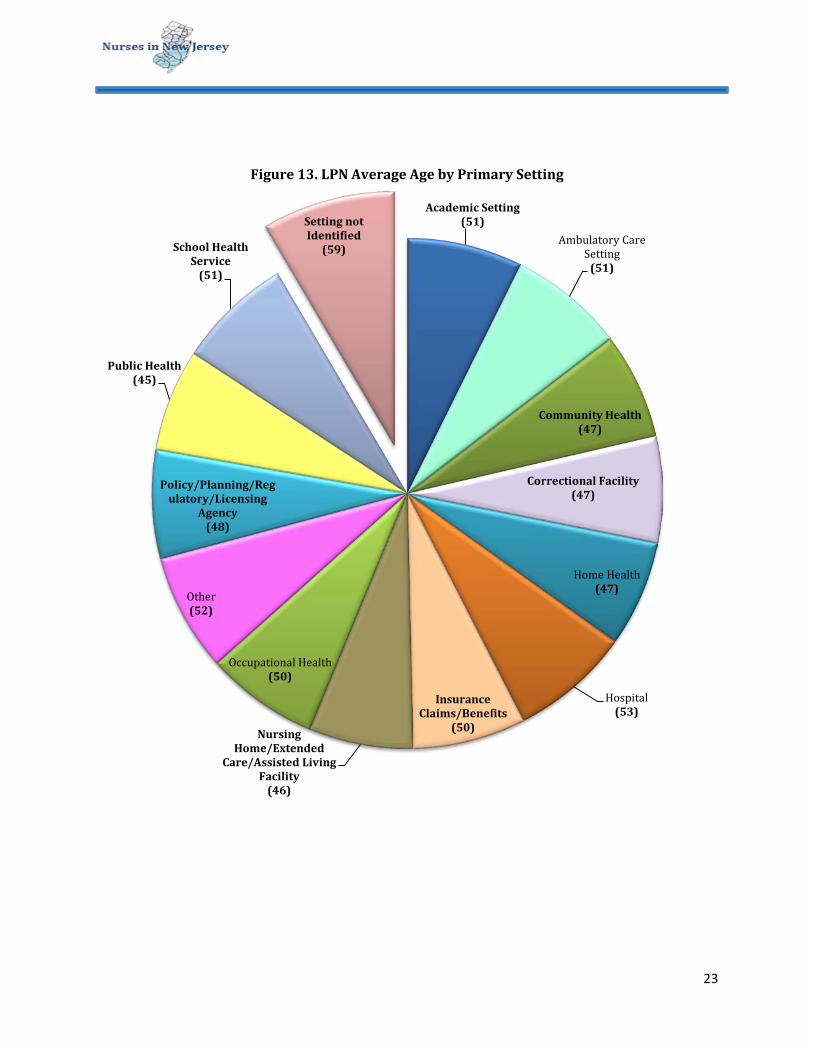
Academic Setting (51)
Ambulatory Care Setting
(51)
Community Health (47)
Correctional Facility (47)
Home Health (47)
Hospital (53)
Insurance Claims/Benefits
(50) Nursing Home/Extended
Care/Assisted Living Facility
(46)
Occupational Health (50)
Other (52)
Policy/Planning/Regulatory/Licensing
Agency (48)
Public Health (45)
School Health Service
(51)
Setting not Identified
(59)
Figure 13. LPN Average Age by Primary Setting
23
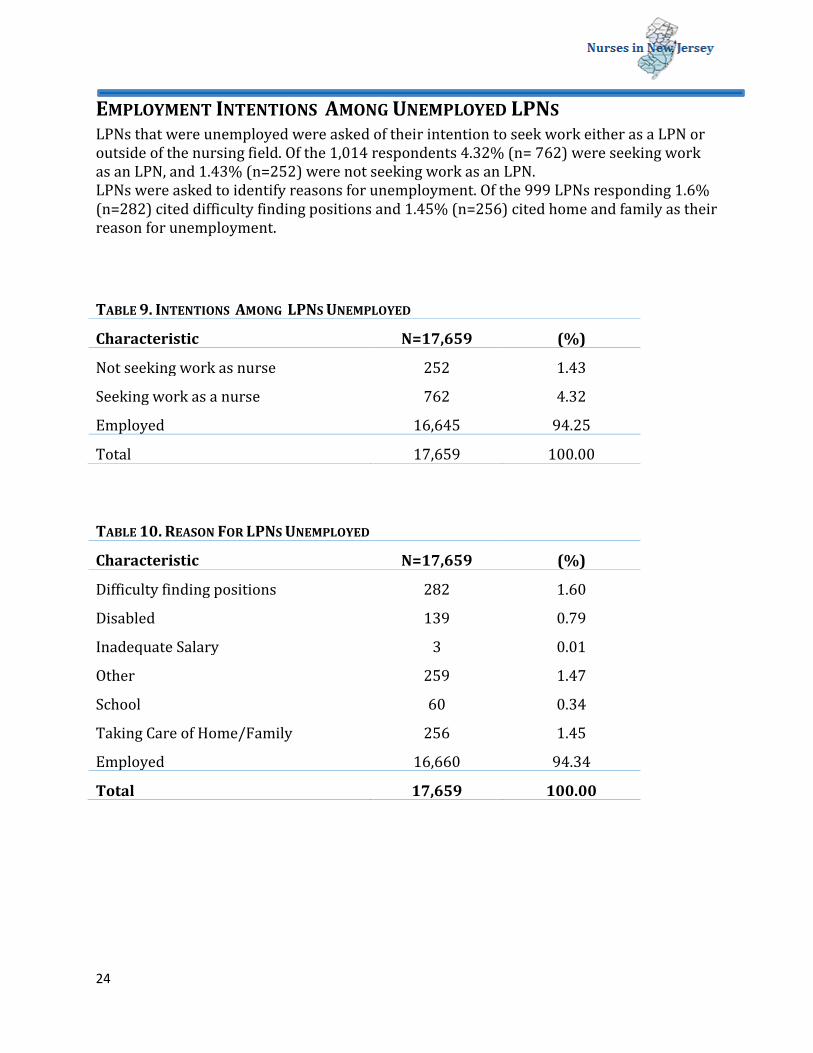
EMPLOYMENT INTENTIONS AMONG UNEMPLOYED LPNS LPNs that were unemployed were asked of their intention to seek work either as a LPN or outside of the nursing field. Of the 1,014 respondents 4.32% (n= 762) were seeking work as an LPN, and 1.43% (n=252) were not seeking work as an LPN. LPNs were asked to identify reasons for unemployment. Of the 999 LPNs responding 1.6% (n=282) cited difficulty finding positions and 1.45% (n=256) cited home and family as their reason for unemployment.
TABLE 9. INTENTIONS AMONG LPNS UNEMPLOYED
Characteristic N=17,659 (%)
Not seeking work as nurse 252 1.43
Seeking work as a nurse 762 4.32
Employed 16,645 94.25
Total 17,659 100.00
TABLE 10. REASON FOR LPNS UNEMPLOYED
Characteristic N=17,659 (%)
Difficulty finding positions 282 1.60
Disabled 139 0.79
Inadequate Salary 3 0.01
Other 259 1.47
School 60 0.34
Taking Care of Home/Family 256 1.45
Employed 16,660 94.34
Total 17,659 100.00
24
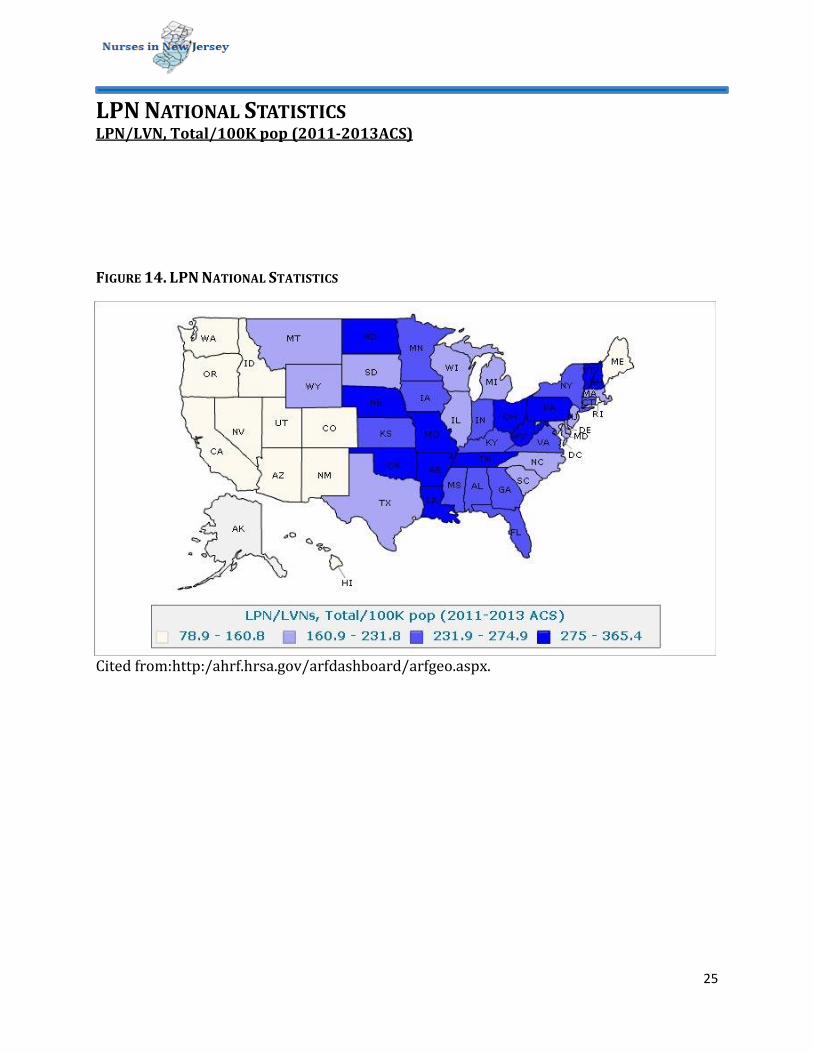
LPN NATIONAL STATISTICS LPN/LVN, Total/100K pop (2011-2013ACS)
FIGURE 14. LPN NATIONAL STATISTICS
Cited from:http:/ahrf.hrsa.gov/arfdashboard/arfgeo.aspx.
25
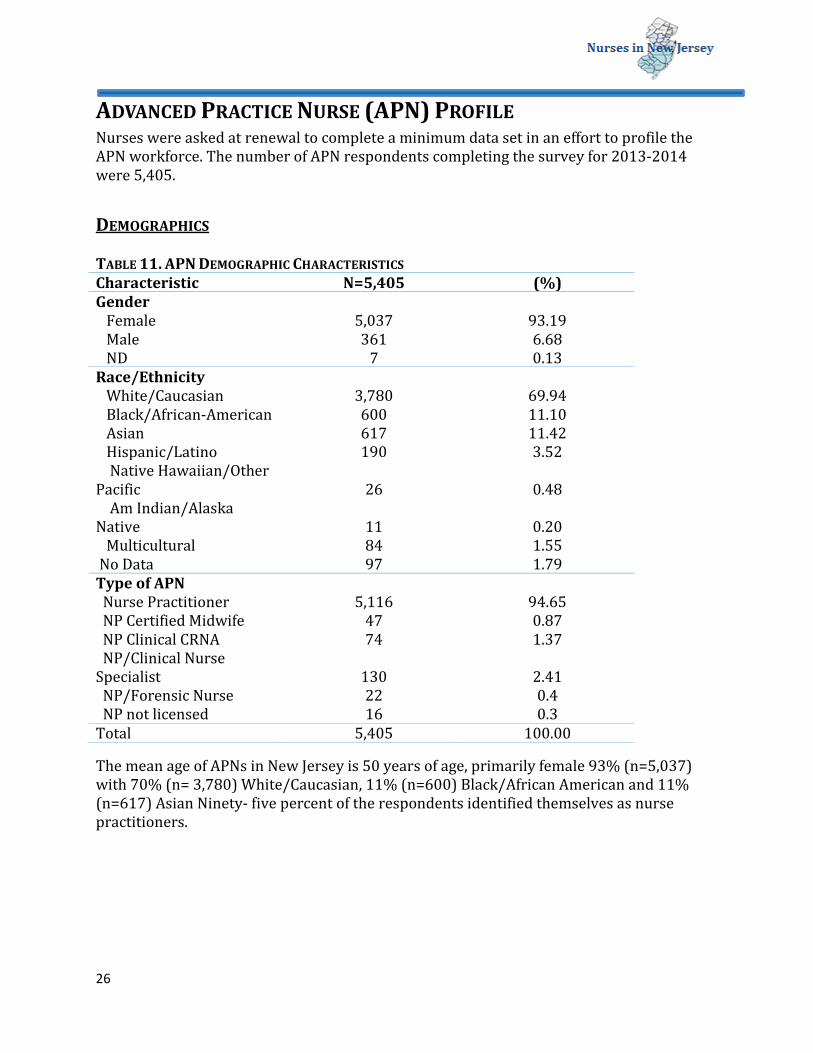
ADVANCED PRACTICE NURSE (APN) PROFILE Nurses were asked at renewal to complete a minimum data set in an effort to profile the APN workforce. The number of APN respondents completing the survey for 2013-2014 were 5,405.
The mean age of APNs in New Jersey is 50 years of age, primarily female 93% (n=5,037) with 70% (n= 3,780) White/Caucasian, 11% (n=600) Black/African American and 11% (n=617) Asian Ninety- five percent of the respondents identified themselves as nurse practitioners.
DEMOGRAPHICS
TABLE 11. APN DEMOGRAPHIC CHARACTERISTICS Characteristic N=5,405 (%) Gender Female 5,037 93.19 Male 361 6.68 ND 7 0.13 Race/Ethnicity White/Caucasian 3,780 69.94 Black/African-American 600 11.10 Asian 617 11.42 Hispanic/Latino 190 3.52 Native Hawaiian/Other Pacific 26 0.48 Am Indian/Alaska Native 11 0.20 Multicultural 84 1.55 No Data 97 1.79 Type of APN Nurse Practitioner 5,116 94.65 NP Certified Midwife 47 0.87 NP Clinical CRNA 74 1.37 NP/Clinical Nurse Specialist 130 2.41 NP/Forensic Nurse 22 0.4 NP not licensed 16 0.3 Total 5,405 100.00
26
DISTRIBUTION OF APN RESPONDENTS BY REGION
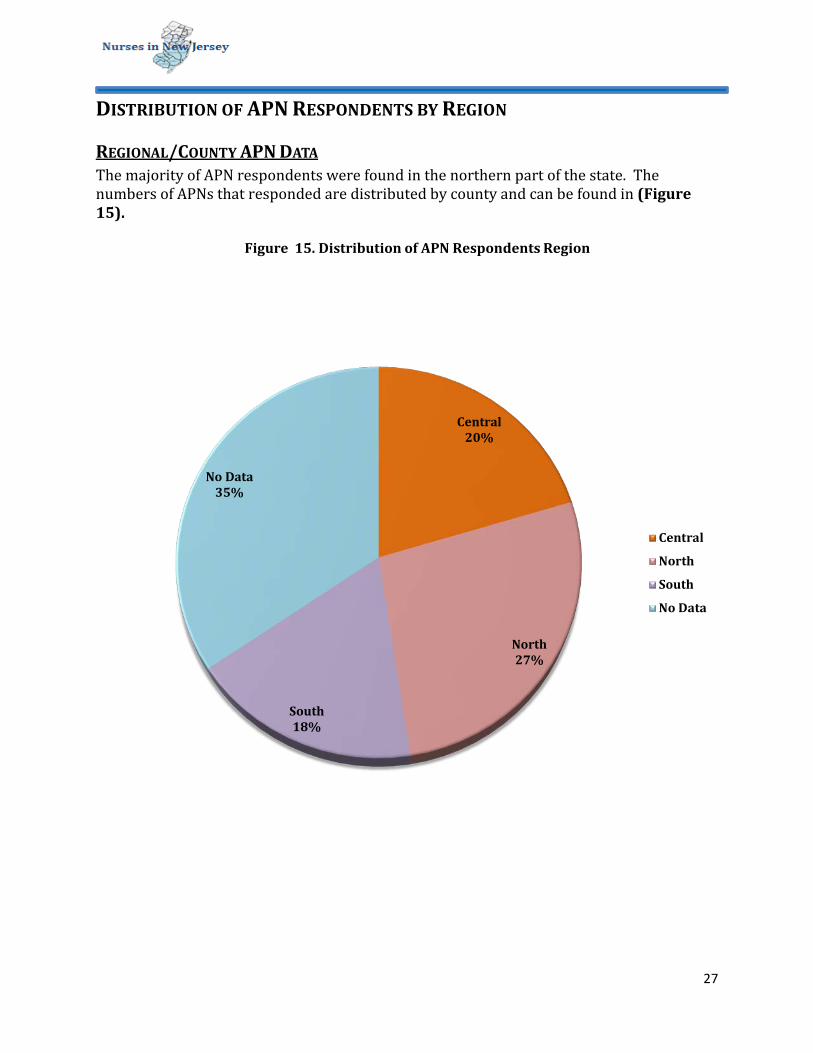
REGIONAL/COUNTY APN DATA The majority of APN respondents were found in the northern part of the state. The numbers of APNs that responded are distributed by county and can be found in (Figure 15).
Central 20%
North 27%
South 18%
No Data 35%
Figure 15. Distribution of APN Respondents Region
Central
North
South
No Data
27

DISTRIBUTION OF APN RESPONDENTS BY COUNTY
Figure 16. APN Map by County
28

NUMBER OF STATES APN PRACTICING APNs were asked to identify the list of states that they were practicing in at the time of the survey. Of the total APN respondents, 91% (n= 4, 904) were practicing in New Jersey as their only state and 9% identified 2 states.
91%
9%
Figure 17. APN Number of Practicing States
1
2
3
4 or more
29
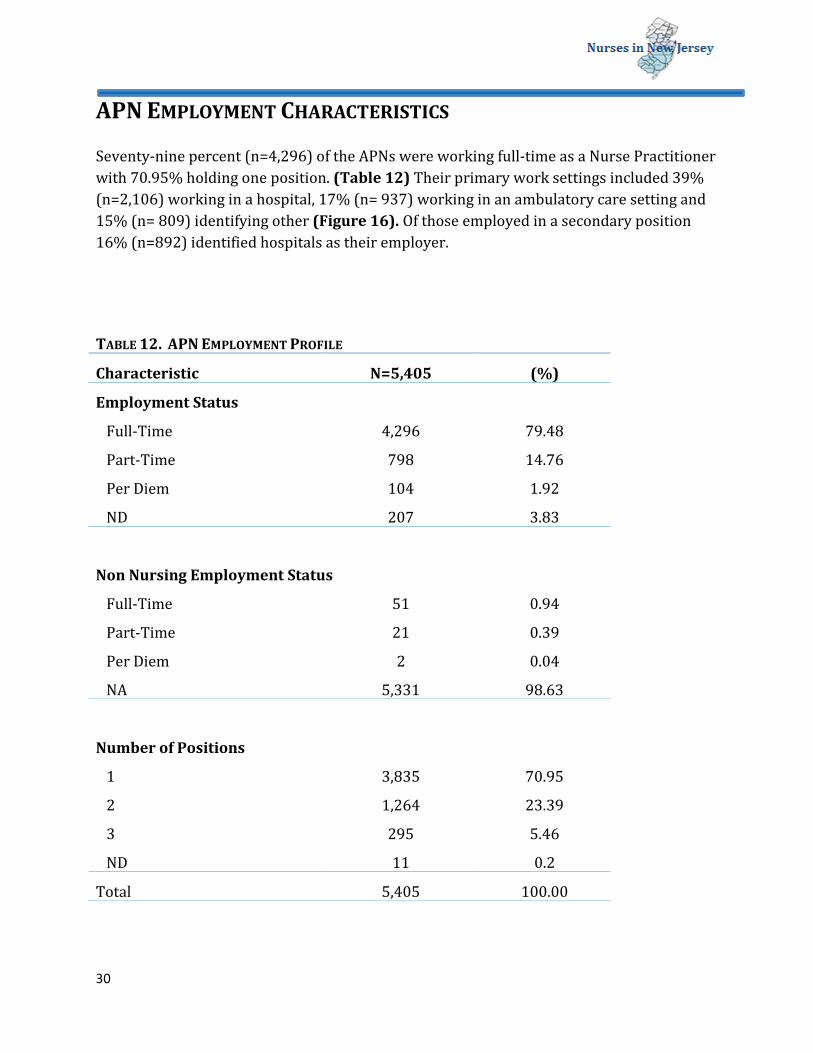
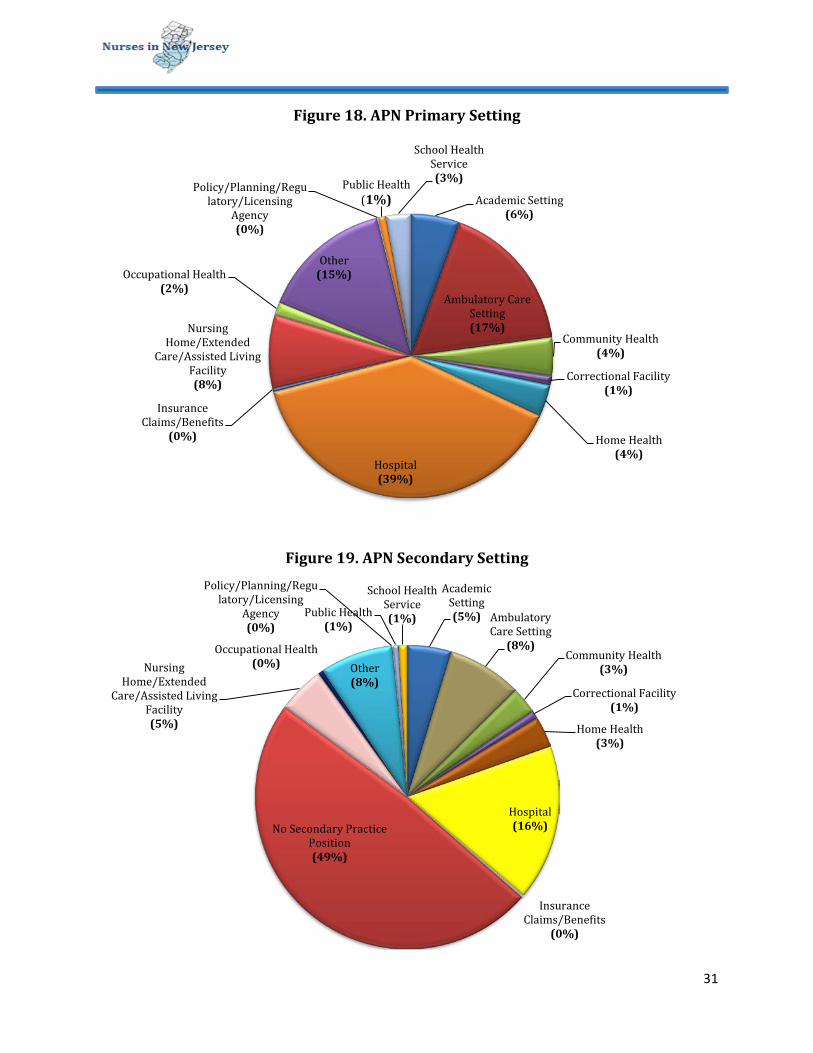
APN EMPLOYMENT CHARACTERISTICS Seventy-nine percent (n=4,296) of the APNs were working full-time as a Nurse Practitioner with 70.95% holding one position. (Table 12) Their primary work settings included 39% (n=2,106) working in a hospital, 17% (n= 937) working in an ambulatory care setting and 15% (n= 809) identifying other (Figure 16). Of those employed in a secondary position 16% (n=892) identified hospitals as their employer.
TABLE 12. APN EMPLOYMENT PROFILE
Characteristic N=5,405 (%)
Employment Status
Full-Time 4,296 79.48
Part-Time 798 14.76
Per Diem 104 1.92
ND 207 3.83
Non Nursing Employment Status
Full-Time 51 0.94
Part-Time 21 0.39
Per Diem 2 0.04
NA 5,331 98.63
Number of Positions
1 3,835 70.95
2 1,264 23.39
3 295 5.46
ND 11 0.2
Total 5,405 100.00
30
Academic Setting (5%) Ambulatory
Care Setting (8%)
Community Health (3%)
Correctional Facility (1%)
Home Health (3%)
Hospital (16%)
Insurance Claims/Benefits
(0%)
No Secondary Practice Position (49%)
Nursing Home/Extended
Care/Assisted Living Facility (5%)
Occupational Health (0%) Other
(8%)
Policy/Planning/Regulatory/Licensing
Agency (0%)
Public Health (1%)
School Health Service (1%)
Figure 19. APN Secondary Setting
Academic Setting (6%)
Ambulatory Care Setting (17%)
Community Health (4%)
Correctional Facility (1%)
Home Health (4%)
Hospital (39%)
Insurance Claims/Benefits
(0%)
Nursing Home/Extended
Care/Assisted Living Facility (8%)
Occupational Health (2%)
Other (15%)
Policy/Planning/Regulatory/Licensing
Agency (0%)
Public Health (1%)
School Health Service (3%)
Figure 18. APN Primary Setting
31
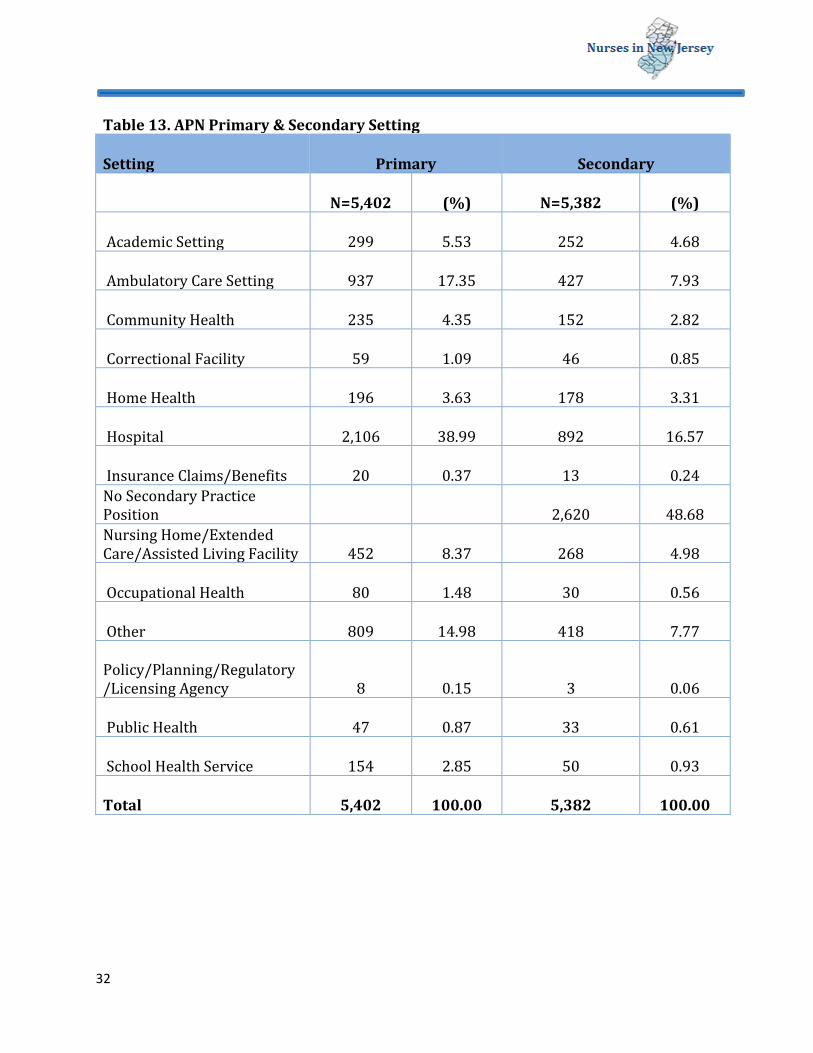
Table 13. APN Primary & Secondary Setting
Setting Primary Secondary
N=5,402 (%) N=5,382 (%)
Academic Setting 299 5.53 252 4.68
Ambulatory Care Setting 937 17.35 427 7.93
Community Health 235 4.35 152 2.82
Correctional Facility 59 1.09 46 0.85
Home Health 196 3.63 178 3.31
Hospital 2,106 38.99 892 16.57
Insurance Claims/Benefits 20 0.37 13 0.24 No Secondary Practice Position 2,620 48.68 Nursing Home/Extended Care/Assisted Living Facility 452 8.37 268 4.98
Occupational Health 80 1.48 30 0.56
Other 809 14.98 418 7.77 Policy/Planning/Regulatory/Licensing Agency 8 0.15 3 0.06
Public Health 47 0.87 33 0.61
School Health Service 154 2.85 50 0.93
Total 5,402 100.00 5,382 100.00 32

Academic Setting (54)
Ambulatory Care Setting
(50)
Community Health (48)
Correctional Facility (51)
Home Health (52)
Hospital (48)
Insurance Claims/Benefits
(56) Nursing Home/Extended
Care/Assisted Living Facility
(51)
Occupational Health
(52)
Other (51)
Policy/Planning/Regulatory/Licensing
Agency (57)
Public Health (52) School Health
Service (54)
Setting not Identified
(46)
Figure 20. APN Average Age by Primary Setting
33
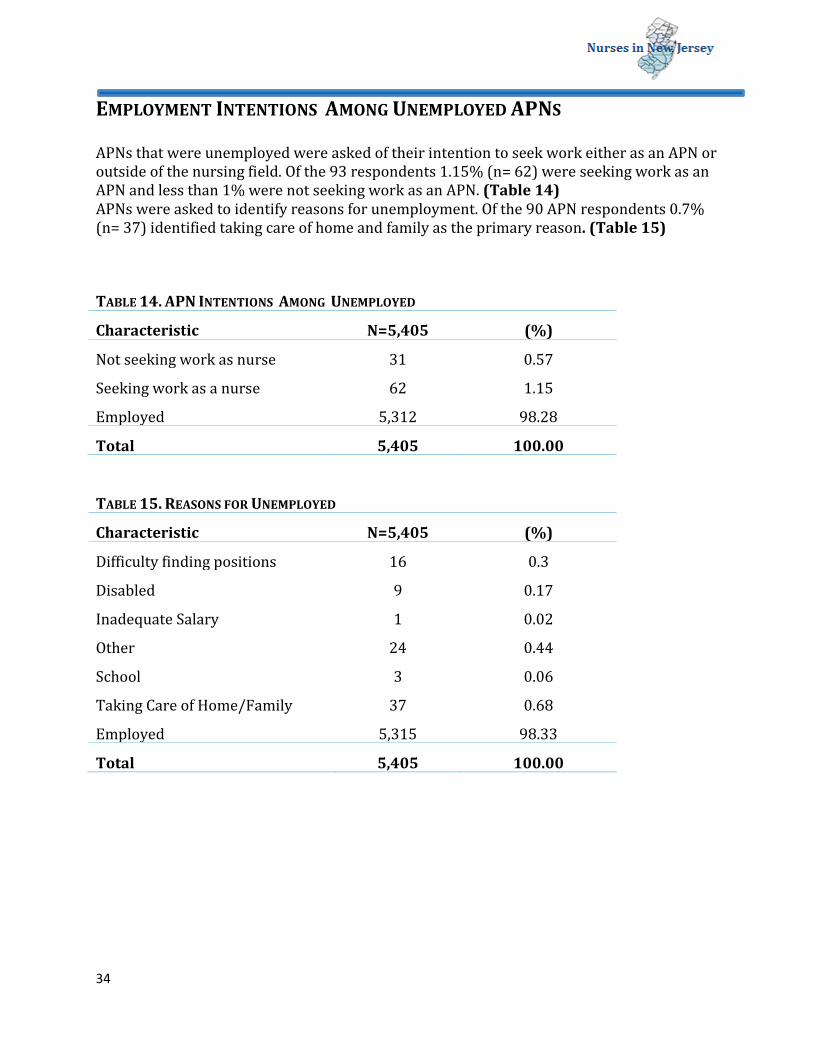
EMPLOYMENT INTENTIONS AMONG UNEMPLOYED APNS APNs that were unemployed were asked of their intention to seek work either as an APN or outside of the nursing field. Of the 93 respondents 1.15% (n= 62) were seeking work as an APN and less than 1% were not seeking work as an APN. (Table 14) APNs were asked to identify reasons for unemployment. Of the 90 APN respondents 0.7% (n= 37) identified taking care of home and family as the primary reason. (Table 15)
TABLE 14. APN INTENTIONS AMONG UNEMPLOYED
Characteristic N=5,405 (%)
Not seeking work as nurse 31 0.57
Seeking work as a nurse 62 1.15
Employed 5,312 98.28
Total 5,405 100.00
TABLE 15. REASONS FOR UNEMPLOYED
Characteristic N=5,405 (%)
Difficulty finding positions 16 0.3
Disabled 9 0.17
Inadequate Salary 1 0.02
Other 24 0.44
School 3 0.06
Taking Care of Home/Family 37 0.68
Employed 5,315 98.33
Total 5,405 100.00
34
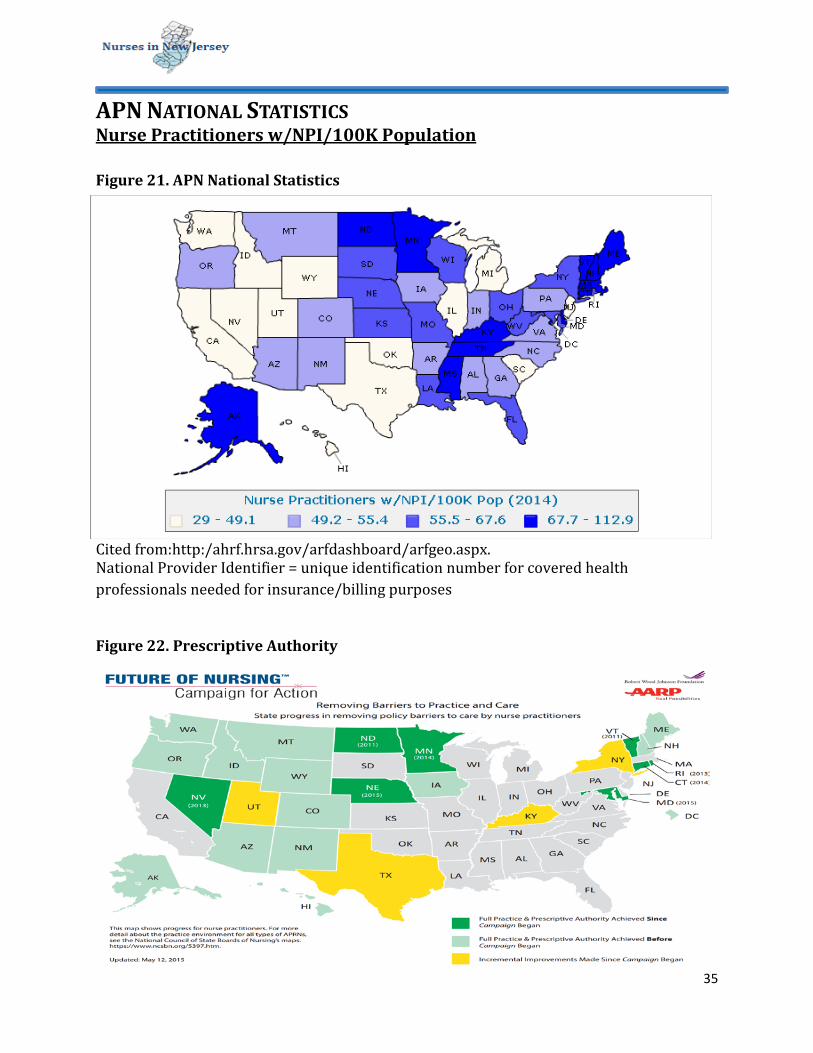
APN NATIONAL STATISTICS Nurse Practitioners w/NPI/100K Population Figure 21. APN National Statistics
Cited from:http:/ahrf.hrsa.gov/arfdashboard/arfgeo.aspx. National Provider Identifier = unique identification number for covered health professionals needed for insurance/billing purposes
Figure 22. Prescriptive Authority
35
LIMITATIONS
1. The NJCCN received 4 waves of data that had different numbers of respondents for this time period. Therefore data should be used cautiously understanding this limitation.
2. Several of the questions were eliminated in this report as the data were not consistent with other response patterns.
RECOMMENDATIONS
1. Re-define and format questions differently for 2016. 2. Work with the NJBON and the 3rd party vendor directly to ensure accurate survey
set-up and data extraction are conducted. 3. Prior to administration of the survey explain the importance of the collection of this
data to RNs in helping to define the supply of nurses in New Jersey. SUMMARY
This report provided a baseline for the current nursing supply in New Jersey. It provides a beginning profile of LPNs, RNs, and APNs in the state. Since it is the first report of its kind in New Jersey conclusions should not be drawn, however, the data can be used to help shape discussions on the current nursing workforce and the future trends that may result from changes occurring in the healthcare system.
36
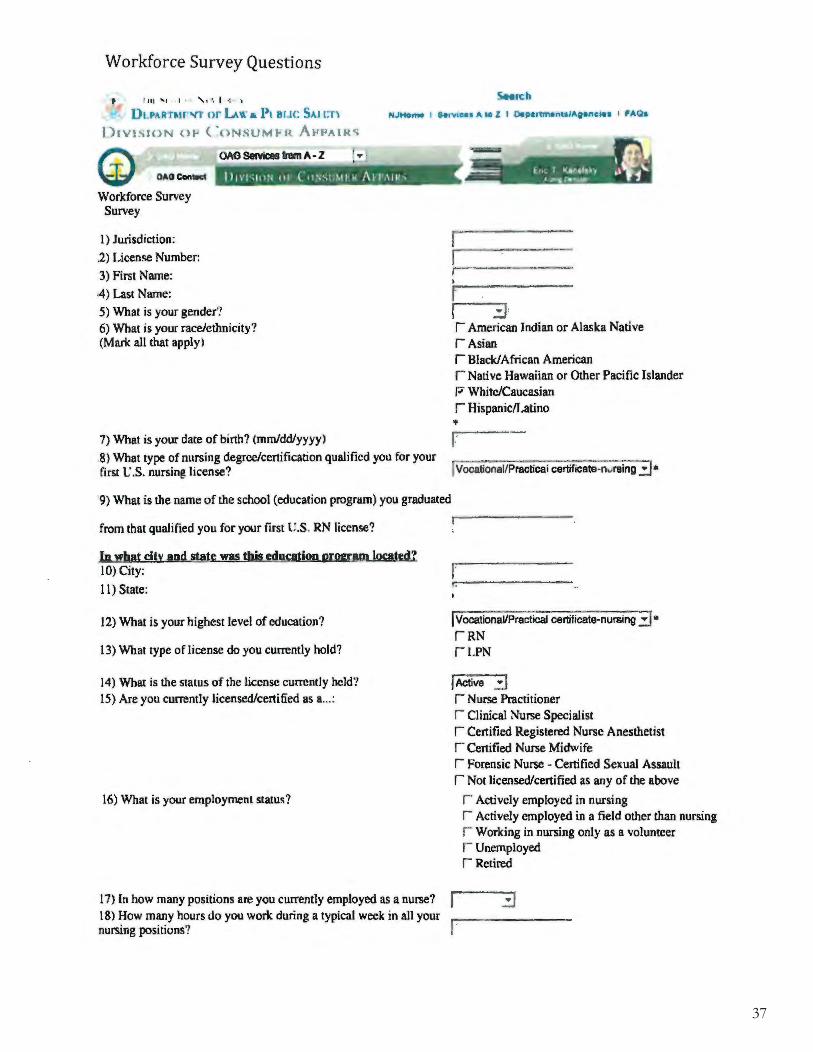
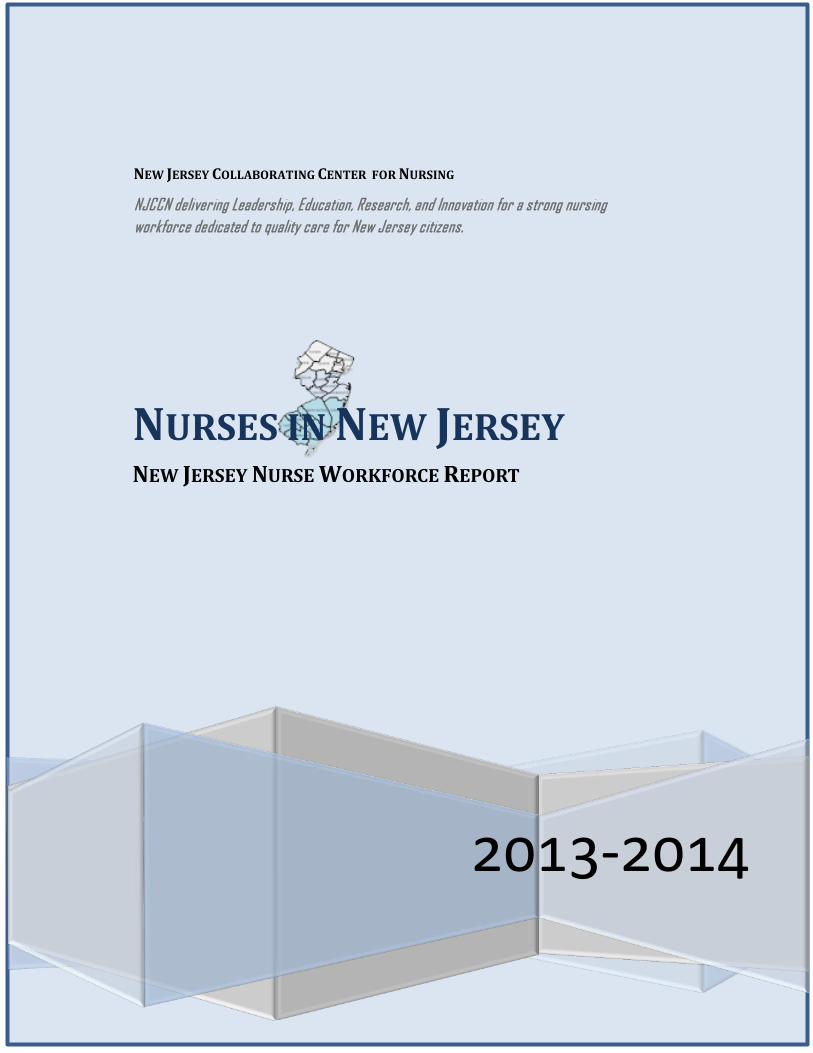
Workforce Survey Questions
' Ill ,, I '· ·.I -: 'I S..n:h
Dt.PARntr"lT or U\\ • J>t auc. SAJ en HJ..._ I UfV\MS A Ml I Oe!llertmentaiAgencles I P'AQI
< ·oNst A 1u.a.rR.~
OAOCon.a
Workforce Survey Survey
1) Jurisdiction: .2) License Number: 3) First Name:
•4) Last Name:
OliO SeMces hm A- Z
5) What is your gender'! 6) What is your race/ethnicity? (Mark all that apply I
J ...
,---1
::l r American Indian or Alaska Native r Asian r Black/African American r Native Hawaiian or Other Pacific Islander P" White/Caucasian r Hispanicfl..atino •
7) What is your date of birth? (mm/dd/yyyy) J: 8) What type of nursing degree/certification qualified you for your first t:.S. nursin~ license? JVocationaVPracticai certificste-n.,raing ::J• 9) What is the name of the school (education program) you graduated
from that qualified you for your first t:.S. RN license'?
In what dty aad state was tbis education progrlf,11 located? 10) City:
11) State:
12) What is your highest level of education?
13) What type of license do you currently hold?
14) What is the status of the license currently held'! 15) Are you currently licensed/certified as a ... :
16) What is your employment statu~?
I Vocational/Practical certificate-nursing :::J * rRN r LPN
JActive :::J r Nurse Practitioner r Clinical Nurse Specialist r Ce11ified Registered Nurse Anesthetist r Certified Nurse Midwife r Forensic Nurse - Certified Sexual Assault r Not licensed/certified as any of the above
r Actively employed in nursing r Actively employed in a field other than nursing r Working in nursing only as a volunteer r Unemployed r Retired
I 7) In how many positions are you currently employed as a nurse? r :o:J 18) How many hours do you work during a typical week in all your nursing positions?
37
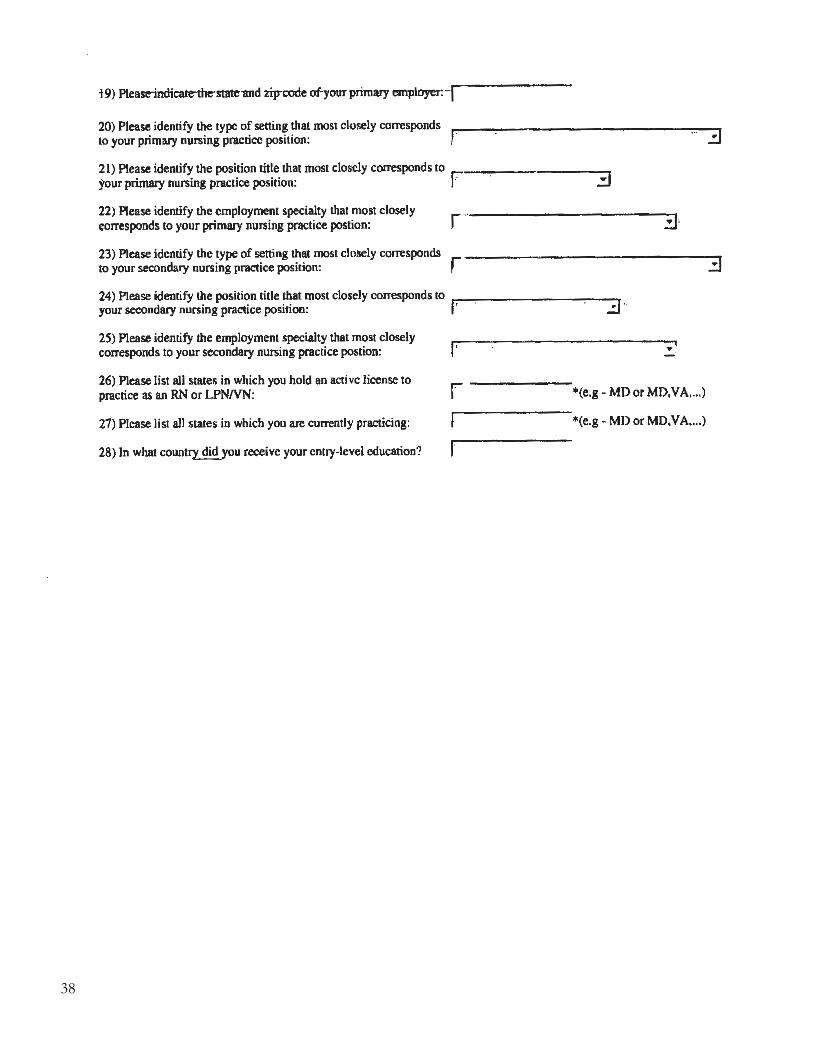
i 9) Please-indicate-the-state-and zip-code of-your primary employer:
20) Please identify the type of setting that most closely corresponds to your primary nursing practice position: I· 21) Please identify the position title that most closely corresponds to r---------- -. your primary nursing practice position: ' 3 22) Please identify the employment specialty that most closely ~rorresponds to your primary nursing practice postion:
... ,
23) Please identify the type of setting thai most closely corresponds r -------------- --.....,. to your secondary nursing practice position: •
24) Please identify the position title that most closely corresponds to .----- -----your secondary nursing practice position: I' iJ · 25) Please identify the employment specialty that most closely corresponds to your secondary nursing practice postion:
26) Please list all states in which you hold an active license to practice as an RN or LPNNN:
27) Please list all states in which you are currently practicing:
28) In what count~}: did you receive your entry-level education?
..:_.
r *(e.g- MD or MD, VA .... )
*(e.g- MD or MD. VA .... )
38

New Jersey Collaborating Center for Nursing Rutgers School of Nursing
180 University Avenue Newark, NJ 07102
Phone: 973-353-2715 Web: www.njccn.org