Embed Size (px)
Citation preview

Evonik.
Power to create.
Company presentation
September 2014

Table of contents
1 Evonik at a glance
2 Investment highlights
3 Group strategy
4 Outlook
5 Appendix
September 2014 | Evonik Roadshow Presentation | Evonik at a glance Page 2

Evonik at a glance
Page 3
Sales 2013
€13 billion
adj. EBITDA 2013
€2 billion
Sales from leading
market positions
80%
Innovation driven by
~ 500 R&D projects
Power to create.
September 2014 | Evonik Roadshow Presentation | Evonik at a glance

One of the world leaders in specialty chemicals
Page 4
Sales €177 m
Adj. EBITDA - €291 m
Corporate/
Other
Sales €786 m
Adj. EBITDA €181 m Services
Sales: €12.708 bn Adj. EBITDA: €2,019 m Margin: 15.9% ROCE: 14.5%
Environment-friendly and
energy-efficient system solutions.
Resource
Efficiency
Sales €3,084 m
Adj. EBITDA €655 m
Margin 21.2%
Products for applications in the
consumer goods, animal nutrition
and healthcare sectors.
Consumer,
Health & Nutrition
Sales €4,171 m
Adj. EBITDA €922 m
Margin 22.1%
Polymer materials and intermediates
mainly for the rubber and plastics
industries.
Specialty
Materials
Sales €4,490 m
Adj. EBITDA €552 m
Margin 12.3%
All data as of fiscal year 2013 (restated due to IFRS 11 changes)
September 2014 | Evonik Roadshow Presentation | Evonik at a glance

Balanced and diversified portfolio
Page 5
1 Based on Specialty Chemicals segments’ 2013 sales 2 Consolidated Group sales 2013 (restated for IFRS 11 changes), continued operations 3 Where not directly assigned to other end-consumer industries
High degree of stability due to well diversified portfolio across various end markets and regions
Other 3%
Asia-Pacific 18%
Central and South America 6%
North America 18% Other European Countries 32%
Germany 23%
Agriculture
Renewable energies
Paper and printing
Paints and coatings3
Metal and oil products
Electrical and electronics
Pharmaceuticals
Other industries
Plastics and rubber3
Construction
Automotive and mechanical engineering
Food and animal feed
Consumer goods and personal care products
15−20% 10−15% 5−10% < 5%
Sales by region2 End market split1
September 2014 | Evonik Roadshow Presentation | Evonik at a glance

Table of contents
1 Evonik at a glance
2 Investment highlights
3 Group strategy
4 Outlook
5 Appendix
September 2014 | Evonik Roadshow Presentation | Investment highlights Page 6

Investment highlights
to deliver sustainable growth
to increase profitability
Strategic and financial discipline:
Clear Commitment:
Our businesses are aligned towards:
Allocation of resources according to global megatrends and high growth opportunities
Value generation for our shareholders
Strengthening of leading market positions by development of tailor-made and innovative solutions together with clients
Proven track record in portfolio optimization
Solid balance sheet and disciplined use of funds
Page 7 September 2014 | Evonik Roadshow Presentation | Investment highlights

Allocation of resources
According to global megatrends and high
growth opportunities (selected examples)
Page 8
1 Market growth p.a. 2012-2020 as per Frost & Sullivan (2013) 2 Market growth p.a. 2012-2020 as per company estimate; 3 CAGR (2012-2020) as per Notch (2013) and Frost & Sullivan (2013)
PA 12 is a high-performance polymer
with innovative properties, making it
an attractive alternative to metal.
Silica acts, amongst others,
as reinforcement and improves
the dynamic properties of rubber.
Methionine is an
essential amino acid
for animal nutrition.
• The use of DL-Methionine can
reduce feed costs by up to 25%
• 100kt methionine
saves 2,300 kt of CO2 emissions
• Lower rolling resistance
and improved wet grip
• ~7.5% less fuel consumption
and 18 meter shorter stopping
distance with category A (green) tire
1 3
5% 8%
Polymers market growth PA12 market growth
4%
10%
Light vehicle tires marketgrowth
Share of silica in the tireindustry for green tires
4% 6%
Feed additives marketgrowth
Methionine market growth 2 1 2 1
Methionine (Consumer, Health & Nutrition)
Silica (Resource Efficiency)
Polyamide12 (Specialty Materials)
• Exceptionally high heat stability,
mechanical stability and rigidity
• Cost savings potential of ~30%
compared to use of steel pipes
September 2014 | Evonik Roadshow Presentation | Investment highlights

global supplier of viscosity modifiers for high
performance lubricant and fuel additive in
automotive and industrial lubricant market
market position in Superabsorbents, a powder
polymer which can absorb up to 500 times its
weight in liquid
Page 9
Key customers
Long-standing relationships and active co-operations with
globally operating lubricant formulators and OEMs e.g.:
Key customers
Key supplier and strategic partner of all large global players
e.g.:
Strengthen leading market positions
Development of tailor made and innovative
solutions together with clients
Oil Additives (Resource Efficiency)
Superabsorbents (Consumer, Health & Nutrition)
#1 #1-2
Joint R&D achievements
High quality, multi-grade hydraulic fluids
allowing for improved equipment productivity,
improved fuel efficiency and reduced emissions
Next steps:
Lubricant components for wind turbine
gear boxes
Joint R&D achievements
Ultrathin and fluffless underwear-like diapers
(up to 80% thinner over the last two decades)
Next steps:
odour control, colour stability
September 2014 | Evonik Roadshow Presentation | Investment highlights

Page 10
Expand leading market
positions
Focus on attractive
growth businesses
and emerging markets
Explore new growth
areas by innovation
and external growth
Selective strengthening of Specialty Chemicals
Portfolio optimization in Specialty Chemicals
Divestment
Carbon Black
Divestment
Colorants
Divestment
Stoko Professional Skin Care
Divestment
Plastic Additives and Plastisols
Focus on Specialty Chemicals
Divestment
Real Estate
Divestment
Energy (51% sold)
Proven track record in portfolio
optimization
September 2014 | Evonik Roadshow Presentation | Investment highlights

• Targeting high-growth end markets
• Focus on Growth Regions (~60% of growth capex)
• Disciplined and flexible investment process
• Solid investment grade rating
(leverage as of Q2 2014: 2.1x vs. target of < 2.5x)1
• Solid funding of pension obligations (~60%)
• Refinancing of upcoming maturities at attractive conditions
• Reliable track record of dividend distribution (CAGR 08-13: 11%)
• Dividend target ratio: ~40% of adjusted net income
• Dividend stability
Internal growth: €6 bn investment program
Sound financial profile
Dividend: Attractive shareholder returns
• Strengthening of high-growth platforms and broadening of existing
competencies and capabilities
• Key criteria: clear strategic fit and value creation
External growth: Selective acquisitions
Page 11
1 Total leverage defined as (net financial debt + unfunded pension obligations) / adj. EBITDA LTM
Solid balance sheet and disciplined
use of funds
September 2014 | Evonik Roadshow Presentation | Investment highlights

Page 12
Clear commitment to deliver sustainable
profitable growth and to increase profitability
Strengthened focus on efficiency gains and cost savings
Ambitious long-term financial targets
Strong balance sheet and strict financial policy
Investment program targeting high-growth end markets
2
3
4
1
~ €500 m On Track 2.0 savings
up to €250 m Admin Excellence savings
~ €18 bn Sales
> €3 bn Adj. EBITDA
Solid investment grade rating
> €700 m incremental
Adj. EBITDA by FY 2018
(excl. M&A)
(by 2016)
by FY 2018
September 2014 | Evonik Roadshow Presentation | Investment highlights

Table of contents
1 Evonik at a glance
2 Investment highlights
3 Group strategy
4 Outlook
5 Appendix
September 2014 | Evonik Roadshow Presentation | Group strategy Page 13
Group strategy
Profitable growth, efficiency and values
Page 14
• Continued shift to high margin applications
• Cost leadership and proprietary production technologies
• Efficiency programs “On Track 2.0” and
“Admin Excellence” in execution
• Focus on attractive businesses and markets
• Ambitious investment program (€6 bn 2012 – 2016)
• External growth through selective acquisitions
• Innovation initiatives addressing future markets
Efficiency
Growth
• Mindset for growth
• Performance culture and diversity
• Value based management and incentive system Values
September 2014 | Evonik Roadshow Presentation | Group strategy

Growth
Ambitious investment program
in growth regions and growth businesses
Page 15
1 Growth investments defined as investments above €2.5 m into growth projects. 2 Includes investments below €2.5 m and maintenance and regulatory compliance investments 3 Growth regions defined as Asia and rest of the world, developed regions defined as Europe and North America. 4 According to Portfolio classification
Investment program 2012 – 2016
2012 - 2016
Growth Investments1
with focus on …
Basis
investments2 ~ €2 bn
~ €4 bn
~ €6 bn
… Growth Regions3
… Growth Businesses4
Growth
regions
~ 60%
Developed
regions
~ 40%
Growth
Businesses
~ 2/3
September 2014 | Evonik Roadshow Presentation | Group strategy

Page 16
Growth
Pipeline of attractive growth projects
Selected approved projects
Segment Product area Location Capex Start-up (expected)
CHN Feed amino acids:
DL-methionine Singapore >€500 m
Q4 2014
CHN Personal & home care
ingredients
China &
Brazil >€100 m
China: Q1 2014
Brazil: Q1 2015
RE Precipitated silica Global
master plan ~€100 m
Brazil: Beginning
of 2016
RE Isophorone and
isophorone diamine China >€100 m Q2 2014
RE Fumed silica and
silanes China ~€100 m 2016
SM H2O2 for HPPO China >€130 m Q2 2014
September 2014 | Evonik Roadshow Presentation | Group strategy

Growth
Disciplined and flexible investment process
Status of growth investments Disciplined and flexible investment process
• Structured planning and approval process:
• Strategic assessment considering competitive
position, market attractiveness, regional focus
and risk
• Economic assessment using DCF-based
investment evaluation
• Strict internal hurdle rates and “competition”
for scarce resources
• Capex allocation based on “strategic roles”
of businesses (growth, financing, restructuring)
• Flexibility in execution, adapting to market situation:
Review & potential re-scheduling of not yet approved
projects with regards to timing of market entry
• Balanced range of project sizes and types
(e.g. debottlenecking, expansion, greenfield projects)
Size of growth investment projects
(as of December 31st, 2013)
~ €4 bn ~50%
Spent
~32%
Planned Approved
~18%
~20%
~20%
€2.5-10 m
~10%
€25-100 m
> €100 m ~50% €10-25 m
∑: ~€4 bn
Page 17 September 2014 | Evonik Roadshow Presentation | Group strategy

Growth
Innovation initiatives addressing future markets
Page 18
R&D Expenditures (€m) R&D Highlight
• SEPURAN® membranes for purification of Biogas:
• Environmentally friendly removal of contained CO2
• Easier and less energy-intense than normal
cleaning process
• Innovative proprietary Evonik’s technology
based on existing polyimide know how
(BU Performance Polymers)
• Evonik’s business potential ~ €100 million
• Significant contribution to making renewable energy
competitive
R&D key figures 2013
• Expenditures of €394 m
• R&D ratio of 3.1%
• ~2,600 employees
• >35 sites within our
global network
• ~500 R&D projects
• >26,000 patents held
and applications filed
• >7,500 registered
trademarks
2013 2012 2011 2010 2009
394382365
338283
9% p.a.
September 2014 | Evonik Roadshow Presentation | Group strategy

Efficiency
On Track 2.0 and Admin Excellence programs
Administrative functions
worldwide
Mainly on productivity improvements at our
sites and procurement
up to €250 m p.a.
by the end of 2016
(high retention rate expected)
~€500 m p.a. by 2016
(partly compensated by
increasing factor costs)
Focus
Expected
Savings
Page 19 September 2014 | Evonik Roadshow Presentation | Group strategy

Table of contents
1 Evonik at a glance
2 Investment highlights
3 Group strategy
4 Outlook
5 Appendix
Page 20 September 2014 | Evonik Roadshow Presentation | Outlook

Outlook for 2014 confirmed and specified
Page 21
Outlook for Evonik in 2014
Prior year figures restated for IFRS 11 changes
Economic
environment
• Still slight upturn in global economic growth expected in 2014 as a whole, even
though development in H1 was somewhat weaker than previously anticipated
• Increasing structural challenges in emerging markets and uncertainty arising
from ongoing political disputes and military conflicts
Outlook
• Sales: slightly higher than in previous year (2013: €12.7 bn)
• Adj. EBITDA: between €1.8 bn and €2.1 bn (2013: €2.0 bn)
• Positive volume trend should continue driven by the completion of
first growth investments
• Stabilization in selling prices from H1 expected to continue; slight positive price
trend visible in some businesses; but price trends in Specialty Materials remained
below original expectations so far
• If this should continue in H2, adj. EBITDA will probably be in the lower rather
than the upper part of the €1.8 bn to €2.1 bn range
• First positive effects of Administration Excellence program
• Downside factors could result from ramp-up expenses for growth investments,
negative currency effects and the rising price of crude oil
September 2014 | Evonik Roadshow Presentation | Outlook

We will …
Clear strategic objectives
expand our leading market positions
focus on our attractive growth businesses and emerging markets
explore new growth areas by innovation and external growth
continuously improve our cost and technology positions
Page 22 September 2014 | Evonik Roadshow Presentation | Outlook
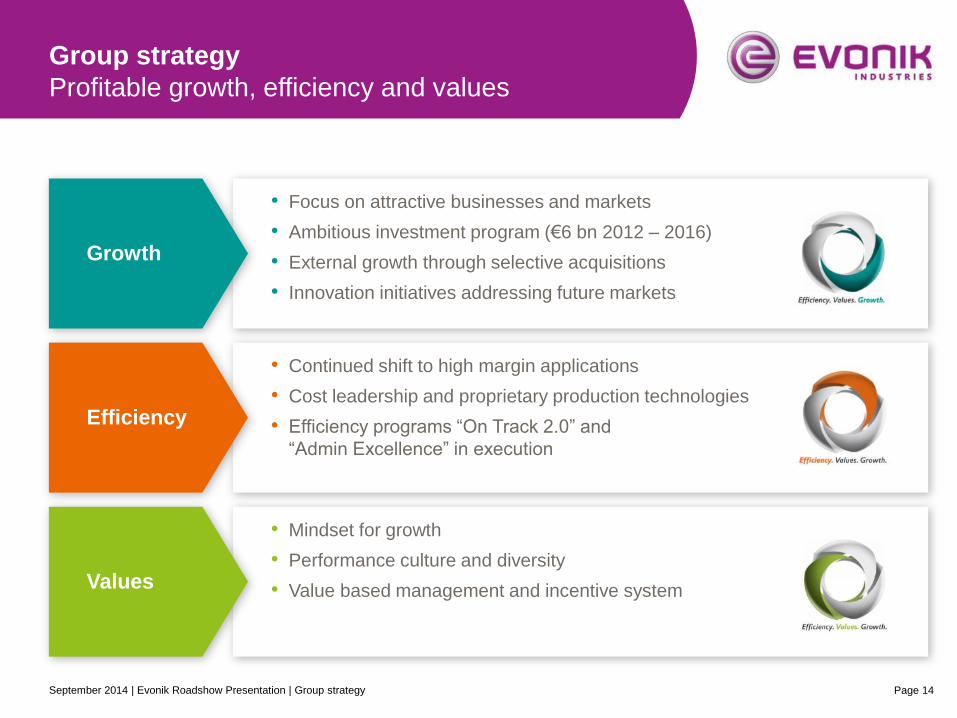
Strengthened focus on efficiency gains and cost savings
Ambitious long-term financial targets
Strong balance sheet and strict financial policy
Investment program targeting high-growth end markets
2
3
4
1
~ €500 m On Track 2.0 savings
up to €250 m Admin Excellence savings
~ €18 bn Sales
> €3 bn Adj. EBITDA
Solid investment grade rating
> €700 m incremental
Adj. EBITDA by FY 2018
Positioned for strong financial performance
(excl. M&A)
(by 2016)
by FY 2018
Page 23 September 2014 | Evonik Roadshow Presentation | Outlook


Appendix
A Financials Q2 2014 & financial policy
B Specialty Chemicals segments
C Upcoming IR events and contact
Page 25 September 2014 | Evonik Roadshow Presentation | Appendix

Page 26
Prior year figures restated for IFRS 11 changes
Financial highlights Q2 2014
Earnings pick-up sequentially;
full year guidance confirmed and specified
Outlook for 2014 confirmed and specified
Adj. EBITDA of €473 m sequentially improved (Q1: €463 m, prior year: €509 m);
Resource Efficiency maintaining high profitability level;
stable business environment in Consumer, Health & Nutrition
Investment program progressing well: Q2 capex increased by 12% yoy to €269 m;
new growth projects in Resource Efficiency announced
Sales of €3,247 m slightly exceed prior year level (+1%);
strong volume growth (+5%) continued, price deflation easing further (-2%)
September 2014 | Evonik Roadshow Presentation | Appendix

Execution of investment program
Growth projects on track
Selected approved projects
Segment Product area Location Capex Start-up (expected)
CHN Feed amino acids:
DL-methionine Singapore >€500 m
Q4 2014
CHN Personal & home care
ingredients
China &
Brazil >€100 m
China: Q1 2014
Brazil: Q1 2015
RE Precipitated silica Global
master plan ~€100 m
Brazil: Beginning
of 2016
RE Isophorone and
isophorone diamine China >€100 m Q2 2014
RE Fumed silica and
silanes China ~€100 m 2016
SM H2O2 for HPPO China >€130 m Q2 2014
Page 27 September 2014 | Evonik Roadshow Presentation | Appendix

Reorganization of Group structure (1/2)
Structural preconditions for more focused growth and
capital allocation
• Structural preconditions for more focused capital allocation and profitable growth in
high-margin specialty chemicals
• Differentiated management tailored to specific needs of individual businesses
• Higher operational and strategic flexibility and independent market approach
• Better positioned to increase long-term value for shareholders
Plans for reorganization
Strategic rationale
• Management holding to concentrate on strategic development of the Group
• Three separate specialty chemicals segments as fully functional legal entities
Page 28 September 2014 | Evonik Roadshow Presentation | Appendix

Reorganization of Group structure (2/2)
Differentiated management tailored to specific needs
of individual businesses
Management Holding
Leading in customized, individual and
innovation-driven solutions
Consumer,
Health & Nutrition Resource Efficiency
• Markets with high margins, GDP+ growth rates
and strong barriers to entry
• Business model based on customized,
individual and innovation-driven solutions
• Above-average profitable growth
• High returns on invested capital
• Targeted investments and acquisitions
Leading in product-
driven activities
Specialty Materials
• More product-driven, energy and raw
material-intensive businesses
• Characterized by integrated technology
platforms, efficient processes and high
market penetration
• Further efficiency and effectiveness
enhancements
• High cash returns
• Investments and, where appropriate,
alliances to secure good market positions
Page 29 September 2014 | Evonik Roadshow Presentation | Appendix

Financial highlights Q2 2014
Another quarter of strong positive volume
development; pricing trend improving
Q2 2013
3,209
+1%
Q2 2014
3,247
Sales (in € m) • Continued strong volume
development (+5%) and further
improving pricing trend
(Q4: -6%; Q1: -4%; Q2: -2%)
• yoy sales growth (+1%) despite
currency headwinds (-2%)
• Adj. EBITDA weaker than prior
year, but sequentially improved at
€473 m
• All segments with earnings
increase qoq
• Adj. EPS affected by higher adj. tax
rate (33%)
• Net financial debt of -€150 m
following increased outflows for
investments and dividend payment
Adj. EBITDA (in € m) / margin
473509
-7%
Q2 2014 Q2 2013
15.9% 14.6%
-10%
Q2 2014
0.37
Q2 2013
0.42
Adj. EPS (in €) Net financial debt (in € m)
-150
-€733 m
30 Jun, 2014 31 Mar, 2014
+583
OSG1: +3%
Prior year figures restated for IFRS 11 changes
1 OSG = Organic sales growth (volume + price development)
Page 30 September 2014 | Evonik Roadshow Presentation | Appendix

Outlook for 2014 confirmed and specified
Page 31
Outlook for Evonik in 2014
Prior year figures restated for IFRS 11 changes
Economic
environment
• Still slight upturn in global economic growth expected in 2014 as a whole, even
though development in H1 was somewhat weaker than previously anticipated
• Increasing structural challenges in emerging markets and uncertainty arising
from ongoing political disputes and military conflicts
Outlook
• Sales: slightly higher than in previous year (2013: €12.7 bn)
• Adj. EBITDA: between €1.8 bn and €2.1 bn (2013: €2.0 bn)
• Positive volume trend should continue driven by the completion of
first growth investments
• Stabilization in selling prices from H1 expected to continue; slight positive price
trend visible in some businesses; but price trends in Specialty Materials remained
below original expectations so far
• If this should continue in H2, adj. EBITDA will probably be in the lower rather
than the upper part of the €1.8 bn to €2.1 bn range
• First positive effects of Administration Excellence program
• Downside factors could result from ramp-up expenses for growth investments,
negative currency effects and the rising price of crude oil
September 2014 | Evonik Roadshow Presentation | Appendix

Segment overview
Sequential earnings improvement in all segments
Prior year figures restated for IFRS 11 changes
Adj. EBITDA development (in € m) / margin (in %)
509 523 381
15.9% 16.4% 12.3%
463
14.5%
473
14.6%
227 215 199 187 188
174 169 140 189 191
128 14795 111 112
-79-73 -58 -75 -72
515053 54 26
Specialty Materials
Resource Efficiency
Consumer,
Health & Nutrition
Group
Corporate / Others
Services
Q2 13 Q3 13 Q4 13 Q1 14 Q2 14
Page 32 September 2014 | Evonik Roadshow Presentation | Appendix

Consumer, Health & Nutrition
Stable performance
Sales (in € m)
Adj. EBITDA (in € m) / Adj. EBITDA margin (in %)
• Sales sequentially improved due to good
volume development in amino acids;
decline yoy driven by normalized
situation in Baby Care and on average
weaker amino acid prices
• Consumer Specialties’ earnings lower
yoy due to reduced volumes in Baby
Care and ramp-up costs for new plants
• Health & Nutrition with sequential
earnings improvement driven by positive
volume trend; yoy comparison still
affected by lower amino acid prices
• Methionine with continued good
performance: stable average prices and
improved volumes qoq; healthy supply
and demand balance expected for H2
• Further price decline in lysine despite
moderate signs of market improvement
498 537 453
551 536 525 525 521
HN
CS
Q2 14
1,003
482
Q1 14
978
Q4 13
1,061
Q3 13
1,034
Q2 13
1,049
498
-4%
188187199215227
Q3 13 Q2 13 Q2 14 Q1 14 Q4 13
-17%
21.6% 20.8% 18.8% 19.1% 18.7%
Q2 14 Volume +2% Price -4% FX -3% Other +/-0%
Prior year figures restated for IFRS 11 changes
Page 33 September 2014 | Evonik Roadshow Presentation | Appendix

Sales (in € m)
Adj. EBITDA (in € m) / Adj. EBITDA margin (in %)
• Resource Efficiency again with increased
sales and earnings yoy supported by
both Business Units
• Margin maintained on high level of 23%
due to ongoing strong volume trend and
high plant utilization
• Silica with strong demand across most
applications; continued currency
headwinds from JPY
• Coatings & Additives’ yoy improvement
enabled by better demand from
automotive and coatings markets and
beneficial product mix
• First volumes produced in new world-
scale plant for isophorone and
isophorone diamine in Shanghai
431 428 379 439 453
370 367 338 366 377
CA
IM
Q2 14
830
Q1 14
805
Q4 13
717
Q3 13
795
Q2 13
801
+4%
191189140
169174
Q2 14 Q1 14 Q4 13 Q3 13 Q2 13
+10%
Resource Efficiency
Continued high profitability
Q2 14 Volume +7% Price +/-0% FX -4% Other +1%
21.7% 21.3% 19.5% 23.5% 23.0%
Page 34 September 2014 | Evonik Roadshow Presentation | Appendix

Specialty Materials
Recovery slower than expected
Sales (in € m)
Adj. EBITDA (in € m) / Adj. EBITDA margin (in %)
• Sales slightly above prior year supported
by still increasing PA12 sales
• Solid volume development; prices again
below last year, but comparables easing
• Demand situation robust for
methacrylates with partly successful
price increases
• Performance affected by planned
maintenance shutdowns in all regions
and still high raw material costs
(acetone)
• Advanced Intermediates facing still
unsatisfactory price levels for C4
products and higher raw material costs
(naphtha); overall price recovery slower
than expected
• First commercial volumes sold out of
new HPPO plant in China
663 620 716
459 469 439461 476
AI
PP
Q2 14
1,174
697
Q1 14
1,177
Q4 13
1,059
Q3 13
1,132
Q2 13
1,129
670
+4%
11211195
147128
Q2 14 Q1 14 Q4 13 Q3 13 Q2 13
-13%
Q2 14 Volume +7% Price -3% FX +/-0% Other +/-0%
11.3% 13.0% 9.0% 9.4% 9.5%
Page 35 September 2014 | Evonik Roadshow Presentation | Appendix

Net financial debt
Capex and dividend payment turning net cash
into net financial debt again
Development of net financial debt (in € m)
Prior year figures restated for IFRS 11 changes
1 Total leverage defined as (net financial debt + unfunded pension obligations) / adj. EBITDA LTM
2 Cash outflow for investments in intangible assets, property, plant and equipment and shareholdings, not including cash in- and outflows related to divestments and securities
-€733 m
Dividend CF from
investing
activities
(cont. op.)2
CF from
operating
activities
(cont. op.)
+583
Net financial debt
as of 30 Jun, 2014
-19
Other
-266
Net cash position
as of 31 Mar, 2014
-466
+18
-150
Total leverage1
1.8x Total leverage1
2.1x
Page 36 September 2014 | Evonik Roadshow Presentation | Appendix
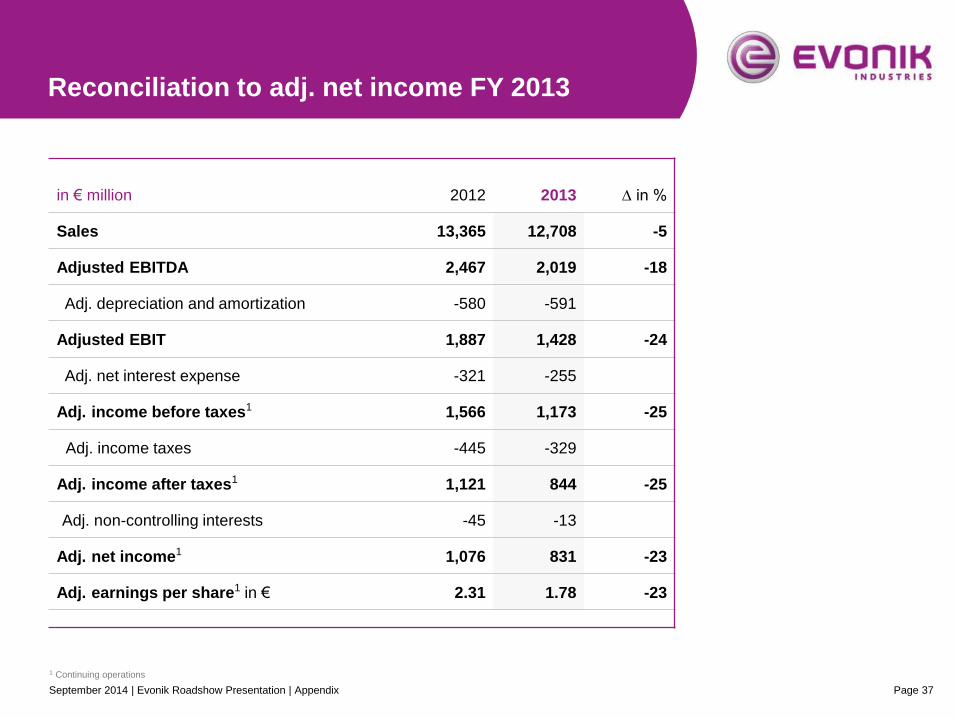
Reconciliation to adj. net income FY 2013
Page 37
in € million 2012 2013 ∆ in %
Sales 13,365 12,708 -5
Adjusted EBITDA 2,467 2,019 -18
Adj. depreciation and amortization -580 -591
Adjusted EBIT 1,887 1,428 -24
Adj. net interest expense -321 -255
Adj. income before taxes1 1,566 1,173 -25
Adj. income taxes -445 -329
Adj. income after taxes1 1,121 844 -25
Adj. non-controlling interests -45 -13
Adj. net income1 1,076 831 -23
Adj. earnings per share1 in € 2.31 1.78 -23
1 Continuing operations
September 2014 | Evonik Roadshow Presentation | Appendix

Strong financial track record
Page 38
ROCE(%) Adj. net income (€m)
Adj. EBITDA (€m) and margin1 (%) Sales (€m)
Note: 2013 restated due to IFRS 11; all figures without Steag. 1 Excluding Carbon Black
Carbon Black/Real Estate
10.889 9.267
11.701 13.316 13.365
2012
13,365
2011
14,540
2010
13,300
2009
10,518
2008
12,474
271 360
974 831
1,076
1,256
7.7 7.7
15.0
18.7 20.4
14.5
13.6% 16.1% 18.3% 19.0%
1.312 1.374
2.022 2.439
2012
2,467
2011
2,768
2010
2,365
2009
1,607
2008
1,648
18.5%
12,708
2013 2013
2,019
15.9%
2012 2011 2010 2009 2008 2013 2012 2011 2010 2009 2008 2013
September 2014 | Evonik Roadshow Presentation | Appendix

Growth investments and efficiency gains drive
adj. EBITDA to > €3 bn by 2018
Underlying Growth
• Focus on pricing power (value-based
pricing, differentiation etc.)
• Product innovation driven by close
customer relationships
• Improved product and customer mix
• Operating leverage (increased
capacity utilization)
(Net)
Efficiency Gains Adj. EBITDA
2018
> €3 bn
Growth
Investments
> €0.7 bn
Underlying
Growth Adj. EBITDA
2013
~ €2.0 bn
(Net) Efficiency Gains
• Execution of On Track 2.0 and
realization of additional cost savings
Partly compensated by:
• Factor cost increases (energy,
salaries, regulation etc.)
• Investments into growth markets as
basis for future growth
CAGR >8%
(excl. M&A)
Page 39 September 2014 | Evonik Roadshow Presentation | Appendix

583580
960
2015 2013 Sustainable
level
2016 2014 20121
Capex
Adjusted D&A
1 Excl. Real Estate 2 Basis investments defined as small investments (below €2.5 m focused on growth or efficiency improvements) and maintenance capex (maintenance and regulatory compliance investments)
• Investment program
resulting in capex
peak in 2014/15,
leveling off thereafter
• Flexibility in timing and
execution, e.g.:
Capex 2013 reduced
to €1.1 bn
(from €1.5 bn)
• From 2017:
Return to sustainable
capex level, thereof
~ €450 m basis
investments2
Capex planning and adj. D&A (in € m)1
1,135
~1,500 max. capex level
Flexibility
Flexibility in investment program
Guidance 2014:
up to 1,400
Page 40 September 2014 | Evonik Roadshow Presentation | Appendix
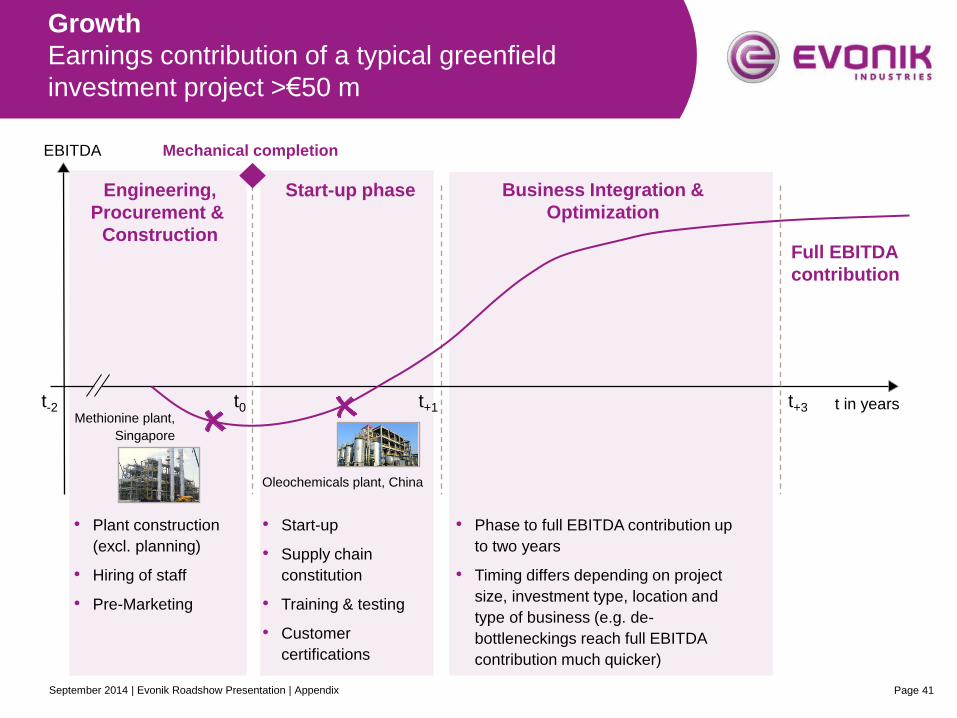
t-2
Growth
Earnings contribution of a typical greenfield
investment project >€50 m
EBITDA
t in years t0
Engineering,
Procurement &
Construction
Start-up phase Business Integration &
Optimization
Full EBITDA
contribution
• Plant construction
(excl. planning)
• Hiring of staff
• Pre-Marketing
Oleochemicals plant, China
Methionine plant,
Singapore
• Start-up
• Supply chain
constitution
• Training & testing
• Customer
certifications
• Phase to full EBITDA contribution up
to two years
• Timing differs depending on project
size, investment type, location and
type of business (e.g. de-
bottleneckings reach full EBITDA
contribution much quicker)
t+1 t+3
Mechanical completion
Page 41 September 2014 | Evonik Roadshow Presentation | Appendix

1 Total leverage defined as (net financial debt + unfunded pension obligations) / adj. EBITDA 2 Defined benefit obligations
Strict financial policy
Page 42
Intend to keep
total leverage
ratio
below 2.5x1
Envisage
robust
funding level
of DBO2
Strive to
maintain
solid
investment
grade rating
Evonik aims to remain a reliable partner for both its bond investors and banks
Financial Policy
September 2014 | Evonik Roadshow Presentation | Appendix

843
4,585
3,742
2010
5,598
3,921
1,677
2009
6,636
4,269
2,367
2008
7,254
3,905
3,349
3,264
DBO -
Plan Assets
Net
Financial Debt
2013 2012
5,461
4,298
1,163
2011
(€m)
Increase of DBO
due to decrease
of discount rate
1,300
Total
Leverage1 3.4x 4.1x 2.4x 1.7x 2.1x 1.3x
Further significant deleveraging
through Real Estate divestment
3.78 Discount rate 4.76 5.03 5.54 6.02
-60%
Page 43
3.84
-571
2,693
1 Total leverage defined as (net financial debt + unfunded pension obligations) / adj. EBITDA LTM
September 2014 | Evonik Roadshow Presentation | Appendix

Page 44
• Pension provisions increased to
€3.97 bn after Q1 from €3.33 bn at
year-end 2013
• Result of adjustment of applicable
interest rate in Germany and the
Euro-Countries from 3.75% to
3.25% due to further yield decline of
AA-rated Euro-bonds
• Effect offset against equity without
impact on cash or earnings
-583-571
843
Q1 2014
3,388
3,971
Q2 2014
4,027
3,877
150
2010
4,956
3,279
1,677
2013
2,760
3,331
2012
5,543
4,380
1,163
2011
3,648
2,805
Pension provisions Net financial debt
Global discount rate1
Discount rate for Germany
Prior year figures restated for IFRS 11 changes
1 Calculated annually
5.03 4.76 3.78 3.84
5.00 4.75 3.75 3.75 3.25 3.25
Development of pension provisions
Development of pension provisions (in € m)
September 2014 | Evonik Roadshow Presentation | Appendix

Debt maturity profile
Page 45
0
200
400
600
800
1.000
2020 2019 2018 2017 2016 2015 2014
Bonds Other debt
instruments
• Upcoming €750m bond maturity in
October 2014
• Policy to fund long-term debt through
Capital Markets
• €3bn Debt Issuance Program in place;
last updated in February 2014
• Undrawn Syndicated RCF as backup
• €1.75bn; increased by €0.25bn in
Sept 2013
• Two tranches of €875m each
with extension options (3+1+1
and 5+1+1), of which the first
options were exercised during
Q2 2014
Undrawn credit
facilities
Debt maturity profile as of June 30, 2014 (in € m)
September 2014 | Evonik Roadshow Presentation | Appendix

Pension obligations well financed
Page 46
in € m 2012 2013 Q2 2014
Pension Funding Gap1 4,298 3,264 3,819
• Pension Funding Gap increased in Q1
2014 due to lower discount rate in
Germany (3.25% vs. 3.75%)
• Funding Ratio remains on a solid level
of ~60%
• Further cash contributions of €200
m intended in 2014/15 each
Pension
Funding
Ratio
~60%
unfunded
Pensions
kasse
Degussa
& other
plan
assets
CTA Further
cash contribution
in 2014/15
Pension overview as of June 30, 2014 (in € m)
1 DBO – plan assets
September 2014 | Evonik Roadshow Presentation | Appendix

Rating development
Page 47
Mai 10 Nov 10 Mai 11 Nov 11 Mai 12 Nov 12 Mai 13 Nov 13
S&P Moody's
BBB+
Baa1
BBB
Baa2
BBB-
Baa3
BB+
Ba1
A-
A3
Baa2 /positive
BBB+ /stable
• Rating upgrade by Moody’s to Baa2
with positive outlook in March 2013 –
confirmed in March 2014
• S&P’s rating BBB+ with stable
outlook since May 2012 – confirmed
in June 2014
• Impressive rating dynamic thanks to
focus on specialty chemicals and
clear financial policy
• Maintaining a solid investment grade
rating is an integral part of our
financial policy
Investment
grade
Speculative
grade
Rating positioned in upper range of BBB
September 2014 | Evonik Roadshow Presentation | Appendix

Dividend history (in €) Dividend Policy
0.60
2011 2010 2012
0.69
2009
0.92 0.91 0.86
2008
+11%
2013
1.00
34% 56% Payout ratio
(in % of adj. EPS)
Two components of Evoniks dividend policy:
1) Targeted payout ratio:
~40% of adjusted net income
2) Additionally, target of dividend
stability
Clear historical track record with regards
to dividend policy and shareholder returns
(also pre-IPO)
Dividend increase in 2014 supported by
significant cash inflows from Real Estate
divestment
Dividend policy
Attractive returns for shareholders
37% 43%
Page 48 September 2014 | Evonik Roadshow Presentation | Appendix

Management compensation (as of 2014)
Value creation focus anchored in management
incentivization system at Board level
Fixed salary
(c.30%) • To be paid in cash for each financial year on a monthly basis
Bonus
(c.33%)
• To be paid out in cash annually
• Pay-out calculated on the basis of the achievement of certain, primarily value creation
focused KPIs (e.g. ROCE, adj. net income, adj. EBITDA)
• Factor of between 0.8 and 1.2 to take into account the achievement of further
individual targets
• Bonus capped at 200% of initial target
Long term
incentive plan
(c.37%)
• Granted LTI target amount is calculated in virtual shares (4-year lock-up)
• Value of LTI to mirror the development of Evonik’s share price (incl. dividends)
• Amount payable is determined by two performance elements:
• Absolute performance: Real price of the Evonik share
• Relative performance against to external index benchmark (MSCI Chemicals)
• Bonus capped at 300% of initial amount
• To be paid out in cash after lock-up period
Page 49 September 2014 | Evonik Roadshow Presentation | Appendix

Stock exchange listing RAG-Stiftung
Trading of the Evonik stock commenced on April
25, 2013 in the Prime Standard of Frankfurt Stock
Exchange and in Luxembourg
14.2% of shares were successfully placed in
advance of the listing
Obligation to finance the perpetual liabilities arising
as from 2019 from the cessation of hard-coal mining
Intention to retain a strategic shareholding in Evonik
of at least 25.1 percent in the long term
Exchangeable Bond issued in June 2014,
exchangeable into Evonik shares
If bond is fully settled with shares, free float
would theoretically increase by ~3%, at the
latest at maturity (December 2018)
CVC
Shares held by Gabriel Acquisitions GmbH, an
indirect subsidiary of funds advised by CVC
Exchangeable Bond issued in November 2013,
exchangeable into and secured by Evonik shares
If bond is fully settled with shares, free float
would theoretically increase by ~2%, at the
latest at maturity (November 2016)
Free Float
RAG-Stiftung
~67.9%
~14.2%
1 CVC ~17.9%
Evonik Industries AG
Ownership structure
1 Shares held by Gabriel Acquisitions GmbH, an indirect subsidary of funds advised by CVC
Page 50 September 2014 | Evonik Roadshow Presentation | Appendix

Appendix
A Financials Q2 2014 & financial policy
B Specialty Chemicals segments
C Upcoming IR events and contact
Page 51 September 2014 | Evonik Roadshow Presentation | Appendix

Specialty Chemicals segments
Overview
Se
gm
en
ts
Consumer, Health & Nutrition
Sales: €4,171 m
Adj. EBITDA: €922 m
Consumer
Specialties
Sales: €2,157 m
Health & Nutrition
Sales: €2,015 m
Personal Care
(20%)
Methionine
(~60%)
Health Care
(~20%)
CyPlus
Technologies
(~5%)
Bioproducts
(~15%)
Household Care
(15%)
Interface &
Performance
(~10%)
Baby Care
(~45%)
Comfort &
Insulation (10%)
Resource Efficiency
Sales: €3,084 m
Adj. EBITDA: €655 m
Inorganic Materials
Sales: €1,436 m
Coatings & Additives
Sales: €1,648 m
Silica
(~65%)
Crosslinkers
(~30%)
Coating &
Adhesive Resins
(~30%)
Oil Additives
(~30%)
Coating
Additives (~10%)
Silanes
(~25%)
Catalysts
(~10%)
Specialty Materials
Sales: €4,490 m
Adj. EBITDA: €552 m
Performance
Polymers
Sales: €1,810 m
Advanced
Intermediates
Sales: €2,680 m
Acrylic
Monomers
(~35%)
Performance
Intermediates
(~70%)
Functional
Solutions
(~10%)
Agrochemicals
& Polymer
Additives
(~10%)
Active Oxygens
(~10%)
Acrylic
Polymers (~40%)
High
Performance
Polymers (~25%)
Bu
sin
es
s
Un
its
Bu
sin
es
s
Lin
es
Page 52
All data as of fiscal year 2013 (restated due to IFRS 11 changes)
September 2014 | Evonik Roadshow Presentation | Appendix

Consumer, Health & Nutrition
BU Consumer Specialties
Personal Care Household Care Comfort &
Insulation Interface & Perform. Baby Care
Applications
• Personal care
• Occupational skin
care
• Laundry care
• Home care
• Car care
• Furniture / appliances
• Construction
• Automotive
• Packaging / tapes
• Agrochemicals
• Plastic additives
• Baby care
• Female care
• Adult care
Key products
• Actives, emulsifiers,
conditioners
• Skin cleansers
• Fabric conditioners
• Specialty surfactants
• Foam stabilizers
• Catalysts
• Release agents
• Release coatings
• Super spreading
additives
• Superabsorbents
Sales split 2013 ~20% ~15% ~10% ~10% ~45%
Market position1 # 4 in cosmetic
ingredients # 1 in fabric softeners
# 1 in polyurethane foam
additives # 1-2 in release coatings # 1-2 in superabsorbents
Main competitors
• Croda
• BASF / Cognis
• Ashland / ISP
• AkzoNobel
• BASF / Cognis
• Solvay / Rhodia
• Stepan
• Air Products
• Dymatic
• Momentive
• Clariant
• Dow Corning
• Momentive
• Wacker
• BASF
• Nippon Shokubai
1 Company estimates for relevant markets based on multiple research reports 2 Defined as Top 1-3 positions; as per Company estimates, based on multiple research reports
Page 53 September 2014 | Evonik Roadshow Presentation | Appendix

Consumer Specialties: Personal Care
Two strategic pillars
Americana, Brazil
• Capacity: 50 kt/a
• Start up: 2014
Shanghai, China
• Capacity: 80 kt/a
• Start up: End of 2013
• Construction of two integrated specialty
surfactants production platforms (bio-based)
• Focus on Personal and Household Care
products (plus selected industrial applications)
• Participate from growth in local emerging
markets
Growth in emerging regions
Ongoing strategic development towards higher value-added specialty products
Increasing focus on specialty products
1
2
Skin-identical
ceramides
(1999)
Creatine
(2002)
Hyaluronic acid
(2005)
Phyto-
chemicals
(2008)
Peptides
(2009)
Microbial &
marine extracts
(2012)
Page 54 September 2014 | Evonik Roadshow Presentation | Appendix

Leading suppliers and customers
with high market share1
Three major growth applications for
Superabsorbents
BASF
Evonik Others
Nippon
Shokubai
Market characteristics
• Solid market growth of 6% p.a.,
- driven by growing demand for disposable
diapers and other hygiene products
- with focus in emerging regions
(growing wealth)
- with low demand volatility
• Balanced market with utilization rates >90%
• Additional capacities to be absorbed by healthy
market growth
• Evonik one of three big superabsorbents producers
and strategic partner of big diaper manufacturers
Adult
hygiene
Female
hygiene
Disposable
diapers
1 As of 2012
• Superabsorbents are powder polymers which can absorb up to 500 times its weight in liquid and do not release it even under pressure
Consumer Specialties: Baby Care
Consolidated markets with strong and robust growth
Page 55 September 2014 | Evonik Roadshow Presentation | Appendix
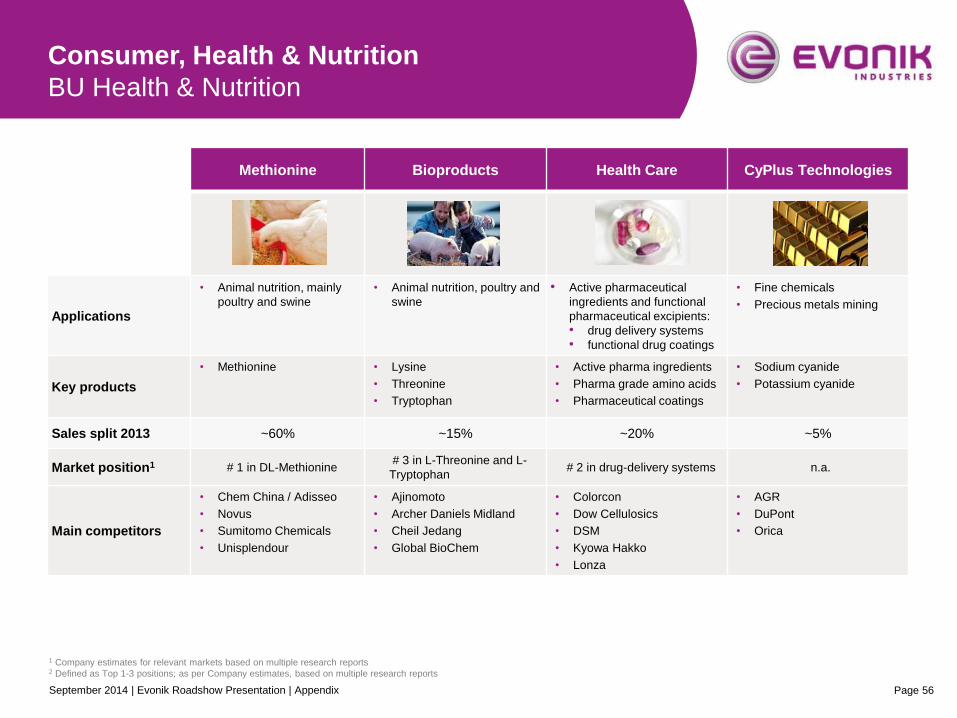
Consumer, Health & Nutrition
BU Health & Nutrition
Methionine Bioproducts Health Care CyPlus Technologies
Applications
• Animal nutrition, mainly
poultry and swine
• Animal nutrition, poultry and
swine
• Active pharmaceutical
ingredients and functional
pharmaceutical excipients:
• drug delivery systems
• functional drug coatings
• Fine chemicals
• Precious metals mining
Key products
• Methionine • Lysine
• Threonine
• Tryptophan
• Active pharma ingredients
• Pharma grade amino acids
• Pharmaceutical coatings
• Sodium cyanide
• Potassium cyanide
Sales split 2013 ~60% ~15% ~20% ~5%
Market position1 # 1 in DL-Methionine # 3 in L-Threonine and L-
Tryptophan # 2 in drug-delivery systems n.a.
Main competitors
• Chem China / Adisseo
• Novus
• Sumitomo Chemicals
• Unisplendour
• Ajinomoto
• Archer Daniels Midland
• Cheil Jedang
• Global BioChem
• Colorcon
• Dow Cellulosics
• DSM
• Kyowa Hakko
• Lonza
• AGR
• DuPont
• Orica
1 Company estimates for relevant markets based on multiple research reports 2 Defined as Top 1-3 positions; as per Company estimates, based on multiple research reports
Page 56 September 2014 | Evonik Roadshow Presentation | Appendix

Solution provider:
Only producer of first four
limiting essential amino
acids in animal nutrition:
methionine, lysine,
threonine and tryptophan
Direct access to customers:
>90% of sales directly to customers via global sales and service network of Evonik;
customers range from pre-mixers and feed producers to fully integrated meat and food
producers
Strong partnerships:
Preferred partnerships with
customers through tailor-
made services
New applications:
Continuous broadening of product base by new applications, e.g. in aquaculture
Health & Nutrition: Feed Additives
Evonik offers first four limiting essential amino acids
Page 57 September 2014 | Evonik Roadshow Presentation | Appendix
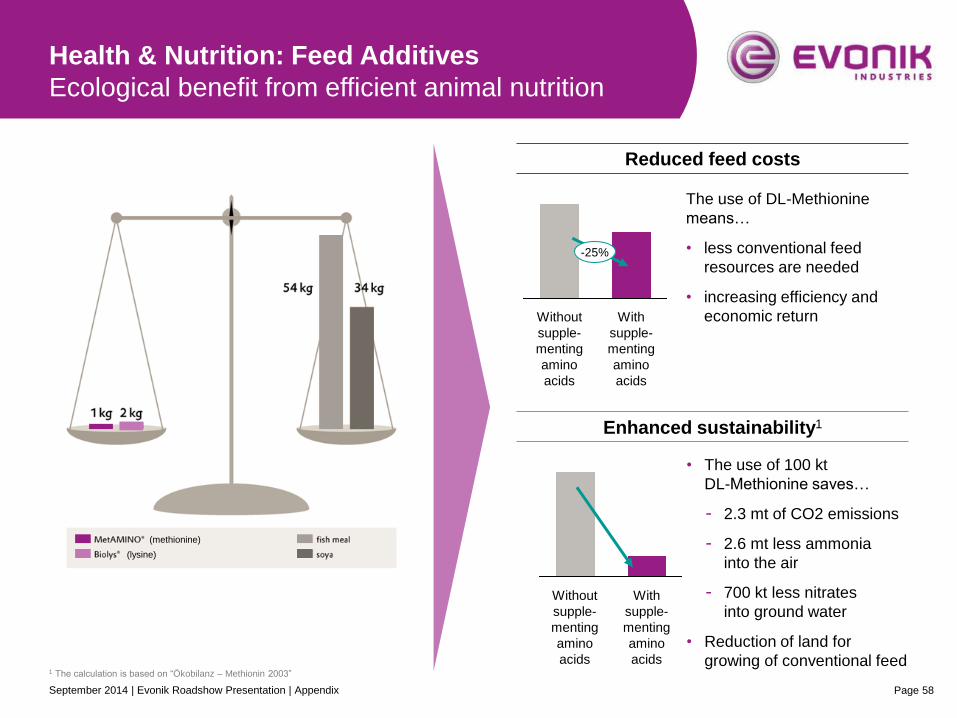
Health & Nutrition: Feed Additives
Ecological benefit from efficient animal nutrition
Reduced feed costs
Enhanced sustainability1
• The use of 100 kt
DL-Methionine saves…
- 2.3 mt of CO2 emissions
- 2.6 mt less ammonia
into the air
- 700 kt less nitrates
into ground water
• Reduction of land for
growing of conventional feed
With
supple-
menting
amino
acids
Without
supple-
menting
amino
acids
-25%
With
supple-
menting
amino
acids
Without
supple-
menting
amino
acids
The use of DL-Methionine
means…
• less conventional feed
resources are needed
• increasing efficiency and
economic return
1 The calculation is based on “Ökobilanz – Methionin 2003”
(methionine)
(lysine)
Page 58 September 2014 | Evonik Roadshow Presentation | Appendix

Health & Nutrition: Methionine
Backwards integrated production
1 Hazardous compounds not available from chemical commodity markets
Source: Company estimate
Evonik with clear competitive advantages
– – Backwards
integration
– – World scale
production
– Process
technology
– – – Global market /
customer access
– – – – – Value added
services
– – Nutritional know-
how
Raw
materials
Methionine specific
intermediates1 Methionine
Propene
Methanol
Sulfur
Methane
Ammonia
Acrolein
Hydrocyanic acid
MMP
MetAMINO®
Methyl mercaptane
Evonik production set up
A software that calculates the
optimal formulation of poultry feed
given specific breeding conditions
Cost efficient backwards integrated process
Examples of Evonik’s value-added services
Consulting, hardware and software
enabling micro ingredient handling
and dosing in feed mills
Oth
ers
Com
pe
tito
r I
Com
pe
tito
r II
Com
pe
tito
r II
I
Evo
nik
Page 59 September 2014 | Evonik Roadshow Presentation | Appendix

Silica Silanes Catalysts
Applications
• Silicone rubber
• Green tires & rubber
• Paints & coatings
• Adhesives & sealants
• Optical fibres
• Fumed silica
• Adhesive & sealents
• Building protection
• Catalysts for fine chemicals and
polyolefins
• Enabler for process innovation
Key products
• Precipitated silica
• Fumed silica
• Special oxides
• Chlorosilanes
• Organofunctional silanes
• Rubber silanes
• Precious metal catalysts
• Activated base metal catalysts
Sales split 2013 ~65% ~25% ~10%
Market position1 # 1 in precipitated silica
# 1 in chlorosilanes
# 1 in organofunctional and rubber
silanes
#1 for precious metal powder catalysts
#2 for activated base metal catalysts
Main competitors
• Cabot
• JM Huber
• Solvay
• Wacker
• OCI
• Dow Corning
• Momentive
• Shin Etsu
• BASF
• Clariant
• Johnson Matthey
• WR Grace
1 Company estimates for relevant markets based on multiple research reports 2 Defined as Top 1-3 positions; as per Company estimates, based on multiple research reports
Page 60
Resource Efficiency
BU Inorganic Materials
September 2014 | Evonik Roadshow Presentation | Appendix

Base raw
materials
Marketed
products
Evonik integrated production set up
Quartz
Silicon
Intermediate raw
materials
Waterglass Precipitated
silica
Fumed silica
= purchased raw materials
Precipitation process
• Superior process technology due to integrated silica-silane production platform
• Global footprint close to key customers
• Strong R&D and application technology driving innovation
(Organo-,
Rubber- &
Chloro-)
Silanes
Key advantages
Applications
Inorganic Materials: Silica
Efficient integrated production platform for silica and
silanes
Pyrogenic process
Page 61 September 2014 | Evonik Roadshow Presentation | Appendix

Inorganic Materials: Silica
Leading market positions with strong established
brands in growth markets
#1 #1
Main competitors
Cabot
Wacker
Tokuyama
Main competitors
Solvay
JM Huber
PPG
OSC
Precipitated Silica Fumed Silica
Diverse end market split in strongly growing end markets
Evonik Evonik
Electronics Coatings
24%
Automotive Other
29%
3%
3%
17%
Plastics & Rubber
4% Home 18%
Food & Beverages
Lead acid batteries ~ 5%2
(automotive, e-bike, UPS)
Global light vehicle tires ~ 4%1
Low rolling resistance tires ~19%1
Coating; Paints & Coatings ~ 5%1
Plastics & Rubber ~ 5%1
1 2012-2020E; as per Frost & Sullivan (2013) 2 2012-2020E; as per company estimate
Sales split by end market (2012) Expected Market Growth 2012-2020
Page 62 September 2014 | Evonik Roadshow Presentation | Appendix

Resource Efficiency
BU Coatings & Additives
Crosslinkers Oil Additives Coating Additives Coating & Adhesive
Resins
Applications
• Composites
• Coatings & paints
• Flooring
• Automotive interior
• Auto & industrials
• Hydraulic systems
• Refinery processing
• Biofuels
• Eco-friendly coatings (low
VOC, water based)
• High solid industrial coatings
• Hot melt
• Pre coated metal
• Protective coatings
• Road marking
Key products
• Crosslinkers for
composites, elastomers
and non-solvent coatings
• Lubricant additives
(viscosity modifiers)
• Fuel additives
• Additives for eco-friendly
and highly solid industrial
coatings
• Functional resins
• Adhesive hot melts
• Heat sealents
• Polybutadiene
Sales split 2013 ~30% ~30% ~10% ~30%
Market position1 # 1 in isophorone chemicals # 1 oil additives # 1 in organically modified
silicones # 1 in polyester resins
Main competitors
• Arkema
• BASF
• Bayer
• Infineum
• Lubrizol
• NewMarket
• Oronite
• Air Products
• Altana
• Dow Corning
• Dow
• DSM
• Mitsubishi Chemical
1 Company estimates for relevant markets based on multiple research reports 2 Defined as Top 1-3 positions; as per Company estimates, based on multiple research reports
Page 63 September 2014 | Evonik Roadshow Presentation | Appendix

Coatings & Additives: Crosslinkers
Positioning in attractive growth markets
Crosslinkers – Characteristics and advantages
• Only fully integrated player in Isophorone chemistry
• Extensive application know-how for various industries
• Leading cost position and technology leadership from
innovation
• Focus on diamines for epoxy-curing in coatings, flooring
and high performance composites
• Isophorone chemistry with solid market growth1:
Chinese investment project progressed
• First integrated mover into high-growth Chinese market
• World-scale integrated IP/IPD plant
• Start up expected in early 2014
Only player with global production setup
(Europe, Americas, Asia)
2020
200 kt
2012
300 kt 5%
CAGR
Application examples & product characteristics
Next generation scratch
resistant coating technology for
premium applications
Lightweight
Construction
Raw materials for high
performance industrial floorings
for high-tech applications
Composites for light-weight
construction
Coatings
1 Company estimates
Page 64 September 2014 | Evonik Roadshow Presentation | Appendix

Coatings & Additives: Oil Additives
First choice technology for efficiency improvement in
lubricants, fuel & petro industries
Sourcing Marketing
Gear and transmission oil
Engine oil
Biodiesel
Automotive
Hydraulic fluids
Construction
Industrial gear oils
Dewaxing aids
Crude oil flow improver
Industry & refining
Customer benefits Application examples for Oil Additives
High-performance components in lubricants
Flowing over a wide temperature range
without solidifying
• Fuel saving and efficiency
• Productivity and power
• Component durability
• Reduction of CO2 Emissions
Oil Additives improve efficiency, performance and
service life of engines and hydraulic systems
Page 65 September 2014 | Evonik Roadshow Presentation | Appendix

Specialty Materials
BU Performance Polymers
High Performance Polymers Acrylic Monomers Acrylic Polymers
Applications
• Medical
• Photovoltaic systems
• Automotive components
• Oil & gas pipes
• Coatings
• PMMA
• Specialty monomer applications (e.g.
disposable contact lenses)
• LED/touch screens
• Photovoltaic
• Light-weight systems
• Automotive components
Key products
• High performance polyamide
(PA12)
• Polyetheretherketone (PEEK)
• Polyimide fibres and foams
• Methy methacrylate (MMA) and
application monomers
• Methacrylic acid
• Molding compounds
• Acrylic sheets (Plexiglas / Acrylite)
• PMMA systems
Sales split 2013 ~25% ~35% ~40%
Market position1 # 1 in polyamide 12 # 2 in MMA # 1-2 in PMMA
Main competitors
• Arkema
• DuPont
• EMS
• Victrex
• LG MMA
• Mitsubishi Chemicals
• Sumitomo
• Arkema
• Mitsubishi Chemicals
• Sumitomo
1 Company estimates for relevant markets based on multiple research reports 2 Defined as Top 1-3 positions; as per Company estimates, based on multiple research reports
Page 66 September 2014 | Evonik Roadshow Presentation | Appendix

SEPURAN®
VESTAKEEP®
Performance Polymers
Focused on engineering & customized high-end
polymers
Engineering
polymers
Commodity
polymers
High
performance
polymers
Price driven
• higher volumes
• lower margins
Performance driven
• higher growth
• higher margins
Polymer markets segmentation and Evonik market positions
#2
PEEK
#1/#2
PMMA
PP PE
PVC
PEK
PS PPE
PA6
PVDF
POM
PA11
PC PPC
ROHACELL®
Expertise in systems
and applications
#1
PA12 PI
Page 67 September 2014 | Evonik Roadshow Presentation | Appendix
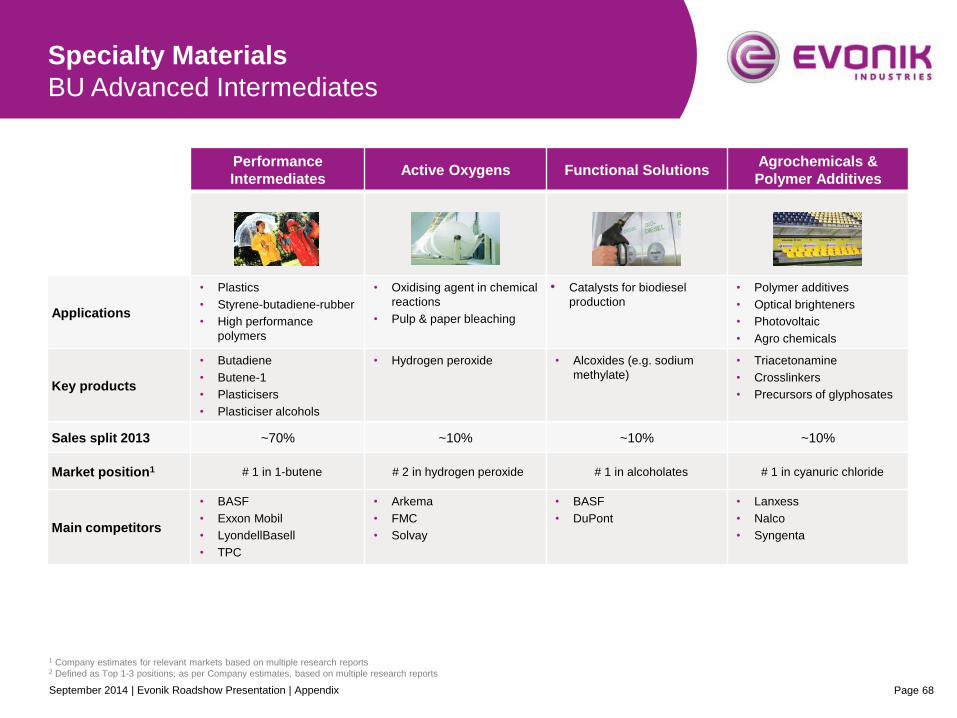
Specialty Materials
BU Advanced Intermediates
Performance
Intermediates Active Oxygens Functional Solutions
Agrochemicals &
Polymer Additives
Applications
• Plastics
• Styrene-butadiene-rubber
• High performance
polymers
• Oxidising agent in chemical
reactions
• Pulp & paper bleaching
• Catalysts for biodiesel
production
• Polymer additives
• Optical brighteners
• Photovoltaic
• Agro chemicals
Key products
• Butadiene
• Butene-1
• Plasticisers
• Plasticiser alcohols
• Hydrogen peroxide • Alcoxides (e.g. sodium
methylate)
• Triacetonamine
• Crosslinkers
• Precursors of glyphosates
Sales split 2013 ~70% ~10% ~10% ~10%
Market position1 # 1 in 1-butene # 2 in hydrogen peroxide # 1 in alcoholates # 1 in cyanuric chloride
Main competitors
• BASF
• Exxon Mobil
• LyondellBasell
• TPC
• Arkema
• FMC
• Solvay
• BASF
• DuPont
• Lanxess
• Nalco
• Syngenta
1 Company estimates for relevant markets based on multiple research reports 2 Defined as Top 1-3 positions; as per Company estimates, based on multiple research reports
Page 68 September 2014 | Evonik Roadshow Presentation | Appendix

Butadiene
220 kt
C4 Streams
1,500 kt
Others
800 kt
Butene-1
235 kt
#1 INA/2PH
400 kt
#2
Gases
MTBE
510 kt
DINP
220 kt
#2 Antwerp
Marl
Rubber
Plasticizer
Plasticizer
alcohol
Polyethylene
co-monomer
Fuel additive
Fully integrated production set-up
making complete use of all C4 fractions
Advanced Intermediates: C4 chain (Perf. Interm.)
Fully integrated production platform in Europe
• Leading, cost efficient technology platform with more than 30 years of experience
• High expertise in logistics of C4 products and streams
• New technologies to capture additional C4 feedstocks
• Scale, secure feedstock base and long-standing customer relationships
Key success
factors
Page 69 September 2014 | Evonik Roadshow Presentation | Appendix

Appendix
A Financials Q2 2014 & financial policy
B Specialty Chemicals segments
C Upcoming IR events and contact
Page 70 September 2014 | Evonik Roadshow Presentation | Appendix

Upcoming IR events
Page 71
• 30 October, 2014: Q3 reporting
• 3 March, 2015: Q4 / FY reporting
Conference participations
Next reporting dates
• 8 September, 2014: Commerzbank Sector
Conference Week, Frankfurt / Main
• 25 September, 2014: Baader Investment
Conference, Munich
• 11-12 November, 2014: Morgan Stanley
Global Chemicals & Agriculture Conference,
Boston
Please find an updated schedule
on our IR website
(“Events & Presentations“)
• 7 November, 2014: Roadshow London
• 11 November, 2014: Roadshow Frankfurt / Main
Roadshows
September 2014 | Evonik Roadshow Presentation | Appendix
• 2 October, 2014: Evonik Capital Markets Day,
Hanau (near Frankfurt / Main)
Capital Markets Day
Evonik Investor Relations Team
Tim Lange
Head of Investor Relations
+49 201 177 3150
Petra Boden
Team Assistant
+49 201 177 3146
Hannelore Gantzer
Investor Relations Manager
+49 201 177 3678
Christoph Rump
Investor Relations Manager
+49 201 177 3149
Xin Ming Yu
Junior IR Manager
+49 201 177 3147
Kai Kirchhoff
Investor Relations Manager
+49 201 177 3145
Page 72 September 2014 | Evonik Roadshow Presentation | Appendix

Disclaimer
In so far as forecasts or expectations are expressed in this presentation or where our statements concern the future,
these forecasts, expectations or statements may involve known or unknown risks and uncertainties. Actual results or
developments may vary, depending on changes in the operating environment. Neither Evonik Industries AG nor its
group companies assume an obligation to update the forecasts, expectations or statements contained in this release.