Embed Size (px)
Citation preview
Evolving Therapy In
CLL
Susan M. O’Brien, MD
UC Irvine Health

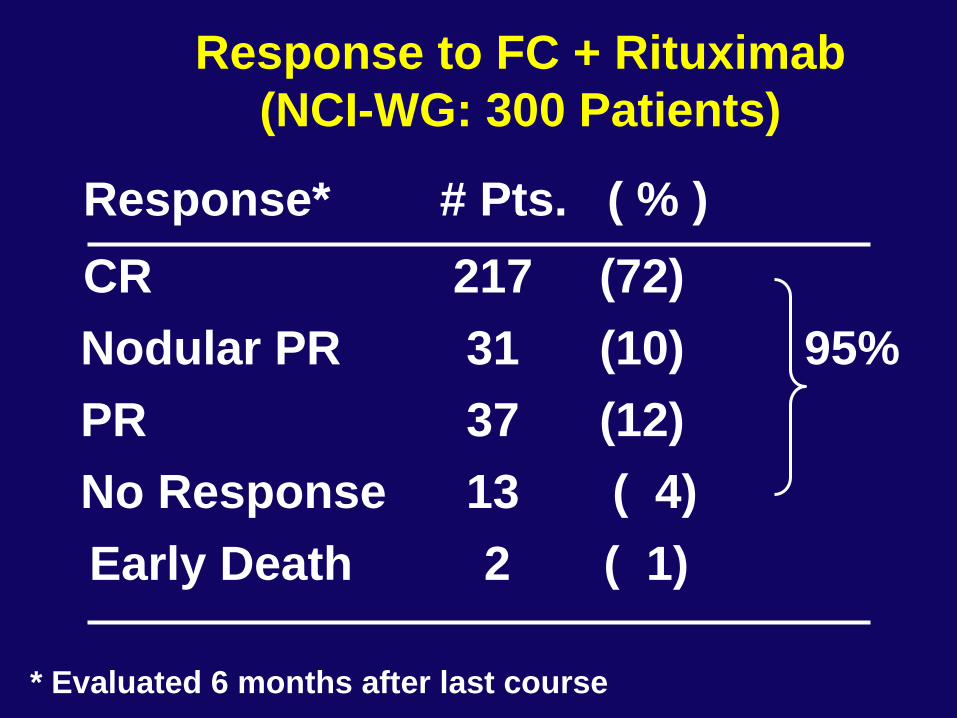
Response to FC + Rituximab
(NCI-WG: 300 Patients)
Response* # Pts. ( % )
CR 217 (72)
Nodular PR 31 (10) 95%
PR 37 (12)
No Response 13 ( 4)
Early Death 2 ( 1)
* Evaluated 6 months after last course
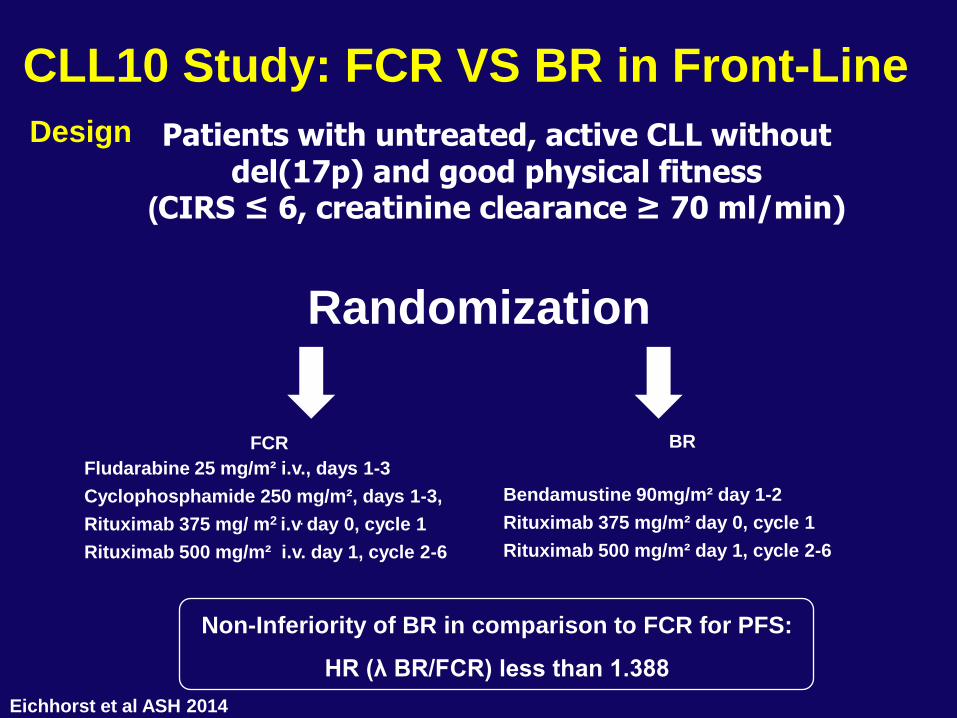
CLL10 Study: FCR VS BR in Front-Line
Design
Non-Inferiority of BR in comparison to FCR for PFS:
HR (λ BR/FCR) less than 1.388
Randomization
Patients with untreated, active CLL without del(17p) and good physical fitness
(CIRS ≤ 6, creatinine clearance ≥ 70 ml/min)
FCR
Fludarabine 25 mg/m² i.v., days 1-3
Cyclophosphamide 250 mg/m², days 1-3,
Rituximab 375 mg/ m2 i.v. day 0, cycle 1
Rituximab 500 mg/m² i.v. day 1, cycle 2-6
BR
Bendamustine 90mg/m² day 1-2
Rituximab 375 mg/m² day 0, cycle 1
Rituximab 500 mg/m² day 1, cycle 2-6
Eichhorst et al ASH 2014
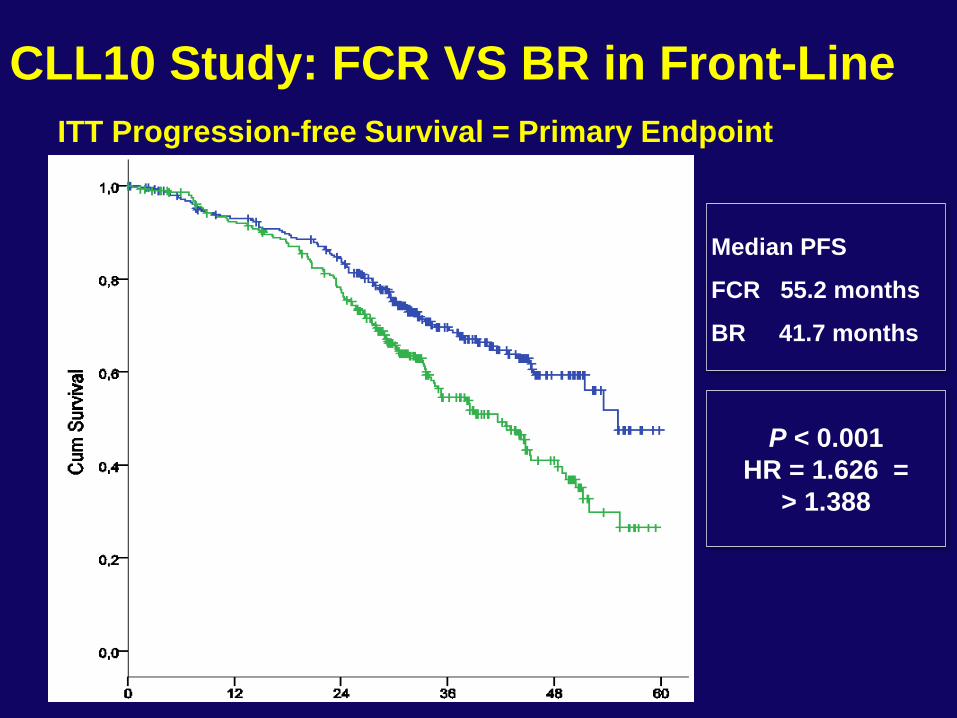
CLL10 Study: FCR VS BR in Front-Line
ITT Progression-free Survival = Primary Endpoint
P < 0.001
HR = 1.626 =
> 1.388
Median PFS
FCR 55.2 months
BR 41.7 months
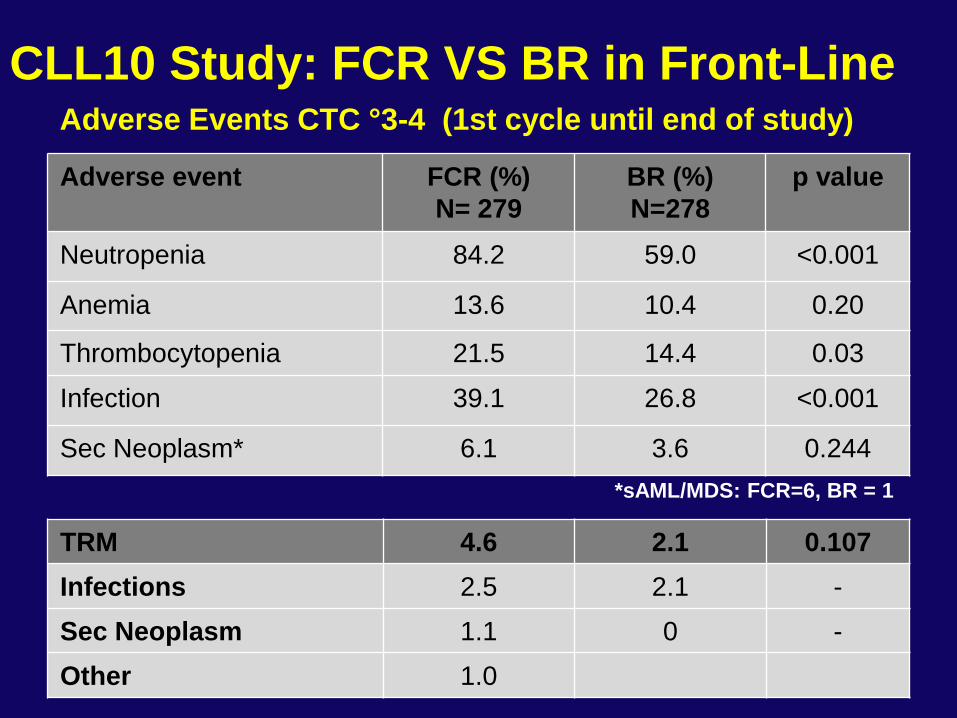
Adverse Events CTC °3-4 (1st cycle until end of study)
Adverse event FCR (%)
N= 279
BR (%)
N=278
p value
Neutropenia 84.2 59.0 <0.001
Anemia 13.6 10.4 0.20
Thrombocytopenia 21.5 14.4 0.03
Infection 39.1 26.8 <0.001
Sec Neoplasm* 6.1 3.6 0.244
*sAML/MDS: FCR=6, BR = 1
TRM 4.6 2.1 0.107
Infections 2.5 2.1 -
Sec Neoplasm 1.1 0 -
Other 1.0
CLL10 Study: FCR VS BR in Front-Line
7
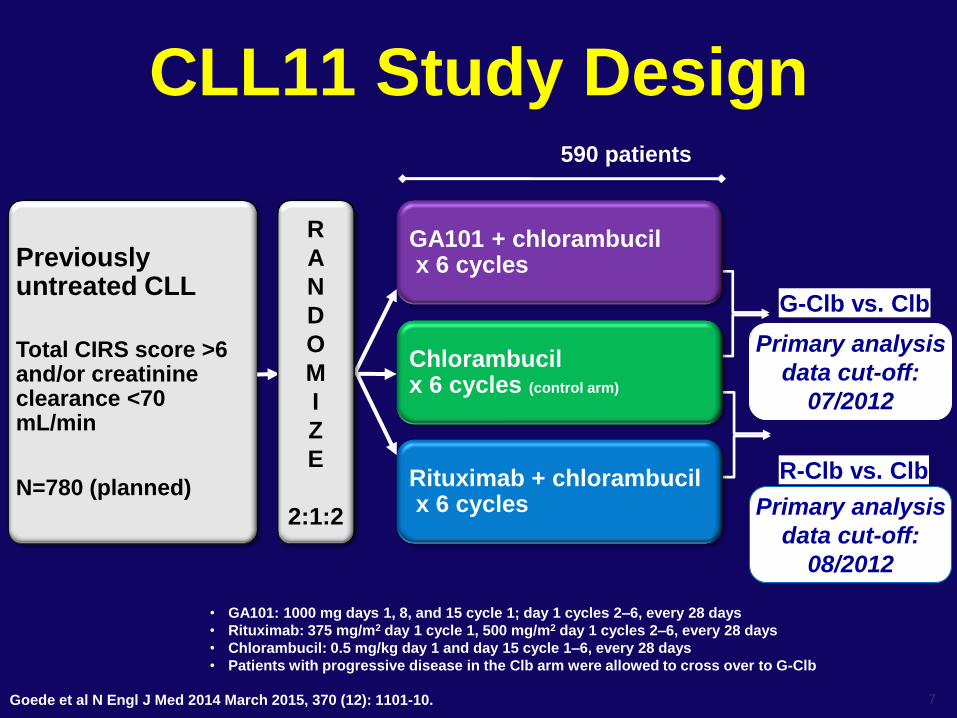
CLL11 Study Design
Previously untreated CLL
Total CIRS score >6 and/or creatinine clearance <70 mL/min
N=780 (planned)
R
A
N
D
O
M
I
Z
E
2:1:2
590 patients
G-Clb vs. Clb
Primary analysis
data cut-off:
07/2012
GA101 + chlorambucil x 6 cycles
R-Clb vs. Clb
Primary analysis
data cut-off:
08/2012
Rituximab + chlorambucil x 6 cycles
Chlorambucil x 6 cycles (control arm)
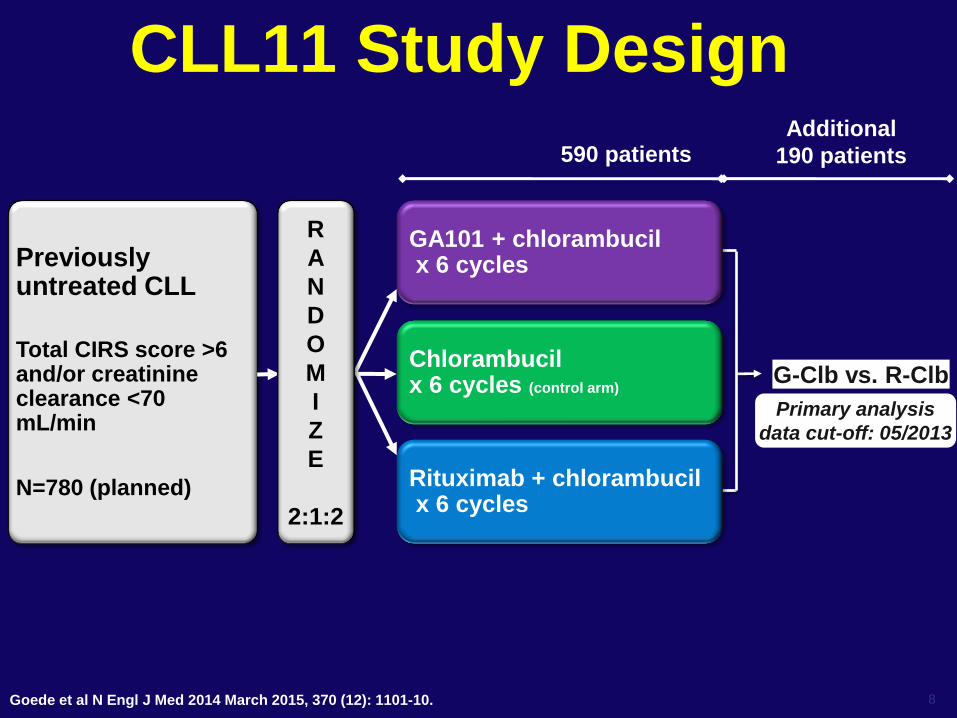
• GA101: 1000 mg days 1, 8, and 15 cycle 1; day 1 cycles 2–6, every 28 days
• Rituximab: 375 mg/m2 day 1 cycle 1, 500 mg/m2 day 1 cycles 2–6, every 28 days
• Chlorambucil: 0.5 mg/kg day 1 and day 15 cycle 1–6, every 28 days
• Patients with progressive disease in the Clb arm were allowed to cross over to G-Clb
Goede et al N Engl J Med 2014 March 2015, 370 (12): 1101-10.
8
CLL11 Study Design
Previously untreated CLL
Total CIRS score >6 and/or creatinine clearance <70 mL/min
N=780 (planned)
R
A
N
D
O
M
I
Z
E
2:1:2
590 patients
Chlorambucil x 6 cycles (control arm)
G-Clb vs. R-Clb
Primary analysis
data cut-off: 05/2013
Additional
190 patients
GA101 + chlorambucil x 6 cycles
Rituximab + chlorambucil x 6 cycles
Goede et al N Engl J Med 2014 March 2015, 370 (12): 1101-10.
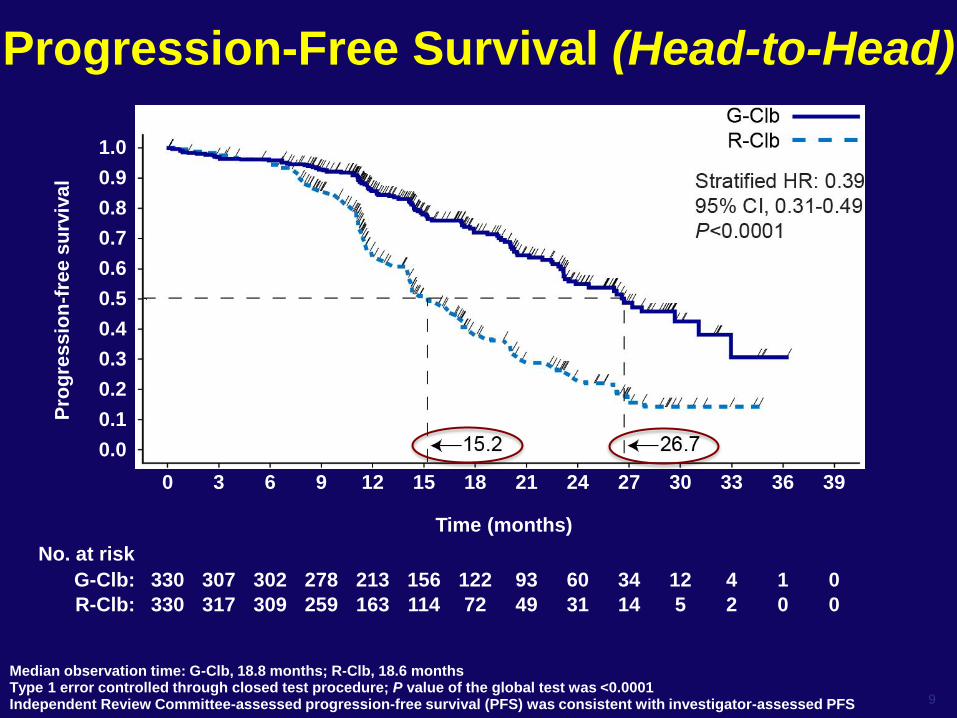
Progression-Free Survival (Head-to-Head)
Median observation time: G-Clb, 18.8 months; R-Clb, 18.6 months Type 1 error controlled through closed test procedure; P value of the global test was <0.0001 Independent Review Committee-assessed progression-free survival (PFS) was consistent with investigator-assessed PFS 9
0 3 6 9 12 15 18 21 24 27 30 33 36 39
330 317 309 259 163 114 72 49 31 14 5 2 0 0
330 307 302 278 213 156 122 93 60 34 12 4 1 0
1.0
0.9
0.8
0.7
0.6
0.5
0.4
0.3
0.2
0.1
0.0
Pro
gre
ss
ion
-fre
e s
urv
iva
l
Time (months)
G-Clb:
R-Clb:
No. at risk
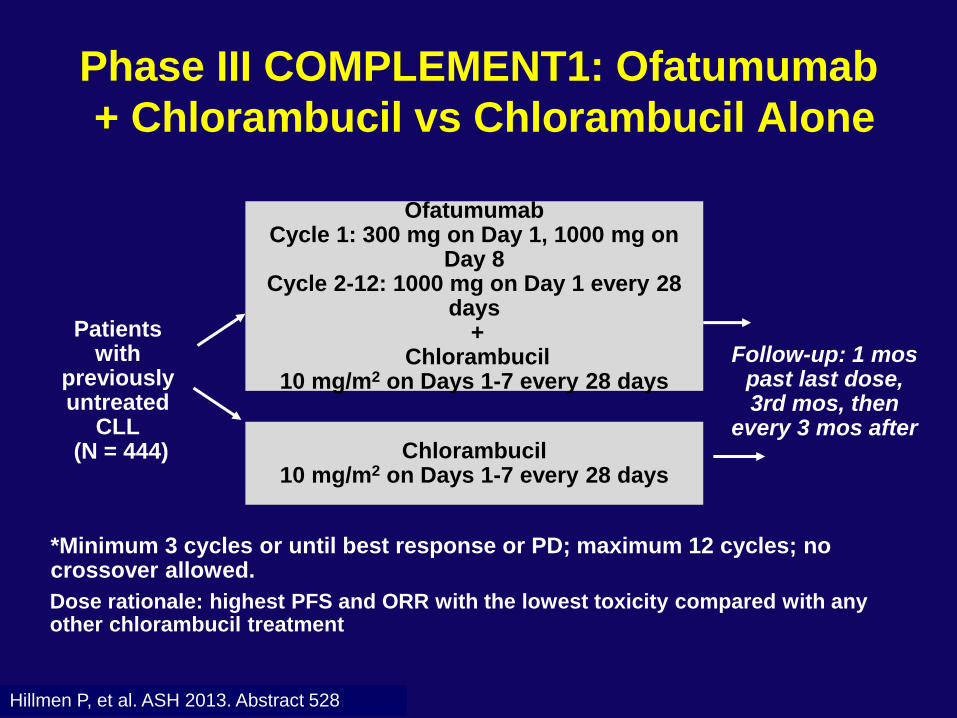
Dose rationale: highest PFS and ORR with the lowest toxicity compared with any other chlorambucil treatment
Patients with
previously untreated
CLL (N = 444)
Ofatumumab Cycle 1: 300 mg on Day 1, 1000 mg on
Day 8 Cycle 2-12: 1000 mg on Day 1 every 28
days +
Chlorambucil 10 mg/m2 on Days 1-7 every 28 days
Chlorambucil 10 mg/m2 on Days 1-7 every 28 days
Follow-up: 1 mos past last dose, 3rd mos, then
every 3 mos after
*Minimum 3 cycles or until best response or PD; maximum 12 cycles; no crossover allowed.
Hillmen P, et al. ASH 2013. Abstract 528.
Phase III COMPLEMENT1: Ofatumumab
+ Chlorambucil vs Chlorambucil Alone
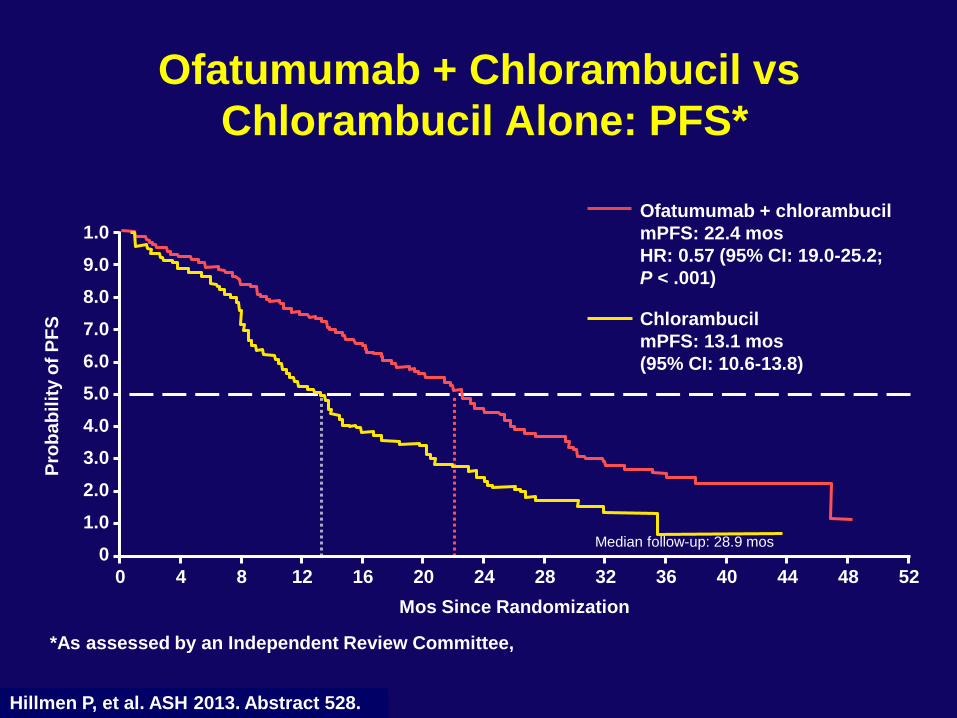
Ofatumumab + Chlorambucil vs
Chlorambucil Alone: PFS*
Hillmen P, et al. ASH 2013. Abstract 528.
Ofatumumab + chlorambucil
mPFS: 22.4 mos
HR: 0.57 (95% CI: 19.0-25.2;
P < .001)
Chlorambucil
mPFS: 13.1 mos
(95% CI: 10.6-13.8)
Median follow-up: 28.9 mos
*As assessed by an Independent Review Committee,
1.0
9.0
8.0
7.0
6.0
5.0
4.0
3.0
2.0
1.0
0
Pro
ba
bil
ity o
f P
FS
Mos Since Randomization
0 52 4 8 12 16 20 24 28 32 36 40 44 48
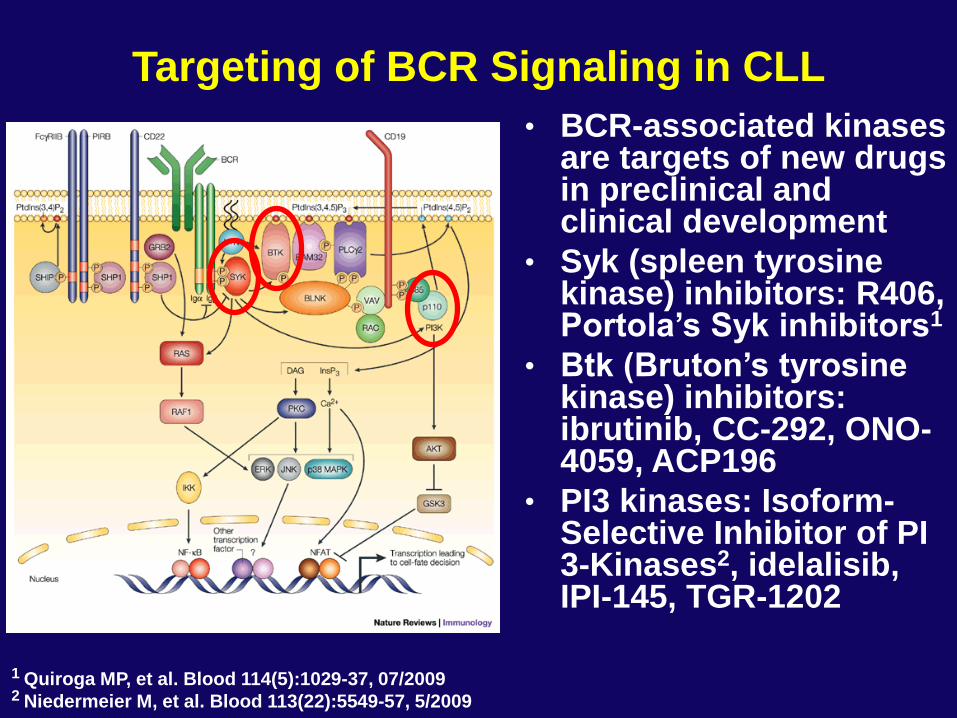
Targeting of BCR Signaling in CLL
• BCR-associated kinases are targets of new drugs in preclinical and clinical development
• Syk (spleen tyrosine kinase) inhibitors: R406, Portola’s Syk inhibitors1
• Btk (Bruton’s tyrosine kinase) inhibitors: ibrutinib, CC-292, ONO-4059, ACP196
• PI3 kinases: Isoform-Selective Inhibitor of PI 3-Kinases2, idelalisib, IPI-145, TGR-1202
1 Quiroga MP, et al. Blood 114(5):1029-37, 07/2009 2 Niedermeier M, et al. Blood 113(22):5549-57, 5/2009
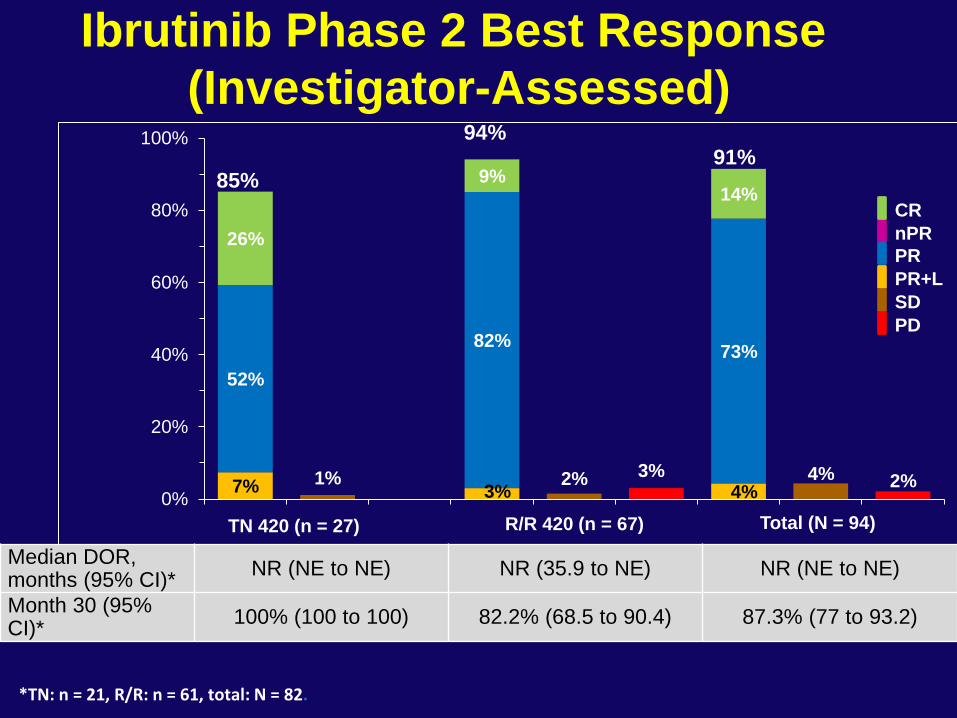
Ibrutinib Phase 2 Best Response
(Investigator-Assessed)
3% 2% 1% 2% 4%
7% 3% 4%
52%
82% 73%
26%
9% 14%
0%
20%
40%
60%
80%
100%
Total (N = 94)
85%
94% 91%
Median DOR, months (95% CI)*
NR (NE to NE) NR (35.9 to NE) NR (NE to NE)
Month 30 (95% CI)*
100% (100 to 100) 82.2% (68.5 to 90.4) 87.3% (77 to 93.2)
nPR
CR
PR
PR+L
SD
PD
*TN: n = 21, R/R: n = 61, total: N = 82.
TN 420 (n = 27) R/R 420 (n = 67)
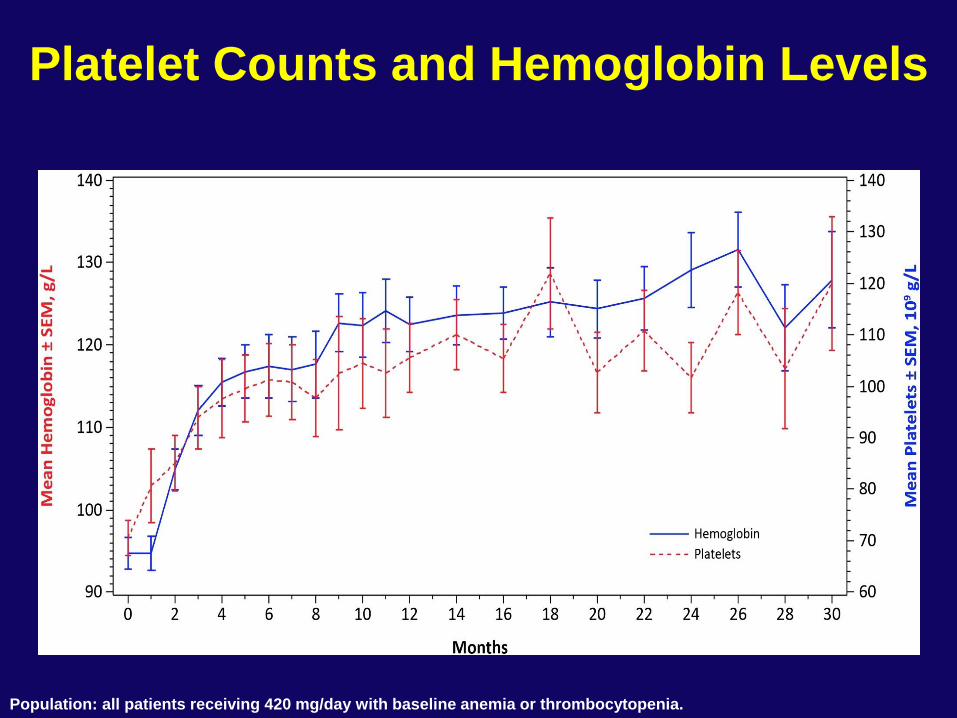
Platelet Counts and Hemoglobin Levels
Population: all patients receiving 420 mg/day with baseline anemia or thrombocytopenia.
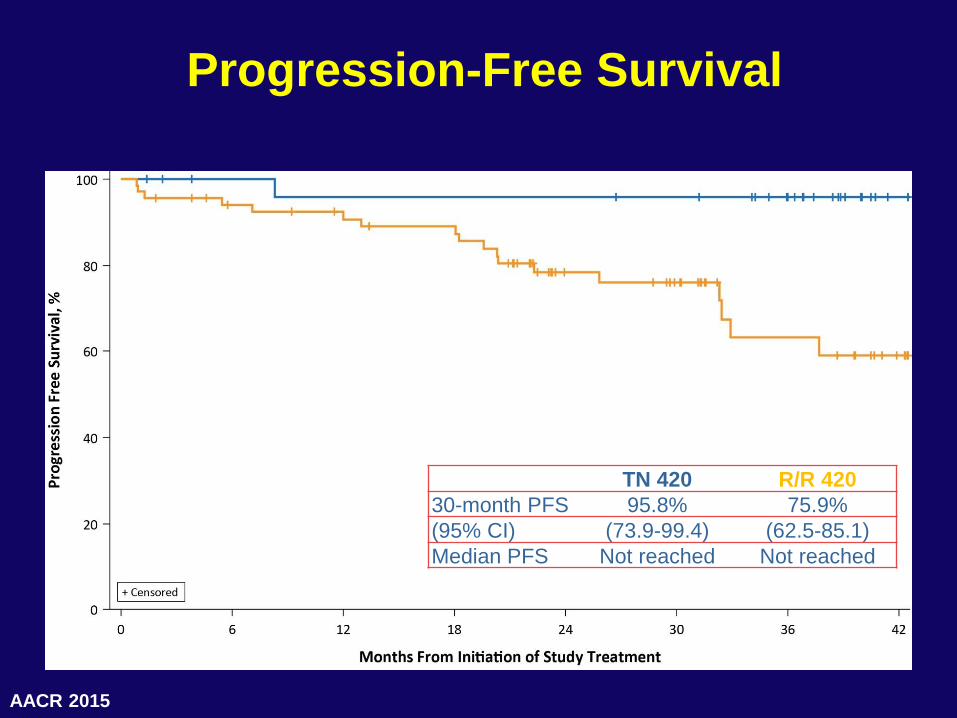
Progression-Free Survival
TN 420 R/R 420
30-month PFS 95.8% 75.9%
(95% CI) (73.9-99.4) (62.5-85.1)
Median PFS Not reached Not reached
AACR 2015
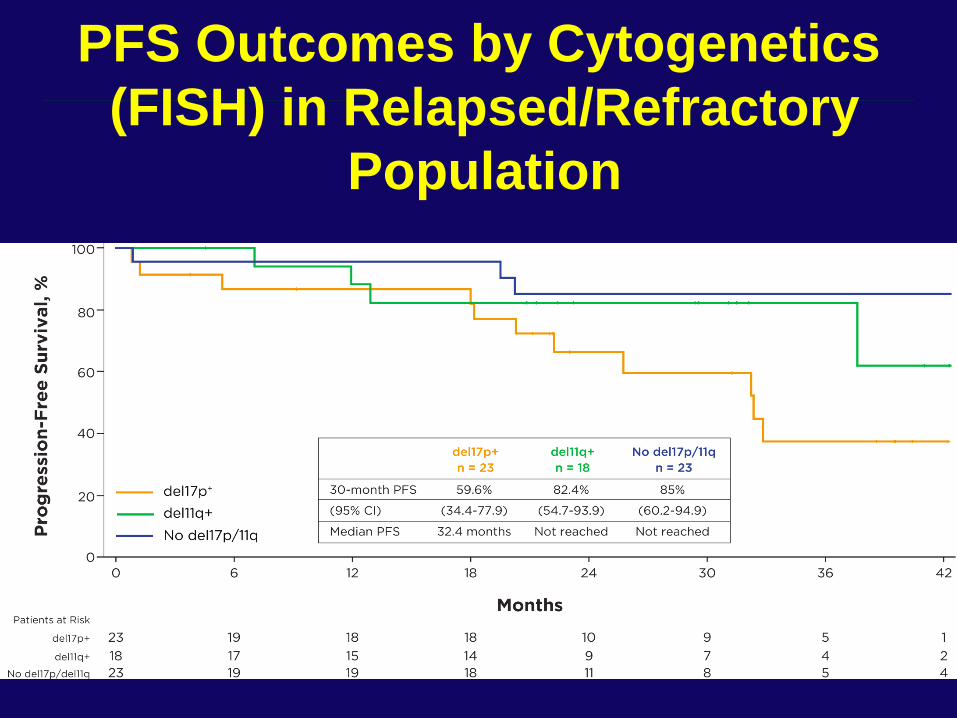
PFS Outcomes by Cytogenetics
(FISH) in Relapsed/Refractory
Population
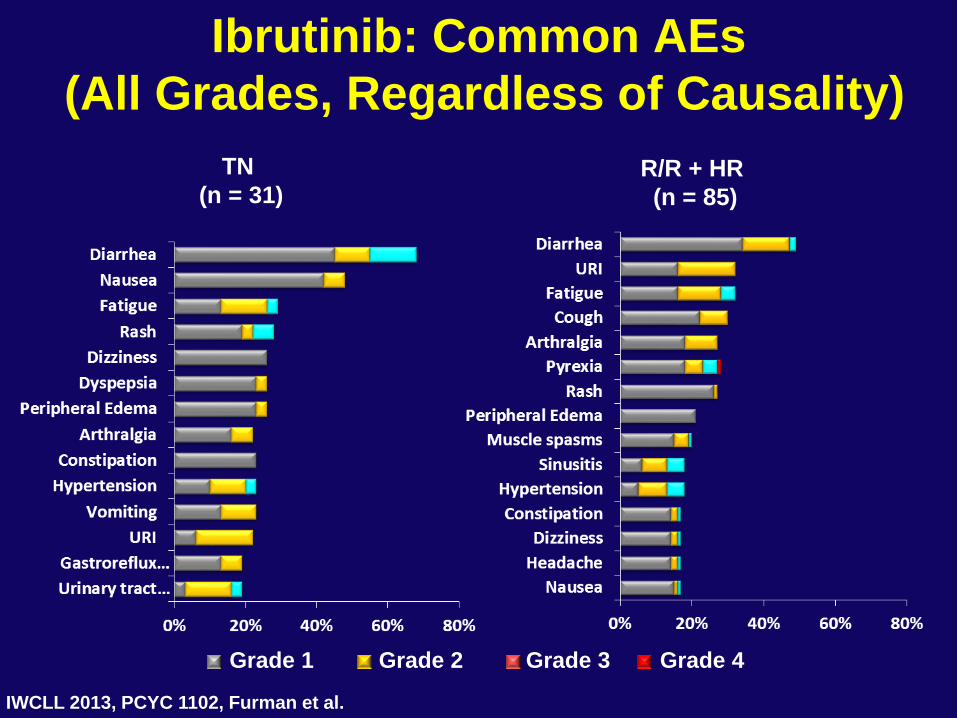
Ibrutinib: Common AEs
(All Grades, Regardless of Causality)
IWCLL 2013, PCYC 1102, Furman et al.
TN
(n = 31) R/R + HR
(n = 85)
Grade 3 Grade 1 Grade 2 Grade 4
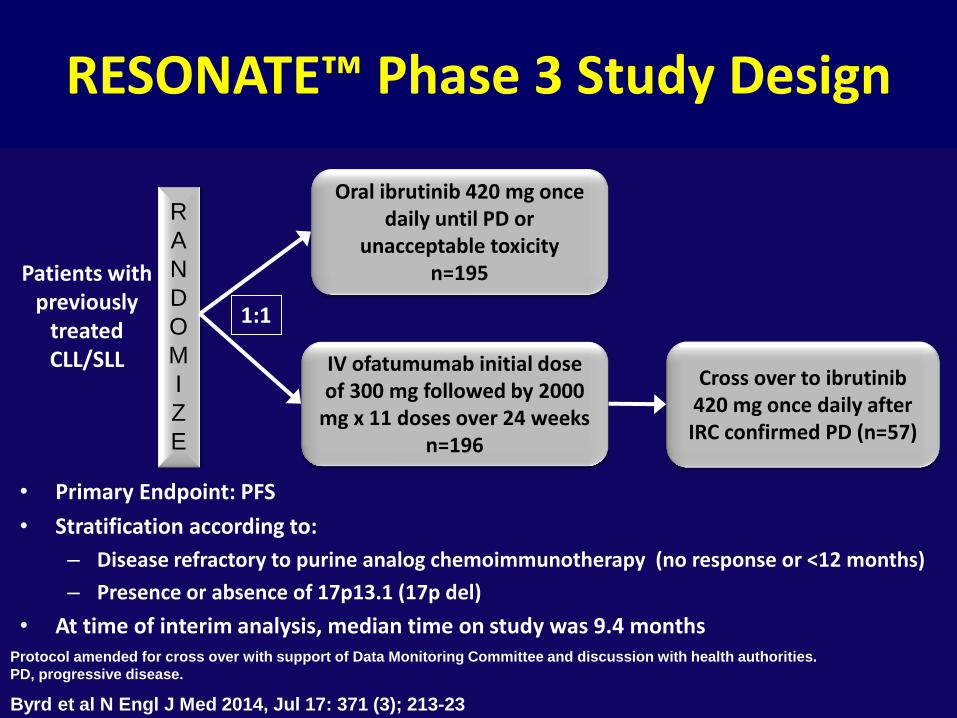
• Primary Endpoint: PFS
• Stratification according to:
– Disease refractory to purine analog chemoimmunotherapy (no response or <12 months)
– Presence or absence of 17p13.1 (17p del)
• At time of interim analysis, median time on study was 9.4 months
RESONATE™ Phase 3 Study Design
R
A
N
D
O
M
I
Z
E
Oral ibrutinib 420 mg once daily until PD or
unacceptable toxicity n=195
IV ofatumumab initial dose of 300 mg followed by 2000
mg x 11 doses over 24 weeks n=196
1:1
Patients with previously
treated CLL/SLL
Protocol amended for cross over with support of Data Monitoring Committee and discussion with health authorities.
PD, progressive disease.
Cross over to ibrutinib 420 mg once daily after IRC confirmed PD (n=57)
Byrd et al N Engl J Med 2014, Jul 17: 371 (3); 213-23
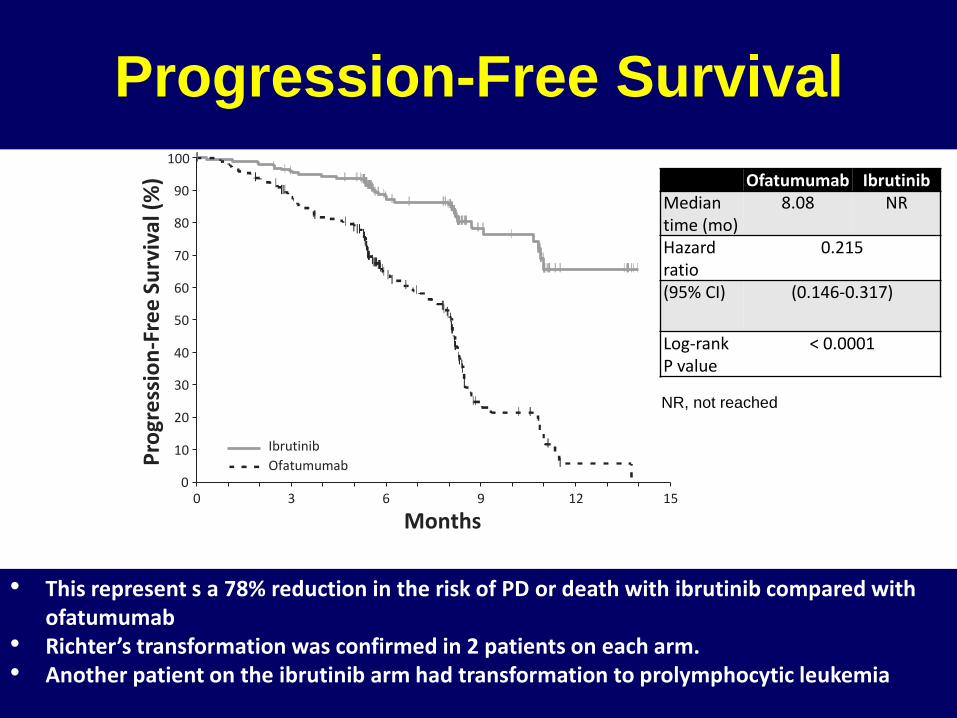
Progression-Free Survival
0 3 6 9 12
195 183 116 38 7 196 161 83 15 1 0
15 0
10
20
30
40
50
60
70
80
90
100 P
rogr
ess
ion
-Fre
e Su
rviv
al (
%)
No. at risk
Ibrutinib: Ofatumumab:
Months
Ibrutinib
Ofatumumab
Ofatumumab Ibrutinib Median time (mo)
8.08 NR
Hazard ratio
0.215
(95% CI) (0.146-0.317)
Log-rank P value
< 0.0001
• This represent s a 78% reduction in the risk of PD or death with ibrutinib compared with ofatumumab
• Richter’s transformation was confirmed in 2 patients on each arm. • Another patient on the ibrutinib arm had transformation to prolymphocytic leukemia
NR, not reached
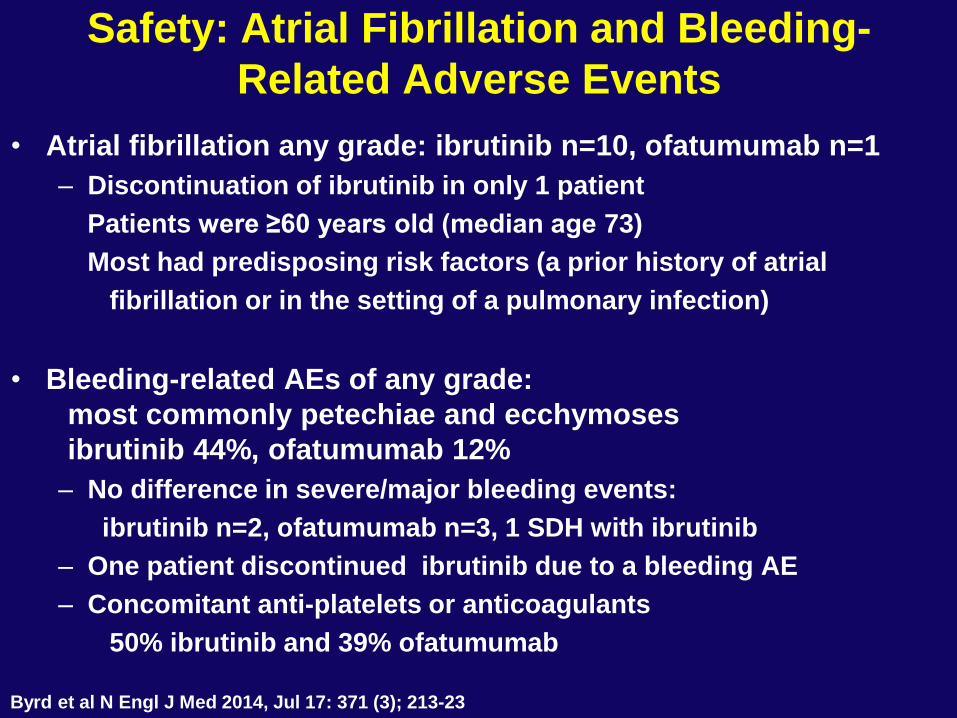
• Atrial fibrillation any grade: ibrutinib n=10, ofatumumab n=1
– Discontinuation of ibrutinib in only 1 patient
Patients were ≥60 years old (median age 73)
Most had predisposing risk factors (a prior history of atrial
fibrillation or in the setting of a pulmonary infection)
• Bleeding-related AEs of any grade:
most commonly petechiae and ecchymoses
ibrutinib 44%, ofatumumab 12%
– No difference in severe/major bleeding events:
ibrutinib n=2, ofatumumab n=3, 1 SDH with ibrutinib
– One patient discontinued ibrutinib due to a bleeding AE
– Concomitant anti-platelets or anticoagulants
50% ibrutinib and 39% ofatumumab
Safety: Atrial Fibrillation and Bleeding-
Related Adverse Events
Byrd et al N Engl J Med 2014, Jul 17: 371 (3); 213-23
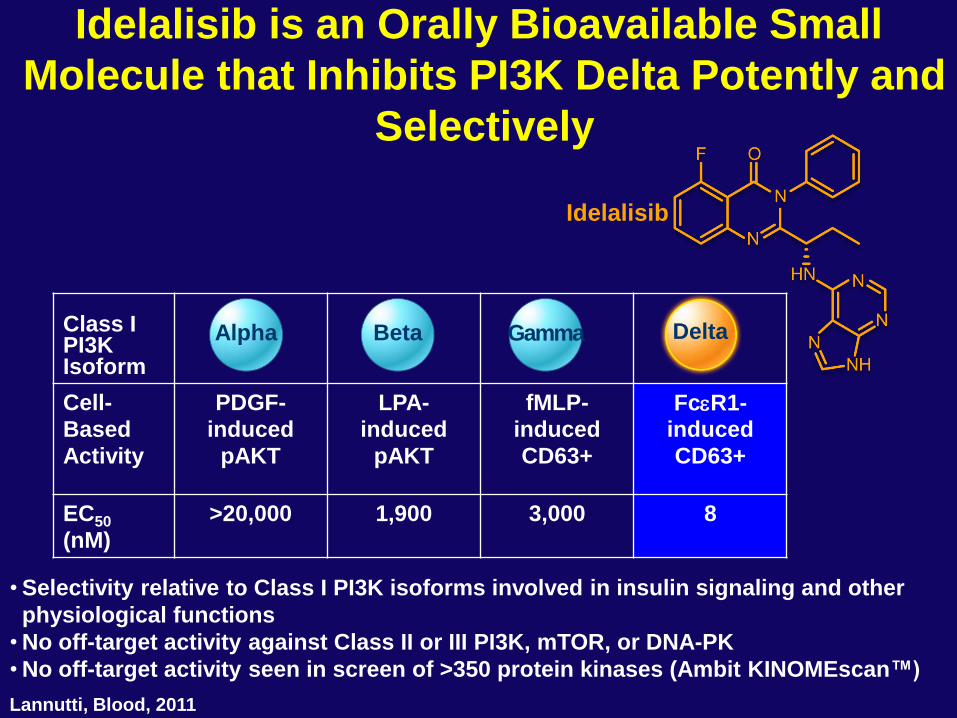
Idelalisib is an Orally Bioavailable Small
Molecule that Inhibits PI3K Delta Potently and
Selectively
Class I PI3K Isoform
Cell-
Based
Activity
PDGF-
induced
pAKT
LPA-
induced
pAKT
fMLP-
induced
CD63+
FcR1-induced
CD63+
EC50
(nM)
>20,000 1,900 3,000 8
Alpha Beta Gamma Delta
•Selectivity relative to Class I PI3K isoforms involved in insulin signaling and other
physiological functions
•No off-target activity against Class II or III PI3K, mTOR, or DNA-PK
•No off-target activity seen in screen of >350 protein kinases (Ambit KINOMEscan™)
Lannutti, Blood, 2011
Idelalisib
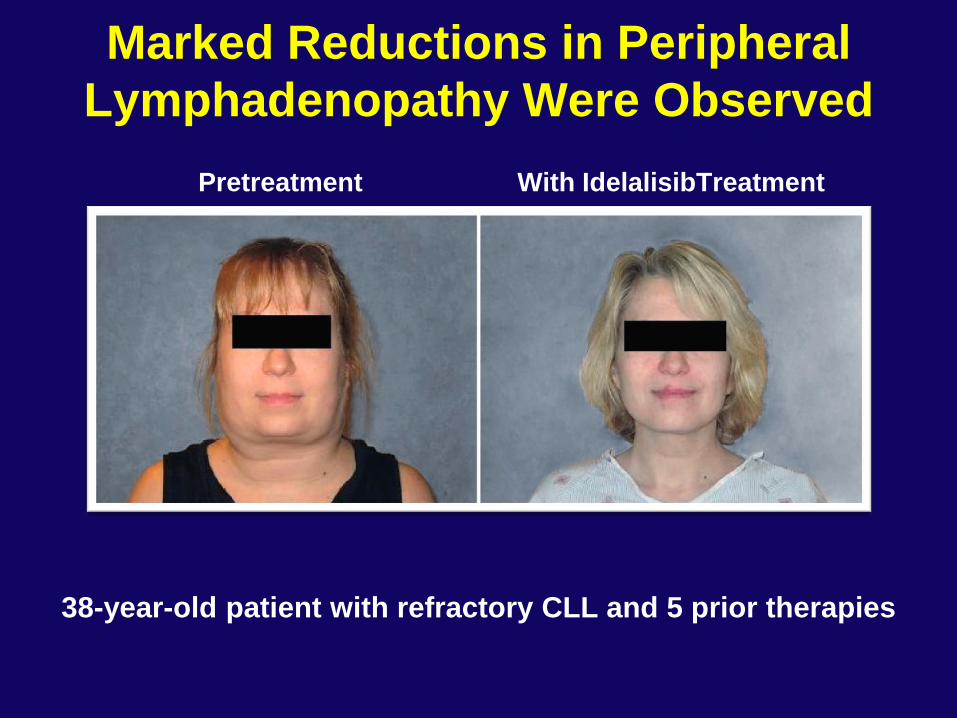
Marked Reductions in Peripheral
Lymphadenopathy Were Observed
Pretreatment With IdelalisibTreatment
38-year-old patient with refractory CLL and 5 prior therapies
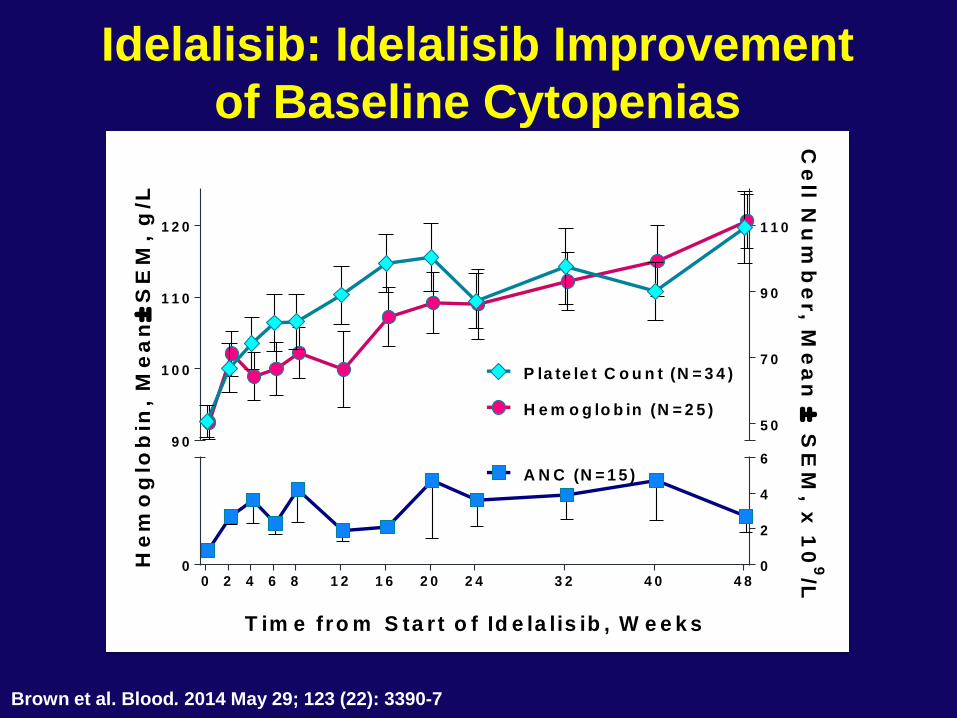
Idelalisib: Idelalisib Improvement
of Baseline Cytopenias
0 2 4 6 8 1 2 1 6 2 0 2 4 3 2 4 0 4 80 0
2
4
6
5 0
7 0
9 0
1 1 0
9 0
1 0 0
1 1 0
1 2 0
H e m o g lo b in (N = 2 5 )
P la te le t C o u n t (N = 3 4 )
T im e fro m S ta r t o f Id e la lis ib , W e e k s
He
mo
glo
bin
, M
ea
n
SE
M,
g/L
Ce
ll Nu
mb
er, M
ea
n
SE
M, x
10
9/L
A N C (N = 1 5 )
Brown et al. Blood. 2014 May 29; 123 (22): 3390-7
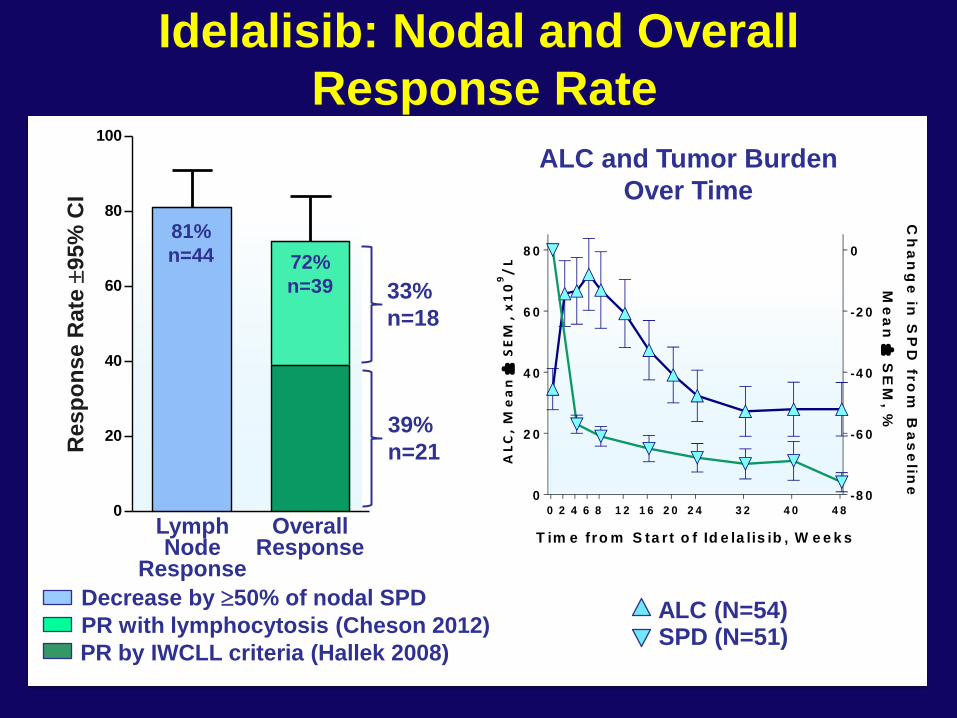
Idelalisib: Nodal and Overall
Response Rate
0 2 4 6 8 1 2 1 6 2 0 2 4 3 2 4 0 4 8
0
2 0
4 0
6 0
8 0
-8 0
-6 0
-4 0
-2 0
0
T im e fro m S ta r t o f Id e la lis ib , W e e k s
AL
C,
Me
an
SE
M,
x1
09
/L
Ch
an
ge
in S
PD
fro
m B
as
elin
e
Me
an
S
EM
, %
0
20
40
60
80
100
Re
sp
on
se
Ra
te
95
% C
I
Overall Response
Lymph Node
Response
39%
n=21
33%
n=18
81%
n=44 72%
n=39
Decrease by 50% of nodal SPD
PR with lymphocytosis (Cheson 2012)
PR by IWCLL criteria (Hallek 2008)
ALC (N=54) SPD (N=51)
ALC and Tumor Burden
Over Time
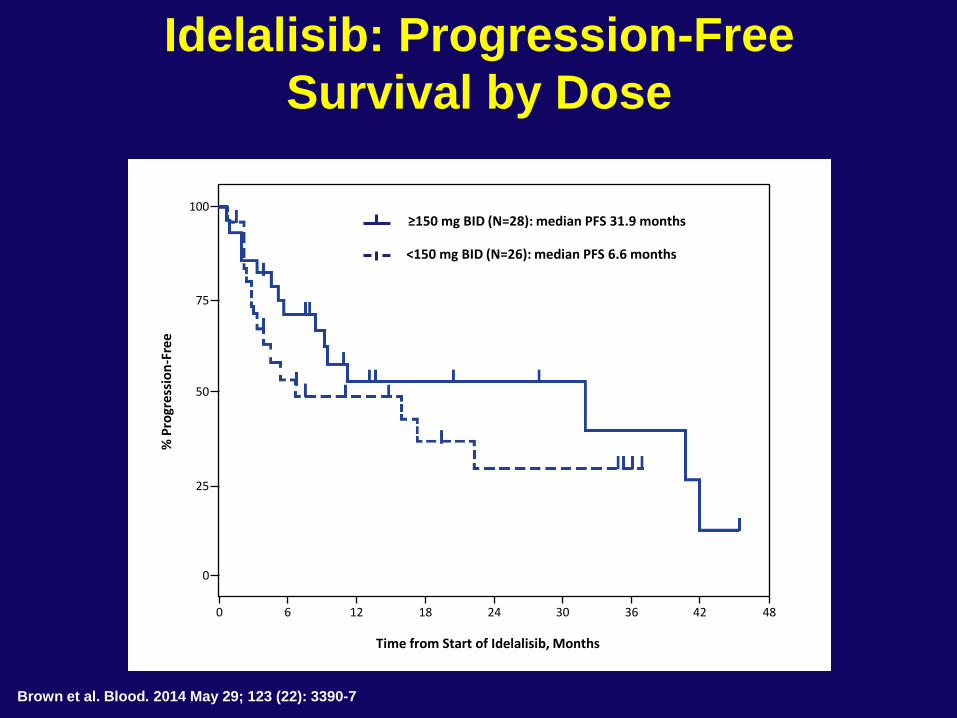
Idelalisib: Progression-Free
Survival by Dose
Brown et al. Blood. 2014 May 29; 123 (22): 3390-7
0
0
Time from Start of Idelalisib, Months
% P
rogr
essi
on
-Fre
e
6 12 18 24 30 36 42 48
25
50
75
100 ≥150 mg BID (N=28): median PFS 31.9 months
<150 mg BID (N=26): median PFS 6.6 months
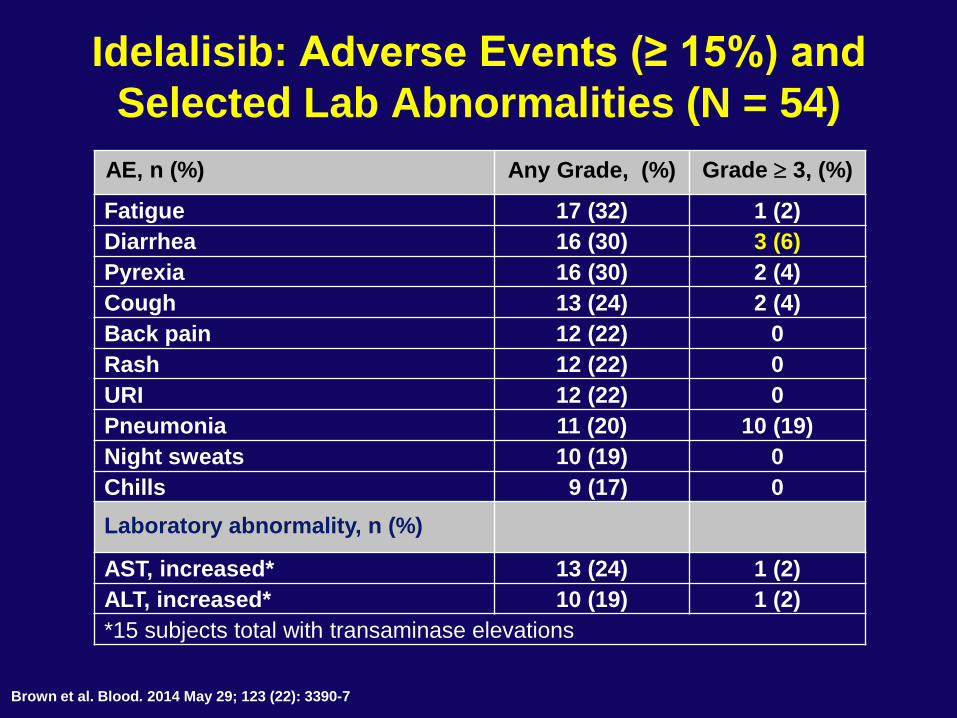
Idelalisib: Adverse Events (≥ 15%) and
Selected Lab Abnormalities (N = 54)
AE, n (%) Any Grade, (%) Grade 3, (%)
Fatigue 17 (32) 1 (2)
Diarrhea 16 (30) 3 (6)
Pyrexia 16 (30) 2 (4)
Cough 13 (24) 2 (4)
Back pain 12 (22) 0
Rash 12 (22) 0
URI 12 (22) 0
Pneumonia 11 (20) 10 (19)
Night sweats 10 (19) 0
Chills 9 (17) 0
Laboratory abnormality, n (%)
AST, increased* 13 (24) 1 (2)
ALT, increased* 10 (19) 1 (2)
*15 subjects total with transaminase elevations
Brown et al. Blood. 2014 May 29; 123 (22): 3390-7
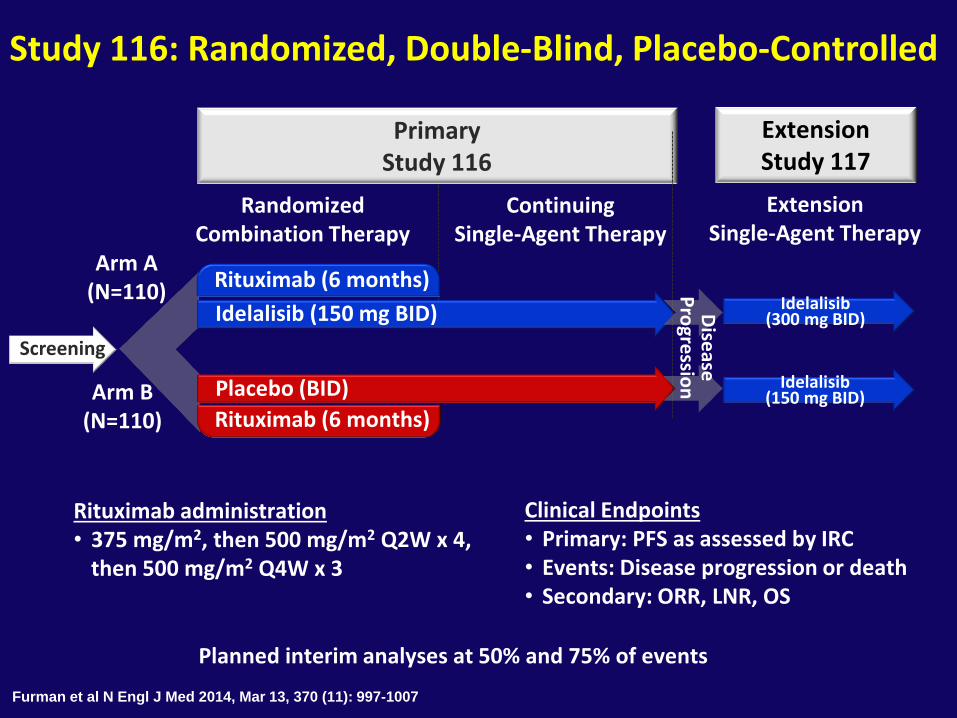
Study 116: Randomized, Double-Blind, Placebo-Controlled
Extension Single-Agent Therapy
Extension Study 117
Randomized Combination Therapy
Continuing Single-Agent Therapy
Primary Study 116
Arm A (N=110)
Arm B (N=110)
Idelalisib (150 mg BID)
Placebo (BID)
Rituximab (6 months)
Rituximab (6 months)
Screening
Idelalisib (150 mg BID)
Idelalisib (300 mg BID)
Rituximab administration • 375 mg/m2, then 500 mg/m2 Q2W x 4,
then 500 mg/m2 Q4W x 3
Clinical Endpoints • Primary: PFS as assessed by IRC • Events: Disease progression or death • Secondary: ORR, LNR, OS
Dise
ase
Pro
gressio
n
Planned interim analyses at 50% and 75% of events
Furman et al N Engl J Med 2014, Mar 13, 370 (11): 997-1007
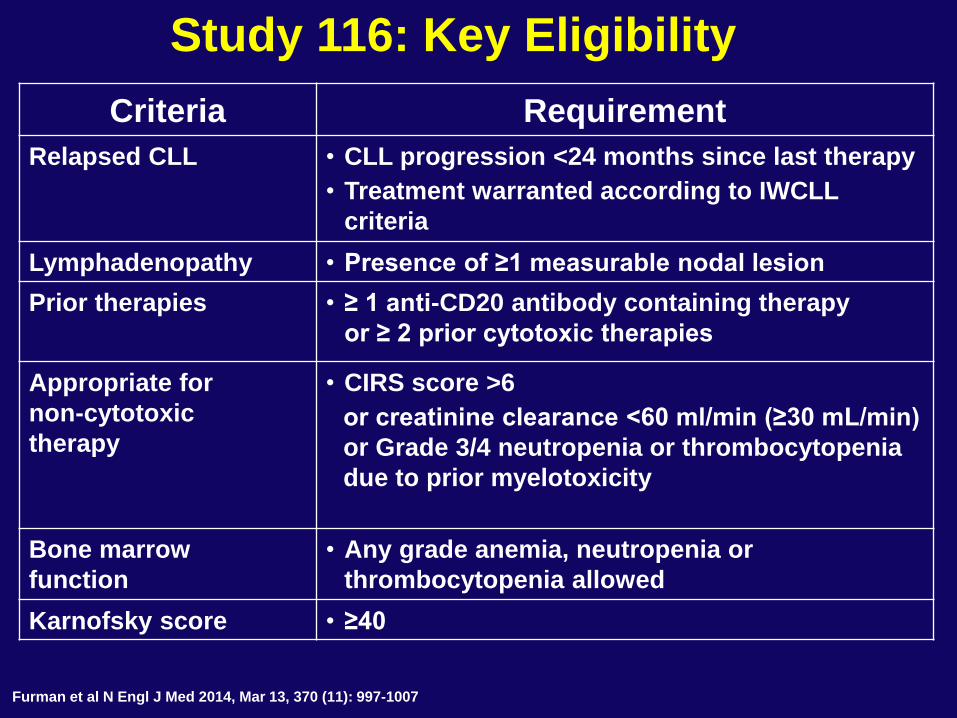
Criteria Requirement
Relapsed CLL • CLL progression <24 months since last therapy
• Treatment warranted according to IWCLL
criteria
Lymphadenopathy • Presence of ≥1 measurable nodal lesion
Prior therapies • ≥ 1 anti-CD20 antibody containing therapy
or ≥ 2 prior cytotoxic therapies
Appropriate for
non-cytotoxic
therapy
• CIRS score >6
or creatinine clearance <60 ml/min (≥30 mL/min)
or Grade 3/4 neutropenia or thrombocytopenia
due to prior myelotoxicity
Bone marrow
function
• Any grade anemia, neutropenia or
thrombocytopenia allowed
Karnofsky score • ≥40
Study 116: Key Eligibility
Furman et al N Engl J Med 2014, Mar 13, 370 (11): 997-1007
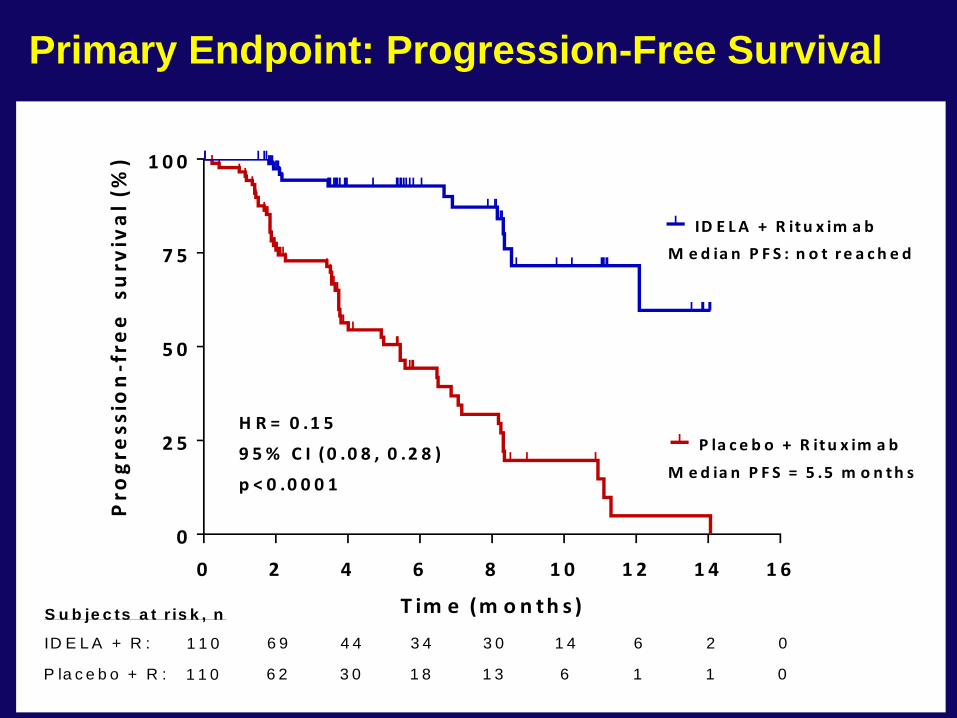
0 2 4 6 8 1 0 1 2 1 4 1 6
0
2 5
5 0
7 5
1 0 0
T im e (m o n th s )
Pro
gre
ss
ion
-fre
e
su
rviv
al
(%)
ID E L A + R it u x im a b
P la c e b o + R it u x im a b
M e d ia n P F S = 5 .5 m o n t h s
M e d ia n P F S : n o t r e a c h e d
H R = 0 .1 5
9 5 % C I (0 .0 8 , 0 .2 8 )
p < 0 .0 0 0 1
6 9 4 4 3 4 3 0 1 4 6 2 0ID E L A + R : 1 1 0
6 2 3 0 1 8 1 3 6 1 1 0P la c e b o + R : 1 1 0
S u b je c ts a t r is k , n
Primary Endpoint: Progression-Free Survival
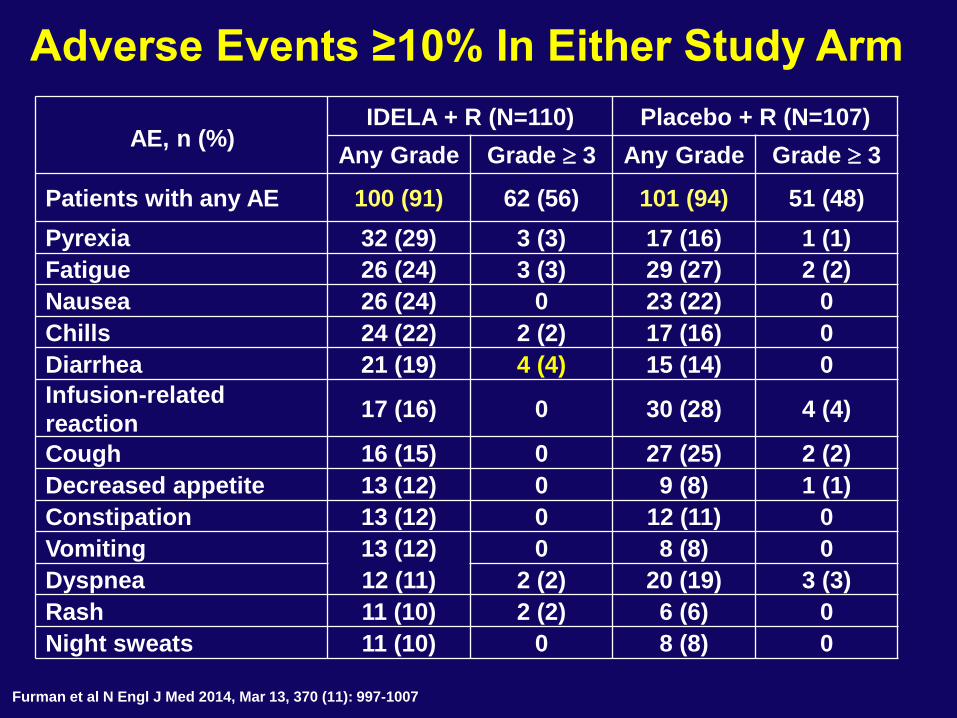
AE, n (%) IDELA + R (N=110) Placebo + R (N=107)
Any Grade Grade 3 Any Grade Grade 3
Patients with any AE 100 (91) 62 (56) 101 (94) 51 (48)
Pyrexia 32 (29) 3 (3) 17 (16) 1 (1)
Fatigue 26 (24) 3 (3) 29 (27) 2 (2)
Nausea 26 (24) 0 23 (22) 0
Chills 24 (22) 2 (2) 17 (16) 0
Diarrhea 21 (19) 4 (4) 15 (14) 0
Infusion-related
reaction 17 (16) 0 30 (28) 4 (4)
Cough 16 (15) 0 27 (25) 2 (2)
Decreased appetite 13 (12) 0 9 (8) 1 (1)
Constipation 13 (12) 0 12 (11) 0
Vomiting 13 (12) 0 8 (8) 0
Dyspnea 12 (11) 2 (2) 20 (19) 3 (3)
Rash 11 (10) 2 (2) 6 (6) 0
Night sweats 11 (10) 0 8 (8) 0
Adverse Events ≥10% In Either Study Arm
Furman et al N Engl J Med 2014, Mar 13, 370 (11): 997-1007
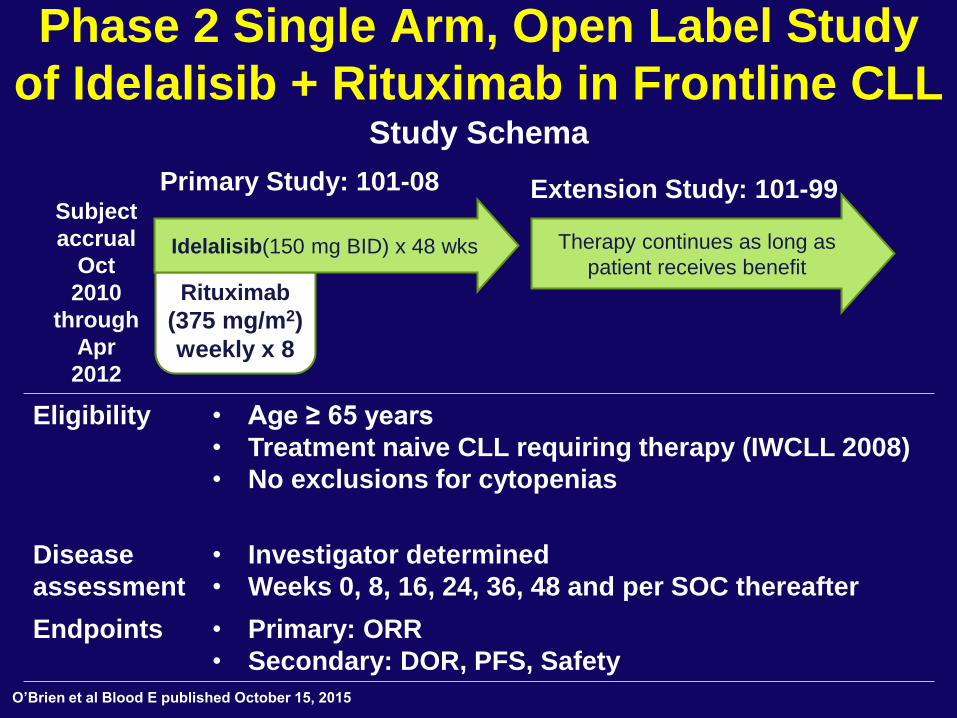
Phase 2 Single Arm, Open Label Study
of Idelalisib + Rituximab in Frontline CLL Study Schema
Primary Study: 101-08 Extension Study: 101-99 Subject
accrual
Oct
2010
through
Apr
2012
Eligibility • Age ≥ 65 years
• Treatment naive CLL requiring therapy (IWCLL 2008)
• No exclusions for cytopenias
Disease
assessment
• Investigator determined
• Weeks 0, 8, 16, 24, 36, 48 and per SOC thereafter
Endpoints • Primary: ORR
• Secondary: DOR, PFS, Safety
Rituximab
(375 mg/m2)
weekly x 8
Therapy continues as long as
patient receives benefit Idelalisib(150 mg BID) x 48 wks
O’Brien et al Blood E published October 15, 2015
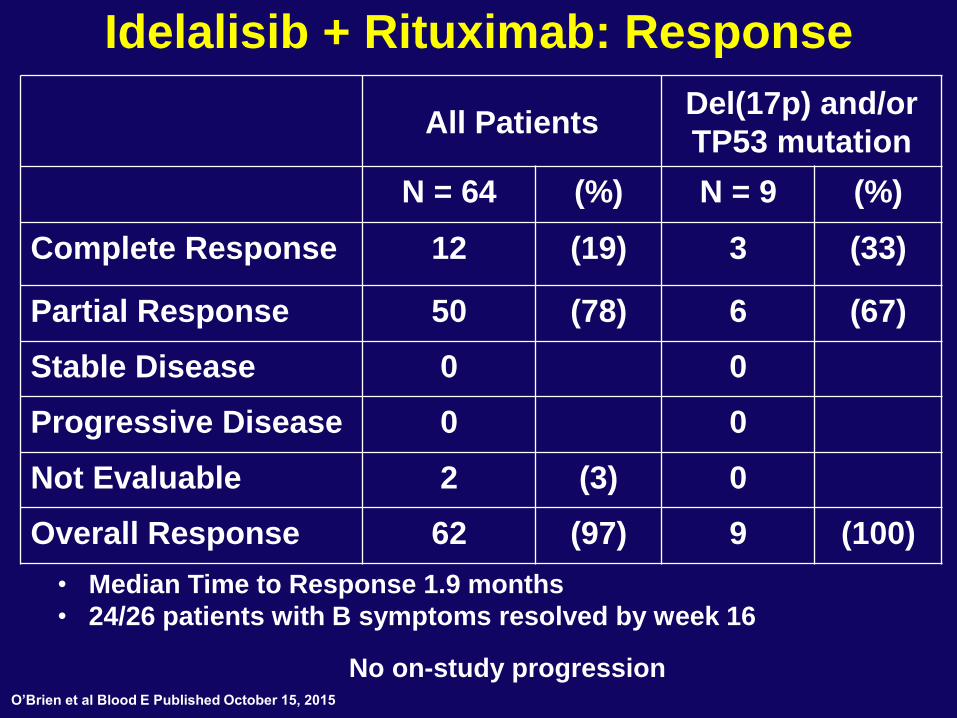
Idelalisib + Rituximab: Response
All Patients Del(17p) and/or
TP53 mutation
N = 64 (%) N = 9 (%)
Complete Response 12 (19) 3 (33)
Partial Response 50 (78) 6 (67)
Stable Disease 0 0
Progressive Disease 0 0
Not Evaluable 2 (3) 0
Overall Response 62 (97) 9 (100)
• Median Time to Response 1.9 months
• 24/26 patients with B symptoms resolved by week 16
No on-study progression O’Brien et al Blood E Published October 15, 2015
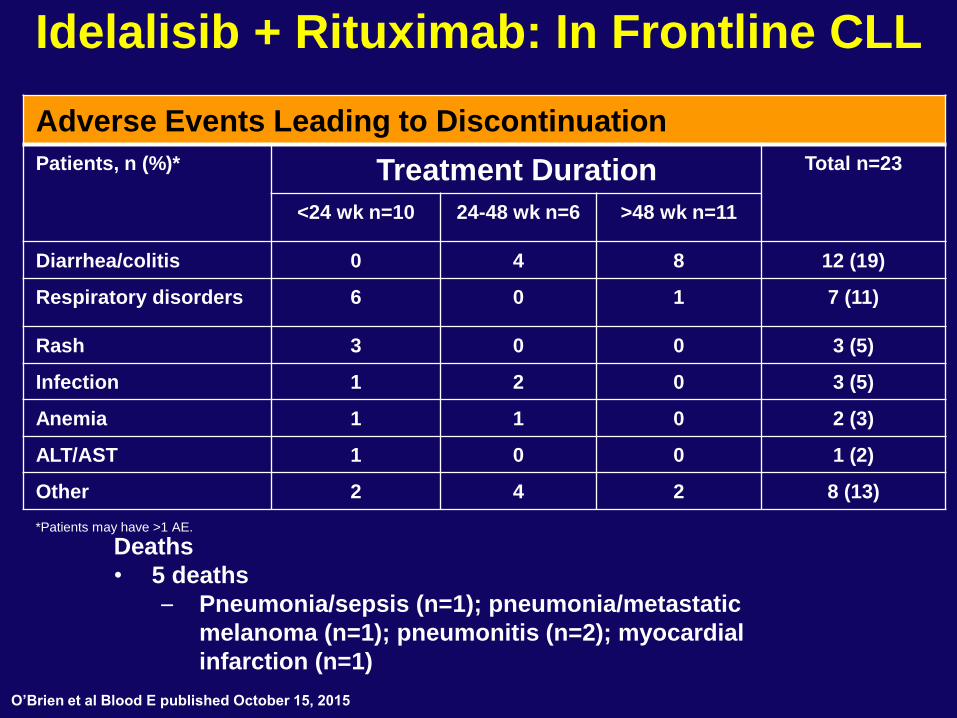
Idelalisib + Rituximab: In Frontline CLL
Adverse Events Leading to Discontinuation
Patients, n (%)* Treatment Duration Total n=23
<24 wk n=10 24-48 wk n=6 >48 wk n=11
Diarrhea/colitis 0 4 8 12 (19)
Respiratory disorders 6 0 1 7 (11)
Rash 3 0 0 3 (5)
Infection 1 2 0 3 (5)
Anemia 1 1 0 2 (3)
ALT/AST 1 0 0 1 (2)
Other 2 4 2 8 (13)
*Patients may have >1 AE.
Deaths
• 5 deaths
– Pneumonia/sepsis (n=1); pneumonia/metastatic
melanoma (n=1); pneumonitis (n=2); myocardial
infarction (n=1)
O’Brien et al Blood E published October 15, 2015
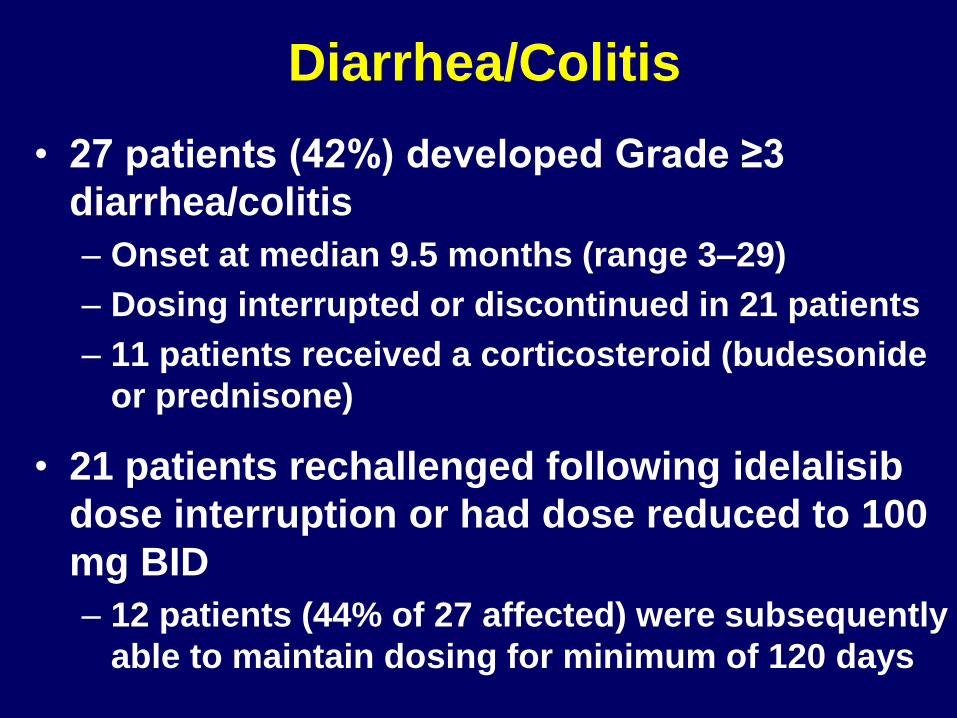
Diarrhea/Colitis
• 27 patients (42%) developed Grade ≥3
diarrhea/colitis
– Onset at median 9.5 months (range 3‒29)
– Dosing interrupted or discontinued in 21 patients
– 11 patients received a corticosteroid (budesonide
or prednisone)
• 21 patients rechallenged following idelalisib
dose interruption or had dose reduced to 100
mg BID
– 12 patients (44% of 27 affected) were subsequently
able to maintain dosing for minimum of 120 days
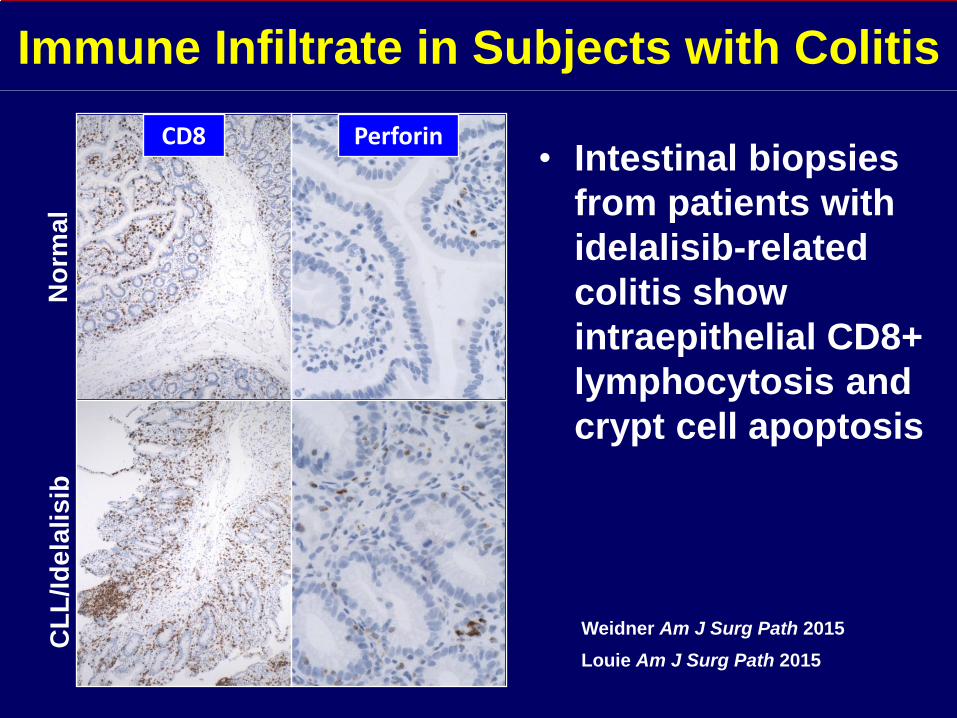
Immune Infiltrate in Subjects with Colitis
Louie Am J Surg Path 2015
Weidner Am J Surg Path 2015
No
rma
l C
LL
/Id
ela
lis
ib
CD8 Perforin • Intestinal biopsies
from patients with
idelalisib-related
colitis show
intraepithelial CD8+
lymphocytosis and
crypt cell apoptosis
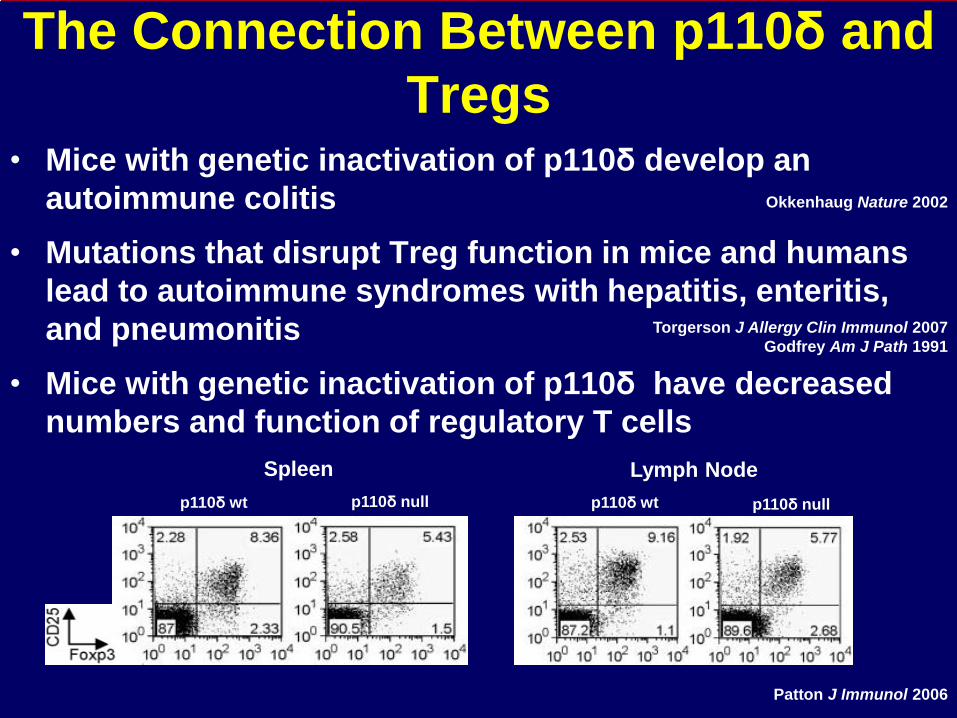
The Connection Between p110δ and
Tregs • Mice with genetic inactivation of p110δ develop an
autoimmune colitis
• Mutations that disrupt Treg function in mice and humans
lead to autoimmune syndromes with hepatitis, enteritis,
and pneumonitis
• Mice with genetic inactivation of p110δ have decreased
numbers and function of regulatory T cells
Okkenhaug Nature 2002
Patton J Immunol 2006
Torgerson J Allergy Clin Immunol 2007
Godfrey Am J Path 1991
Spleen Lymph Node
p110δ wt p110δ null p110δ wt p110δ null
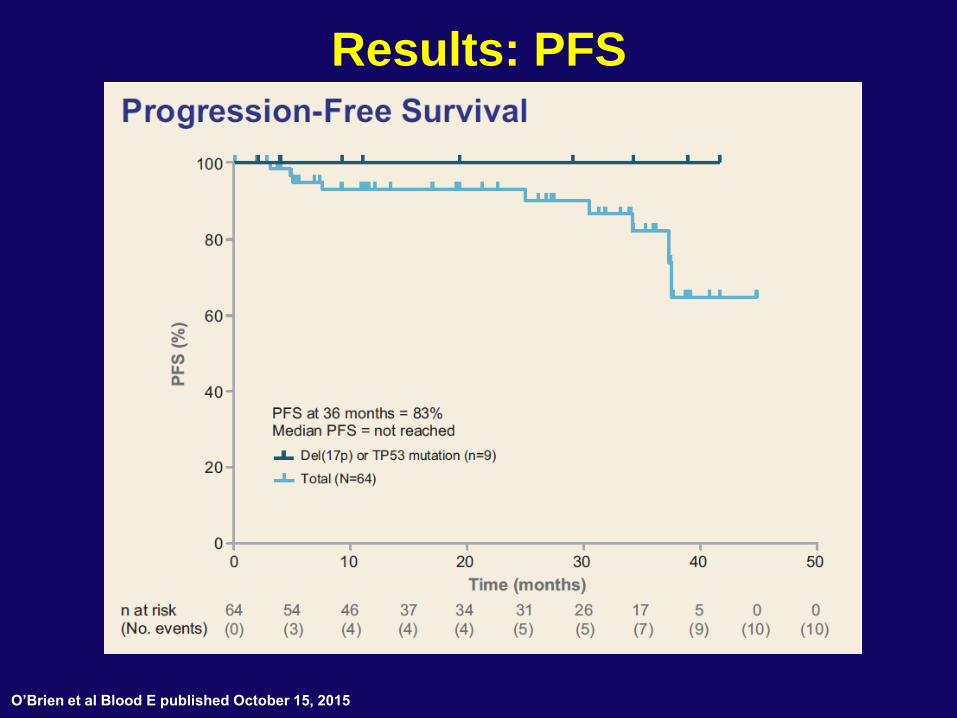
Results: PFS
O’Brien et al Blood E published October 15, 2015
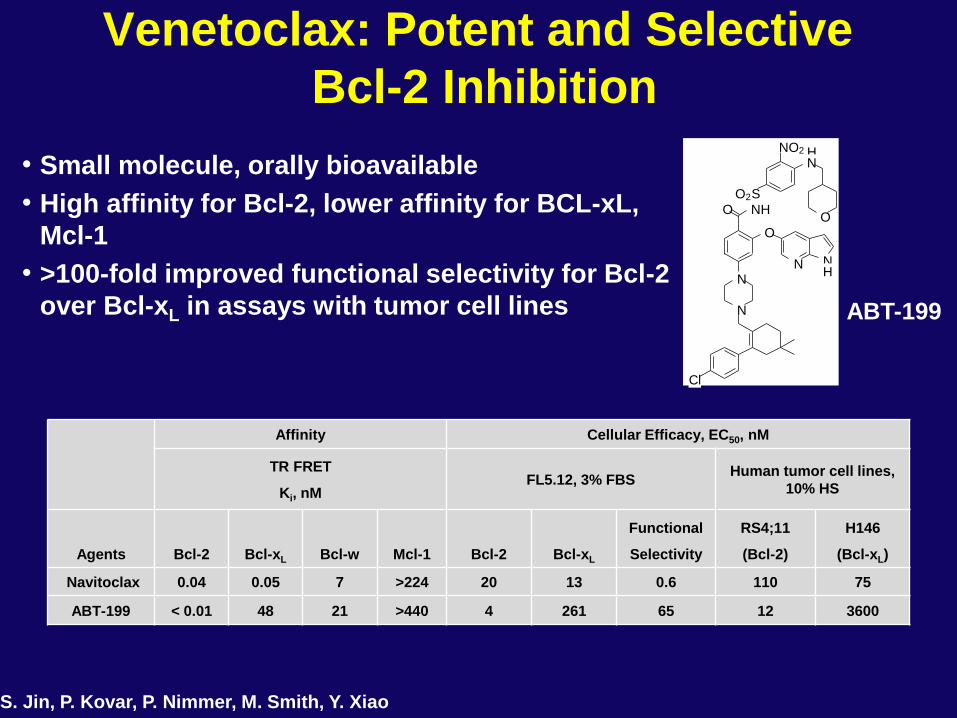
Venetoclax: Potent and Selective
Bcl-2 Inhibition
• Small molecule, orally bioavailable
• High affinity for Bcl-2, lower affinity for BCL-xL,
Mcl-1
• >100-fold improved functional selectivity for Bcl-2
over Bcl-xL in assays with tumor cell lines
Affinity Cellular Efficacy, EC50, nM
TR FRET
Ki, nM FL5.12, 3% FBS
Human tumor cell lines,
10% HS
Agents Bcl-2 Bcl-xL Bcl-w Mcl-1 Bcl-2 Bcl-xL
Functional
Selectivity
RS4;11
(Bcl-2)
H146
(Bcl-xL)
Navitoclax 0.04 0.05 7 >224 20 13 0.6 110 75
ABT-199 < 0.01 48 21 >440 4 261 65 12 3600
ABT-199
S. Jin, P. Kovar, P. Nimmer, M. Smith, Y. Xiao
O N H
O
O 2 S
H N
N
N
C l
N O 2
O
N N H
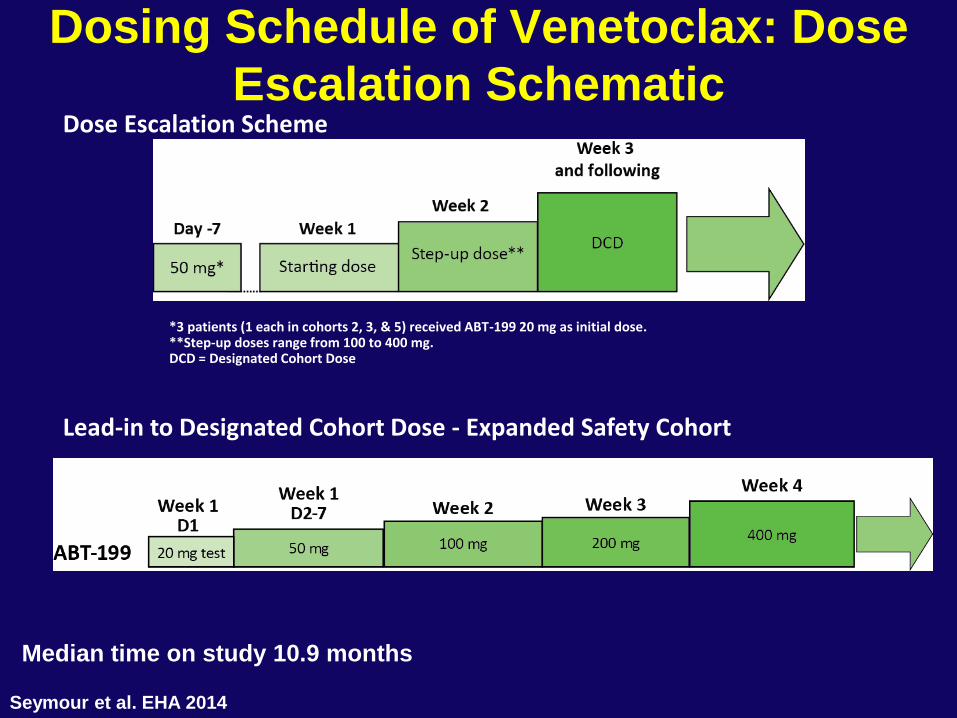
Dosing Schedule of Venetoclax: Dose
Escalation Schematic
*3 patients (1 each in cohorts 2, 3, & 5) received ABT-199 20 mg as initial dose. **Step-up doses range from 100 to 400 mg. DCD = Designated Cohort Dose
c
Lead-in to Designated Cohort Dose - Expanded Safety Cohort
Dose Escalation Scheme
Median time on study 10.9 months
Seymour et al. EHA 2014
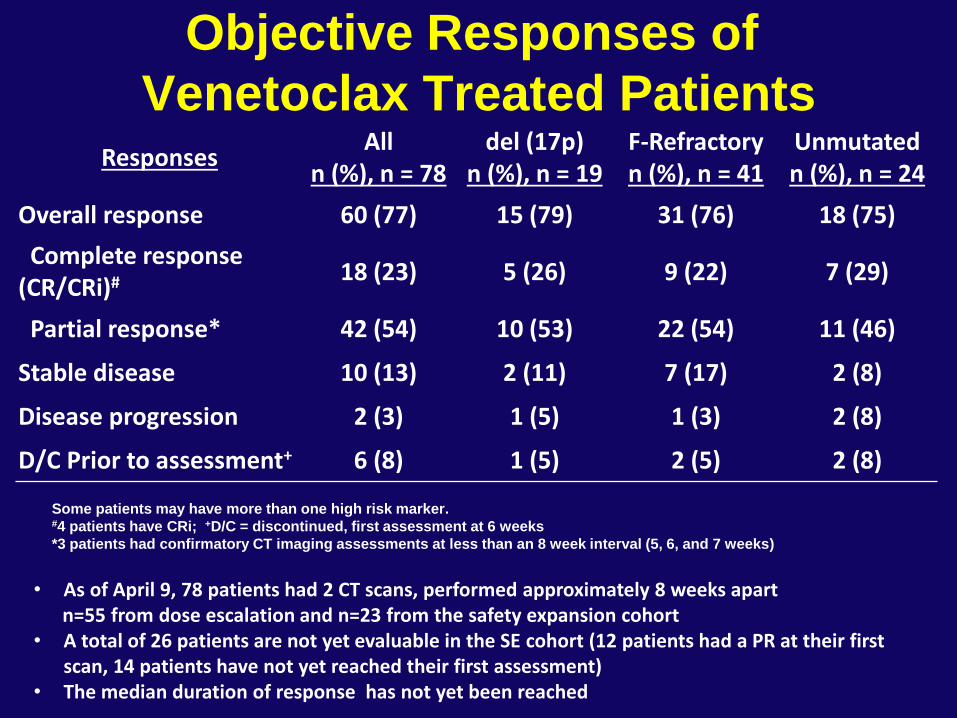
Objective Responses of
Venetoclax Treated Patients Responses
All n (%), n = 78
del (17p) n (%), n = 19
F-Refractory n (%), n = 41
Unmutated n (%), n = 24
Overall response 60 (77) 15 (79) 31 (76) 18 (75)
Complete response (CR/CRi)#
18 (23) 5 (26) 9 (22) 7 (29)
Partial response* 42 (54) 10 (53) 22 (54) 11 (46)
Stable disease 10 (13) 2 (11) 7 (17) 2 (8)
Disease progression 2 (3) 1 (5) 1 (3) 2 (8)
D/C Prior to assessment+ 6 (8) 1 (5) 2 (5) 2 (8)
Some patients may have more than one high risk marker. #4 patients have CRi; +D/C = discontinued, first assessment at 6 weeks
*3 patients had confirmatory CT imaging assessments at less than an 8 week interval (5, 6, and 7 weeks)
• As of April 9, 78 patients had 2 CT scans, performed approximately 8 weeks apart n=55 from dose escalation and n=23 from the safety expansion cohort • A total of 26 patients are not yet evaluable in the SE cohort (12 patients had a PR at their first
scan, 14 patients have not yet reached their first assessment) • The median duration of response has not yet been reached
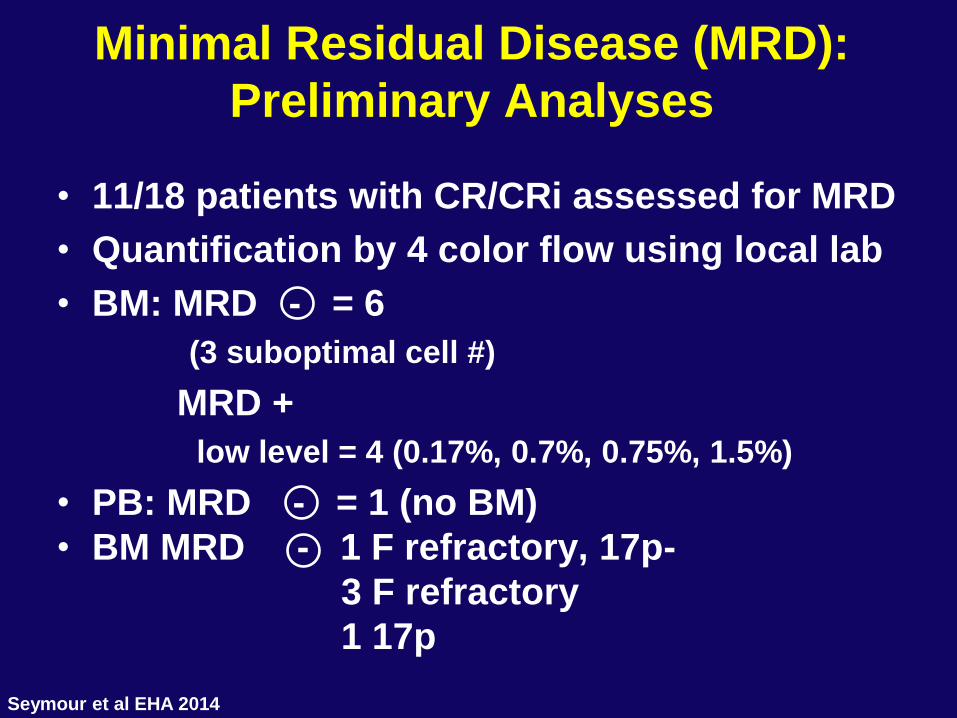
Minimal Residual Disease (MRD):
Preliminary Analyses
• 11/18 patients with CR/CRi assessed for MRD
• Quantification by 4 color flow using local lab
• BM: MRD - = 6
(3 suboptimal cell #)
MRD +
low level = 4 (0.17%, 0.7%, 0.75%, 1.5%)
• PB: MRD - = 1 (no BM)
• BM MRD - 1 F refractory, 17p-
3 F refractory
1 17p
Seymour et al EHA 2014
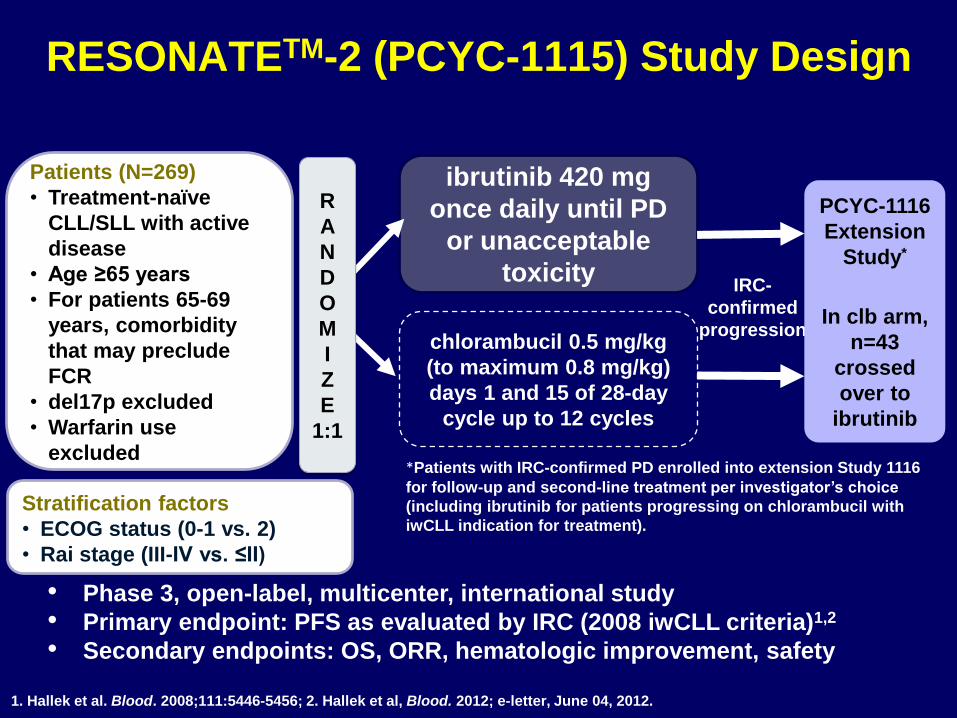
RESONATETM-2 (PCYC-1115) Study Design
Patients (N=269)
• Treatment-naïve
CLL/SLL with active
disease
• Age ≥65 years
• For patients 65-69
years, comorbidity
that may preclude
FCR
• del17p excluded
• Warfarin use
excluded
ibrutinib 420 mg
once daily until PD
or unacceptable
toxicity
chlorambucil 0.5 mg/kg
(to maximum 0.8 mg/kg)
days 1 and 15 of 28-day
cycle up to 12 cycles
*Patients with IRC-confirmed PD enrolled into extension Study 1116
for follow-up and second-line treatment per investigator’s choice
(including ibrutinib for patients progressing on chlorambucil with
iwCLL indication for treatment).
• Phase 3, open-label, multicenter, international study
• Primary endpoint: PFS as evaluated by IRC (2008 iwCLL criteria)1,2
• Secondary endpoints: OS, ORR, hematologic improvement, safety
1. Hallek et al. Blood. 2008;111:5446-5456; 2. Hallek et al, Blood. 2012; e-letter, June 04, 2012.
IRC-
confirmed
progression
PCYC-1116
Extension
Study*
In clb arm,
n=43
crossed
over to
ibrutinib
Stratification factors
• ECOG status (0-1 vs. 2)
• Rai stage (III-IV vs. ≤II)
R
A
N
D
O
M
I
Z
E
1:1
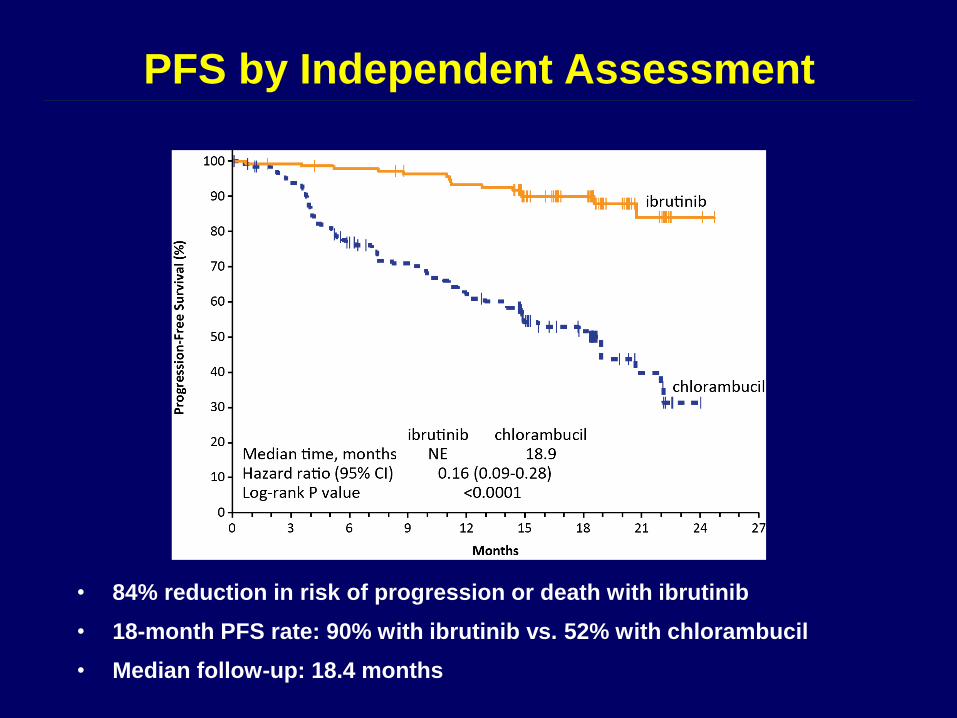
PFS by Independent Assessment
• 84% reduction in risk of progression or death with ibrutinib
• 18-month PFS rate: 90% with ibrutinib vs. 52% with chlorambucil
• Median follow-up: 18.4 months
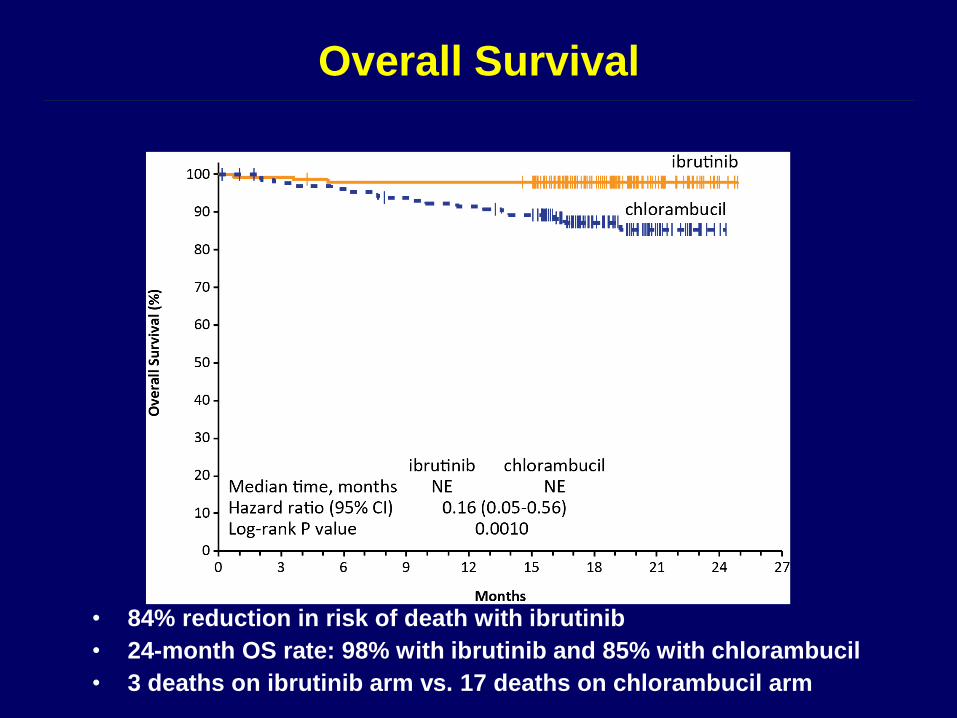
Overall Survival
• 84% reduction in risk of death with ibrutinib
• 24-month OS rate: 98% with ibrutinib and 85% with chlorambucil
• 3 deaths on ibrutinib arm vs. 17 deaths on chlorambucil arm
Response to FC + Rituximab
(NCI-WG: 300 Patients)
Response* # Pts. ( % )
CR 217 (72)
Nodular PR 31 (10) 95%
PR 37 (12)
No Response 13 ( 4)
Early Death 2 ( 1)
* Evaluated 6 months after last course
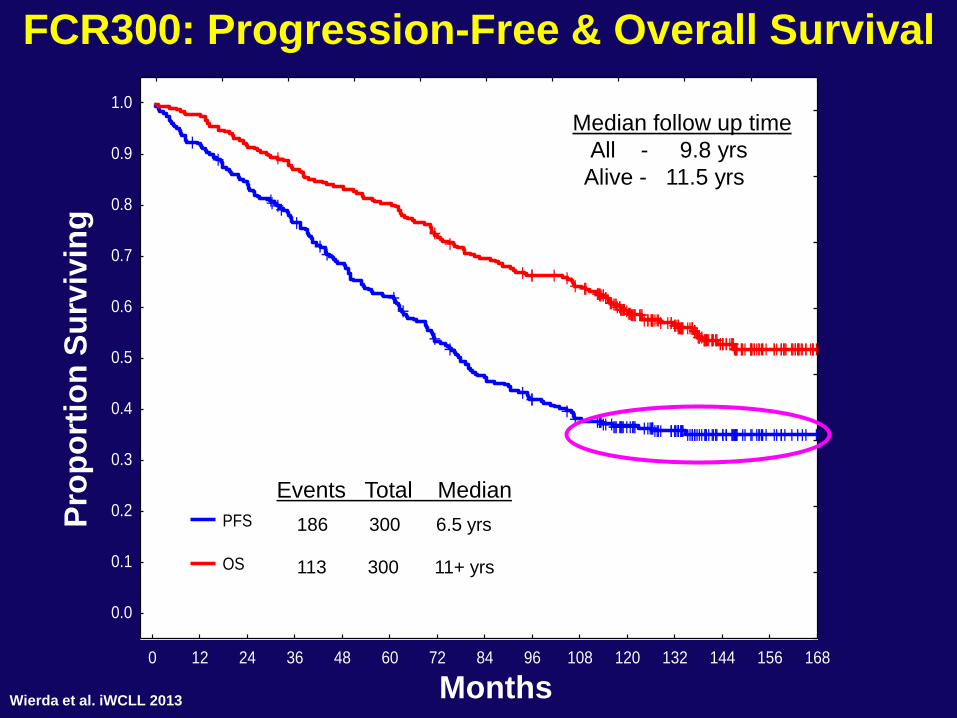
FCR300: Progression-Free & Overall Survival
Months
Pro
po
rtio
n S
urv
ivin
g
0 12 24 36 48 60 72 84 96 108 120 132 144 156 168
0.0
0.1
0.2
0.3
0.4
0.5
0.6
0.7
0.8
0.9
1.0
PFS
OS
Events Total Median
186 300 6.5 yrs
113 300 11+ yrs
Median follow up time
All - 9.8 yrs
Alive - 11.5 yrs
Wierda et al. iWCLL 2013
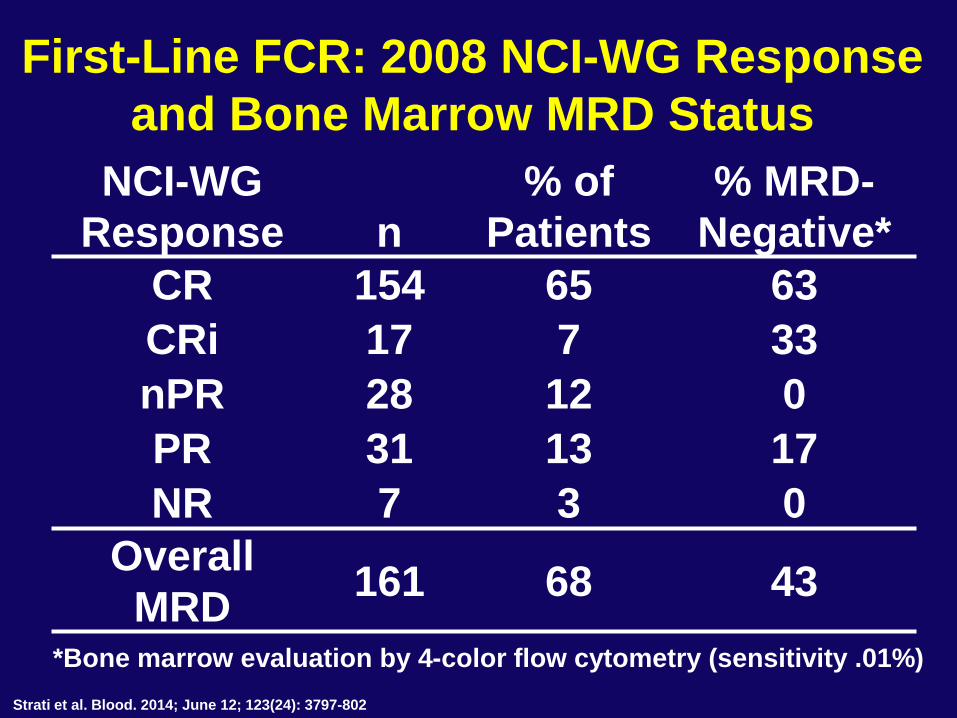
First-Line FCR: 2008 NCI-WG Response
and Bone Marrow MRD Status
NCI-WG
Response n
% of
Patients
% MRD-
Negative*
CR 154 65 63
CRi 17 7 33
nPR 28 12 0
PR 31 13 17
NR 7 3 0
Overall
MRD 161 68 43
*Bone marrow evaluation by 4-color flow cytometry (sensitivity .01%)
Strati et al. Blood. 2014; June 12; 123(24): 3797-802
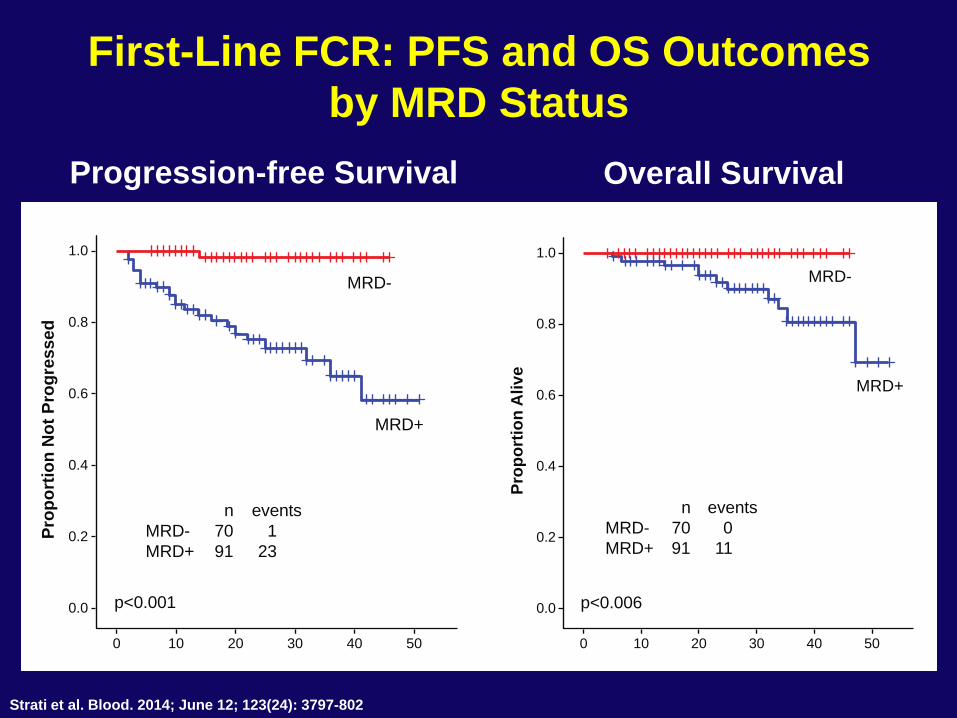
First-Line FCR: PFS and OS Outcomes
by MRD Status
Progression-free Survival Overall Survival
50403020100
0.0
0.2
0.4
0.6
Pro
po
rtio
n N
ot
Pro
gre
ss
ed 0.8
1.0
MRD-
MRD+
p<0.001
n events
MRD- 70 1
MRD+ 91 23
MRD-
MRD+
50403020100
0.0
0.2
0.4
0.6
Pro
po
rtio
n A
liv
e
0.8
1.0
p<0.006
n events
MRD- 70 0
MRD+ 91 11
Strati et al. Blood. 2014; June 12; 123(24): 3797-802
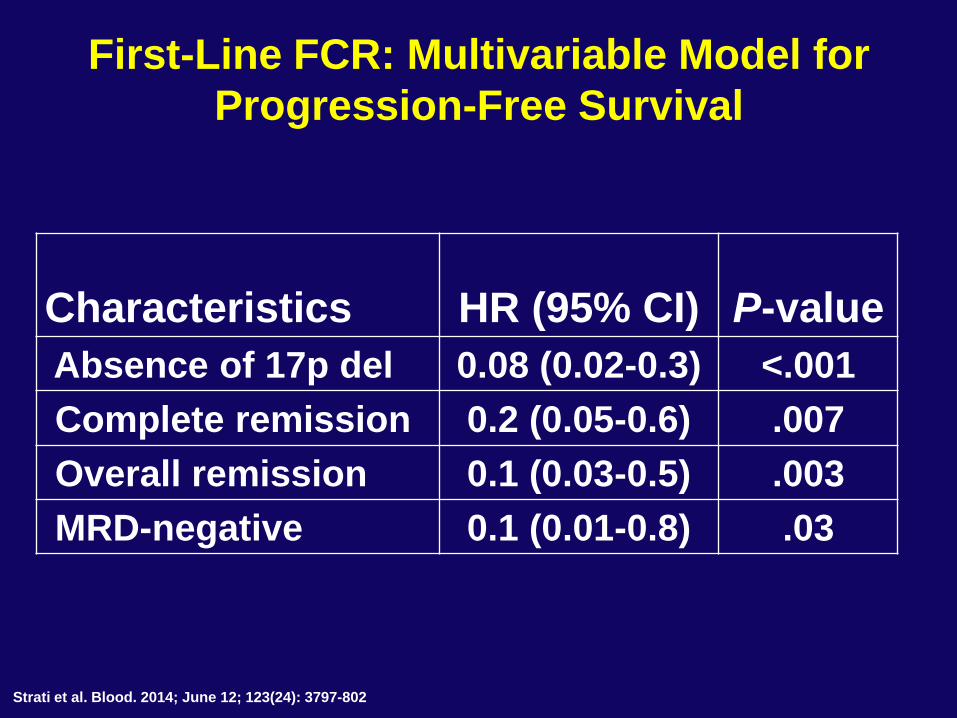
First-Line FCR: Multivariable Model for
Progression-Free Survival
Characteristics HR (95% CI) P-value
Absence of 17p del 0.08 (0.02-0.3) <.001
Complete remission 0.2 (0.05-0.6) .007
Overall remission 0.1 (0.03-0.5) .003
MRD-negative 0.1 (0.01-0.8) .03
Strati et al. Blood. 2014; June 12; 123(24): 3797-802
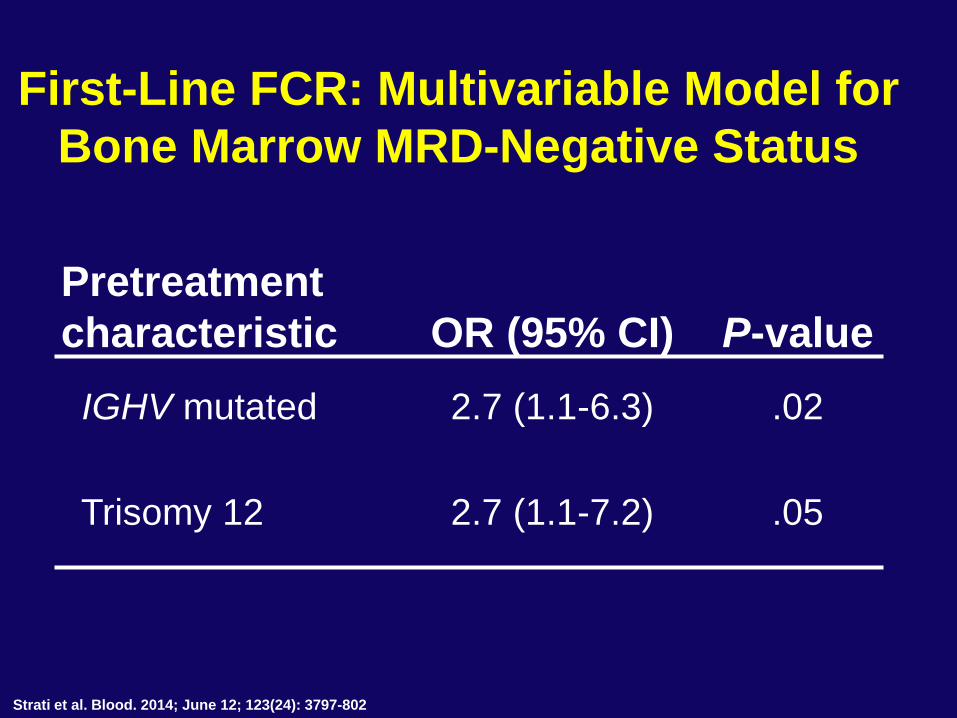
First-Line FCR: Multivariable Model for
Bone Marrow MRD-Negative Status
Pretreatment
characteristic OR (95% CI) P-value
IGHV mutated 2.7 (1.1-6.3) .02
Trisomy 12 2.7 (1.1-7.2) .05
Strati et al. Blood. 2014; June 12; 123(24): 3797-802
0 12 24 36 48 60 72 84 96 108 120 132 144 156 168
0.0
0.1
0.2
0.3
0.4
0.5
0.6
0.7
0.8
0.9
1.0
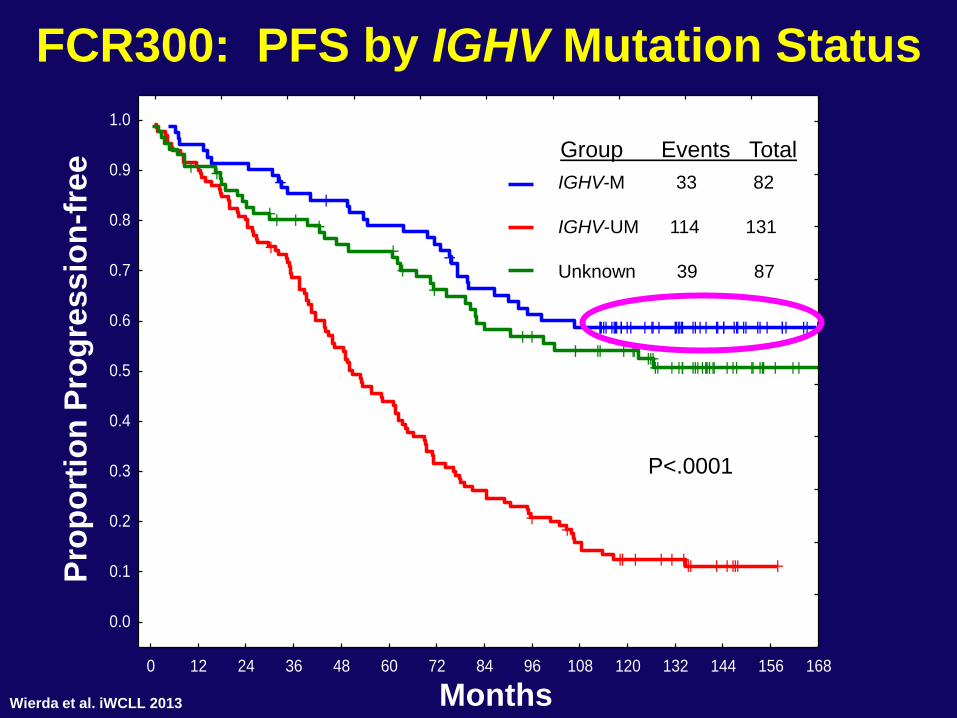
FCR300: PFS by IGHV Mutation Status
Months
Pro
po
rtio
n P
rog
ress
ion
-fre
e
IGHV-M 33 82
IGHV-UM 114 131
Group Events Total
P<.0001
Unknown 39 87
Wierda et al. iWCLL 2013
Conclusions • FCR best standard of care
– Not in 17p deletion or older patients
• BCR inhibitors changing the CLL landscape
– Ibrutinib now has a frontline indication
For everyone?
– Idelalisib, given with rituximab
high response rates but increased side effects in
previously untreated patients
• Venetoclax (BCL-2 inhibitor):
high response rates in relapse
approved 4/16 for relapsed 17p deletion
• 33% of FCR patients disease free 10+ yrs
– Mutated, trisomy 12, no 17p or 11q
– How do we best assure doing no harm while incorporating
novel agents?
![Appendix F Examples · IT = the chemical intake (mg/kg-day) SF = the contaminant carcinogenic slope factor ([mg/kg-day]-1) Risk = 0.0107 mg/kg-day * 0.1 [mg/kg-day]-1 = 1.07 x 10-3](https://img.pdfslide.us/doc/110x75/600190ddec33f82cbe5ca5d7/appendix-f-examples-it-the-chemical-intake-mgkg-day-sf-the-contaminant-carcinogenic.jpg)