Embed Size (px)
Citation preview
Tendler et al. BMC Systems Biology (2015) 9:12 DOI 10.1186/s12918-015-0149-z
RESEARCH ARTICLE Open Access
Evolutionary tradeoffs, Pareto optimality and themorphology of ammonite shellsAvichai Tendler, Avraham Mayo and Uri Alon*
Abstract
Background: Organisms that need to perform multiple tasks face a fundamental tradeoff: no design can beoptimal at all tasks at once. Recent theory based on Pareto optimality showed that such tradeoffs lead to a highlydefined range of phenotypes, which lie in low-dimensional polyhedra in the space of traits. The vertices of thesepolyhedra are called archetypes- the phenotypes that are optimal at a single task. To rigorously test this theoryrequires measurements of thousands of species over hundreds of millions of years of evolution. Ammonoid fossilshells provide an excellent model system for this purpose. Ammonoids have a well-defined geometry that canbe parameterized using three dimensionless features of their logarithmic-spiral-shaped shells. Their evolutionaryhistory includes repeated mass extinctions.
Results: We find that ammonoids fill out a pyramid in morphospace, suggesting five specific tasks - one for eachvertex of the pyramid. After mass extinctions, surviving species evolve to refill essentially the same pyramid, suggestingthat the tasks are unchanging. We infer putative tasks for each archetype, related to economy of shell material, rapidshell growth, hydrodynamics and compactness.
Conclusions: These results support Pareto optimality theory as an approach to study evolutionary tradeoffs, anddemonstrate how this approach can be used to infer the putative tasks that may shape the natural selection ofphenotypes.
Keywords: Multi-objective optimality, Repeated evolution, Pareto front, Diversity, Performance, Goal
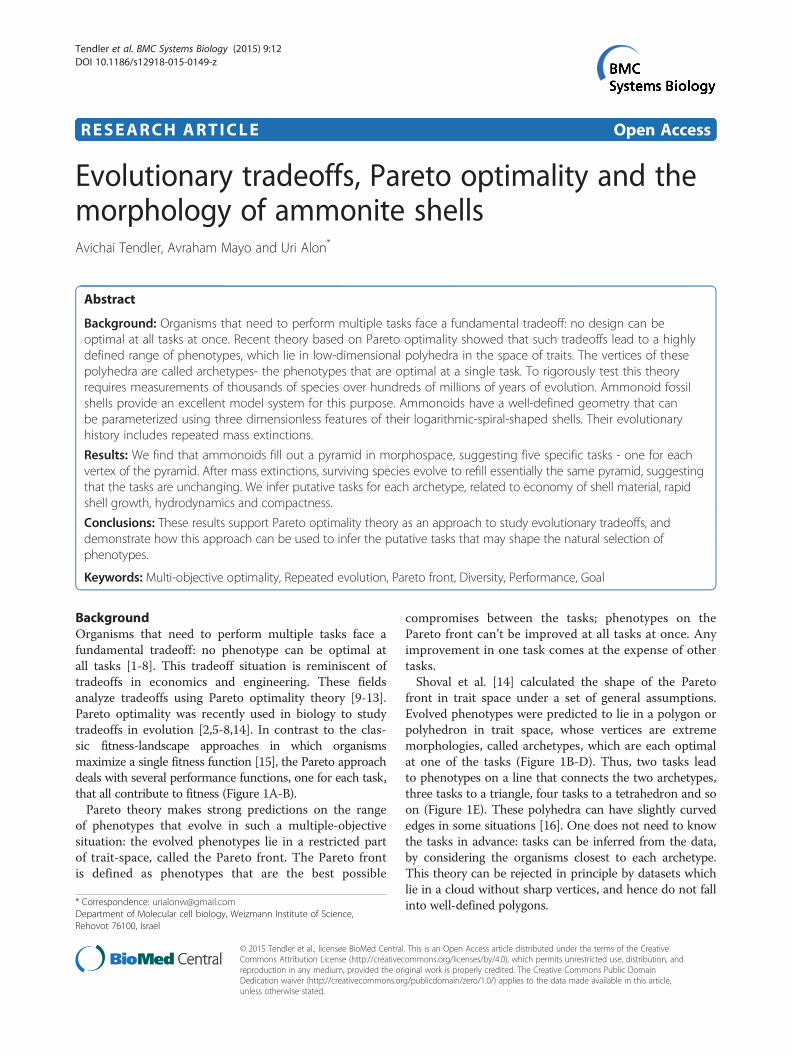
BackgroundOrganisms that need to perform multiple tasks face afundamental tradeoff: no phenotype can be optimal atall tasks [1-8]. This tradeoff situation is reminiscent oftradeoffs in economics and engineering. These fieldsanalyze tradeoffs using Pareto optimality theory [9-13].Pareto optimality was recently used in biology to studytradeoffs in evolution [2,5-8,14]. In contrast to the clas-sic fitness-landscape approaches in which organismsmaximize a single fitness function [15], the Pareto approachdeals with several performance functions, one for each task,that all contribute to fitness (Figure 1A-B).Pareto theory makes strong predictions on the range
of phenotypes that evolve in such a multiple-objectivesituation: the evolved phenotypes lie in a restricted partof trait-space, called the Pareto front. The Pareto frontis defined as phenotypes that are the best possible
* Correspondence: [email protected] of Molecular cell biology, Weizmann Institute of Science,Rehovot 76100, Israel
© 2015 Tendler et al.; licensee BioMed CentraCommons Attribution License (http://creativecreproduction in any medium, provided the orDedication waiver (http://creativecommons.orunless otherwise stated.
compromises between the tasks; phenotypes on thePareto front can’t be improved at all tasks at once. Anyimprovement in one task comes at the expense of othertasks.Shoval et al. [14] calculated the shape of the Pareto
front in trait space under a set of general assumptions.Evolved phenotypes were predicted to lie in a polygon orpolyhedron in trait space, whose vertices are extrememorphologies, called archetypes, which are each optimalat one of the tasks (Figure 1B-D). Thus, two tasks leadto phenotypes on a line that connects the two archetypes,three tasks to a triangle, four tasks to a tetrahedron and soon (Figure 1E). These polyhedra can have slightly curvededges in some situations [16]. One does not need to knowthe tasks in advance: tasks can be inferred from the data,by considering the organisms closest to each archetype.This theory can be rejected in principle by datasets whichlie in a cloud without sharp vertices, and hence do not fallinto well-defined polygons.
l. This is an Open Access article distributed under the terms of the Creativeommons.org/licenses/by/4.0), which permits unrestricted use, distribution, andiginal work is properly credited. The Creative Commons Public Domaing/publicdomain/zero/1.0/) applies to the data made available in this article,
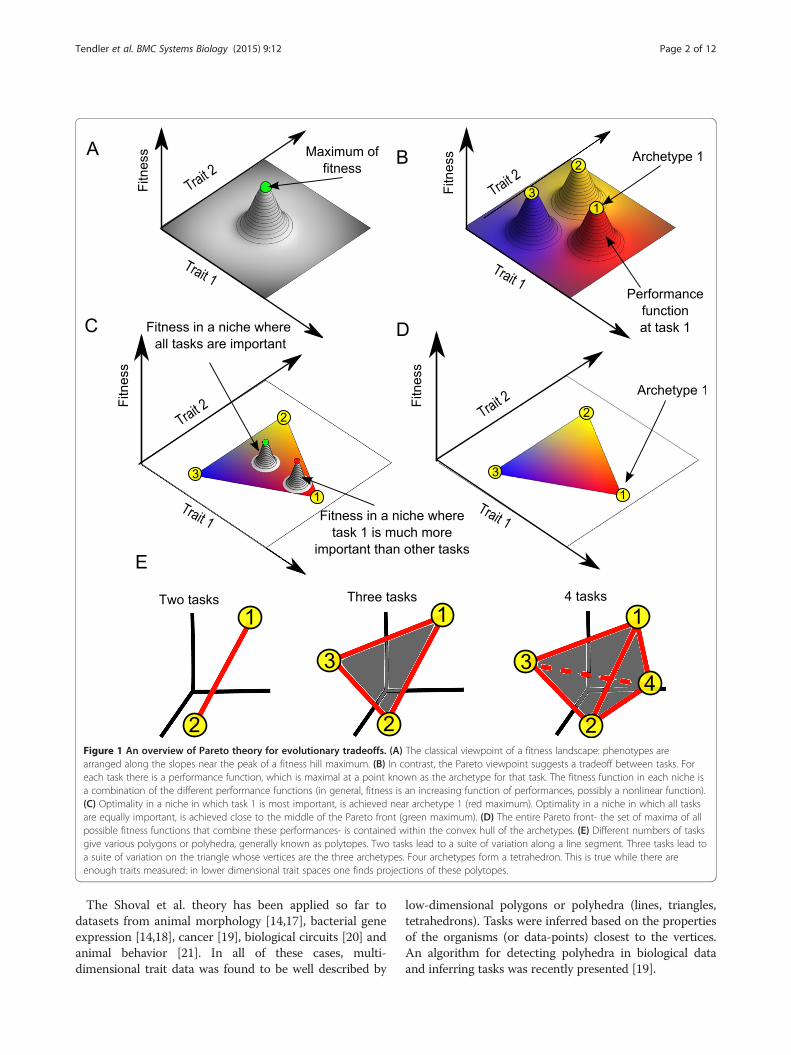
Figure 1 An overview of Pareto theory for evolutionary tradeoffs. (A) The classical viewpoint of a fitness landscape: phenotypes arearranged along the slopes near the peak of a fitness hill maximum. (B) In contrast, the Pareto viewpoint suggests a tradeoff between tasks. Foreach task there is a performance function, which is maximal at a point known as the archetype for that task. The fitness function in each niche isa combination of the different performance functions (in general, fitness is an increasing function of performances, possibly a nonlinear function).(C) Optimality in a niche in which task 1 is most important, is achieved near archetype 1 (red maximum). Optimality in a niche in which all tasksare equally important, is achieved close to the middle of the Pareto front (green maximum). (D) The entire Pareto front- the set of maxima of allpossible fitness functions that combine these performances- is contained within the convex hull of the archetypes. (E) Different numbers of tasksgive various polygons or polyhedra, generally known as polytopes. Two tasks lead to a suite of variation along a line segment. Three tasks lead toa suite of variation on the triangle whose vertices are the three archetypes. Four archetypes form a tetrahedron. This is true while there areenough traits measured: in lower dimensional trait spaces one finds projections of these polytopes.
Tendler et al. BMC Systems Biology (2015) 9:12 Page 2 of 12
The Shoval et al. theory has been applied so far todatasets from animal morphology [14,17], bacterial geneexpression [14,18], cancer [19], biological circuits [20] andanimal behavior [21]. In all of these cases, multi-dimensional trait data was found to be well described by
low-dimensional polygons or polyhedra (lines, triangles,tetrahedrons). Tasks were inferred based on the propertiesof the organisms (or data-points) closest to the vertices.An algorithm for detecting polyhedra in biological dataand inferring tasks was recently presented [19].
Tendler et al. BMC Systems Biology (2015) 9:12 Page 3 of 12
However, some of the fundamental predictions ofthe theory have not been tested yet. The theory predictsthat as long as the tasks stay more-or-less constant, forexample dictated by biomechanical constraints, thevertices of the polygon also do not change. Moreover,the polygons in the theory are not necessarily due tophylogenetic history, but rather to convergent evolutionto Pareto-optimal solutions. Thus, for example, after amass extinction which removes most of the species froma class [22,23], survivor species are predicted to evolve tore-fill the same polygon as their ancestors [22,24].To test these predictions requires a class of organisms
evolving over geological timescales, with mass extinctions,and whose geometry is well-defined and can be linked tofunction. An excellent model system for this purpose isammonoid fossil shells.Ammonoids were a successful and diverse group of
species, which lived in the seas from 400 to 65 millionyears ago (mya). Ammonoid shells can be described by amorphospace defined by three geometrical parameters,defined in the pioneering work of David Raup (Figure 2)[15,25,26]. In this morphospace, the outer shell is a loga-rithmic spiral, whose radius grows with each whorl by afactor W, the whorl expansion rate. There is a constant ra-tio between the inner and outer shell radii, denoted D.Finally, the shell cross section can range from circularto elliptical, as described by S, the third parameter.Raup’s W-D-S parameterization can be robustly measuredfrom fossils [26] although the coiling axis changesthroughout ontogeny and thus, the coiling axis is some-times difficult to exactly locate in actual specimens[27,28]. It has been the setting for extensive research onammonoid morphology and evolution [22,29-32], as wellas the morphology of other shelled organisms [33,34].Plotting each genus of ammonoids as a point in
this morphospace, ignoring coiling axis changes, Raupdiscovered that most of the theoretical morphospace is
Figure 2 Raup morphospace coordinates. Ammonoid shellmorphology can be described by three dimensionless geometricalparameters: W, the whorl expansion rate, is defined by a/b in thefigure. D, the internal to external shell ratio, is x/a. S, the openingshape parameter, is y/z. The shell diameter can also be related tothe parameters in this figure as shown.
empty: many possible shell forms are not found. Theexisting forms lie in a roughly triangular region inthe W-D plane (Figure 3A). One reason for this dis-tribution is geometric constraints. Researchers havesuggested that ammonoids tend to lie to the left ofthe hyperbola W= 1/D [15,26], because beyond this curveshells are gyroconic (shells with non-overlapping whorls)(Figure 3A upper right corner). Such gyroconic shells aremechanically weaker and less hydrodynamically favorable[35,36]. It is noteworthy, however, that shells to the rightof the curve do exist in nature, for example in the Bactri-tida or Orthocerida lineages, which are probably ancestralto the ammonoids (Figure 3B, top right) [37-40], as well asin heteromorph ammonoids that occasionally occur in theMesozoic and more commonly in the Cretaceous. Thusthe W= 1/D curve is unlikely to be an absolute geometricconstraint (for more evidence, see Additional file 1).Studies in recent years have considered a larger dataset
of ammonoids than Raup [22,29,30]. Work, Saundersand Nikolaeva [22] show that after each mass extinction,ammonoid genera refill the same roughly triangularmorphospace [24]. The repeated convergence to thesame suite of variation raises the question of the relationbetween ammonoid morphology and function. Moststudies hypothesize a fitness function, which has anoptimum in the middle of the triangular region [15,35,36](Figure 1A). The fitness function is often taken to be domi-nated by hydrodynamic drag; this assumption is compellingsince the contours of hydrodynamic efficiency, experimen-tally measured by Chamberlain [35], show peaks at posi-tions close to the most densely occupied regions ofmorphospace [15]. The ammonoid genera are assumed toalso occupy the slopes that descend from the fitness peaks,until bounded by the geometric constrains [15].Interestingly, Raup did not espouse the idea of a
single task (such as hydrodynamic efficiency) dominat-ing fitness, but rather noted that multiple tasks mightbe at play [26]. In every niche, different tasks becomeimportant, leading to niche-dependent fitness functionswith different maxima (Figure 1B-D). The idea of mul-tiple tasks was elegantly employed by Westermann[42], who described ammonoid morphospace by map-ping it to a triangle. At the vertices are three ‘end mem-ber’ morphologies which correspond to three lifestyles.Each morphology is mapped to a point in the triangle,which is interpreted as portraying the relative distancefrom the end members and hence the relative weights ofthe three lifestyles. The Westermann morphospace wasuseful in comparing different datasets and in interpretingammonoid lifestyles [43,44]. The main drawback of theWestermann morphospace is that, because it involvesnonlinear dimensionality reduction, different morpholo-gies can be mapped to the same point, and in some casesslight differences in shape can lead to large differences
12
3
million years
0today
-65ammonite extinction
-252Permian/Triassicmass extinction
-359Devonian/Missisipian
massextinction
-372Fransian/
Femennianmass
extinction
Figure B99 genera
data from (7)
Figure C113 genera
data from (7)
Figure D386 genera
data from (7)
Figure E392 genera
data from (9)
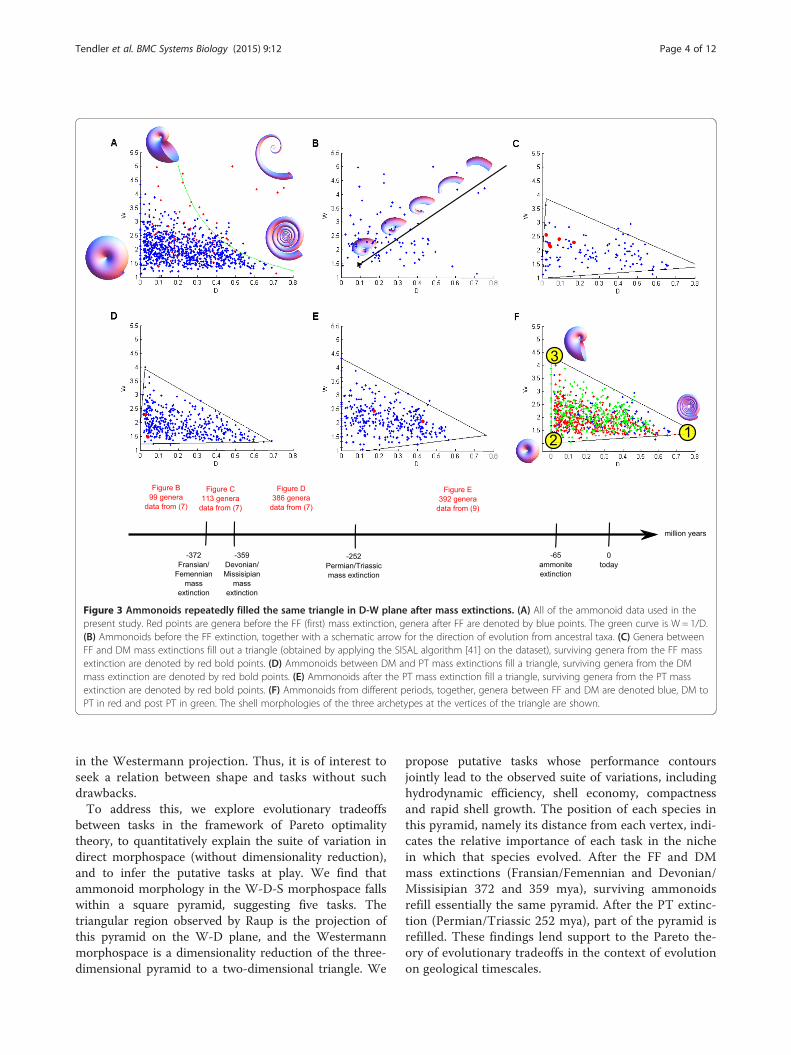
Figure 3 Ammonoids repeatedly filled the same triangle in D-W plane after mass extinctions. (A) All of the ammonoid data used in thepresent study. Red points are genera before the FF (first) mass extinction, genera after FF are denoted by blue points. The green curve is W = 1/D.(B) Ammonoids before the FF extinction, together with a schematic arrow for the direction of evolution from ancestral taxa. (C) Genera betweenFF and DM mass extinctions fill out a triangle (obtained by applying the SISAL algorithm [41] on the dataset), surviving genera from the FF massextinction are denoted by red bold points. (D) Ammonoids between DM and PT mass extinctions fill a triangle, surviving genera from the DMmass extinction are denoted by red bold points. (E) Ammonoids after the PT mass extinction fill a triangle, surviving genera from the PT massextinction are denoted by red bold points. (F) Ammonoids from different periods, together, genera between FF and DM are denoted blue, DM toPT in red and post PT in green. The shell morphologies of the three archetypes at the vertices of the triangle are shown.
Tendler et al. BMC Systems Biology (2015) 9:12 Page 4 of 12
in the Westermann projection. Thus, it is of interest toseek a relation between shape and tasks without suchdrawbacks.To address this, we explore evolutionary tradeoffs
between tasks in the framework of Pareto optimalitytheory, to quantitatively explain the suite of variation indirect morphospace (without dimensionality reduction),and to infer the putative tasks at play. We find thatammonoid morphology in the W-D-S morphospace fallswithin a square pyramid, suggesting five tasks. Thetriangular region observed by Raup is the projection ofthis pyramid on the W-D plane, and the Westermannmorphospace is a dimensionality reduction of the three-dimensional pyramid to a two-dimensional triangle. We
propose putative tasks whose performance contoursjointly lead to the observed suite of variations, includinghydrodynamic efficiency, shell economy, compactnessand rapid shell growth. The position of each species inthis pyramid, namely its distance from each vertex, indi-cates the relative importance of each task in the nichein which that species evolved. After the FF and DMmass extinctions (Fransian/Femennian and Devonian/Missisipian 372 and 359 mya), surviving ammonoidsrefill essentially the same pyramid. After the PT extinc-tion (Permian/Triassic 252 mya), part of the pyramid isrefilled. These findings lend support to the Pareto the-ory of evolutionary tradeoffs in the context of evolutionon geological timescales.
Tendler et al. BMC Systems Biology (2015) 9:12 Page 5 of 12
ResultsAmmonoid distributions in the W-D plane converge to asimilar triangle after major extinctionsWe begin by considering ammonoid morphology inthe W-D plane, and later consider the three dimensionalW-D-S space (Figure 3). We combine the data of Saunders,Work and Nikolaeva [22] for Paleozoic ammonoids (598genera, before the PT mass extinction- for extinctiontimeline see Figure 3 lower panel), with the data ofMcGowan [29] for Mesozoic ammonoids (392 genera,after PT). The data is classified into three sets betweenmass extinctions: from FF to DM (113 genera, Figure 3C),from DM to PT (386 genera, Figure 3D), and after PT(392 genera, Figure 3E).We tested whether the ammonoid distribution in each
set falls in a triangle more closely than randomized data,based on the statistical test of [14]. We use an archetypeanalysis algorithm (SISAL) [45] to find triangles, whichenclose as much of the data as possible. We find that atriangle describes each dataset much better than ran-domized datasets in which the W and D coordinatesare randomly permuted (see Methods). Randomizeddata rarely fill out a triangle as well as the real data (p =0.02 for FF-DM data and p = 0.01 for the DM-PT and postPT sets).We next tested how similar the triangles are for the
three datasets. We computed the ratio between theintersection area of the triangles to the union area as ameasure for triangle similarity. The three triangles showlarge ratios of intersection to union area (0.84, 0.74 and0.71 for the (FF-DM, DM-PT), (FF-DM, post PT) and(DM-PT, post PT) pairs respectively, p <10-4 compared torandomly generated triangles, see Methods), indicating thatthe triangles are very similar.We conclude that after each extinction, ammonoids
re-populate essentially the same triangular region. Thevertices of the triangle describing the joint dataset ofammonoids after FF (Figure 3F) are
D�1;W
�1
� � ¼ 0:69; 1:35ð Þ e 0:7; 1:35ð Þ ð1Þ
D�2;W
�2
� � ¼ 0:003; 1:04ð Þ e 0; 1ð Þ ð2Þ
D�3;W
�3
� � ¼ 0:004; 4:59ð Þ e 0; 4:6ð Þ ð3ÞWe next ask which tasks might relate to each of the
vertices.
Economy of shell material may determine the firstarchetypeRaup [26] suggested that a possible need of the ammonoidsis to maximize their internal volume relative to shellvolume. This is important if shell production is costly, andalso in terms of buoyancy considerations. Ammonoids arethought to achieve neutral buoyancy by balancing shell
weight with buoyancy from their air-filled chambers; highinternal volume relative to shell material extends the rangeover which neutral buoyancy can be reached [46,47].To calculate shell material relative to internal volume
at each point in morphospace, we follow Raup andassume that shell thickness is a fixed fraction of radius,namely thickness/radius = 0.077, as measured by [47].Interestingly, this ratio is close to the optimal ratio ofthickness/radius =0.07 from calculations of mechanicalstrength in tube-like bones [4]. We improve slightly onChamberlin and Raup’s original calculation [48] bynumerically evaluating the necessary integrals ratherthan using the analytical approximations of [49] (seeMethods), yielding corrections of about 10%.The maximum of internal volume relative to shell
thickness occurs at (D1,W1) = (0.67, 1). This point is closeto archetype one D�
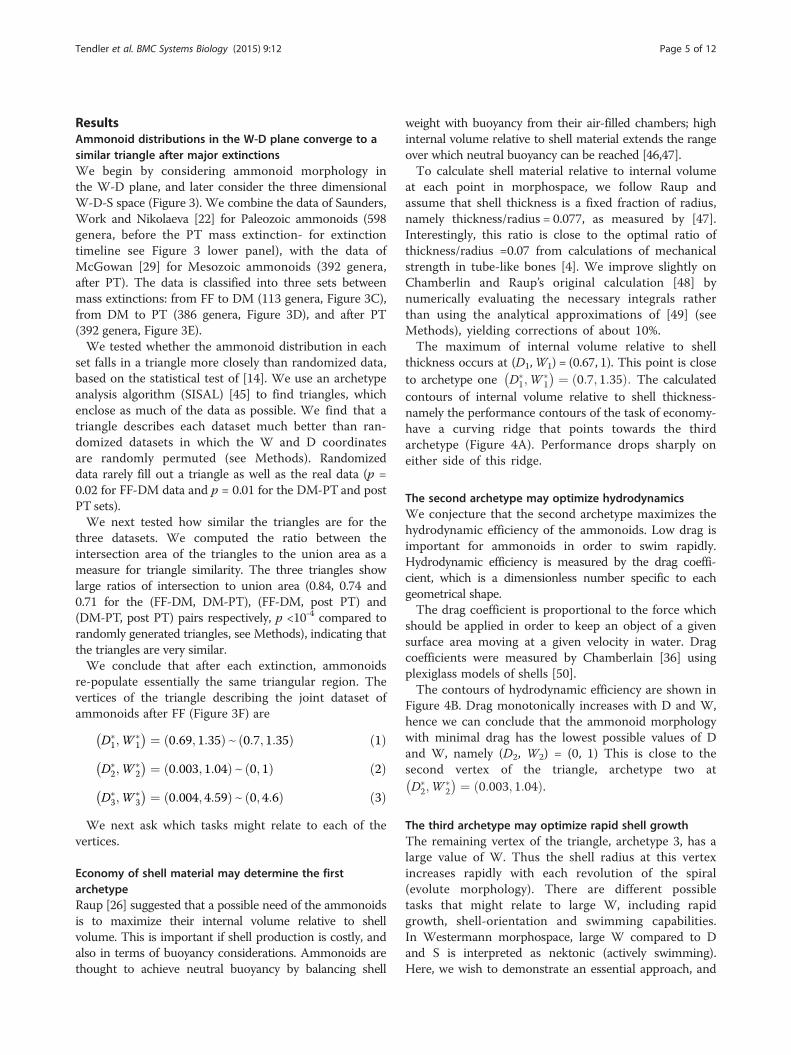
1;W�1
� � ¼ 0:7; 1:35ð Þ: The calculatedcontours of internal volume relative to shell thickness-namely the performance contours of the task of economy-have a curving ridge that points towards the thirdarchetype (Figure 4A). Performance drops sharply oneither side of this ridge.
The second archetype may optimize hydrodynamicsWe conjecture that the second archetype maximizes thehydrodynamic efficiency of the ammonoids. Low drag isimportant for ammonoids in order to swim rapidly.Hydrodynamic efficiency is measured by the drag coeffi-cient, which is a dimensionless number specific to eachgeometrical shape.The drag coefficient is proportional to the force which
should be applied in order to keep an object of a givensurface area moving at a given velocity in water. Dragcoefficients were measured by Chamberlain [36] usingplexiglass models of shells [50].The contours of hydrodynamic efficiency are shown in
Figure 4B. Drag monotonically increases with D and W,hence we can conclude that the ammonoid morphologywith minimal drag has the lowest possible values of Dand W, namely (D2, W2) = (0, 1) This is close to thesecond vertex of the triangle, archetype two atD�
2;W�2
� � ¼ 0:003; 1:04ð Þ.
The third archetype may optimize rapid shell growthThe remaining vertex of the triangle, archetype 3, has alarge value of W. Thus the shell radius at this vertexincreases rapidly with each revolution of the spiral(evolute morphology). There are different possibletasks that might relate to large W, including rapidgrowth, shell-orientation and swimming capabilities.In Westermann morphospace, large W compared to Dand S is interpreted as nektonic (actively swimming).Here, we wish to demonstrate an essential approach, and
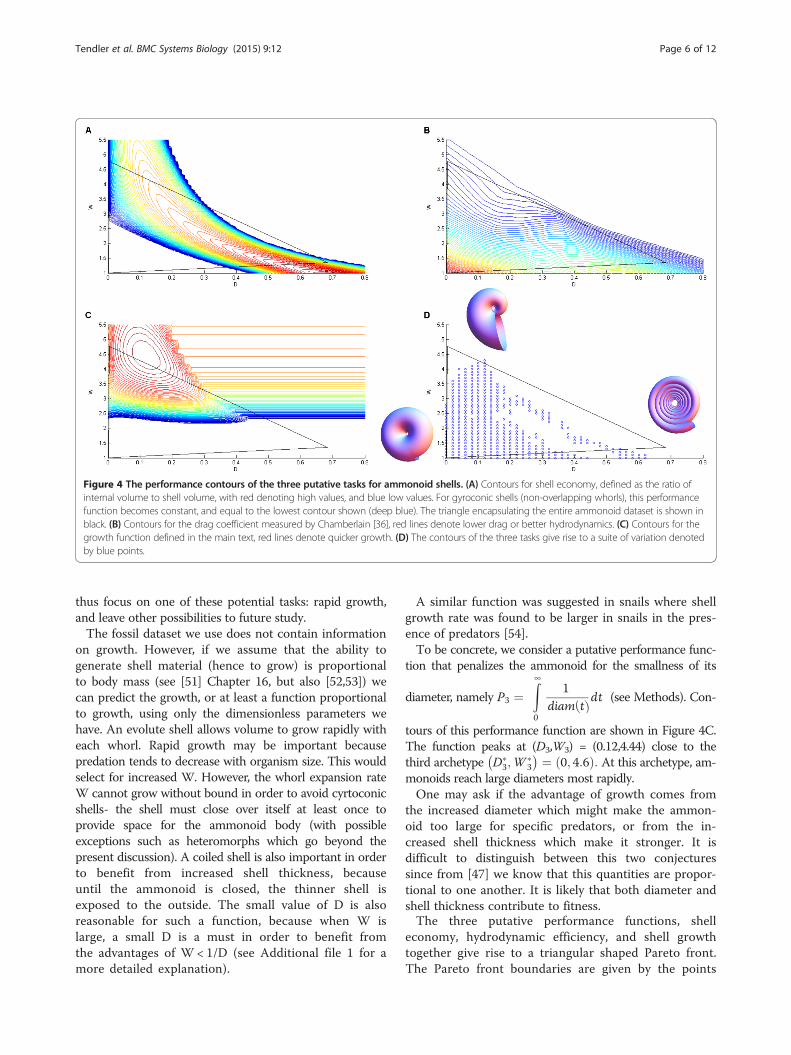
Figure 4 The performance contours of the three putative tasks for ammonoid shells. (A) Contours for shell economy, defined as the ratio ofinternal volume to shell volume, with red denoting high values, and blue low values. For gyroconic shells (non-overlapping whorls), this performancefunction becomes constant, and equal to the lowest contour shown (deep blue). The triangle encapsulating the entire ammonoid dataset is shown inblack. (B) Contours for the drag coefficient measured by Chamberlain [36], red lines denote lower drag or better hydrodynamics. (C) Contours for thegrowth function defined in the main text, red lines denote quicker growth. (D) The contours of the three tasks give rise to a suite of variation denotedby blue points.
Tendler et al. BMC Systems Biology (2015) 9:12 Page 6 of 12
thus focus on one of these potential tasks: rapid growth,and leave other possibilities to future study.The fossil dataset we use does not contain information
on growth. However, if we assume that the ability togenerate shell material (hence to grow) is proportionalto body mass (see [51] Chapter 16, but also [52,53]) wecan predict the growth, or at least a function proportionalto growth, using only the dimensionless parameters wehave. An evolute shell allows volume to grow rapidly witheach whorl. Rapid growth may be important becausepredation tends to decrease with organism size. This wouldselect for increased W. However, the whorl expansion rateW cannot grow without bound in order to avoid cyrtoconicshells- the shell must close over itself at least once toprovide space for the ammonoid body (with possibleexceptions such as heteromorphs which go beyond thepresent discussion). A coiled shell is also important in orderto benefit from increased shell thickness, becauseuntil the ammonoid is closed, the thinner shell isexposed to the outside. The small value of D is alsoreasonable for such a function, because when W islarge, a small D is a must in order to benefit fromthe advantages of W < 1/D (see Additional file 1 for amore detailed explanation).
A similar function was suggested in snails where shellgrowth rate was found to be larger in snails in the pres-ence of predators [54].To be concrete, we consider a putative performance func-
tion that penalizes the ammonoid for the smallness of its
diameter, namely P3 ¼Z∞0
1diam tð Þdt (see Methods). Con-
tours of this performance function are shown in Figure 4C.The function peaks at (D3,W3) = (0.12,4.44) close to thethird archetype D�
3;W�3
� � ¼ 0; 4:6ð Þ: At this archetype, am-monoids reach large diameters most rapidly.One may ask if the advantage of growth comes from
the increased diameter which might make the ammon-oid too large for specific predators, or from the in-creased shell thickness which make it stronger. It isdifficult to distinguish between this two conjecturessince from [47] we know that this quantities are propor-tional to one another. It is likely that both diameter andshell thickness contribute to fitness.The three putative performance functions, shell
economy, hydrodynamic efficiency, and shell growthtogether give rise to a triangular shaped Pareto front.The Pareto front boundaries are given by the points
Tendler et al. BMC Systems Biology (2015) 9:12 Page 7 of 12
of tangency of the contours of the different performancefunctions. Figure 4D shows the computed Pareto front,which resembles a slightly curved triangle, and is similarto the observed suite of variation.
Ammonoid data is enclosed by a pyramid in W-D-SmorphospaceUp to now, we considered ammonoid morphology pro-jected on the W-D plane. We now turn to the analysis ofthe data in the three-dimensional morphospace, given byW,D and S—whorl expansion, radii ratio and the shape ofthe shell opening. Low values of the parameter S corres-pond to oblate elliptical openings, giving rise to compressedshells (Figure 5B, front). An S value of 1 correspondsto a circular shell opening; high values correspondingto depressed shell morphologies (Figure 5B, rear).We attempted to enclose the 3D dataset by polygons
with 2 to 8 vertices. We evaluated the extent to whicheach polygon explains the data, by calculating the RMSdistance of points outside the polyhedron. We find thatbeyond 5 vertices, the RMS error does not decreasesignificantly (Figure 5A): Shapes with 6 or more verticesdo not improve the closeness of fit appreciably. Hence a5-vertex polygon is a parsimonious description of the data
Figure 5 The three dimensional Pareto front of the ammonoid dataset.computed for different numbers of possible vertices: line, triangle, tetrahedronarchetypes up to 5. Increasing the number beyond 5 doesn't improve the fit bAdditional file 1). (B-D) The best fit 5-archetype polygon resembles a square pgreen are post PT ammonoids. Archetypes are numbered, their morphology i
(Figure 5B-D). This 5-vertex shape has four vertices that lieapproximately on a plane. We thus consider this shape as apyramid. A square pyramid encloses the data better thanrandomly permuted dataset with p <10-4 (see Methods).The five vertices of the pyramid suggest five archetypes,
whose coordinates are given in Table 1. The square baseof the pyramid has two vertices at low S (vertices 1 and 2),and two others, which match them for W and D values,but have higher S values (vertices 4 and 5, respectively).The apex of the pyramid has a thin opening with S = 0.3.Projecting the pyramid on the W-D plane, we find that
the apex of the pyramid matches the ‘growth’ archetypedescribed above; the ‘economy’ and ‘hydrodynamic’archetypes each corresponds to the projection of two3D archetypes: the economy archetype corresponds toarchetypes 1 and 4, and the hydrodynamic archetypeto archetypes 2 and 5 (Figure 5).
Economy, hydrodynamic and growth performancefunctions are maximized near three of the pyramid verticesWe repeated the calculation of economy performance(ratio of internal volume to shell thickness) in threedimensions. The 2D contours shown previously (Figure 4A)were evaluated at S = 1. By varying S, we find that the
(A) The RMS error for PCHA optimal polygons and polyhedra is, 5-vertex polyhedron, etc. Error decreases with increasing the number ofy much (for more evidence for the pyramidal shape of the data, seeyramid. Blue points denote FF to DM ammonoids, red are DM to PT ands shown, and the suggested tasks are listed in panel A.
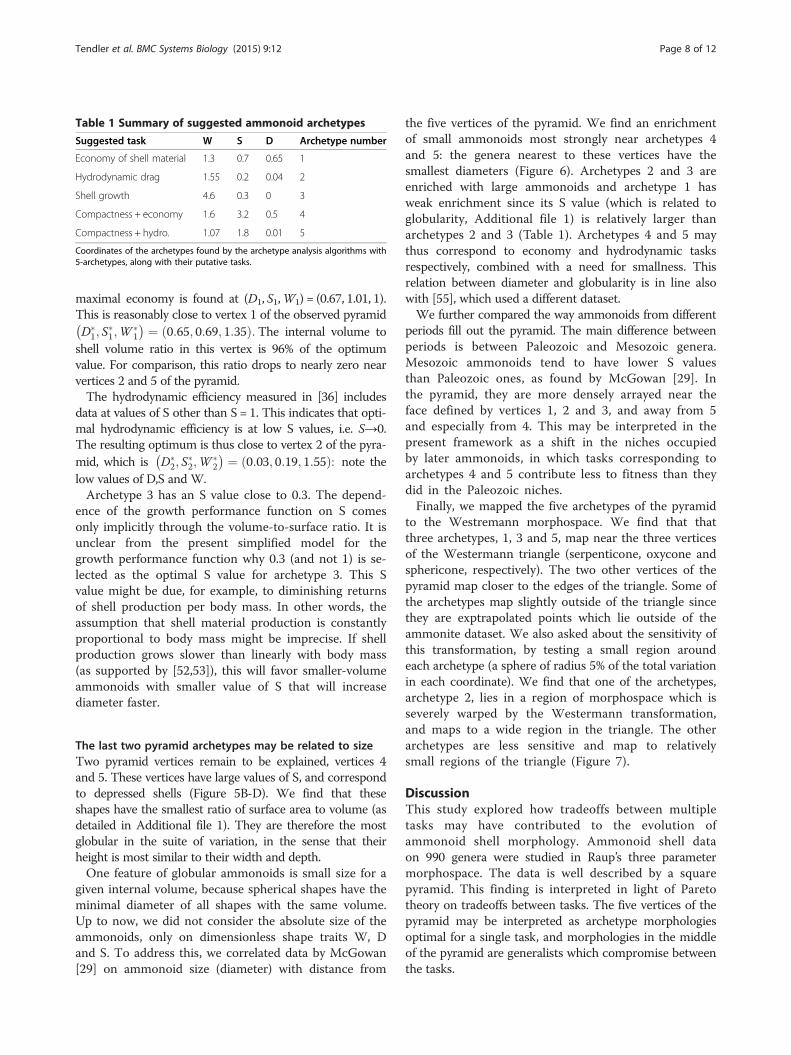
Table 1 Summary of suggested ammonoid archetypes
Suggested task W S D Archetype number
Economy of shell material 1.3 0.7 0.65 1
Hydrodynamic drag 1.55 0.2 0.04 2
Shell growth 4.6 0.3 0 3
Compactness + economy 1.6 3.2 0.5 4
Compactness + hydro. 1.07 1.8 0.01 5
Coordinates of the archetypes found by the archetype analysis algorithms with5-archetypes, along with their putative tasks.
Tendler et al. BMC Systems Biology (2015) 9:12 Page 8 of 12
maximal economy is found at (D1, S1,W1) = (0.67, 1.01, 1).This is reasonably close to vertex 1 of the observed pyramidD�
1; S�1;W
�1
� � ¼ 0:65; 0:69; 1:35ð Þ: The internal volume toshell volume ratio in this vertex is 96% of the optimumvalue. For comparison, this ratio drops to nearly zero nearvertices 2 and 5 of the pyramid.The hydrodynamic efficiency measured in [36] includes
data at values of S other than S = 1. This indicates that opti-mal hydrodynamic efficiency is at low S values, i.e. S→0.The resulting optimum is thus close to vertex 2 of the pyra-mid, which is D�
2; S�2;W
�2
� � ¼ 0:03; 0:19; 1:55ð Þ: note thelow values of D,S and W.Archetype 3 has an S value close to 0.3. The depend-
ence of the growth performance function on S comesonly implicitly through the volume-to-surface ratio. It isunclear from the present simplified model for thegrowth performance function why 0.3 (and not 1) is se-lected as the optimal S value for archetype 3. This Svalue might be due, for example, to diminishing returnsof shell production per body mass. In other words, theassumption that shell material production is constantlyproportional to body mass might be imprecise. If shellproduction grows slower than linearly with body mass(as supported by [52,53]), this will favor smaller-volumeammonoids with smaller value of S that will increasediameter faster.
The last two pyramid archetypes may be related to sizeTwo pyramid vertices remain to be explained, vertices 4and 5. These vertices have large values of S, and correspondto depressed shells (Figure 5B-D). We find that theseshapes have the smallest ratio of surface area to volume (asdetailed in Additional file 1). They are therefore the mostglobular in the suite of variation, in the sense that theirheight is most similar to their width and depth.One feature of globular ammonoids is small size for a
given internal volume, because spherical shapes have theminimal diameter of all shapes with the same volume.Up to now, we did not consider the absolute size of theammonoids, only on dimensionless shape traits W, Dand S. To address this, we correlated data by McGowan[29] on ammonoid size (diameter) with distance from
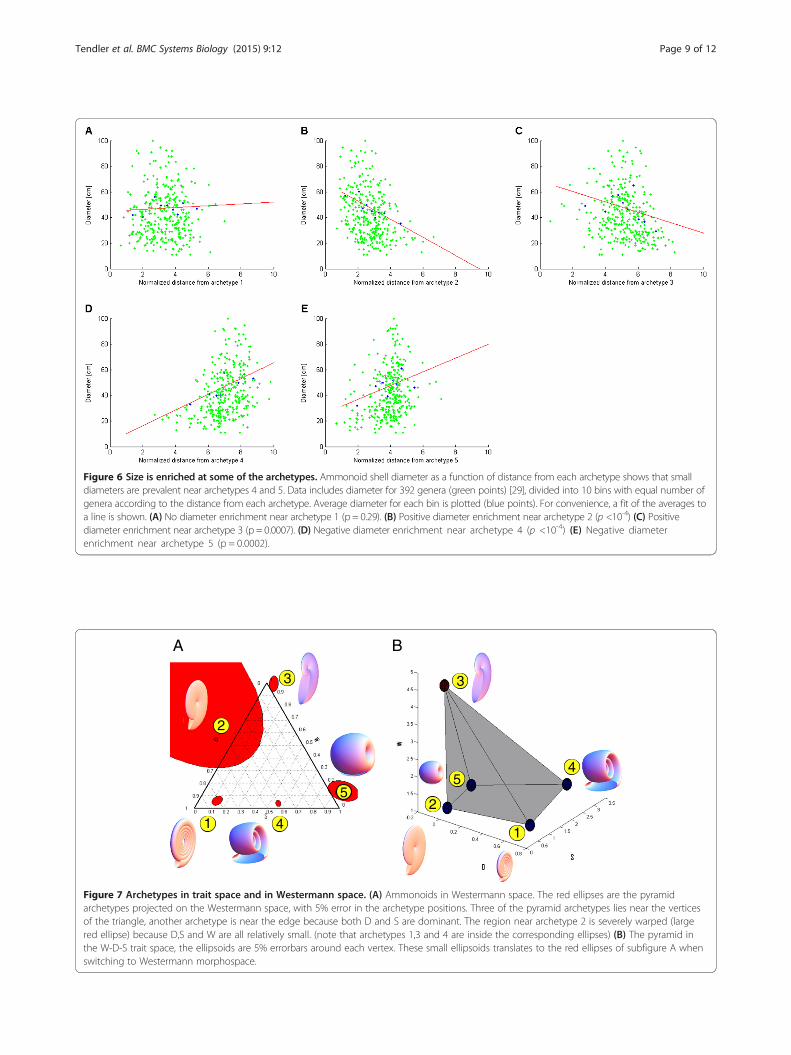
the five vertices of the pyramid. We find an enrichmentof small ammonoids most strongly near archetypes 4and 5: the genera nearest to these vertices have thesmallest diameters (Figure 6). Archetypes 2 and 3 areenriched with large ammonoids and archetype 1 hasweak enrichment since its S value (which is related toglobularity, Additional file 1) is relatively larger thanarchetypes 2 and 3 (Table 1). Archetypes 4 and 5 maythus correspond to economy and hydrodynamic tasksrespectively, combined with a need for smallness. Thisrelation between diameter and globularity is in line alsowith [55], which used a different dataset.We further compared the way ammonoids from different
periods fill out the pyramid. The main difference betweenperiods is between Paleozoic and Mesozoic genera.Mesozoic ammonoids tend to have lower S valuesthan Paleozoic ones, as found by McGowan [29]. Inthe pyramid, they are more densely arrayed near theface defined by vertices 1, 2 and 3, and away from 5and especially from 4. This may be interpreted in thepresent framework as a shift in the niches occupiedby later ammonoids, in which tasks corresponding toarchetypes 4 and 5 contribute less to fitness than theydid in the Paleozoic niches.Finally, we mapped the five archetypes of the pyramid
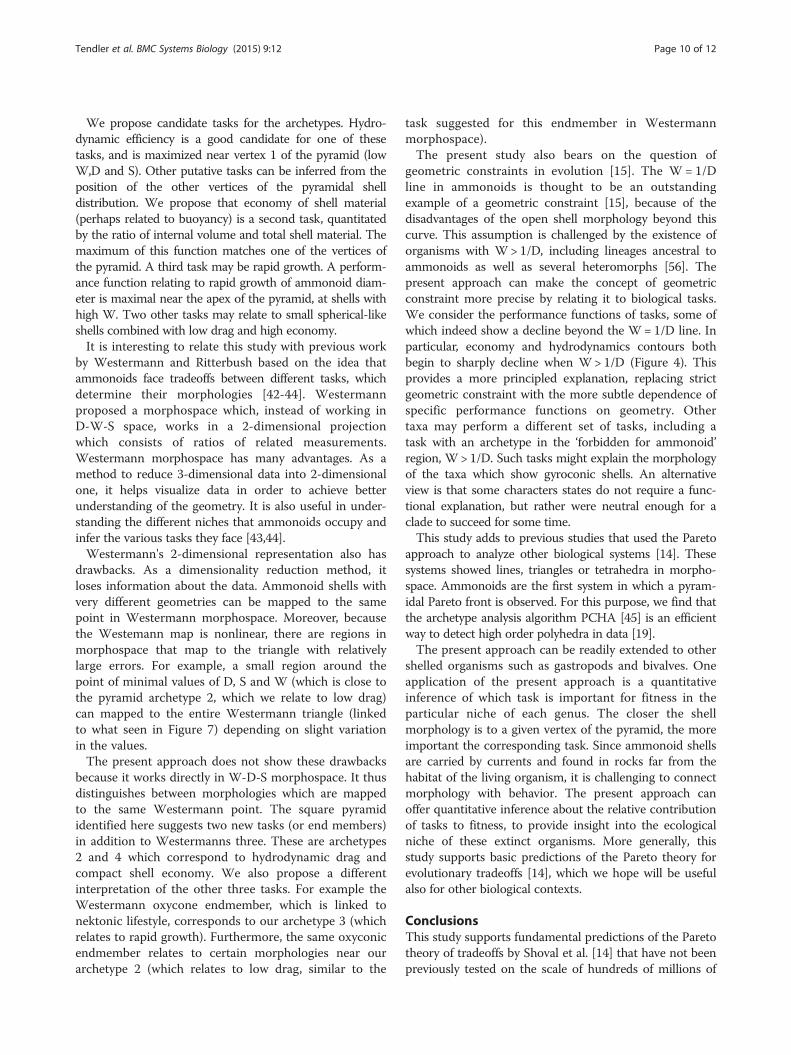
to the Westremann morphospace. We find that thatthree archetypes, 1, 3 and 5, map near the three verticesof the Westermann triangle (serpenticone, oxycone andsphericone, respectively). The two other vertices of thepyramid map closer to the edges of the triangle. Some ofthe archetypes map slightly outside of the triangle sincethey are exptrapolated points which lie outside of theammonite dataset. We also asked about the sensitivity ofthis transformation, by testing a small region aroundeach archetype (a sphere of radius 5% of the total variationin each coordinate). We find that one of the archetypes,archetype 2, lies in a region of morphospace which isseverely warped by the Westermann transformation,and maps to a wide region in the triangle. The otherarchetypes are less sensitive and map to relativelysmall regions of the triangle (Figure 7).
DiscussionThis study explored how tradeoffs between multipletasks may have contributed to the evolution ofammonoid shell morphology. Ammonoid shell dataon 990 genera were studied in Raup’s three parametermorphospace. The data is well described by a squarepyramid. This finding is interpreted in light of Paretotheory on tradeoffs between tasks. The five vertices of thepyramid may be interpreted as archetype morphologiesoptimal for a single task, and morphologies in the middleof the pyramid are generalists which compromise betweenthe tasks.
1
2
3
45
3
2
1 4
5
D
A B
Figure 7 Archetypes in trait space and in Westermann space. (A) Ammonoids in Westermann space. The red ellipses are the pyramidarchetypes projected on the Westermann space, with 5% error in the archetype positions. Three of the pyramid archetypes lies near the verticesof the triangle, another archetype is near the edge because both D and S are dominant. The region near archetype 2 is severely warped (largered ellipse) because D,S and W are all relatively small. (note that archetypes 1,3 and 4 are inside the corresponding ellipses) (B) The pyramid inthe W-D-S trait space, the ellipsoids are 5% errorbars around each vertex. These small ellipsoids translates to the red ellipses of subfigure A whenswitching to Westermann morphospace.
Figure 6 Size is enriched at some of the archetypes. Ammonoid shell diameter as a function of distance from each archetype shows that smalldiameters are prevalent near archetypes 4 and 5. Data includes diameter for 392 genera (green points) [29], divided into 10 bins with equal number ofgenera according to the distance from each archetype. Average diameter for each bin is plotted (blue points). For convenience, a fit of the averages toa line is shown. (A) No diameter enrichment near archetype 1 (p = 0.29). (B) Positive diameter enrichment near archetype 2 (p <10-4) (C) Positivediameter enrichment near archetype 3 (p = 0.0007). (D) Negative diameter enrichment near archetype 4 (p <10-4) (E) Negative diameterenrichment near archetype 5 (p = 0.0002).
Tendler et al. BMC Systems Biology (2015) 9:12 Page 9 of 12
Tendler et al. BMC Systems Biology (2015) 9:12 Page 10 of 12
We propose candidate tasks for the archetypes. Hydro-dynamic efficiency is a good candidate for one of thesetasks, and is maximized near vertex 1 of the pyramid (lowW,D and S). Other putative tasks can be inferred from theposition of the other vertices of the pyramidal shelldistribution. We propose that economy of shell material(perhaps related to buoyancy) is a second task, quantitatedby the ratio of internal volume and total shell material. Themaximum of this function matches one of the vertices ofthe pyramid. A third task may be rapid growth. A perform-ance function relating to rapid growth of ammonoid diam-eter is maximal near the apex of the pyramid, at shells withhigh W. Two other tasks may relate to small spherical-likeshells combined with low drag and high economy.It is interesting to relate this study with previous work
by Westermann and Ritterbush based on the idea thatammonoids face tradeoffs between different tasks, whichdetermine their morphologies [42-44]. Westermannproposed a morphospace which, instead of working inD-W-S space, works in a 2-dimensional projectionwhich consists of ratios of related measurements.Westermann morphospace has many advantages. As amethod to reduce 3-dimensional data into 2-dimensionalone, it helps visualize data in order to achieve betterunderstanding of the geometry. It is also useful in under-standing the different niches that ammonoids occupy andinfer the various tasks they face [43,44].Westermann's 2-dimensional representation also has
drawbacks. As a dimensionality reduction method, itloses information about the data. Ammonoid shells withvery different geometries can be mapped to the samepoint in Westermann morphospace. Moreover, becausethe Westemann map is nonlinear, there are regions inmorphospace that map to the triangle with relativelylarge errors. For example, a small region around thepoint of minimal values of D, S and W (which is close tothe pyramid archetype 2, which we relate to low drag)can mapped to the entire Westermann triangle (linkedto what seen in Figure 7) depending on slight variationin the values.The present approach does not show these drawbacks
because it works directly in W-D-S morphospace. It thusdistinguishes between morphologies which are mappedto the same Westermann point. The square pyramididentified here suggests two new tasks (or end members)in addition to Westermanns three. These are archetypes2 and 4 which correspond to hydrodynamic drag andcompact shell economy. We also propose a differentinterpretation of the other three tasks. For example theWestermann oxycone endmember, which is linked tonektonic lifestyle, corresponds to our archetype 3 (whichrelates to rapid growth). Furthermore, the same oxyconicendmember relates to certain morphologies near ourarchetype 2 (which relates to low drag, similar to the
task suggested for this endmember in Westermannmorphospace).The present study also bears on the question of
geometric constraints in evolution [15]. The W = 1/Dline in ammonoids is thought to be an outstandingexample of a geometric constraint [15], because of thedisadvantages of the open shell morphology beyond thiscurve. This assumption is challenged by the existence oforganisms with W > 1/D, including lineages ancestral toammonoids as well as several heteromorphs [56]. Thepresent approach can make the concept of geometricconstraint more precise by relating it to biological tasks.We consider the performance functions of tasks, some ofwhich indeed show a decline beyond the W= 1/D line. Inparticular, economy and hydrodynamics contours bothbegin to sharply decline when W> 1/D (Figure 4). Thisprovides a more principled explanation, replacing strictgeometric constraint with the more subtle dependence ofspecific performance functions on geometry. Othertaxa may perform a different set of tasks, including atask with an archetype in the ‘forbidden for ammonoid’region, W > 1/D. Such tasks might explain the morphologyof the taxa which show gyroconic shells. An alternativeview is that some characters states do not require a func-tional explanation, but rather were neutral enough for aclade to succeed for some time.This study adds to previous studies that used the Pareto
approach to analyze other biological systems [14]. Thesesystems showed lines, triangles or tetrahedra in morpho-space. Ammonoids are the first system in which a pyram-idal Pareto front is observed. For this purpose, we find thatthe archetype analysis algorithm PCHA [45] is an efficientway to detect high order polyhedra in data [19].The present approach can be readily extended to other
shelled organisms such as gastropods and bivalves. Oneapplication of the present approach is a quantitativeinference of which task is important for fitness in theparticular niche of each genus. The closer the shellmorphology is to a given vertex of the pyramid, the moreimportant the corresponding task. Since ammonoid shellsare carried by currents and found in rocks far from thehabitat of the living organism, it is challenging to connectmorphology with behavior. The present approach canoffer quantitative inference about the relative contributionof tasks to fitness, to provide insight into the ecologicalniche of these extinct organisms. More generally, thisstudy supports basic predictions of the Pareto theory forevolutionary tradeoffs [14], which we hope will be usefulalso for other biological contexts.
ConclusionsThis study supports fundamental predictions of the Paretotheory of tradeoffs by Shoval et al. [14] that have not beenpreviously tested on the scale of hundreds of millions of
Tendler et al. BMC Systems Biology (2015) 9:12 Page 11 of 12
years of evolution. Ammonoid shell data on 990 genera iswell-described by a square pyramid in morphospace. Thefive vertices of the pyramid may be interpreted as archetypemorphologies optimal for a single task. Inferred tasksinclude shell economy, rapid growth, compactness andhydrodynamic efficiency. The vertices of the polygon donot change over the timescale of interest, as predicted inthe case where the tasks stay more-or-less constant becausethey are dictated by biomechanical considerations. More-over, the polygons and polyhedra in the theory are notnecessarily due to phylogenetic history, but rather toconvergent evolution to Pareto-optimal solutions. Thisagrees with the finding that after a mass extinctionwhich removes almost all of the species, survivor spe-cies evolve to re-fill the same polygon as their ancestors.This approach may be used to infer biological tasksfrom data in other biological contexts.
MethodsPolygons, polyhedra and their statistical significanceWe use the archetype analysis method SISAL [41] tocompute the triangles in Figure 3. Since SISAL is onlyable to detect simplexes, we use PCHA [45] to find thethree dimensional square pyramid, which is a polyhedronbut not a simplex (more details in Additional file 1). Toquantitate how well the triangle fits the data, we com-puted the t-value as in [14], the ratio between the area ofthe convex hull of the data and the and the area of the tri-angle found by SISAL. This t-ratio has a value t = 1 for aperfectly polygonal data. The t-ratio of the dataset is com-pared to a randomized dataset with the same number ofgenera, in which the parameters of each genera are ran-domly and independently chosen from their observed dis-tributions. The fraction of times that 10,000 randomizeddataset has a larger t-ratio than the real dataset is the p-value for the data polygonality [19].
Statistical significance of triangle similarityTo compute similarity between two triangles, we computedthe ratio between the area of intersection of the trianglesand the area of their union. The larger this ratio, the moresimilar the triangles. To compute p-value the ratio wascompared to that of 10,000 triangles whose vertices co-ordinate pairs were generated randomly from a uniformdistribution on a rectangle. Note that the ratio isindependent on the rectangle chosen. The p-value isthe fraction of random triangle pairs with higher ratiothan the measured one.
Internal-volume to shell-volume performance functionWe computed the internal to shell volume ratio numeric-ally. Internal volume is computed by integrating along thespiral over the internal area added to the shell. Shell vol-ume is computed by integrating the length of the curve
added (part of a circumference of an ellipse), multiplied bythe constant relative width of the shell from [47]. Notethat, in order to obtain only the ratio of internal to shellvolume, it is enough to compute the integrands them-selves and it is not necessary to integrate over the spiral.More information can be found in Additional file 1.
Growth performance functionThe growth performance function is a simple model thatpenalizes small ammonoids according to the formula:
P ¼Z∞0
1diam tð Þdt
Where diam(t) is the minimal diameter of the ammon-oid at a given time. Assuming that generation of shellmaterial is proportional to body mass, this function isproportional to:
Pe W
Ratio D;Wð Þ log Wð Þ 1þ ffiffiffiffiffiffiW
p� � :Where Ratio(D,W) is the ratio of internal volume to
shell volume as explained above. Details of this compu-tation are in Additional file 1.
Additional file
Additional file 1: Evolutionary tradeoffs, Pareto optimality and themorphology of ammonite shells – Supplementary Information.
AbbreviationsFF: Fransian/Femennian (mass extinction); DM: Devonian/Missisipian(mass extinction); PT: Permian/Triassic (mass extinction); PCHA: PrincipalConvex Hull Analysis (algorithm); SISAL: Simplex Identification via SplitAugmented Lagrangian (algorithm); MYA: Million years ago.
Competing interestsThe authors declare that they have no competing interests.
Authors’ contributionsAT designed research, analyzed data, wrote the paper. AM designedresearch, analyzed data, wrote the paper. UA designed research, analyzeddata, wrote the paper. All authors read and approved the final manuscript.
AcknowledgementsThe authors would like to thank Christian Klug, Alistair McGowan and GeorgeMcGhee for sharing data and for insightful comments, and members of ourlab for their help and useful discussions.
FundingEuropean Research Council under the European Union's Seventh FrameworkProgramme (FP7/2007-2013) /ERC Grant agreement n° 249919 and TheHuman Frontier Science Program.Uri Alon is the incumbent of the Abisch-Frenkel Professorial Chair.
Received: 17 November 2014 Accepted: 29 January 2015
References1. Arnold SJ. Morphology, performance and fitness. Am Zool.
1983;23:347–61.

Tendler et al. BMC Systems Biology (2015) 9:12 Page 12 of 12
2. Farnsworth KD, Niklas KJ. Theories of optimization, form and function inbranching architecture in plants. Funct Ecol. 1995;9:355.
3. Oster GF, Wilson EO. Caste and Ecology in the Social Insects. 1979.[MPB, vol. 12].
4. Alexander RM. Optima for animals. Revised edition. Princeton, N.J:Princeton University Press; 1996.
5. El Samad H, Khammash M, Homescu C, Petzold L. Optimal performance ofthe heat-shock gene regulatory network. ed Zítek P;2005. pp 2206–2206.Available at: http://www.ifac-papersonline.net/Detailed/29488.html[Accessed September 5, 2014].
6. Kennedy MC. Functional–structural models optimize the placement offoliage units for multiple whole-canopy functions. Ecol Res. 2010;25:723–32.
7. Nagrath D, Avila-Elchiver M, Berthiaume F, Tilles AW, Messac A, Yarmush ML.Integrated energy and flux balance based multiobjective framework forlarge-scale metabolic networks. Ann Biomed Eng. 2007;35:863–85.
8. Schuetz R, Zamboni N, Zampieri M, Heinemann M, Sauer U. Multidimensionaloptimality of microbial metabolism. Science. 2012;336:601–4.
9. Sen A. Markets and freedom: achievements and limitations of the marketmechanism in promoting individual freedoms. Oxf Econ Pap. 1993;45:519–41.
10. Steuer RE. Multiple criteria optimization: theory, computation andapplication. New York: John Wiley; 1986.
11. Tomoiagă B, Chindriş M, Sumper A, Sudria-Andreu A, Villafafila-Robles R.Pareto optimal reconfiguration of power distribution systems using agenetic algorithm based on NSGA-II. Energies. 2013;6:1439–55.
12. Lovison A, Pecci F. Hierarchical stratification of Pareto sets. 2014; Availableat: http://arxiv-web3.library.cornell.edu/abs/1407.1755.
13. Smale S. Global Analysis and Economics: Pareto Optimum and aGeneralization of Morse Theory. Synthese. 1975;31:345–58.
14. Shoval O, Sheftel H, Shinar G, Hart Y, Ramote O, Mayo A, et al. EvolutionaryTrade-Offs, Pareto Optimality, and the Geometry of Phenotype Space.Science. 2012;336:1157–60.
15. McGhee GR. The geometry of evolution: adaptive landscapes andtheoretical morphospaces. Cambridge: Cambridge University Press; 2006.
16. Sheftel H, Shoval O, Mayo A, Alon U. The geometry of the Pareto front inbiological phenotype space. Ecol Evol. 2013;3:1471–83.
17. Kavanagh KD, Shoval O, Winslow BB, Alon U, Leary BP, Kan A, et al.Developmental bias in the evolution of phalanges. Proc Natl Acad Sci.2013;110:18190–5.
18. Thøgersen JC, Mørup M, Damkiær S, Molin S, Jelsbak L. Archetypal analysisof diverse Pseudomonas aeruginosa transcriptomes reveals adaptation incystic fibrosis airways. BMC Bioinformatics. 2013;14:279. doi:10.1186/1471-2105-14-279.
19. Hart Y, Sheftel H, Hausser J, Szekely P, Ben-Moshe NB, Korem Y, et al.Inferring biological tasks using Pareto analysis of high-dimensional data. NatMethods 2015;12:233–235.
20. Szekely P, Sheftel H, Mayo A, Alon U. Evolutionary tradeoffs betweeneconomy and effectiveness in biological homeostasis systems. PLoSComput Biol. 2013;9:e1003163.
21. Gallagher T, Bjorness T, Greene R, You Y-J, Avery L. The geometry oflocomotive behavioral states in C. elegans. PLoS ONE. 2013;8:e59865.
22. Saunders W, Work DM, Nikolaevna SV. The evolutionary history of shellgeometry in Paleozoic ammonoids. Paleobiology. 2004;30:19–43.
23. Villier L, Korn D. Morphological disparity of ammonoids and the mark ofPermian mass extinctions. Science. 2004;306:264–6.
24. Korn D. Morphospace occupation of ammonoids over theDevonian-Carboniferous boundary. Paläontol Z. 2000;74:247–57.
25. Raup DM. Geometric analysis of shell coiling; general problems. J Paleontol.1966;40:1178–90.
26. Raup DM. Geometric analysis of shell coiling; coiling in ammonoids.J Paleontol. 1967;41:43–65.
27. Urdy S, Goudemand N, Bucher H, Chirat R. Growth-dependent phenotypicvariation of molluscan shells: implications for allometric data interpretation.J Exp Zoolog B Mol Dev Evol. 2010;314:303–26.
28. Urdy S, Goudemand N, Bucher H, Chirat R. Allometries and themorphogenesis of the molluscan shell: a quantitative and theoretical model.J Exp Zoolog B Mol Dev Evol. 2010;314:280–302.
29. McGowan AJ. The effect of the permo-triassic bottleneck on Triassicammonoid morphological evolution. Paleobiology. 2004;30:369–95.
30. Monnet C, De Baets K, Klug C. Parallel evolution controlled by adaptationand covariation in ammonoid cephalopods. BMC Evol Biol. 2011;11:115.
31. Swan ARH, Saunders WB. Function and shape in late Paleozoic(Mid-Carboniferous) ammonoids. Paleobiology. 1987;13:297–311.
32. Bayer U, Mcghee Jr GR. Iterative evolution of Middle Jurassic ammonitefaunas. Lethaia. 2007;17:1–16.
33. McGhee Jr GR. Shell form in the biconvex articulate Brachiopoda:a geometric analysis. Paleobiology. 1980;6:57–76.
34. McGhee Jr GR: Shell geometry and stability strategies in the biconvexBrachiopoda. Neues Jahrbuch fuer Geologie und PalaeontologieMonatshefte 1980:155–184.
35. Chamberlain Jr JA. Hydromechanical design of fossil cephalopods.House Sr. 1981;18:289–336.
36. Chamberlain Jr JA. Flow patterns and drag coefficients of cephalopod shells.Paleontology. 1976;19:539–63.
37. Donovan D. Evolution of the dibranchiate Cephalopoda. Symposia of theZoological Society of London. 1977;38:15–48.
38. Doyle P, Donovan DT, Nixon M. Phylogeny and systematics of theColeoidea. 1994.
39. Engeser T, Bandel K. Phylogenetic classification of coleoid cephalopods.In: Schweizerbart ’sche Stuttgart In J Wiedinan and J Kullman, eds,Cephalopods-Present and Past. 1988. p. 105–16.
40. Jeletzky JA. Comparative morphology, phylogeny, and classification of fossilcoleoidea. University of Kansas: University of Kansas PaleontologicalInstitute; 1966.
41. Bioucas-Dias J. A Variable Splitting Augmented Lagrangian Approach toLinear Spectral Unmixing (Grenoble, France); 2009. Available at:http://arxiv.org/abs/0904.4635 [Accessed January 12, 2015].
42. Westermann GEG. Ammonoid Life and Habitat. In Ammonoid Paleobiology.Edited by Landman NH, Tanabe K, Davis RA. Springer: US; 1996:607–707.[Topics in Geobiology, vol. 13].
43. Ritterbush KA, Bottjer DJ. Westermann Morphospace displays ammonoidshell shape and hypothetical paleoecology. Paleobiology. 2012;38:424–46.
44. Ritterbush KA, Hoffmann R, Lukeneder A, De Baets K. Pelagic palaeoecology:the importance of recent constraints on ammonoid palaeobiology and lifehistory. J Zool. 2014;292:229–41.
45. Mørup M, Hansen LK. Archetypal analysis for machine learning and datamining. Neurocomputing. 2012;80:54–63.
46. Kröger B. On the efficiency of the buoyancy apparatus in ammonoids:evidences from sublethal shell injuries. Lethaia. 2002;35:61–70.
47. Trueman AE. The ammonite body-chamber, with special reference to thebuoyancy and mode of Life of the living ammonite. Q J Geol Soc.1940;96:339–83.
48. Raup DM, Chamberlain JA. Equations for volume and center of gravity inammonoid shells. J Paleontol. 1967;41:566–74.
49. Moseley H. On the Geometrical Forms of Turbinated and Discoid Shells.Philos Trans R Soc Lond. 1838;128:351–70.
50. Jacobs DK. Shape, Drag, and Power in Ammonoid Swimming. Paleobiology.1992;18:203–20.
51. Landman NH, Tanabe K, Davis RA. Ammonoid Paleobiology. New York:Springer Science & Business Media; 1996.
52. Collins D, Ward PD, Westermann GEG. Function of cameral water in nautilus.Paleobiology. 1980;6:168–72.
53. Bucher H, Landman NH, Klofak SM, Guex J. Mode and Rate of Growth inAmmonoids. In Ammonoid Paleobiology. Edited by Landman NH, Tanabe K,Davis RA. Springer: US; 1996:407–461. [Topics in Geobiology, vol. 13].
54. Trussell GC. Phenotypic clines, plasticity, and morphological trade-offs in anintertidal snail. Evol Int J Org Evol. 2000;54:151–66.
55. Dommergues J-L, Montuire S, Neige P. Size patterns through time: the caseof the Early Jurassic ammonite radiation. Paleobiology. 2002;28:423–34.
56. Korn D, Klug C. Morphological pathways in the evolution of Early andMiddle Devonian ammonoids. Paleobiology. 2003;29:329–48.


![Pareto-Optimality Solution Recommendation Using A … · Pareto-Optimality Solution Recommendation Using ... and the bat algorithm for multi-objective optimisation [20], ... perform](https://img.pdfslide.us/doc/110x75/5aea74df7f8b9ae5318c7671/pareto-optimality-solution-recommendation-using-a-solution-recommendation-using.jpg)