Embed Size (px)
Citation preview
Mon. Not. R. Astron. Soc. 340, 813–831 (2003)
Evolutionary spectral energy distribution diagnostics of starburstgalaxies: signature of bimodality
T. Takagi,1,2,3� N. Arimoto4,5 and H. Hanami61Blackett Laboratory, Imperial College, Prince Consort Road, London SW7 2BZ2The Institute of Space and Astronautical Science, 3-1-1 Yoshinodai, Sagamihara, Kanagawa 229-8510, Japan3Department of Physics, Rikkyo University, 3-34-1 Nishi-Ikebukuro, Toshima-ku, Tokyo 171-8501, Japan4Institute of Astronomy, School of Science, University of Tokyo, 2-21-1 Osawa, Mitaka, Tokyo 181-0015, Japan5National Astronomical Observatory, 2-21-1 Osawa, Mitaka, Tokyo 181-8588, Japan6Physics Section, Faculty of Humanities and Social Sciences, Iwate University, Morioka, 020-8550, Japan
Accepted 2002 December 5. Received 2002 December 5; in original form 2002 January 25
ABSTRACTWe construct an evolutionary spectral energy distribution (SED) model of a starburst region,from the ultraviolet to submillimetre wavelengths. This model allows us to derive the star for-mation rate, optical depth by dust and apparent effective radius of starburst regions at variouswavelengths; as a result, the intrinsic surface brightness of starburst regions can be derived.Using this SED model, we analyse 16 ultraviolet-selected starburst galaxies and 10 ultralumi-nous infrared galaxies. The derived star formation rates and optical depths are compared withemission-line measurements and are found to be consistent. The derived apparent effectiveradii are also consistent with observations. From the SED analysis, we find a bimodal propertyof the star formation rate with the optical depth and the compactness of stellar distributions.While mild starbursts have a limiting intrinsic surface brightness Lbolr−2
e � 1012 L� kpc−2,intense starbursts tend to be more heavily obscured and concentrated within a characteristicscale of r e � 0.3 kpc. We suggest that the mild starbursts can be triggered by a self-gravitatingdisc instability in which feedback is effective in the shallow gravitational potential. On theother hand, the intense starbursts can be induced via an external dynamical perturbation suchas galaxy merging, in which feedback is less effective owing to the deep gravitational potentialattained by the large gas concentration within the central starburst region.
Key words: dust, extinction – galaxies: starburst – infrared: galaxies – submillimetre –ultraviolet: galaxies.
1 I N T RO D U C T I O N
Starbursts are an intensive mode of star formation in galaxies(Storchi-Bergmann, Calzetti & Kinney 1994; Kennicutt 1998).Ultraluminous infrared galaxies (ULIRGs) with L IR � 1012 L�are probably the most active and luminous starburst galaxies. In-deed, recent ISO observations suggest that many ULIRGs arepowered by starbursts with little contribution from active galac-tic nuclei (AGN) (Genzel et al. 1998; Lutz et al. 1998). On theother hand, starburst galaxies of lower activity are H II galax-ies and blue compact dwarf galaxies, known as ultraviolet (UV)-selected starburst galaxies (UVSBGs; Kinney et al. 1993; Calzetti,Kinney & Storchi-Bergmann 1994; Storchi-Bergmann et al. 1994;McQuade, Calzetti & Kinney 1995; Gordon, Calzetti & Witt 1997;Takagi, Arimoto & Vansevicius 1999).
�E-mail: [email protected]
Recently, an upper limit of ‘bolometric surface brightness’ wasgiven by Meurer et al. (1997) for a sample of starburst galaxies ob-served in the rest frame (i) UV, (ii) far infrared (FIR) and Hα and(iii) 21-cm radio continuum emission. This limit seems to be phys-ically associated with an instability in gaseous discs (e.g. Toomre1964; Quirk 1972) as Kennicutt (1989) had already suggested forstar formation in normal disc galaxies. In their study, the effectiveradii are determined from observations at different wavelengths foreach galaxy. However, if a galaxy is optically thick the observed ef-fective radius strongly depends on the degree of extinction, since theobserved light comes out solely from the region in which the opti-cal depth is less than unity. Moreover, many ULIRGs have multiplestarburst regions (e.g. Scoville et al. 2000; Surace & Sanders 2000),while most UVSBGs show only one major central starburst region.These effects suggest that the panchromatic intensity limit on star-bursts proposed by Meurer et al. (1997) may not be appropriate forULIRGs.
C© 2003 RAS
814 T. Takagi, N. Arimoto and H. Hanami
To determine the intensity limit of starbursts with various levelsof activity ranging from UVSBGs to ULIRGs, it is necessary toestimate both star formation rates (SFRs) and effective radii in aunified manner, whatever the degree of extinction. While typical V-band optical depths in UVSBGs are τ V ∼ 0.3–2 (Storchi-Bergmannet al. 1994; Takagi et al. 1999), those in ULIRGs reach τ V ∼ 5–50(Genzel et al. 1998). Such a wide variation in τ V causes a seriousproblem in deriving SFRs, since none of the currently used SFRindicators, such as Hα (or other Balmer lines), UV continuum or FIRluminosities, are commonly applicable for starbursts ranging fromUVSBGs to ULIRGs. The FIR luminosity is not a good measureof bolometric luminosity when starburst regions are optically thin,while Hα luminosity is difficult to use if the mean surface gas densitybecomes larger than 50 M� pc−2, corresponding to τ V ∼ 2, causinga significant extinction at Hα (Kennicutt 1998). What is worse, byusing Brγ and FIR luminosities, Kennicutt (1998) has shown thatthe FIR luminosities give systematically higher SFRs (by a factorof ∼2) than the Brγ s. Sullivan et al. (2000) compared the Hα- andUV-derived SFRs of nearby starbursts to find that starburst galaxiesare typically overluminous in the UV for a given Hα luminosity.The effect is strongest in the less luminous galaxies.
When comparing ULIRGs and UVSBGs, the bolometric surfacebrightness should be derived for each individual starburst region inULIRGs. The wealth of ground-based low-resolution imaging sur-veys have provided little information on the stars in the starburstregion near the confusion limit <1 arcsec. Even the Hubble SpaceTelescope (HST) with its higher resolution <0.1 arcsec fails to godeep enough into the starburst regions, which are obscured by dustat optical wavelengths. The Near-Infrared Camera and MultiObjectSpectrometer (NICMOS) on HST can observe the obscured starburstregions more directly at near-infrared (NIR) wavelengths where theeffects of dust extinction are reduced significantly compared withvisual wavelengths. Scoville et al. (2000) studied the morphologiesof 24 ULIRGs with NICMOS and found that light profiles of nineof them were well fitted by an r 1/4 law, rather than an exponentialprofile. The apparent effective radii of ULIRGs tend to be morecompact than the extent of gas observed with high-resolution imag-ing of the CO emission (Bryant & Scoville 1999). This suggeststhat the distribution of stars is more concentrated than that of dustand gas in the starburst regions. Thus, the dimming of light causedby the surrounding dust can be so large that the real distribution ofstars deviates from the apparent distribution of the light even at thelongest observable wavelength with NICMOS of 2.2 µm.
It is thus crucial to establish a measure of both SFRs and thespatial distribution of stars, which can be applied to starbursts ofany optical depth. Clearly, a new recipe to derive both SFRs and thestellar distributions is required to investigate the physical propertiesof starbursts comprehensively.
In this paper, we will use spectral energy distributions (SEDs)from the far ultraviolet (FUV) to submillimetre (submm) bands toderive SFRs of starburst regions. The SED from the UV to submmcan represent the bolometric luminosity, irrespective of the dustextinction. We construct an ‘evolutionary’ SED model for starburstregions from a simple but realistic point of view. We show thatour SED model can explain a wide variety of SEDs from opticallythin starbursts (UVSBGs) to optically thick ones (ULIRGs). It isimportant to note that our SED model can derive not only the SFR,but also the other starburst properties such as the optical depth.Moreover, we can derive the apparent effective radius of starburstsat various wavelengths for a given geometry, since we properly takeinto account the radiative transfer in a dusty medium. Therefore,the evolutionary stages of starburst galaxies can be investigated in
a unified manner for a whole range of activity, which can then becompared with the observations of the SED and the effective radius,directly. The systematic estimation of the SFRs and the effectiveradius can give an answer to the question: is the panchromatic limitof starburst intensity reported by Meurer et al. (1997) also valid forULIRGs?
This paper is organized as follows. In Section 2, we describe ourevolutionary SED model for starburst galaxies. In Section 3, wesummarize the model properties. In Section 4, we apply our modelto a sample of UVSBGs and ULIRGs in the local Universe anddescribe the resulting properties of nearby starburst galaxies derivedfrom our SED model fitting. Sections 5 and 6 give discussions andconclusions, respectively.
2 E VO L U T I O NA RY S E D M O D E LF O R S TA R BU R S T R E G I O N S
2.1 Star formation and chemical evolution
We consider a model for the chemical enrichment of a starburstregion into which gas is supplied continuously. When a large amountof gas is supplied into the central region of a galaxy, a starburst istriggered. Since the details of the gas-supplying mechanism areyet to be investigated, it would not be outrageous to suppose thatstar formation and chemical evolution in the starburst regions areapproximately described by an infall model of chemical evolution(Arimoto, Yoshii & Takahara 1992). Ubiquitous galactic outflowsfrom the starbursts have been observed with the X-ray emissionfrom the hot gas driving the flow, optical line emission producedby the warm gas and the interstellar absorption lines (e.g. Lehnert& Heckman 1996; Heckman et al. 2000). Heckman et al. (2000)suggested that most of the outflow gas consists of ambient materialthat has been ‘mass-loaded’ into the hot gas. Therefore, we assumethat the amount of gas in the outflow from a starburst region has anegligible impact on the chemical evolution as a whole. This is trueif the mass-loss rate from a starburst region is less than 10 per centof the SFR. Under this simple evolutionary picture, a starburst ischaracterized by the rates of gas infall and star formation.
The time variation of gas mass Mg(t), total stellar mass M∗(t),and gas metallicity Z g(t) are given by the equations
dMg(t)
dt= −ψ(t) + E(t) + ξi (t), (1)
dM∗(t)
dt= ψ(t) − E(t), (2)
d(Zg Mg)
dt= −ψ(t)Zg(t) + EZ (t) + ξi (t)Zi . (3)
where E(t), EZ(t) and Zi are the ejection rates of the gas and themetals from dying stars and the metallicity of the supplied gas,respectively. We set the initial condition as Mg(0) = M∗(0) = 0for all the calculations in this paper. Although some amount of gasand stars unrelated to the starbursts are initially expected in thestarburst region, we assume that the amount of initial gas and starsare negligible in both the chemical and photometric evolution ofthe starburst region. For Zi, the star formation history before thestarburst event is important. We will explicitly note the adoptedvalues of Zi later. We assume Zi to be constant during the starburstevent.
The SFR ψ(t) is given by
ψ(t) = 1
t∗Mg(t), (4)
C© 2003 RAS, MNRAS 340, 813–831
Evolutionary SED diagnostics 815
where t∗ and Mg(t) are the star formation time-scale and the gasmass in the starburst region, respectively. The gas supply rate isgiven by
ξi (t) = MT
tiexp
(− t
ti
), (5)
where MT and t i are the initial gas mass in the reservoir surroundingthe starburst region and the time-scale of gas supply, respectively,(Arimoto et al. 1992). Physically, the time-scales t i and t∗ can beexpressed in terms of the dynamical time, sound-crossing time andcooling time, depending on what triggers the starburst. It is, however,difficult to ascertain the characteristic time-scale of each starburstfrom observations. Thus, hereafter we analyse the simplest case, inwhich a starburst is characterized by only one evolutionary time-scale t0, i.e. we adopt t0 ≡ t i = t∗.
For all cases in this paper, we adopt the Salpeter initial mass func-tion (IMF) with the lower- and upper-mass limit of 0.1 and 60 M�,respectively. Equations (1)–(3) are solved numerically using an evo-lutionary population synthesis code by Kodama & Arimoto (1997).The adopted stellar libraries and evolutionary tracks are the same asthose in the original code. Details of the nucleosynthesis prescrip-tion is given there.
The effect of dust on the SEDs is significant and predominant instarburst regions. In this paper, we adopt a simple model in whichthe dust-to-metal ratio δ0 is constant; i.e. MD(t) = δ0 Z g(t)Mg(t). Asdescribed below (Section 2.3), we use three types of dust model forthe Milky Way (MW), Large and Small Magellanic Clouds (LMC;SMC). The adopted values of δ0 for MW, LMC and SMC are 0.40,0.55, 0.75, respectively (Takagi 2001). Starbursts could be the mostideal case for constant δ(t), since (i) only type II supernovae con-tribute to the supernova rate and (ii) the gas fraction in molecularclouds is large (see Dwek 1998).
2.2 Model geometry of the starburst region
We consider a starburst region in which stars and dust are distributedwithin a radius r t. We introduce a mass–radius relation for the star-burst region;
rt
1 kpc=
(M∗
109 M�
)γ
, (6)
where is a compactness factor that expresses the matter concen-tration; the mean density becomes higher for smaller . Starburstgalaxies are characterized by a large surface brightness, which isroughly constant (Armus, Heckman & Miley 1990; Meurer et al.1995, 1997). In the adopted mass–radius relation, γ = 1
2 givesthe constant surface brightness for constant . Therefore, we adoptγ = 1
2 throughout this paper. The variation in the surface brightnesscan be expressed by the different values of in our model. Notethat not only the surface brightness but also the SED feature is pre-served for different values of M∗ if γ = 1
2 , since the source functionwithin the starburst is conserved. Therefore, multiple systems withthe total stellar mass of M∗, in which each component has the samesurface brightness, have the same SED as that of a unit system witha stellar mass of M∗.
We assume that the stellar density distribution ρ (r ) is given by ageneralized King profile;
ρ(r ) = ρ0
[1 +
(r
rc
)2]−β
, (7)
where ρ0 is the stellar density at the centre of the starburst regionand r c is the core radius of stars. We adopt the stellar density distri-
bution of typical elliptical galaxies; i.e. the concentration parameterc ≡ log (r t/r c) = 2.2, and β = 3
2 (Combes et al. 1995). Recently,Scoville et al. (2000) and James et al. (1999) presented K-band im-ages of starburst galaxies, and demonstrated that luminosity profilesof starbursts are well represented by the r 1/4 profile that is quite sim-ilar to those of elliptical galaxies. However, in order to derive thestellar density distribution in starbursts, it is important to eliminatethe effects of dust extinction, since the effect of radiative transfercan easily alter the luminosity profile from the original one. As wewill show later, this effect is not negligible even in the K band inULIRGs (see Section 3.3). Therefore, the true density distributionof stars in starburst galaxies is difficult to determine directly, andwe therefore adopt the typical density profile of elliptical galaxiesas a first guess. This topic is discussed further in Sections 3.3 and4.4.
Following Takagi et al. (1999), we assume that dust is distributedhomogeneously within a radius r t of the starburst region. It is plau-sible that the dust distributes more diffusely than the stars, as aresult of feedback from supernovae. When the light from centrallyconcentrated stars dominates the SED, i.e. the optically thin case,this geometry results in a similar SED to the case of a shell ge-ometry, which is suggested for UVSBGs by Gordon et al. (1997),Meurer, Heckman & Calzetti (1999) and Witt & Gordon (2000).However, in the optically thick case, such as ULIRGs, the shell ge-ometry results in the spectral cut-off around NIR (see the results byRowan-Robinson & Efstathiou 1993), and therefore the UV–NIRSED of ULIRGs cannot be reproduced with this geometry withoutinvoking the other components, such as underlying stellar popu-lations and/or AGNs. As we show in Section 4.2, our model canessentially reproduce UV–NIR SEDs of ULIRGs only with star-burst stellar populations. These SED fitting results are confirmedwith emission-line measurements and the observed effective radiiin Sections 4.3 and 4.4, respectively. Therefore, we believe that theadopted geometry is suitable for approximating the real geometryof starburst regions with various optical depths.
2.3 Dust model
The dust model is adopted from Takagi (2001) who successfullyreproduced the extinction curves observed in MW, LMC and SMC,as well as the spectrum of Galactic cirrus. The difference among theMW, LMC and SMC extinction curves is attributed to the variationof the ratio of carbonaceous dust [graphite and polycyclic aromatichydrocarbons (PAHs)] to silicate grains.
The extinction curve is given by the cross-section per hydrogen:
σ H0λ = 1
nH
∑k
∫σ e
λ,k(a)dnk
dada, (8)
where nH is the number density of hydrogen, σ eλ,k(a) is the extinction
cross-section of dust particle with dust constituent k and size a. Thesize distribution of each dust constituent dnk/da is taken from Takagi(2001). For a constant dust-to-metal ratio, the extinction curve atstarburst age t is given by
σ Hλ (t) = ZH(t)
ZH0
σ H0λ, (9)
where ZH(t) is the gas metallicity with respect to hydrogen mass(as opposed to the total gas mass) and ZH
0 is the metallicity ofthe interstellar medium (ISM) under the same definition. We adoptZH
0 = 0.024, 0.011, 0.0034 for the MW, LMC and SMC extinc-tion curves, respectively (Lequeux et al. 1979; Pagel 1997). Thetime variation of optical depth τ V (t) is given by nH(t)σ H
λ (t) r t(t).
C© 2003 RAS, MNRAS 340, 813–831
816 T. Takagi, N. Arimoto and H. Hanami
Note that r t(t) is defined by the time-dependent total stellar massM∗(t). According to the adopted mass–radius relation, τ V ∝ nHr t ∝MHr−2
t ∝ f H MTr−2t ∝ f H MT( f star MT)−1 ∝ f H f −1
star, where MH andf H are the total mass of hydrogen and the mass fraction of hydrogen,respectively; therefore, τ V does not depend on the value of MT.
2.4 Intrinsic SED and radiative transfer
We calculate unobscured stellar SEDs using the population syn-thesis code of Kodama & Arimoto (1997), in which the effect ofstellar metallicity is fully taken into account. We solve the equa-tion of radiative transfer by using a computational code developedby Takagi (2001). Isotropic multiple scattering is assumed and theself-absorption of re-emitted energy from dust is fully taken intoaccount. The temperature fluctuation of very small dust particles iscalculated consistently with the radiative transfer.
We assume no gradient of the stellar population along the radiusof the starburst region. Although gas emission is not considered inour model, a modification of the total SED owing to gas emissionis not significant unless a starburst is considerably younger than10 Myr (Leitherer & Heckman 1995; Fioc & Rocca-Volmerange1997). The contribution from gas emission to the continuum light isespecially important in the NIR. As we will show later, no systematicdiscrepancies in the NIR flux are found between model results andobservations. Therefore, we believe that starburst galaxies are oldenough to have a negligible contribution from gas emission to thecontinuum.
3 M O D E L P RO P E RT I E S
3.1 Evolutionary properties
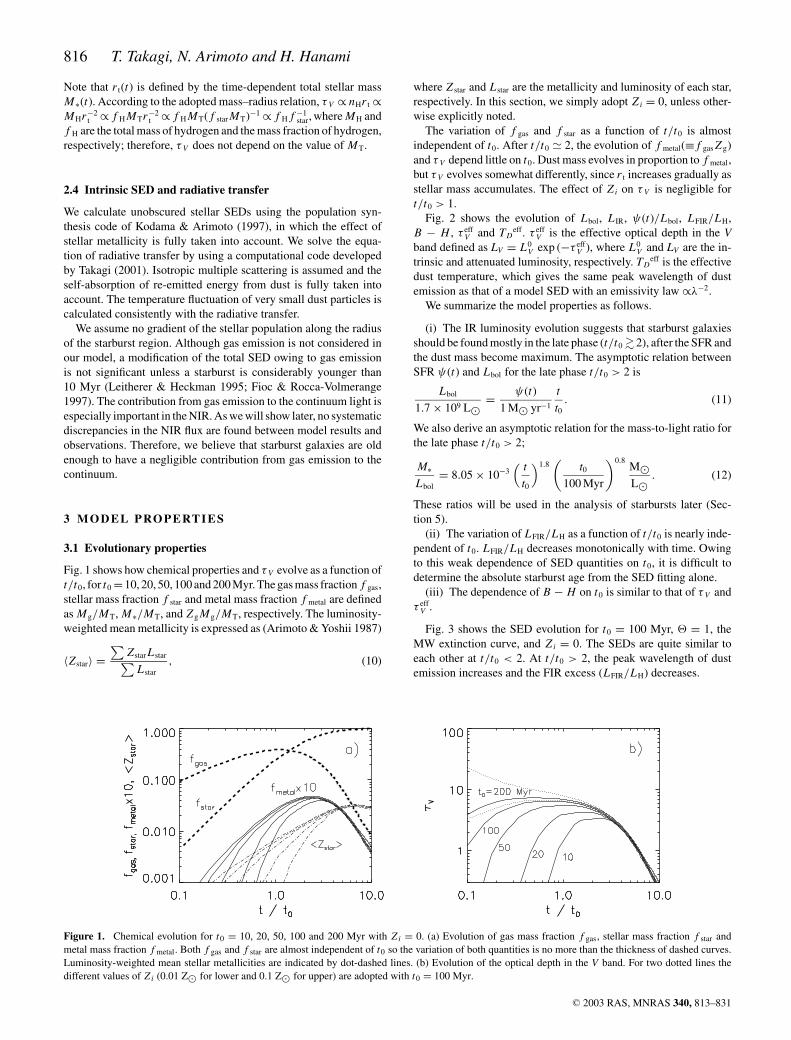
Fig. 1 shows how chemical properties and τ V evolve as a function oft/t0, for t0 =10, 20, 50, 100 and 200 Myr. The gas mass fraction f gas,stellar mass fraction f star and metal mass fraction f metal are definedas Mg/MT, M∗/MT, and Z g Mg/MT, respectively. The luminosity-weighted mean metallicity is expressed as (Arimoto & Yoshii 1987)
〈Zstar〉 =∑
Zstar L star∑L star
, (10)
Figure 1. Chemical evolution for t0 = 10, 20, 50, 100 and 200 Myr with Zi = 0. (a) Evolution of gas mass fraction f gas, stellar mass fraction f star andmetal mass fraction f metal. Both f gas and f star are almost independent of t0 so the variation of both quantities is no more than the thickness of dashed curves.Luminosity-weighted mean stellar metallicities are indicated by dot-dashed lines. (b) Evolution of the optical depth in the V band. For two dotted lines thedifferent values of Zi (0.01 Z� for lower and 0.1 Z� for upper) are adopted with t0 = 100 Myr.
where Z star and L star are the metallicity and luminosity of each star,respectively. In this section, we simply adopt Zi = 0, unless other-wise explicitly noted.
The variation of f gas and f star as a function of t/t0 is almostindependent of t0. After t/t0 � 2, the evolution of f metal(≡ f gas Z g)and τ V depend little on t0. Dust mass evolves in proportion to f metal,but τ V evolves somewhat differently, since r t increases gradually asstellar mass accumulates. The effect of Zi on τ V is negligible fort/t0 > 1.
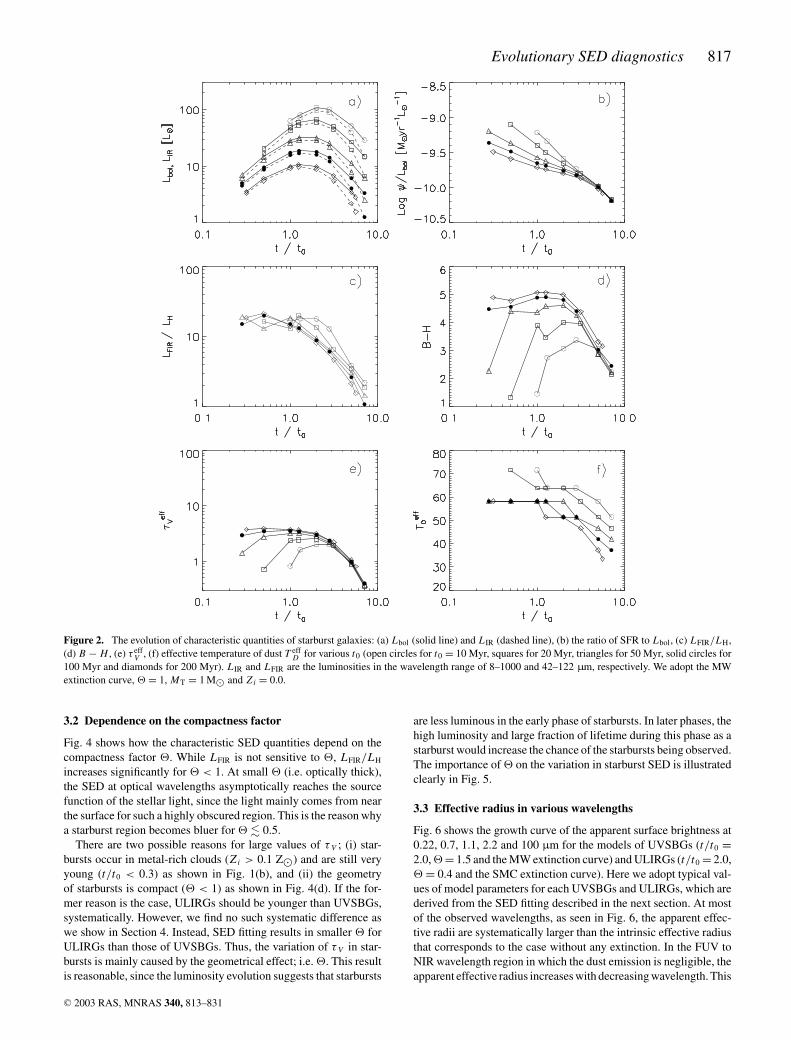
Fig. 2 shows the evolution of Lbol, L IR, ψ(t)/Lbol, LFIR/LH,B − H , τ eff
V and TDeff. τ eff
V is the effective optical depth in the Vband defined as LV = L0
V exp (−τ effV ), where L0
V and LV are the in-trinsic and attenuated luminosity, respectively. TD
eff is the effectivedust temperature, which gives the same peak wavelength of dustemission as that of a model SED with an emissivity law ∝λ−2.
We summarize the model properties as follows.
(i) The IR luminosity evolution suggests that starburst galaxiesshould be found mostly in the late phase (t/t0 � 2), after the SFR andthe dust mass become maximum. The asymptotic relation betweenSFR ψ(t) and Lbol for the late phase t/t0 > 2 is
Lbol
1.7 × 10⁹ L�= ψ(t)
1 M� yr−1
t
t0. (11)
We also derive an asymptotic relation for the mass-to-light ratio forthe late phase t/t0 > 2;
M∗Lbol
= 8.05 × 10⁻³( t
t0
)1.8(
t0
100 Myr
)0.8M�L�
. (12)
These ratios will be used in the analysis of starbursts later (Sec-tion 5).
(ii) The variation of LFIR/LH as a function of t/t0 is nearly inde-pendent of t0. LFIR/LH decreases monotonically with time. Owingto this weak dependence of SED quantities on t0, it is difficult todetermine the absolute starburst age from the SED fitting alone.
(iii) The dependence of B − H on t0 is similar to that of τ V andτ eff
V .
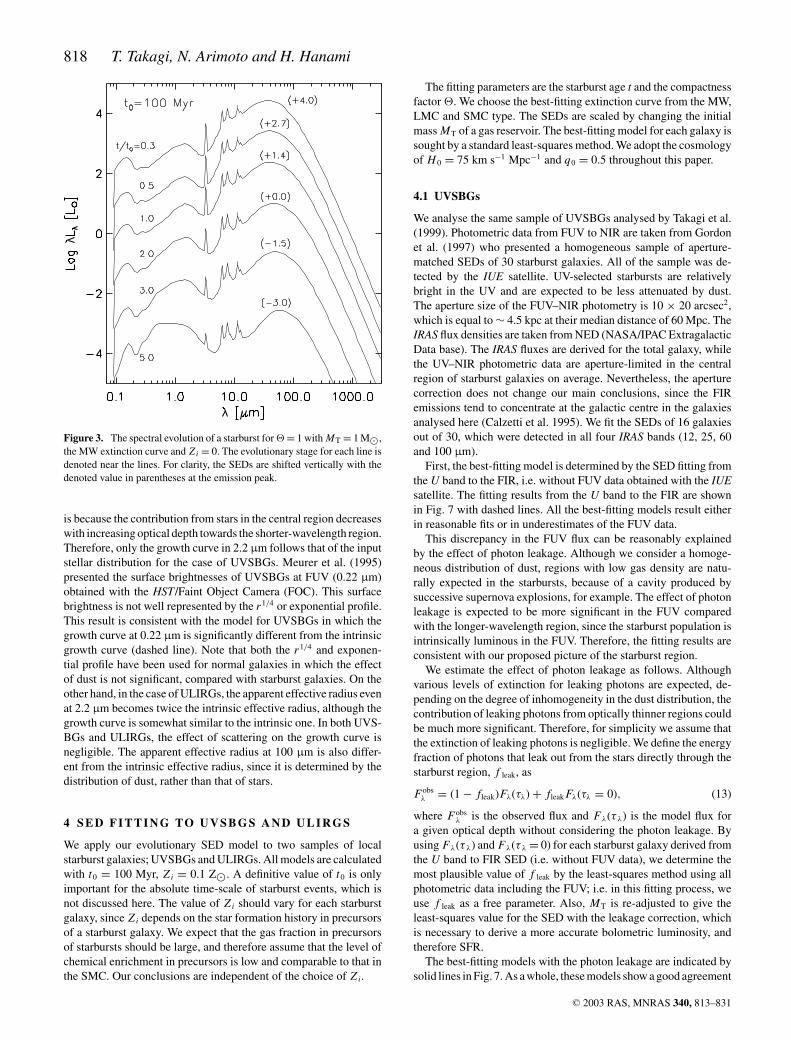
Fig. 3 shows the SED evolution for t0 = 100 Myr, = 1, theMW extinction curve, and Zi = 0. The SEDs are quite similar toeach other at t/t0 < 2. At t/t0 > 2, the peak wavelength of dustemission increases and the FIR excess (LFIR/LH) decreases.
C© 2003 RAS, MNRAS 340, 813–831
Evolutionary SED diagnostics 817
Figure 2. The evolution of characteristic quantities of starburst galaxies: (a) Lbol (solid line) and L IR (dashed line), (b) the ratio of SFR to Lbol, (c) LFIR/LH,(d) B − H , (e) τ eff
V , (f) effective temperature of dust T effD for various t0 (open circles for t0 = 10 Myr, squares for 20 Myr, triangles for 50 Myr, solid circles for
100 Myr and diamonds for 200 Myr). L IR and LFIR are the luminosities in the wavelength range of 8–1000 and 42–122 µm, respectively. We adopt the MWextinction curve, = 1, MT = 1 M� and Zi = 0.0.
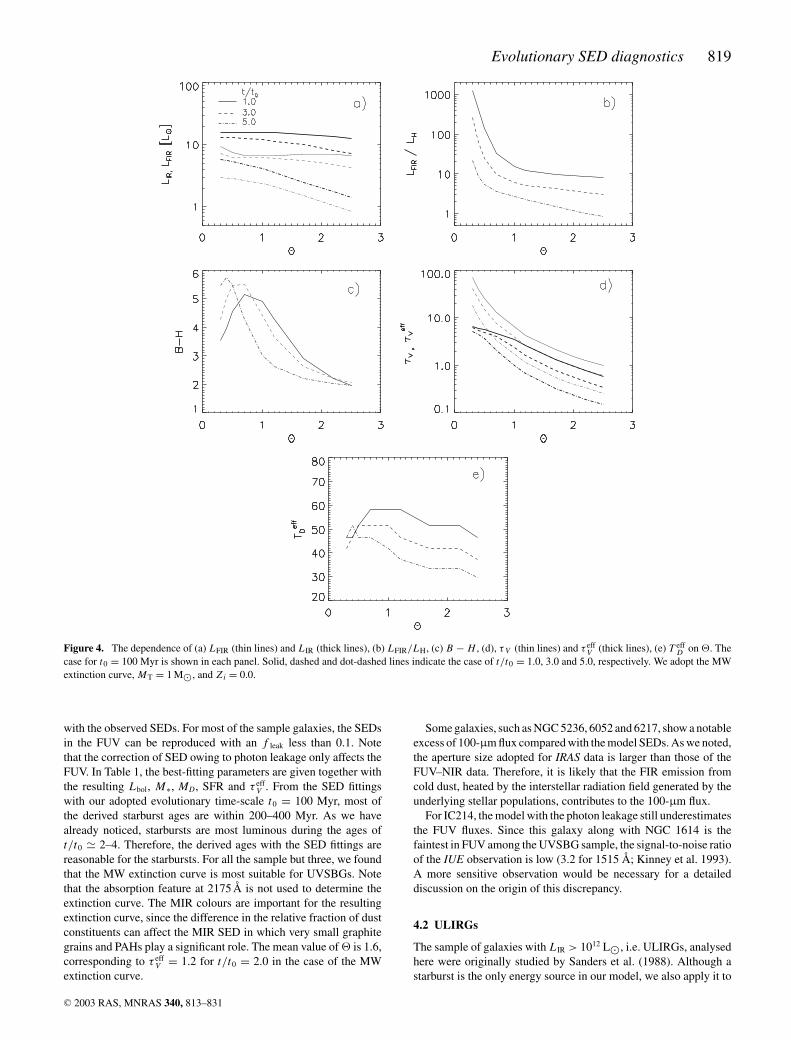
3.2 Dependence on the compactness factor
Fig. 4 shows how the characteristic SED quantities depend on thecompactness factor . While LFIR is not sensitive to , LFIR/LH
increases significantly for < 1. At small (i.e. optically thick),the SED at optical wavelengths asymptotically reaches the sourcefunction of the stellar light, since the light mainly comes from nearthe surface for such a highly obscured region. This is the reason whya starburst region becomes bluer for � 0.5.
There are two possible reasons for large values of τ V ; (i) star-bursts occur in metal-rich clouds (Zi > 0.1 Z�) and are still veryyoung (t/t0 < 0.3) as shown in Fig. 1(b), and (ii) the geometryof starbursts is compact ( < 1) as shown in Fig. 4(d). If the for-mer reason is the case, ULIRGs should be younger than UVSBGs,systematically. However, we find no such systematic difference aswe show in Section 4. Instead, SED fitting results in smaller forULIRGs than those of UVSBGs. Thus, the variation of τ V in star-bursts is mainly caused by the geometrical effect; i.e. . This resultis reasonable, since the luminosity evolution suggests that starbursts
are less luminous in the early phase of starbursts. In later phases, thehigh luminosity and large fraction of lifetime during this phase as astarburst would increase the chance of the starbursts being observed.The importance of on the variation in starburst SED is illustratedclearly in Fig. 5.
3.3 Effective radius in various wavelengths
Fig. 6 shows the growth curve of the apparent surface brightness at0.22, 0.7, 1.1, 2.2 and 100 µm for the models of UVSBGs (t/t0 =2.0, = 1.5 and the MW extinction curve) and ULIRGs (t/t0 = 2.0, = 0.4 and the SMC extinction curve). Here we adopt typical val-ues of model parameters for each UVSBGs and ULIRGs, which arederived from the SED fitting described in the next section. At mostof the observed wavelengths, as seen in Fig. 6, the apparent effec-tive radii are systematically larger than the intrinsic effective radiusthat corresponds to the case without any extinction. In the FUV toNIR wavelength region in which the dust emission is negligible, theapparent effective radius increases with decreasing wavelength. This
C© 2003 RAS, MNRAS 340, 813–831
818 T. Takagi, N. Arimoto and H. Hanami
Figure 3. The spectral evolution of a starburst for = 1 with MT = 1 M�,the MW extinction curve and Zi = 0. The evolutionary stage for each line isdenoted near the lines. For clarity, the SEDs are shifted vertically with thedenoted value in parentheses at the emission peak.
is because the contribution from stars in the central region decreaseswith increasing optical depth towards the shorter-wavelength region.Therefore, only the growth curve in 2.2 µm follows that of the inputstellar distribution for the case of UVSBGs. Meurer et al. (1995)presented the surface brightnesses of UVSBGs at FUV (0.22 µm)obtained with the HST/Faint Object Camera (FOC). This surfacebrightness is not well represented by the r 1/4 or exponential profile.This result is consistent with the model for UVSBGs in which thegrowth curve at 0.22 µm is significantly different from the intrinsicgrowth curve (dashed line). Note that both the r 1/4 and exponen-tial profile have been used for normal galaxies in which the effectof dust is not significant, compared with starburst galaxies. On theother hand, in the case of ULIRGs, the apparent effective radius evenat 2.2 µm becomes twice the intrinsic effective radius, although thegrowth curve is somewhat similar to the intrinsic one. In both UVS-BGs and ULIRGs, the effect of scattering on the growth curve isnegligible. The apparent effective radius at 100 µm is also differ-ent from the intrinsic effective radius, since it is determined by thedistribution of dust, rather than that of stars.
4 S E D F I T T I N G TO U V S B G S A N D U L I R G S
We apply our evolutionary SED model to two samples of localstarburst galaxies; UVSBGs and ULIRGs. All models are calculatedwith t0 = 100 Myr, Zi = 0.1 Z�. A definitive value of t0 is onlyimportant for the absolute time-scale of starburst events, which isnot discussed here. The value of Zi should vary for each starburstgalaxy, since Zi depends on the star formation history in precursorsof a starburst galaxy. We expect that the gas fraction in precursorsof starbursts should be large, and therefore assume that the level ofchemical enrichment in precursors is low and comparable to that inthe SMC. Our conclusions are independent of the choice of Zi.
The fitting parameters are the starburst age t and the compactnessfactor . We choose the best-fitting extinction curve from the MW,LMC and SMC type. The SEDs are scaled by changing the initialmass MT of a gas reservoir. The best-fitting model for each galaxy issought by a standard least-squares method. We adopt the cosmologyof H 0 = 75 km s−1 Mpc−1 and q0 = 0.5 throughout this paper.
4.1 UVSBGs
We analyse the same sample of UVSBGs analysed by Takagi et al.(1999). Photometric data from FUV to NIR are taken from Gordonet al. (1997) who presented a homogeneous sample of aperture-matched SEDs of 30 starburst galaxies. All of the sample was de-tected by the IUE satellite. UV-selected starbursts are relativelybright in the UV and are expected to be less attenuated by dust.The aperture size of the FUV–NIR photometry is 10 × 20 arcsec2,which is equal to ∼ 4.5 kpc at their median distance of 60 Mpc. TheIRAS flux densities are taken from NED (NASA/IPAC ExtragalacticData base). The IRAS fluxes are derived for the total galaxy, whilethe UV–NIR photometric data are aperture-limited in the centralregion of starburst galaxies on average. Nevertheless, the aperturecorrection does not change our main conclusions, since the FIRemissions tend to concentrate at the galactic centre in the galaxiesanalysed here (Calzetti et al. 1995). We fit the SEDs of 16 galaxiesout of 30, which were detected in all four IRAS bands (12, 25, 60and 100 µm).
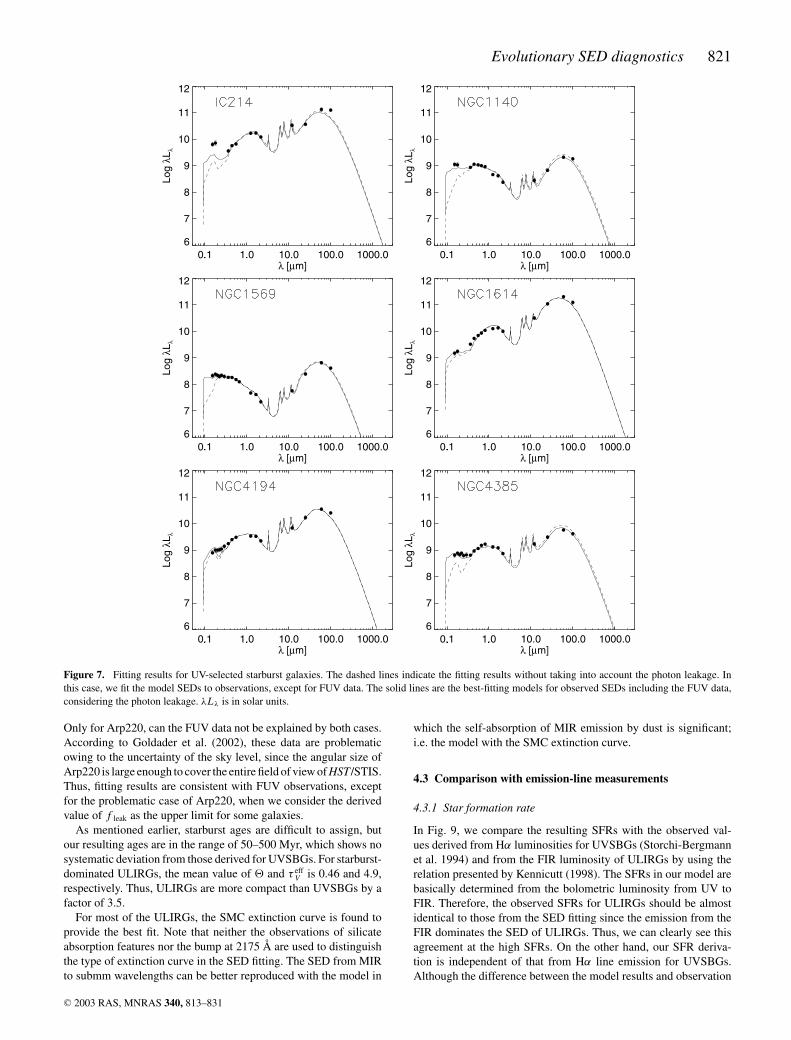
First, the best-fitting model is determined by the SED fitting fromthe U band to the FIR, i.e. without FUV data obtained with the IUEsatellite. The fitting results from the U band to the FIR are shownin Fig. 7 with dashed lines. All the best-fitting models result eitherin reasonable fits or in underestimates of the FUV data.
This discrepancy in the FUV flux can be reasonably explainedby the effect of photon leakage. Although we consider a homoge-neous distribution of dust, regions with low gas density are natu-rally expected in the starbursts, because of a cavity produced bysuccessive supernova explosions, for example. The effect of photonleakage is expected to be more significant in the FUV comparedwith the longer-wavelength region, since the starburst population isintrinsically luminous in the FUV. Therefore, the fitting results areconsistent with our proposed picture of the starburst region.
We estimate the effect of photon leakage as follows. Althoughvarious levels of extinction for leaking photons are expected, de-pending on the degree of inhomogeneity in the dust distribution, thecontribution of leaking photons from optically thinner regions couldbe much more significant. Therefore, for simplicity we assume thatthe extinction of leaking photons is negligible. We define the energyfraction of photons that leak out from the stars directly through thestarburst region, f leak, as
Fobsλ = (1 − fleak)Fλ(τλ) + fleak Fλ(τλ = 0), (13)
where Fobsλ is the observed flux and Fλ(τ λ) is the model flux for
a given optical depth without considering the photon leakage. Byusing Fλ(τ λ) and Fλ(τ λ = 0) for each starburst galaxy derived fromthe U band to FIR SED (i.e. without FUV data), we determine themost plausible value of f leak by the least-squares method using allphotometric data including the FUV; i.e. in this fitting process, weuse f leak as a free parameter. Also, MT is re-adjusted to give theleast-squares value for the SED with the leakage correction, whichis necessary to derive a more accurate bolometric luminosity, andtherefore SFR.
The best-fitting models with the photon leakage are indicated bysolid lines in Fig. 7. As a whole, these models show a good agreement
C© 2003 RAS, MNRAS 340, 813–831
Evolutionary SED diagnostics 819
Figure 4. The dependence of (a) LFIR (thin lines) and L IR (thick lines), (b) LFIR/LH, (c) B − H , (d), τ V (thin lines) and τ effV (thick lines), (e) T eff
D on . Thecase for t0 = 100 Myr is shown in each panel. Solid, dashed and dot-dashed lines indicate the case of t/t0 = 1.0, 3.0 and 5.0, respectively. We adopt the MWextinction curve, MT = 1 M�, and Zi = 0.0.
with the observed SEDs. For most of the sample galaxies, the SEDsin the FUV can be reproduced with an f leak less than 0.1. Notethat the correction of SED owing to photon leakage only affects theFUV. In Table 1, the best-fitting parameters are given together withthe resulting Lbol, M∗, MD, SFR and τ eff
V . From the SED fittingswith our adopted evolutionary time-scale t0 = 100 Myr, most ofthe derived starburst ages are within 200–400 Myr. As we havealready noticed, starbursts are most luminous during the ages oft/t0 � 2–4. Therefore, the derived ages with the SED fittings arereasonable for the starbursts. For all the sample but three, we foundthat the MW extinction curve is most suitable for UVSBGs. Notethat the absorption feature at 2175 A is not used to determine theextinction curve. The MIR colours are important for the resultingextinction curve, since the difference in the relative fraction of dustconstituents can affect the MIR SED in which very small graphitegrains and PAHs play a significant role. The mean value of is 1.6,corresponding to τ eff
V = 1.2 for t/t0 = 2.0 in the case of the MWextinction curve.
Some galaxies, such as NGC 5236, 6052 and 6217, show a notableexcess of 100-µm flux compared with the model SEDs. As we noted,the aperture size adopted for IRAS data is larger than those of theFUV–NIR data. Therefore, it is likely that the FIR emission fromcold dust, heated by the interstellar radiation field generated by theunderlying stellar populations, contributes to the 100-µm flux.
For IC214, the model with the photon leakage still underestimatesthe FUV fluxes. Since this galaxy along with NGC 1614 is thefaintest in FUV among the UVSBG sample, the signal-to-noise ratioof the IUE observation is low (3.2 for 1515 A; Kinney et al. 1993).A more sensitive observation would be necessary for a detaileddiscussion on the origin of this discrepancy.
4.2 ULIRGs
The sample of galaxies with L IR > 1012 L�, i.e. ULIRGs, analysedhere were originally studied by Sanders et al. (1988). Although astarburst is the only energy source in our model, we also apply it to
C© 2003 RAS, MNRAS 340, 813–831
820 T. Takagi, N. Arimoto and H. Hanami
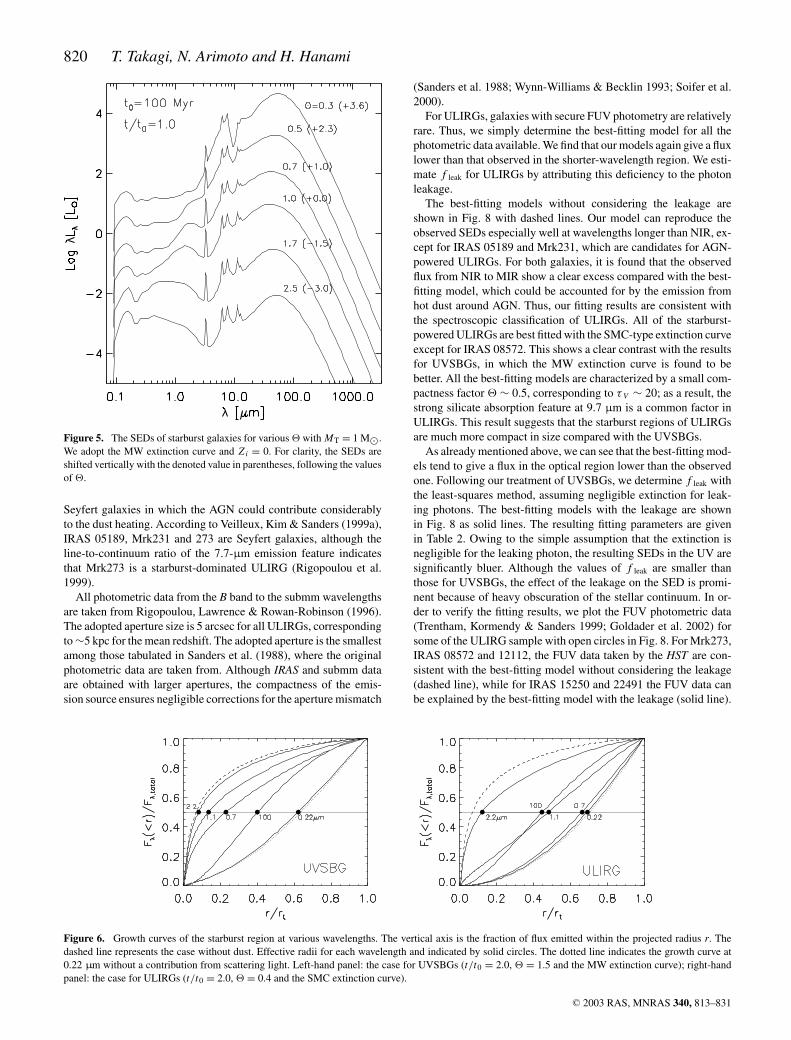
Figure 5. The SEDs of starburst galaxies for various with MT = 1 M�.We adopt the MW extinction curve and Zi = 0. For clarity, the SEDs areshifted vertically with the denoted value in parentheses, following the valuesof .
Seyfert galaxies in which the AGN could contribute considerablyto the dust heating. According to Veilleux, Kim & Sanders (1999a),IRAS 05189, Mrk231 and 273 are Seyfert galaxies, although theline-to-continuum ratio of the 7.7-µm emission feature indicatesthat Mrk273 is a starburst-dominated ULIRG (Rigopoulou et al.1999).
All photometric data from the B band to the submm wavelengthsare taken from Rigopoulou, Lawrence & Rowan-Robinson (1996).The adopted aperture size is 5 arcsec for all ULIRGs, correspondingto ∼5 kpc for the mean redshift. The adopted aperture is the smallestamong those tabulated in Sanders et al. (1988), where the originalphotometric data are taken from. Although IRAS and submm dataare obtained with larger apertures, the compactness of the emis-sion source ensures negligible corrections for the aperture mismatch
Figure 6. Growth curves of the starburst region at various wavelengths. The vertical axis is the fraction of flux emitted within the projected radius r. Thedashed line represents the case without dust. Effective radii for each wavelength and indicated by solid circles. The dotted line indicates the growth curve at0.22 µm without a contribution from scattering light. Left-hand panel: the case for UVSBGs (t/t0 = 2.0, = 1.5 and the MW extinction curve); right-handpanel: the case for ULIRGs (t/t0 = 2.0, = 0.4 and the SMC extinction curve).
(Sanders et al. 1988; Wynn-Williams & Becklin 1993; Soifer et al.2000).
For ULIRGs, galaxies with secure FUV photometry are relativelyrare. Thus, we simply determine the best-fitting model for all thephotometric data available. We find that our models again give a fluxlower than that observed in the shorter-wavelength region. We esti-mate f leak for ULIRGs by attributing this deficiency to the photonleakage.
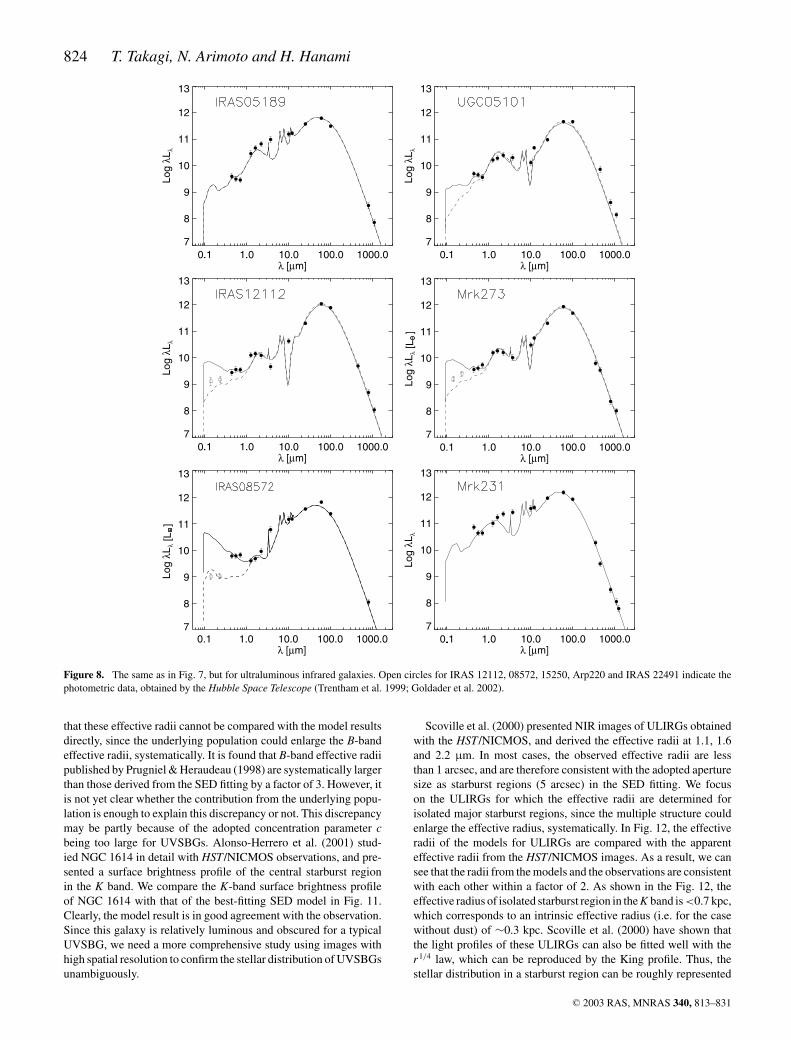
The best-fitting models without considering the leakage areshown in Fig. 8 with dashed lines. Our model can reproduce theobserved SEDs especially well at wavelengths longer than NIR, ex-cept for IRAS 05189 and Mrk231, which are candidates for AGN-powered ULIRGs. For both galaxies, it is found that the observedflux from NIR to MIR show a clear excess compared with the best-fitting model, which could be accounted for by the emission fromhot dust around AGN. Thus, our fitting results are consistent withthe spectroscopic classification of ULIRGs. All of the starburst-powered ULIRGs are best fitted with the SMC-type extinction curveexcept for IRAS 08572. This shows a clear contrast with the resultsfor UVSBGs, in which the MW extinction curve is found to bebetter. All the best-fitting models are characterized by a small com-pactness factor ∼ 0.5, corresponding to τ V ∼ 20; as a result, thestrong silicate absorption feature at 9.7 µm is a common factor inULIRGs. This result suggests that the starburst regions of ULIRGsare much more compact in size compared with the UVSBGs.
As already mentioned above, we can see that the best-fitting mod-els tend to give a flux in the optical region lower than the observedone. Following our treatment of UVSBGs, we determine f leak withthe least-squares method, assuming negligible extinction for leak-ing photons. The best-fitting models with the leakage are shownin Fig. 8 as solid lines. The resulting fitting parameters are givenin Table 2. Owing to the simple assumption that the extinction isnegligible for the leaking photon, the resulting SEDs in the UV aresignificantly bluer. Although the values of f leak are smaller thanthose for UVSBGs, the effect of the leakage on the SED is promi-nent because of heavy obscuration of the stellar continuum. In or-der to verify the fitting results, we plot the FUV photometric data(Trentham, Kormendy & Sanders 1999; Goldader et al. 2002) forsome of the ULIRG sample with open circles in Fig. 8. For Mrk273,IRAS 08572 and 12112, the FUV data taken by the HST are con-sistent with the best-fitting model without considering the leakage(dashed line), while for IRAS 15250 and 22491 the FUV data canbe explained by the best-fitting model with the leakage (solid line).
C© 2003 RAS, MNRAS 340, 813–831
Evolutionary SED diagnostics 821
0.1 1.0 10.0 100.0 1000.0λ [µm]
6
7
8
9
10
11
12
Log
λLλ
0.1 1.0 10.0 100.0 1000.0λ [µm]
6
7
8
9
10
11
12
Log
λLλ
0.1 1.0 10.0 100.0 1000.0λ [µm]
6
7
8
9
10
11
12
Log
λLλ
0.1 1.0 10.0 100.0 1000.0λ [µm]
6
7
8
9
10
11
12
Log
λLλ
0.1 1.0 10.0 100.0 1000.0λ [µm]
6
7
8
9
10
11
12
Log
λLλ
0.1 1.0 10.0 100.0 1000.0λ [µm]
6
7
8
9
10
11
12
Log
λLλ
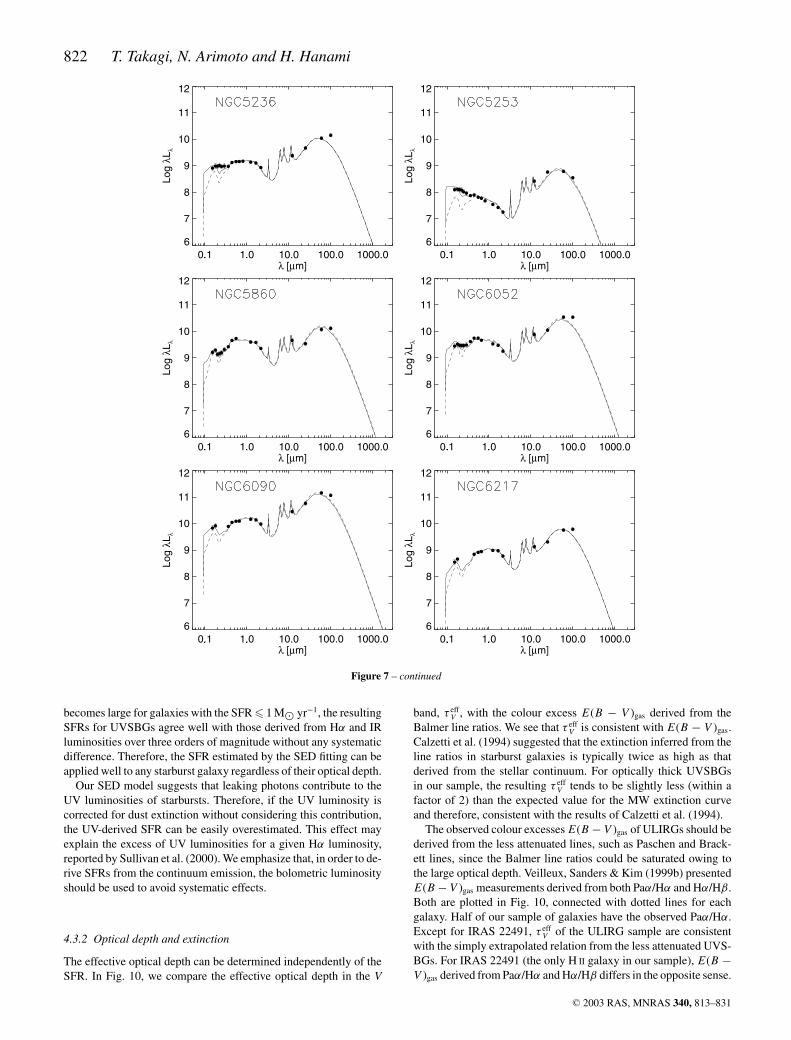
Figure 7. Fitting results for UV-selected starburst galaxies. The dashed lines indicate the fitting results without taking into account the photon leakage. Inthis case, we fit the model SEDs to observations, except for FUV data. The solid lines are the best-fitting models for observed SEDs including the FUV data,considering the photon leakage. λLλ is in solar units.
Only for Arp220, can the FUV data not be explained by both cases.According to Goldader et al. (2002), these data are problematicowing to the uncertainty of the sky level, since the angular size ofArp220 is large enough to cover the entire field of view of HST/STIS.Thus, fitting results are consistent with FUV observations, exceptfor the problematic case of Arp220, when we consider the derivedvalue of f leak as the upper limit for some galaxies.
As mentioned earlier, starburst ages are difficult to assign, butour resulting ages are in the range of 50–500 Myr, which shows nosystematic deviation from those derived for UVSBGs. For starburst-dominated ULIRGs, the mean value of and τ eff
V is 0.46 and 4.9,respectively. Thus, ULIRGs are more compact than UVSBGs by afactor of 3.5.
For most of the ULIRGs, the SMC extinction curve is found toprovide the best fit. Note that neither the observations of silicateabsorption features nor the bump at 2175 A are used to distinguishthe type of extinction curve in the SED fitting. The SED from MIRto submm wavelengths can be better reproduced with the model in
which the self-absorption of MIR emission by dust is significant;i.e. the model with the SMC extinction curve.
4.3 Comparison with emission-line measurements
4.3.1 Star formation rate
In Fig. 9, we compare the resulting SFRs with the observed val-ues derived from Hα luminosities for UVSBGs (Storchi-Bergmannet al. 1994) and from the FIR luminosity of ULIRGs by using therelation presented by Kennicutt (1998). The SFRs in our model arebasically determined from the bolometric luminosity from UV toFIR. Therefore, the observed SFRs for ULIRGs should be almostidentical to those from the SED fitting since the emission from theFIR dominates the SED of ULIRGs. Thus, we can clearly see thisagreement at the high SFRs. On the other hand, our SFR deriva-tion is independent of that from Hα line emission for UVSBGs.Although the difference between the model results and observation
C© 2003 RAS, MNRAS 340, 813–831
822 T. Takagi, N. Arimoto and H. Hanami
0.1 1.0 10.0 100.0 1000.0λ [µm]
6
7
8
9
10
11
12
Log
λLλ
0.1 1.0 10.0 100.0 1000.0λ [µm]
6
7
8
9
10
11
12
Log
λLλ
0.1 1.0 10.0 100.0 1000.0λ [µm]
6
7
8
9
10
11
12
Log
λLλ
0.1 1.0 10.0 100.0 1000.0λ [µm]
6
7
8
9
10
11
12
Log
λLλ
0.1 1.0 10.0 100.0 1000.0λ [µm]
6
7
8
9
10
11
12
Log
λLλ
0.1 1.0 10.0 100.0 1000.0λ [µm]
6
7
8
9
10
11
12
Log
λLλ
Figure 7 – continued
becomes large for galaxies with the SFR � 1 M� yr−1, the resultingSFRs for UVSBGs agree well with those derived from Hα and IRluminosities over three orders of magnitude without any systematicdifference. Therefore, the SFR estimated by the SED fitting can beapplied well to any starburst galaxy regardless of their optical depth.
Our SED model suggests that leaking photons contribute to theUV luminosities of starbursts. Therefore, if the UV luminosity iscorrected for dust extinction without considering this contribution,the UV-derived SFR can be easily overestimated. This effect mayexplain the excess of UV luminosities for a given Hα luminosity,reported by Sullivan et al. (2000). We emphasize that, in order to de-rive SFRs from the continuum emission, the bolometric luminosityshould be used to avoid systematic effects.
4.3.2 Optical depth and extinction
The effective optical depth can be determined independently of theSFR. In Fig. 10, we compare the effective optical depth in the V
band, τ effV , with the colour excess E(B − V )gas derived from the
Balmer line ratios. We see that τ effV is consistent with E(B − V )gas.
Calzetti et al. (1994) suggested that the extinction inferred from theline ratios in starburst galaxies is typically twice as high as thatderived from the stellar continuum. For optically thick UVSBGsin our sample, the resulting τ eff
V tends to be slightly less (within afactor of 2) than the expected value for the MW extinction curveand therefore, consistent with the results of Calzetti et al. (1994).
The observed colour excesses E(B − V )gas of ULIRGs should bederived from the less attenuated lines, such as Paschen and Brack-ett lines, since the Balmer line ratios could be saturated owing tothe large optical depth. Veilleux, Sanders & Kim (1999b) presentedE(B − V )gas measurements derived from both Paα/Hα and Hα/Hβ.Both are plotted in Fig. 10, connected with dotted lines for eachgalaxy. Half of our sample of galaxies have the observed Paα/Hα.Except for IRAS 22491, τ eff
V of the ULIRG sample are consistentwith the simply extrapolated relation from the less attenuated UVS-BGs. For IRAS 22491 (the only H II galaxy in our sample), E(B −V )gas derived from Paα/Hα and Hα/Hβ differs in the opposite sense.
C© 2003 RAS, MNRAS 340, 813–831
Evolutionary SED diagnostics 823
0.1 1.0 10.0 100.0 1000.0λ [µm]
6
7
8
9
10
11
12
Log
λLλ
0.1 1.0 10.0 100.0 1000.0λ [µm]
6
7
8
9
10
11
12
Log
λLλ
0.1 1.0 10.0 100.0 1000.0λ [µm]
6
7
8
9
10
11
12
Log
λLλ
0.1 1.0 10.0 100.0 1000.0λ [µm]
6
7
8
9
10
11
12
Log
λLλ
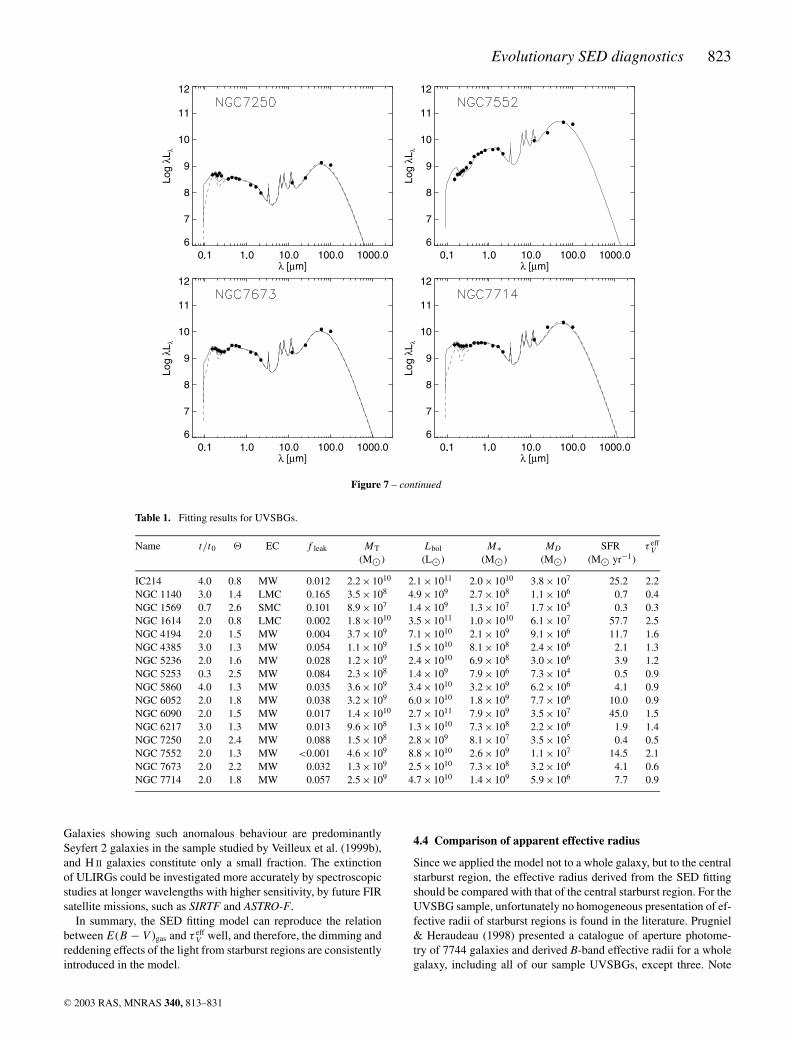
Figure 7 – continued
Table 1. Fitting results for UVSBGs.
Name t/t0 EC f leak MT Lbol M∗ MD SFR τ effV
(M�) (L�) (M�) (M�) (M� yr−1)
IC214 4.0 0.8 MW 0.012 2.2 × 10¹⁰ 2.1 × 10¹¹ 2.0 × 10¹⁰ 3.8 × 10⁷ 25.2 2.2NGC 1140 3.0 1.4 LMC 0.165 3.5 × 10⁸ 4.9 × 10⁹ 2.7 × 10⁸ 1.1 × 10⁶ 0.7 0.4NGC 1569 0.7 2.6 SMC 0.101 8.9 × 10⁷ 1.4 × 10⁹ 1.3 × 10⁷ 1.7 × 10⁵ 0.3 0.3NGC 1614 2.0 0.8 LMC 0.002 1.8 × 10¹⁰ 3.5 × 10¹¹ 1.0 × 10¹⁰ 6.1 × 10⁷ 57.7 2.5NGC 4194 2.0 1.5 MW 0.004 3.7 × 10⁹ 7.1 × 10¹⁰ 2.1 × 10⁹ 9.1 × 10⁶ 11.7 1.6NGC 4385 3.0 1.3 MW 0.054 1.1 × 10⁹ 1.5 × 10¹⁰ 8.1 × 10⁸ 2.4 × 10⁶ 2.1 1.3NGC 5236 2.0 1.6 MW 0.028 1.2 × 10⁹ 2.4 × 10¹⁰ 6.9 × 10⁸ 3.0 × 10⁶ 3.9 1.2NGC 5253 0.3 2.5 MW 0.084 2.3 × 10⁸ 1.4 × 10⁹ 7.9 × 10⁶ 7.3 × 10⁴ 0.5 0.9NGC 5860 4.0 1.3 MW 0.035 3.6 × 10⁹ 3.4 × 10¹⁰ 3.2 × 10⁹ 6.2 × 10⁶ 4.1 0.9NGC 6052 2.0 1.8 MW 0.038 3.2 × 10⁹ 6.0 × 10¹⁰ 1.8 × 10⁹ 7.7 × 10⁶ 10.0 0.9NGC 6090 2.0 1.5 MW 0.017 1.4 × 10¹⁰ 2.7 × 10¹¹ 7.9 × 10⁹ 3.5 × 10⁷ 45.0 1.5NGC 6217 3.0 1.3 MW 0.013 9.6 × 10⁸ 1.3 × 10¹⁰ 7.3 × 10⁸ 2.2 × 10⁶ 1.9 1.4NGC 7250 2.0 2.4 MW 0.088 1.5 × 10⁸ 2.8 × 10⁹ 8.1 × 10⁷ 3.5 × 10⁵ 0.4 0.5NGC 7552 2.0 1.3 MW <0.001 4.6 × 10⁹ 8.8 × 10¹⁰ 2.6 × 10⁹ 1.1 × 10⁷ 14.5 2.1NGC 7673 2.0 2.2 MW 0.032 1.3 × 10⁹ 2.5 × 10¹⁰ 7.3 × 10⁸ 3.2 × 10⁶ 4.1 0.6NGC 7714 2.0 1.8 MW 0.057 2.5 × 10⁹ 4.7 × 10¹⁰ 1.4 × 10⁹ 5.9 × 10⁶ 7.7 0.9
Galaxies showing such anomalous behaviour are predominantlySeyfert 2 galaxies in the sample studied by Veilleux et al. (1999b),and H II galaxies constitute only a small fraction. The extinctionof ULIRGs could be investigated more accurately by spectroscopicstudies at longer wavelengths with higher sensitivity, by future FIRsatellite missions, such as SIRTF and ASTRO-F.
In summary, the SED fitting model can reproduce the relationbetween E(B − V )gas and τ eff
V well, and therefore, the dimming andreddening effects of the light from starburst regions are consistentlyintroduced in the model.
4.4 Comparison of apparent effective radius
Since we applied the model not to a whole galaxy, but to the centralstarburst region, the effective radius derived from the SED fittingshould be compared with that of the central starburst region. For theUVSBG sample, unfortunately no homogeneous presentation of ef-fective radii of starburst regions is found in the literature. Prugniel& Heraudeau (1998) presented a catalogue of aperture photome-try of 7744 galaxies and derived B-band effective radii for a wholegalaxy, including all of our sample UVSBGs, except three. Note
C© 2003 RAS, MNRAS 340, 813–831
824 T. Takagi, N. Arimoto and H. Hanami
0.1 1.0 10.0 100.0 1000.0λ [µm]
7
8
9
10
11
12
13
Log
λLλ
0.1 1.0 10.0 100.0 1000.0λ [µm]
[µ0.1 1.0 10.0 100.0 1000.0
λ m]
7
8
9
10
11
12
13
Log
λLλ
7
8
9
10
11
12
13
Log
λL[L
]λ
0.1 1.0 10.0 100.0 1000.0λ [µm]
7
8
9
10
11
12
13
Log
λLλ
7
8
9
10
11
12
13
Log
λL[L
]λ
0.1 1.0 10.0 100.0 1000.0λ [µm]
0.1 1.0 10.0 100.0 1000.0λ [µm]
7
8
9
10
11
12
13
Log
λLλ
Figure 8. The same as in Fig. 7, but for ultraluminous infrared galaxies. Open circles for IRAS 12112, 08572, 15250, Arp220 and IRAS 22491 indicate thephotometric data, obtained by the Hubble Space Telescope (Trentham et al. 1999; Goldader et al. 2002).
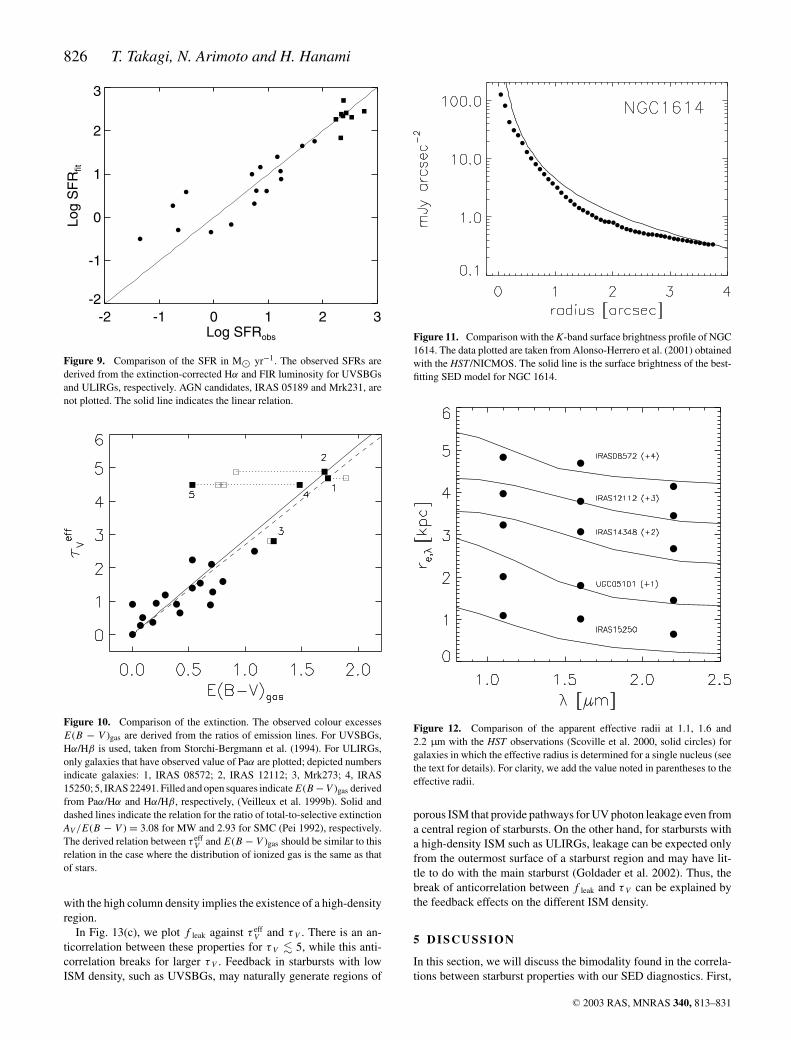
that these effective radii cannot be compared with the model resultsdirectly, since the underlying population could enlarge the B-bandeffective radii, systematically. It is found that B-band effective radiipublished by Prugniel & Heraudeau (1998) are systematically largerthan those derived from the SED fitting by a factor of 3. However, itis not yet clear whether the contribution from the underlying popu-lation is enough to explain this discrepancy or not. This discrepancymay be partly because of the adopted concentration parameter cbeing too large for UVSBGs. Alonso-Herrero et al. (2001) stud-ied NGC 1614 in detail with HST/NICMOS observations, and pre-sented a surface brightness profile of the central starburst regionin the K band. We compare the K-band surface brightness profileof NGC 1614 with that of the best-fitting SED model in Fig. 11.Clearly, the model result is in good agreement with the observation.Since this galaxy is relatively luminous and obscured for a typicalUVSBG, we need a more comprehensive study using images withhigh spatial resolution to confirm the stellar distribution of UVSBGsunambiguously.
Scoville et al. (2000) presented NIR images of ULIRGs obtainedwith the HST/NICMOS, and derived the effective radii at 1.1, 1.6and 2.2 µm. In most cases, the observed effective radii are lessthan 1 arcsec, and are therefore consistent with the adopted aperturesize as starburst regions (5 arcsec) in the SED fitting. We focuson the ULIRGs for which the effective radii are determined forisolated major starburst regions, since the multiple structure couldenlarge the effective radius, systematically. In Fig. 12, the effectiveradii of the models for ULIRGs are compared with the apparenteffective radii from the HST/NICMOS images. As a result, we cansee that the radii from the models and the observations are consistentwith each other within a factor of 2. As shown in the Fig. 12, theeffective radius of isolated starburst region in the K band is <0.7 kpc,which corresponds to an intrinsic effective radius (i.e. for the casewithout dust) of ∼0.3 kpc. Scoville et al. (2000) have shown thatthe light profiles of these ULIRGs can also be fitted well with ther 1/4 law, which can be reproduced by the King profile. Thus, thestellar distribution in a starburst region can be roughly represented
C© 2003 RAS, MNRAS 340, 813–831
Evolutionary SED diagnostics 825
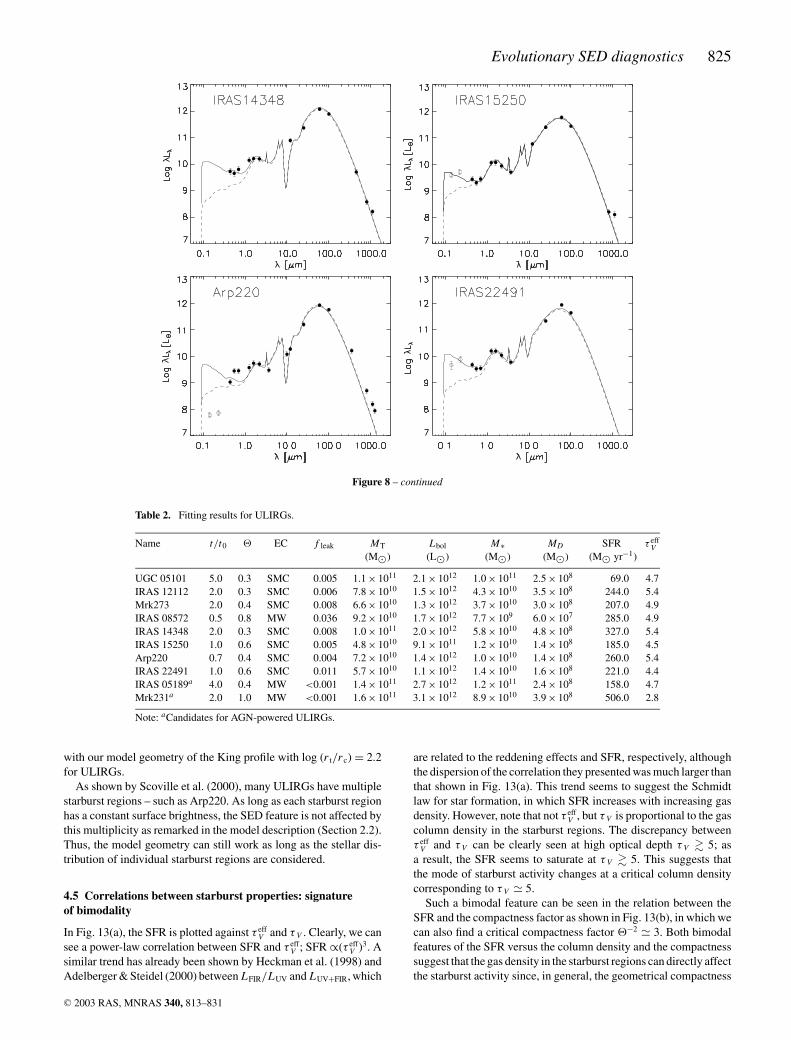
Figure 8 – continued
Table 2. Fitting results for ULIRGs.
Name t/t0 EC f leak MT Lbol M∗ MD SFR τ effV
(M�) (L�) (M�) (M�) (M� yr−1)
UGC 05101 5.0 0.3 SMC 0.005 1.1 × 10¹¹ 2.1 × 10¹² 1.0 × 10¹¹ 2.5 × 10⁸ 69.0 4.7IRAS 12112 2.0 0.3 SMC 0.006 7.8 × 10¹⁰ 1.5 × 10¹² 4.3 × 10¹⁰ 3.5 × 10⁸ 244.0 5.4Mrk273 2.0 0.4 SMC 0.008 6.6 × 10¹⁰ 1.3 × 10¹² 3.7 × 10¹⁰ 3.0 × 10⁸ 207.0 4.9IRAS 08572 0.5 0.8 MW 0.036 9.2 × 10¹⁰ 1.7 × 10¹² 7.7 × 10⁹ 6.0 × 10⁷ 285.0 4.9IRAS 14348 2.0 0.3 SMC 0.008 1.0 × 10¹¹ 2.0 × 10¹² 5.8 × 10¹⁰ 4.8 × 10⁸ 327.0 5.4IRAS 15250 1.0 0.6 SMC 0.005 4.8 × 10¹⁰ 9.1 × 10¹¹ 1.2 × 10¹⁰ 1.4 × 10⁸ 185.0 4.5Arp220 0.7 0.4 SMC 0.004 7.2 × 10¹⁰ 1.4 × 10¹² 1.0 × 10¹⁰ 1.4 × 10⁸ 260.0 5.4IRAS 22491 1.0 0.6 SMC 0.011 5.7 × 10¹⁰ 1.1 × 10¹² 1.4 × 10¹⁰ 1.6 × 10⁸ 221.0 4.4IRAS 05189a 4.0 0.4 MW <0.001 1.4 × 10¹¹ 2.7 × 10¹² 1.2 × 10¹¹ 2.4 × 10⁸ 158.0 4.7Mrk231a 2.0 1.0 MW <0.001 1.6 × 10¹¹ 3.1 × 10¹² 8.9 × 10¹⁰ 3.9 × 10⁸ 506.0 2.8
Note: aCandidates for AGN-powered ULIRGs.
with our model geometry of the King profile with log (r t/r c) = 2.2for ULIRGs.
As shown by Scoville et al. (2000), many ULIRGs have multiplestarburst regions – such as Arp220. As long as each starburst regionhas a constant surface brightness, the SED feature is not affected bythis multiplicity as remarked in the model description (Section 2.2).Thus, the model geometry can still work as long as the stellar dis-tribution of individual starburst regions are considered.
4.5 Correlations between starburst properties: signatureof bimodality
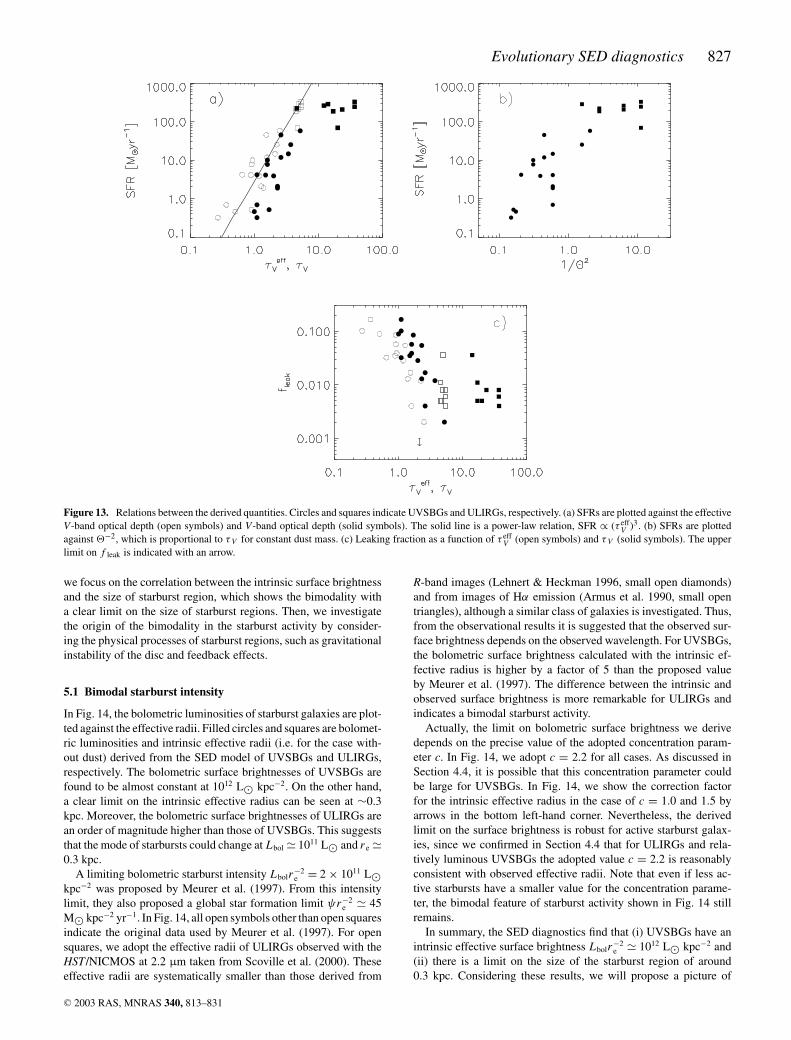
In Fig. 13(a), the SFR is plotted against τ effV and τ V . Clearly, we can
see a power-law correlation between SFR and τ effV ; SFR ∝(τ eff
V )3. Asimilar trend has already been shown by Heckman et al. (1998) andAdelberger & Steidel (2000) between LFIR/LUV and LUV+FIR, which
are related to the reddening effects and SFR, respectively, althoughthe dispersion of the correlation they presented was much larger thanthat shown in Fig. 13(a). This trend seems to suggest the Schmidtlaw for star formation, in which SFR increases with increasing gasdensity. However, note that not τ eff
V , but τ V is proportional to the gascolumn density in the starburst regions. The discrepancy betweenτ eff
V and τ V can be clearly seen at high optical depth τ V � 5; asa result, the SFR seems to saturate at τ V � 5. This suggests thatthe mode of starburst activity changes at a critical column densitycorresponding to τ V � 5.
Such a bimodal feature can be seen in the relation between theSFR and the compactness factor as shown in Fig. 13(b), in which wecan also find a critical compactness factor −2 � 3. Both bimodalfeatures of the SFR versus the column density and the compactnesssuggest that the gas density in the starburst regions can directly affectthe starburst activity since, in general, the geometrical compactness
C© 2003 RAS, MNRAS 340, 813–831
826 T. Takagi, N. Arimoto and H. Hanami
-2 -1 0 1 2 3Log SFRobs
-2
-1
0
1
2
3
Log
SF
Rfit
Figure 9. Comparison of the SFR in M� yr−1. The observed SFRs arederived from the extinction-corrected Hα and FIR luminosity for UVSBGsand ULIRGs, respectively. AGN candidates, IRAS 05189 and Mrk231, arenot plotted. The solid line indicates the linear relation.
Figure 10. Comparison of the extinction. The observed colour excessesE(B − V )gas are derived from the ratios of emission lines. For UVSBGs,Hα/Hβ is used, taken from Storchi-Bergmann et al. (1994). For ULIRGs,only galaxies that have observed value of Paα are plotted; depicted numbersindicate galaxies: 1, IRAS 08572; 2, IRAS 12112; 3, Mrk273; 4, IRAS15250; 5, IRAS 22491. Filled and open squares indicate E(B − V )gas derivedfrom Paα/Hα and Hα/Hβ, respectively, (Veilleux et al. 1999b). Solid anddashed lines indicate the relation for the ratio of total-to-selective extinctionAV/E(B − V ) = 3.08 for MW and 2.93 for SMC (Pei 1992), respectively.The derived relation between τ eff
V and E(B − V )gas should be similar to thisrelation in the case where the distribution of ionized gas is the same as thatof stars.
with the high column density implies the existence of a high-densityregion.
In Fig. 13(c), we plot f leak against τ effV and τ V . There is an an-
ticorrelation between these properties for τ V � 5, while this anti-correlation breaks for larger τ V . Feedback in starbursts with lowISM density, such as UVSBGs, may naturally generate regions of
Figure 11. Comparison with the K-band surface brightness profile of NGC1614. The data plotted are taken from Alonso-Herrero et al. (2001) obtainedwith the HST/NICMOS. The solid line is the surface brightness of the best-fitting SED model for NGC 1614.
Figure 12. Comparison of the apparent effective radii at 1.1, 1.6 and2.2 µm with the HST observations (Scoville et al. 2000, solid circles) forgalaxies in which the effective radius is determined for a single nucleus (seethe text for details). For clarity, we add the value noted in parentheses to theeffective radii.
porous ISM that provide pathways for UV photon leakage even froma central region of starbursts. On the other hand, for starbursts witha high-density ISM such as ULIRGs, leakage can be expected onlyfrom the outermost surface of a starburst region and may have lit-tle to do with the main starburst (Goldader et al. 2002). Thus, thebreak of anticorrelation between f leak and τ V can be explained bythe feedback effects on the different ISM density.
5 D I S C U S S I O N
In this section, we will discuss the bimodality found in the correla-tions between starburst properties with our SED diagnostics. First,
C© 2003 RAS, MNRAS 340, 813–831
Evolutionary SED diagnostics 827
Figure 13. Relations between the derived quantities. Circles and squares indicate UVSBGs and ULIRGs, respectively. (a) SFRs are plotted against the effectiveV-band optical depth (open symbols) and V-band optical depth (solid symbols). The solid line is a power-law relation, SFR ∝ (τ eff
V )3. (b) SFRs are plottedagainst −2, which is proportional to τ V for constant dust mass. (c) Leaking fraction as a function of τ eff
V (open symbols) and τ V (solid symbols). The upperlimit on f leak is indicated with an arrow.
we focus on the correlation between the intrinsic surface brightnessand the size of starburst region, which shows the bimodality witha clear limit on the size of starburst regions. Then, we investigatethe origin of the bimodality in the starburst activity by consider-ing the physical processes of starburst regions, such as gravitationalinstability of the disc and feedback effects.
5.1 Bimodal starburst intensity
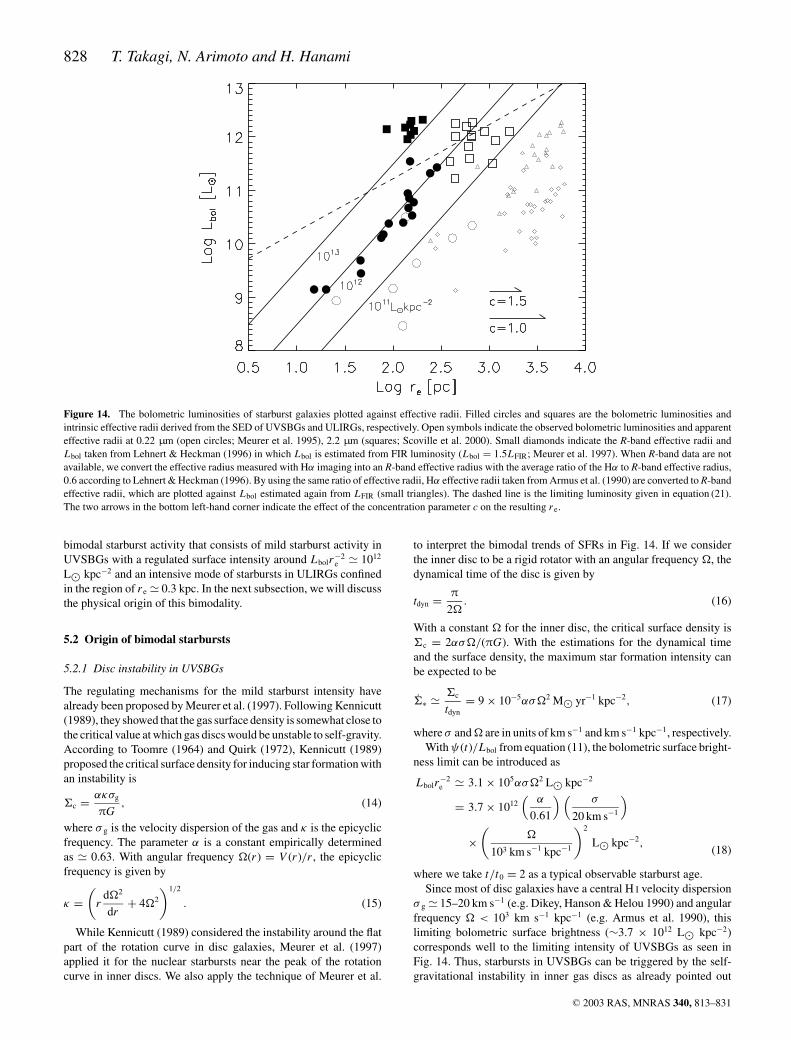
In Fig. 14, the bolometric luminosities of starburst galaxies are plot-ted against the effective radii. Filled circles and squares are bolomet-ric luminosities and intrinsic effective radii (i.e. for the case with-out dust) derived from the SED model of UVSBGs and ULIRGs,respectively. The bolometric surface brightnesses of UVSBGs arefound to be almost constant at 1012 L� kpc−2. On the other hand,a clear limit on the intrinsic effective radius can be seen at ∼0.3kpc. Moreover, the bolometric surface brightnesses of ULIRGs arean order of magnitude higher than those of UVSBGs. This suggeststhat the mode of starbursts could change at Lbol � 1011 L� and r e �0.3 kpc.
A limiting bolometric starburst intensity Lbolr−2e = 2 × 10¹¹ L�
kpc−2 was proposed by Meurer et al. (1997). From this intensitylimit, they also proposed a global star formation limit ψr−2
e � 45M� kpc−2 yr−1. In Fig. 14, all open symbols other than open squaresindicate the original data used by Meurer et al. (1997). For opensquares, we adopt the effective radii of ULIRGs observed with theHST/NICMOS at 2.2 µm taken from Scoville et al. (2000). Theseeffective radii are systematically smaller than those derived from
R-band images (Lehnert & Heckman 1996, small open diamonds)and from images of Hα emission (Armus et al. 1990, small opentriangles), although a similar class of galaxies is investigated. Thus,from the observational results it is suggested that the observed sur-face brightness depends on the observed wavelength. For UVSBGs,the bolometric surface brightness calculated with the intrinsic ef-fective radius is higher by a factor of 5 than the proposed valueby Meurer et al. (1997). The difference between the intrinsic andobserved surface brightness is more remarkable for ULIRGs andindicates a bimodal starburst activity.
Actually, the limit on bolometric surface brightness we derivedepends on the precise value of the adopted concentration param-eter c. In Fig. 14, we adopt c = 2.2 for all cases. As discussed inSection 4.4, it is possible that this concentration parameter couldbe large for UVSBGs. In Fig. 14, we show the correction factorfor the intrinsic effective radius in the case of c = 1.0 and 1.5 byarrows in the bottom left-hand corner. Nevertheless, the derivedlimit on the surface brightness is robust for active starburst galax-ies, since we confirmed in Section 4.4 that for ULIRGs and rela-tively luminous UVSBGs the adopted value c = 2.2 is reasonablyconsistent with observed effective radii. Note that even if less ac-tive starbursts have a smaller value for the concentration parame-ter, the bimodal feature of starburst activity shown in Fig. 14 stillremains.
In summary, the SED diagnostics find that (i) UVSBGs have anintrinsic effective surface brightness Lbolr−2
e � 1012 L� kpc−2 and(ii) there is a limit on the size of the starburst region of around0.3 kpc. Considering these results, we will propose a picture of
C© 2003 RAS, MNRAS 340, 813–831
828 T. Takagi, N. Arimoto and H. Hanami
Figure 14. The bolometric luminosities of starburst galaxies plotted against effective radii. Filled circles and squares are the bolometric luminosities andintrinsic effective radii derived from the SED of UVSBGs and ULIRGs, respectively. Open symbols indicate the observed bolometric luminosities and apparenteffective radii at 0.22 µm (open circles; Meurer et al. 1995), 2.2 µm (squares; Scoville et al. 2000). Small diamonds indicate the R-band effective radii andLbol taken from Lehnert & Heckman (1996) in which Lbol is estimated from FIR luminosity (Lbol = 1.5LFIR; Meurer et al. 1997). When R-band data are notavailable, we convert the effective radius measured with Hα imaging into an R-band effective radius with the average ratio of the Hα to R-band effective radius,0.6 according to Lehnert & Heckman (1996). By using the same ratio of effective radii, Hα effective radii taken from Armus et al. (1990) are converted to R-bandeffective radii, which are plotted against Lbol estimated again from LFIR (small triangles). The dashed line is the limiting luminosity given in equation (21).The two arrows in the bottom left-hand corner indicate the effect of the concentration parameter c on the resulting r e.
bimodal starburst activity that consists of mild starburst activity inUVSBGs with a regulated surface intensity around Lbolr−2
e � 1012
L� kpc−2 and an intensive mode of starbursts in ULIRGs confinedin the region of r e � 0.3 kpc. In the next subsection, we will discussthe physical origin of this bimodality.
5.2 Origin of bimodal starbursts
5.2.1 Disc instability in UVSBGs
The regulating mechanisms for the mild starburst intensity havealready been proposed by Meurer et al. (1997). Following Kennicutt(1989), they showed that the gas surface density is somewhat close tothe critical value at which gas discs would be unstable to self-gravity.According to Toomre (1964) and Quirk (1972), Kennicutt (1989)proposed the critical surface density for inducing star formation withan instability is
�c = ακσg
πG, (14)
where σ g is the velocity dispersion of the gas and κ is the epicyclicfrequency. The parameter α is a constant empirically determinedas � 0.63. With angular frequency �(r ) = V (r )/r , the epicyclicfrequency is given by
κ =(
rd�2
dr+ 4�2
)1/2
. (15)
While Kennicutt (1989) considered the instability around the flatpart of the rotation curve in disc galaxies, Meurer et al. (1997)applied it for the nuclear starbursts near the peak of the rotationcurve in inner discs. We also apply the technique of Meurer et al.
to interpret the bimodal trends of SFRs in Fig. 14. If we considerthe inner disc to be a rigid rotator with an angular frequency �, thedynamical time of the disc is given by
tdyn = π
2�. (16)
With a constant � for the inner disc, the critical surface density is�c = 2ασ�/(πG). With the estimations for the dynamical timeand the surface density, the maximum star formation intensity canbe expected to be
�∗ � �c
tdyn= 9 × 10⁻⁵ασ�2 M� yr−1 kpc−2, (17)
where σ and � are in units of km s−1 and km s−1 kpc−1, respectively.With ψ(t)/Lbol from equation (11), the bolometric surface bright-
ness limit can be introduced as
Lbolr−2e � 3.1 × 10⁵ασ�2 L� kpc−2
= 3.7 × 10¹²(
α
0.61
)(σ
20 km s−1
)
×(
�
103 km s−1 kpc−1
)2
L� kpc−2,(18)
where we take t/t0 = 2 as a typical observable starburst age.Since most of disc galaxies have a central H I velocity dispersion
σ g � 15–20 km s−1 (e.g. Dikey, Hanson & Helou 1990) and angularfrequency � < 103 km s−1 kpc−1 (e.g. Armus et al. 1990), thislimiting bolometric surface brightness (∼3.7 × 10¹² L� kpc−2)corresponds well to the limiting intensity of UVSBGs as seen inFig. 14. Thus, starbursts in UVSBGs can be triggered by the self-gravitational instability in inner gas discs as already pointed out
C© 2003 RAS, MNRAS 340, 813–831
Evolutionary SED diagnostics 829
by Meurer et al. (1997). This instability seems to induce only mildstarburst activity, since the unstable region should have a scale of thedisc thickness, and the whole gas in the disc cannot concentrate intothe unstable region owing to the centrifugal force from the rotationof the disc. This means that the maximum size of starburst regions isexpected to be similar to the disc thickness ∼0.3 kpc, and thereforeconsistent with the SED fitting results in which no starbursts withr e � 0.3 kpc are found.
The surface brightness of ULIRGs are an order of magni-tude larger than that expected from the disc instability. Therefore,ULIRGs should be triggered by another mechanism that can inducea stronger concentration of gas. As indicated by equation (18), thesurface brightness of starburst regions in UVSBGs are related tothe physical properties of parent galaxies. On the other hand, thestrong mass concentration in the central region of ULIRGs shouldresult in strong self-gravity of the starburst region, and thereforethe starburst region in ULIRGs can be dynamically isolated fromparent galaxies. In such a case, the surface brightness of ULIRGsshould be controlled by the relative strength of the self-gravity andits feedback.
5.2.2 Self-gravity versus feedback in ULIRGs
For a starburst with a typical duration of t0, the kinetic energy of gasclouds with random velocity vg can be written as 1
2 Mgv2g � Lkint0,
where Lkin is the kinetic luminosity caused by feedback. Assumingthat Lkin is proportional to the bolometric luminosity with a constantefficiency f kin, i.e. Lkin = f kin Lbol, we can write the kinetic energyper unit mass as
1
2v2
g = Lkintdyn
Mg= fkin
Lbol
ψ. (19)
Using the relation between Lbol and SFR ψ in equation (11), thetypical velocity can be written as
vg = 454
(fkin
0.01
)1/2 ( t
t0
)1/2
km s−1. (20)
Note that the effect of feedback is independent of the mass in thestarburst regions and also in the host galaxies, even though a largergas supply can induce a more active starburst. On the other hand,the gravitational effect becomes more prominent in more massivesystems. This means that too massive starbursts cannot be sustainedby feedback against strong self-gravity.
This limiting effect of feedback against self-gravity can be esti-mated by the comparison ofvg with the escape velocityvesc,c [v2
esc,c �2GM(<r e)r−1
e ], which indicates the depth of the gravitational po-tential well. A critical mass–radius relation is expected for thecondition, vesc,c = vg. This relation can be rewritten as anotherluminosity–radius relation using the mass-to-light ratio of starburstregions (equation 12). We can then introduce a limiting bolometricluminosity
Lbol,c � 1.2 × 10²
(M∗
M�
)( t
t0
)−1.8
L�
� 1.5 × 10¹²
(fkin
0.01
)[M∗
M∗(< re)
]
×(
re
1 kpc
)( t
t0
)−0.8
L�, (21)
for t0 = 100 Myr, where we use M(<r e) = 2M∗(<r e). The totalmass within r e is somewhat uncertain, since a realistic distribution of
gas and the contribution from the dark matter are important. There-fore, we simply assume M(<r e) = 2M∗(<r e). At a typical starburststage t/t0 = 2, we take a limiting bolometric luminosity Lbol,c �1.7 × 10¹²(r e/1 kpc) L�. The feedback effect cannot sustain thestarburst region against self-gravity when the bolometric luminos-ity exceeds this limit. This limiting luminosity is indicated by thedashed line in Fig. 14, which crosses the line of limiting luminos-ity of the starbursts induced by the disc instability around 0.3 kpc.Fig. 14 shows that all the ULIRGs are above the dashed line wherethe feedback effect cannot sustain the starburst region against self-gravity, while all the UVSBGs but one are below the dashed line.Therefore, the mode of starburst in ULIRGs can be different fromthat in UVSBGs as expected.
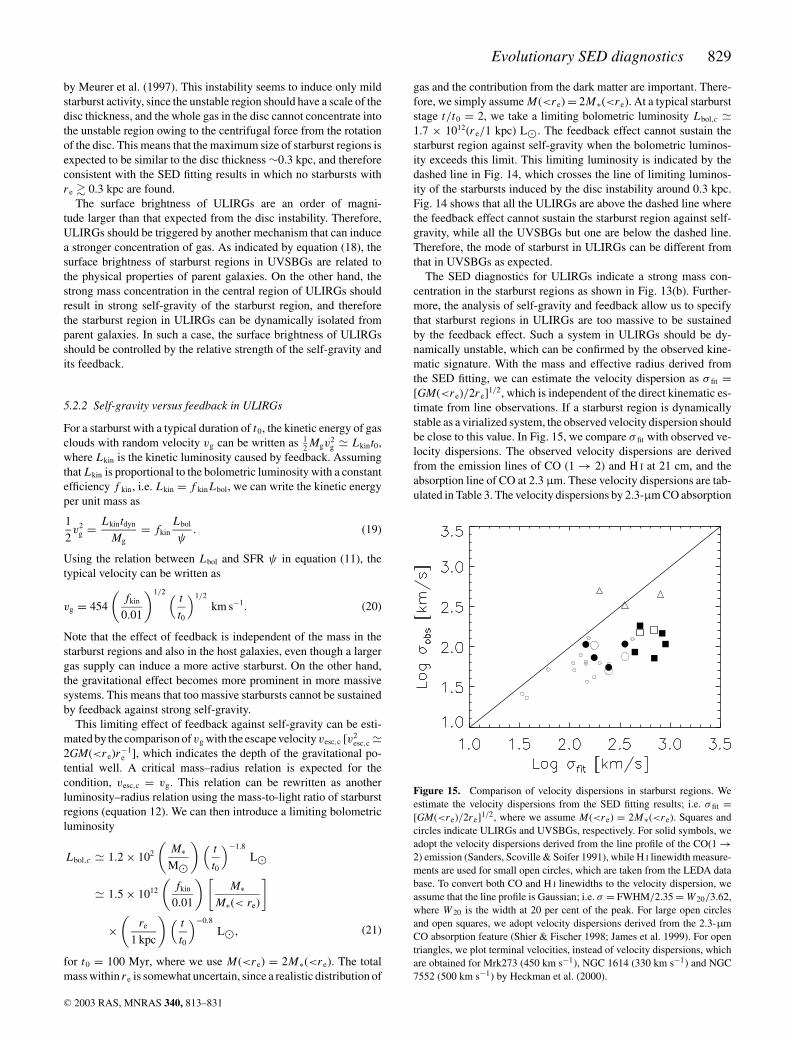
The SED diagnostics for ULIRGs indicate a strong mass con-centration in the starburst regions as shown in Fig. 13(b). Further-more, the analysis of self-gravity and feedback allow us to specifythat starburst regions in ULIRGs are too massive to be sustainedby the feedback effect. Such a system in ULIRGs should be dy-namically unstable, which can be confirmed by the observed kine-matic signature. With the mass and effective radius derived fromthe SED fitting, we can estimate the velocity dispersion as σ fit =[GM(<r e)/2r e]1/2, which is independent of the direct kinematic es-timate from line observations. If a starburst region is dynamicallystable as a virialized system, the observed velocity dispersion shouldbe close to this value. In Fig. 15, we compare σ fit with observed ve-locity dispersions. The observed velocity dispersions are derivedfrom the emission lines of CO (1 → 2) and H I at 21 cm, and theabsorption line of CO at 2.3 µm. These velocity dispersions are tab-ulated in Table 3. The velocity dispersions by 2.3-µm CO absorption
Figure 15. Comparison of velocity dispersions in starburst regions. Weestimate the velocity dispersions from the SED fitting results; i.e. σ fit =[GM(<r e)/2r e]1/2, where we assume M(<r e) = 2M∗(<r e). Squares andcircles indicate ULIRGs and UVSBGs, respectively. For solid symbols, weadopt the velocity dispersions derived from the line profile of the CO(1 →2) emission (Sanders, Scoville & Soifer 1991), while H I linewidth measure-ments are used for small open circles, which are taken from the LEDA database. To convert both CO and H I linewidths to the velocity dispersion, weassume that the line profile is Gaussian; i.e. σ = FWHM/2.35 = W 20/3.62,where W 20 is the width at 20 per cent of the peak. For large open circlesand open squares, we adopt velocity dispersions derived from the 2.3-µmCO absorption feature (Shier & Fischer 1998; James et al. 1999). For opentriangles, we plot terminal velocities, instead of velocity dispersions, whichare obtained for Mrk273 (450 km s−1), NGC 1614 (330 km s−1) and NGC7552 (500 km s−1) by Heckman et al. (2000).
C© 2003 RAS, MNRAS 340, 813–831
830 T. Takagi, N. Arimoto and H. Hanami
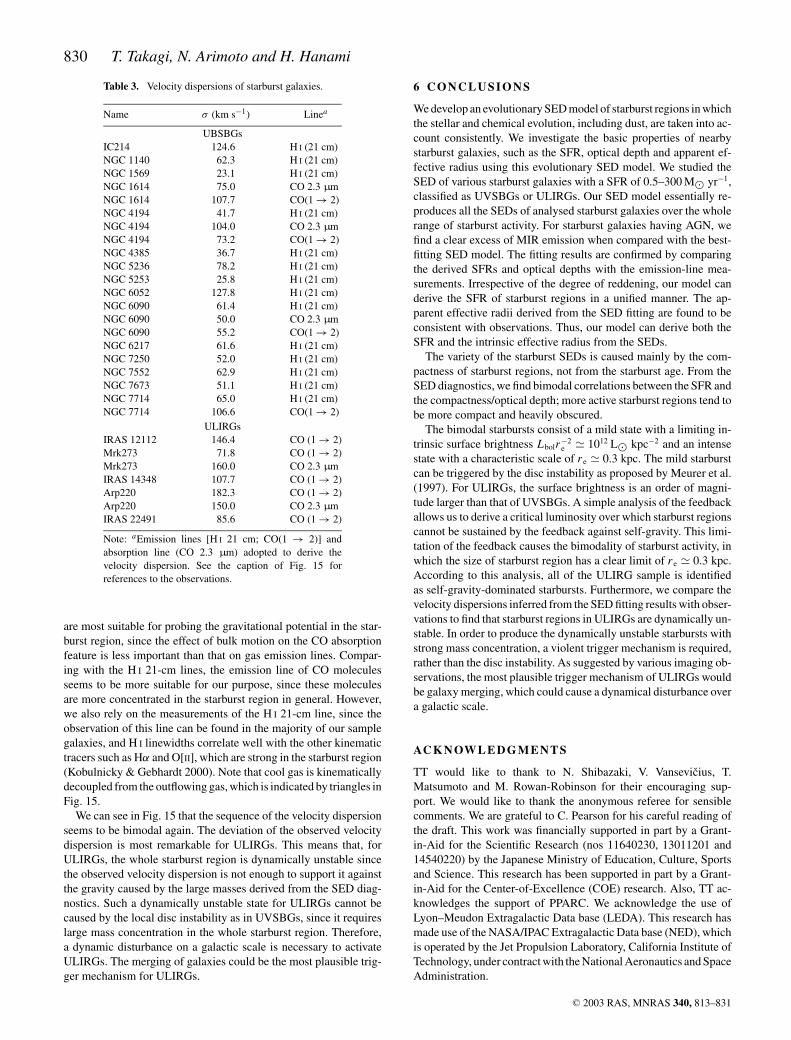
Table 3. Velocity dispersions of starburst galaxies.
Name σ (km s−1) Linea
UBSBGsIC214 124.6 H I (21 cm)NGC 1140 62.3 H I (21 cm)NGC 1569 23.1 H I (21 cm)NGC 1614 75.0 CO 2.3 µmNGC 1614 107.7 CO(1 → 2)NGC 4194 41.7 H I (21 cm)NGC 4194 104.0 CO 2.3 µmNGC 4194 73.2 CO(1 → 2)NGC 4385 36.7 H I (21 cm)NGC 5236 78.2 H I (21 cm)NGC 5253 25.8 H I (21 cm)NGC 6052 127.8 H I (21 cm)NGC 6090 61.4 H I (21 cm)NGC 6090 50.0 CO 2.3 µmNGC 6090 55.2 CO(1 → 2)NGC 6217 61.6 H I (21 cm)NGC 7250 52.0 H I (21 cm)NGC 7552 62.9 H I (21 cm)NGC 7673 51.1 H I (21 cm)NGC 7714 65.0 H I (21 cm)NGC 7714 106.6 CO(1 → 2)
ULIRGsIRAS 12112 146.4 CO (1 → 2)Mrk273 71.8 CO (1 → 2)Mrk273 160.0 CO 2.3 µmIRAS 14348 107.7 CO (1 → 2)Arp220 182.3 CO (1 → 2)Arp220 150.0 CO 2.3 µmIRAS 22491 85.6 CO (1 → 2)
Note: aEmission lines [H I 21 cm; CO(1 → 2)] andabsorption line (CO 2.3 µm) adopted to derive thevelocity dispersion. See the caption of Fig. 15 forreferences to the observations.
are most suitable for probing the gravitational potential in the star-burst region, since the effect of bulk motion on the CO absorptionfeature is less important than that on gas emission lines. Compar-ing with the H I 21-cm lines, the emission line of CO moleculesseems to be more suitable for our purpose, since these moleculesare more concentrated in the starburst region in general. However,we also rely on the measurements of the H I 21-cm line, since theobservation of this line can be found in the majority of our samplegalaxies, and H I linewidths correlate well with the other kinematictracers such as Hα and O[II], which are strong in the starburst region(Kobulnicky & Gebhardt 2000). Note that cool gas is kinematicallydecoupled from the outflowing gas, which is indicated by triangles inFig. 15.
We can see in Fig. 15 that the sequence of the velocity dispersionseems to be bimodal again. The deviation of the observed velocitydispersion is most remarkable for ULIRGs. This means that, forULIRGs, the whole starburst region is dynamically unstable sincethe observed velocity dispersion is not enough to support it againstthe gravity caused by the large masses derived from the SED diag-nostics. Such a dynamically unstable state for ULIRGs cannot becaused by the local disc instability as in UVSBGs, since it requireslarge mass concentration in the whole starburst region. Therefore,a dynamic disturbance on a galactic scale is necessary to activateULIRGs. The merging of galaxies could be the most plausible trig-ger mechanism for ULIRGs.
6 C O N C L U S I O N S
We develop an evolutionary SED model of starburst regions in whichthe stellar and chemical evolution, including dust, are taken into ac-count consistently. We investigate the basic properties of nearbystarburst galaxies, such as the SFR, optical depth and apparent ef-fective radius using this evolutionary SED model. We studied theSED of various starburst galaxies with a SFR of 0.5–300 M� yr−1,classified as UVSBGs or ULIRGs. Our SED model essentially re-produces all the SEDs of analysed starburst galaxies over the wholerange of starburst activity. For starburst galaxies having AGN, wefind a clear excess of MIR emission when compared with the best-fitting SED model. The fitting results are confirmed by comparingthe derived SFRs and optical depths with the emission-line mea-surements. Irrespective of the degree of reddening, our model canderive the SFR of starburst regions in a unified manner. The ap-parent effective radii derived from the SED fitting are found to beconsistent with observations. Thus, our model can derive both theSFR and the intrinsic effective radius from the SEDs.
The variety of the starburst SEDs is caused mainly by the com-pactness of starburst regions, not from the starburst age. From theSED diagnostics, we find bimodal correlations between the SFR andthe compactness/optical depth; more active starburst regions tend tobe more compact and heavily obscured.
The bimodal starbursts consist of a mild state with a limiting in-trinsic surface brightness Lbolr−2
e � 1012 L� kpc−2 and an intensestate with a characteristic scale of r e � 0.3 kpc. The mild starburstcan be triggered by the disc instability as proposed by Meurer et al.(1997). For ULIRGs, the surface brightness is an order of magni-tude larger than that of UVSBGs. A simple analysis of the feedbackallows us to derive a critical luminosity over which starburst regionscannot be sustained by the feedback against self-gravity. This limi-tation of the feedback causes the bimodality of starburst activity, inwhich the size of starburst region has a clear limit of r e � 0.3 kpc.According to this analysis, all of the ULIRG sample is identifiedas self-gravity-dominated starbursts. Furthermore, we compare thevelocity dispersions inferred from the SED fitting results with obser-vations to find that starburst regions in ULIRGs are dynamically un-stable. In order to produce the dynamically unstable starbursts withstrong mass concentration, a violent trigger mechanism is required,rather than the disc instability. As suggested by various imaging ob-servations, the most plausible trigger mechanism of ULIRGs wouldbe galaxy merging, which could cause a dynamical disturbance overa galactic scale.
AC K N OW L E D G M E N T S
TT would like to thank to N. Shibazaki, V. Vansevicius, T.Matsumoto and M. Rowan-Robinson for their encouraging sup-port. We would like to thank the anonymous referee for sensiblecomments. We are grateful to C. Pearson for his careful reading ofthe draft. This work was financially supported in part by a Grant-in-Aid for the Scientific Research (nos 11640230, 13011201 and14540220) by the Japanese Ministry of Education, Culture, Sportsand Science. This research has been supported in part by a Grant-in-Aid for the Center-of-Excellence (COE) research. Also, TT ac-knowledges the support of PPARC. We acknowledge the use ofLyon–Meudon Extragalactic Data base (LEDA). This research hasmade use of the NASA/IPAC Extragalactic Data base (NED), whichis operated by the Jet Propulsion Laboratory, California Institute ofTechnology, under contract with the National Aeronautics and SpaceAdministration.
C© 2003 RAS, MNRAS 340, 813–831
Evolutionary SED diagnostics 831
R E F E R E N C E S
Adelberger K.L., Steidel C.C., 2000, ApJ, 544, 218Alonso-Herrero A., Engelbracht C.W., Rieke M.J., Rieke G.H., Quillen A.C.,
2001, ApJ, 547, 129Arimoto N., Yoshii Y., 1987, A&A, 173, 23Arimoto N., Yoshii Y., Takahara F., 1992, A&A, 253, 21Armus L., Heckman T.M., Miley G.K., 1990, ApJ, 364, 471Bryant P.M., Scoville N.Z., 1999, AJ, 117, 2632Calzetti D., Kinney A.L., Storchi-Bergmann T., 1994, ApJ, 429, 582Calzetti D., Bohlin R.C., Kinney A.L., Storchi-Bergmann T., Heckman T.M.,
1995, ApJ, 443, 136Combes F., Boisse P., Mazure A., Blanchard A., 1995, in Galaxies and
Cosmology. Springer-Verlag, Berlin, p. 96Dikey J.M., Hanson M.M., Helou G., 1990, AJ, 99, 1071Dwek E., 1998, ApJ, 501, 643Fioc M., Rocca-Volmerange B., 1997, A&A, 326, 950Genzel R. et al., 1998, A&A, 498, 579Goldader J.D., Meurer G., Heckman T.M., Seibert M., Sanders D.B., Calzetti
D., Steidel C.C., 2002, ApJ, 568, 651Gordon K.D., Calzetti D., Witt A.N., 1997, ApJ, 487, 625Heckman T.M., Robert C., Leitherer C., Garnett D.R., van der Rydt F., 1998,
ApJ, 505, 174Heckman T.M., Lehnert M.D., Stickland D.K., Armus L., 2000, ApJS, 129,
493James P., Bate C., Wells M., Wright G., Doyon R., 1999, MNRAS, 309, 585Kennicutt R.C., 1989, ApJ, 344, 685Kennicutt R.C., 1998, ApJ, 498, 541Kinney A.L., Bohlin R.C., Calzetti D., Panagia N., Wyse R.F.G., 1993, ApJS,
86, 5Kobulnicky H.A., Gebhardt K., 2000, AJ, 119, 1608Kodama T., Arimoto N., 1997, A&A, 320, 41Lehnert M.D., Heckman T.M., 1996, ApJ, 472, 546Leitherer C., Heckman T.M., 1995, ApJS, 96, 9Lequeux J., Peimbert M., Rayo J.F., Serrano A., Torres-Peimbert S., 1979,
A&A, 80, 155Lutz D., Spoon H.W.W., Rigopoulou D., Moorwood A.F.M., Genzel R.,
1998, ApJ, 505, L103
McQuade K., Calzetti D., Kinney A., 1995, ApJS, 97, 331Meurer G.R., Heckman T.M., Leitherer C., Kinney A., Robert C., Garnett
D.R., 1995, AJ, 110, 2665Meurer G.R., Heckman T.M., Lehnert M.D., Leitherer C., Lowenthal J.,
1997, AJ, 114, 54Meurer G.R., Heckman T.M., Calzetti D., 1999, ApJ, 521, 64Pagel B.E.J., 1997, in Nucleosynthesis and Chemical Evolution of Galaxies.
Cambridge Univ. Press, Cambridge, p. 82Pei Y.C., 1992, ApJ, 395, 130Prugniel Ph., Heraudeau Ph., 1998, A&AS, 128, 299Quirk W.J., 1972, ApJ, 176, L9Rigopoulou D., Lawrence A., Rowan-Robinson M., 1996, MNRAS, 278,
1049Rigopoulou D., Spoon H.W.W., Genzel R., Lutz D., Moorwood A.F.M., Tran
Q.D., 1999, AJ, 118, 2625Rowan-Robinson M., Efstathiou A., 1993, MNRAS, 263, 675Sanders D.B., Soifer B.T., Elias J.H., Madore B.F., Matthews K., Neugebauer
G., Scoville N.Z., 1988, ApJ, 325, 74Sanders D.B., Scoville N.Z., Soifer B.T., 1991, ApJ, 370, 158Scoville N.Z. et al., 2000, AJ, 119, 991Shier L.M., Fischer J., 1998, ApJ, 497, 163Soifer B.T. et al., 2000, AJ, 119, 509Storchi-Bergmann T., Calzetti D., Kinney A.L., 1994, ApJ, 429, 572Sullivan M., Treyer M.A., Ellis R.S., Bridges T.J., Millard B., Donas J.,
2000, MNRAS, 312, 442Surace J.A., Sanders D.B., 2000, AJ, 120, 604Takagi T., 2001, PhD thesis, Rikkyo Univ.Takagi T., Arimoto N., Vansevicius V., 1999, ApJ, 523, 107Toomre A., 1964, ApJ, 139, 1217Trentham N., Kormendy J., Sanders D.B., 1999, AJ, 117, 2152Veilleux S., Kim D.-C., Sanders D.B., 1999a, ApJ, 522, 113Veilleux S., Sanders D.B., Kim D.-C., 1999b, ApJ, 522, 139Witt A.N., Gordon K.D., 2000, ApJ, 528, 799Wynn-Williams C.G., Becklin E.E., 1993, ApJ, 412, 535
This paper has been typeset from a TEX/LATEX file prepared by the author.
C© 2003 RAS, MNRAS 340, 813–831