Embed Size (px)
Citation preview
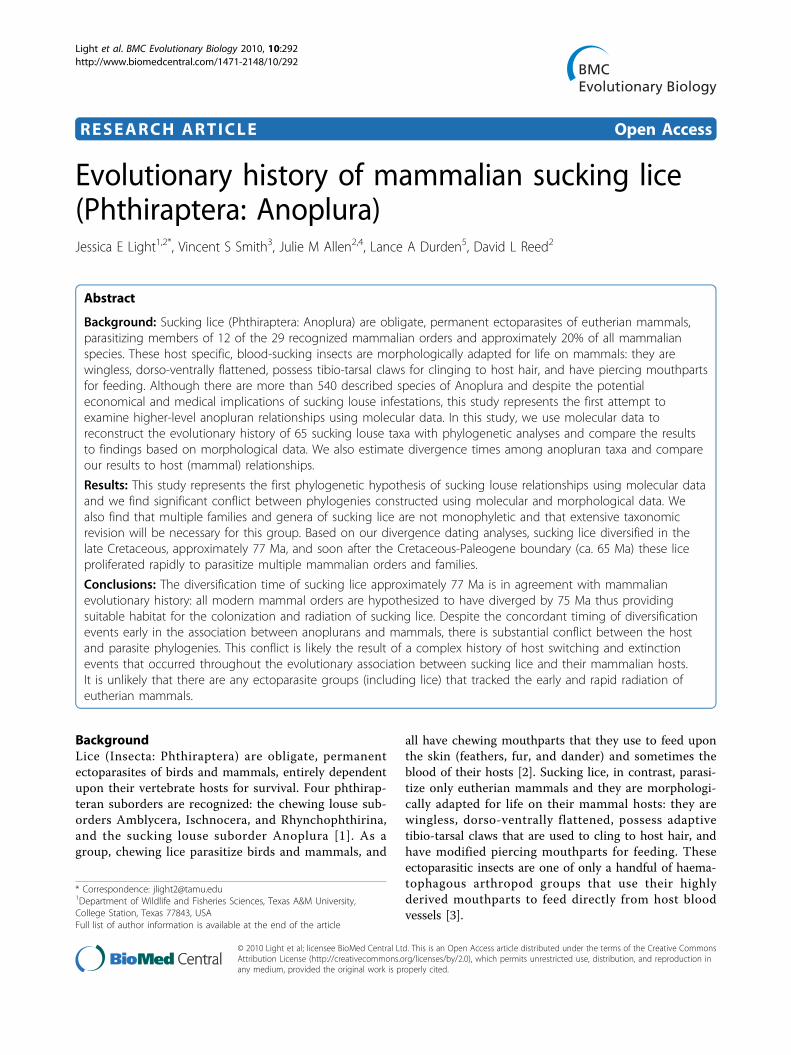
RESEARCH ARTICLE Open Access
Evolutionary history of mammalian sucking lice(Phthiraptera: Anoplura)Jessica E Light1,2*, Vincent S Smith3, Julie M Allen2,4, Lance A Durden5, David L Reed2
Abstract
Background: Sucking lice (Phthiraptera: Anoplura) are obligate, permanent ectoparasites of eutherian mammals,parasitizing members of 12 of the 29 recognized mammalian orders and approximately 20% of all mammalianspecies. These host specific, blood-sucking insects are morphologically adapted for life on mammals: they arewingless, dorso-ventrally flattened, possess tibio-tarsal claws for clinging to host hair, and have piercing mouthpartsfor feeding. Although there are more than 540 described species of Anoplura and despite the potentialeconomical and medical implications of sucking louse infestations, this study represents the first attempt toexamine higher-level anopluran relationships using molecular data. In this study, we use molecular data toreconstruct the evolutionary history of 65 sucking louse taxa with phylogenetic analyses and compare the resultsto findings based on morphological data. We also estimate divergence times among anopluran taxa and compareour results to host (mammal) relationships.
Results: This study represents the first phylogenetic hypothesis of sucking louse relationships using molecular dataand we find significant conflict between phylogenies constructed using molecular and morphological data. Wealso find that multiple families and genera of sucking lice are not monophyletic and that extensive taxonomicrevision will be necessary for this group. Based on our divergence dating analyses, sucking lice diversified in thelate Cretaceous, approximately 77 Ma, and soon after the Cretaceous-Paleogene boundary (ca. 65 Ma) these liceproliferated rapidly to parasitize multiple mammalian orders and families.
Conclusions: The diversification time of sucking lice approximately 77 Ma is in agreement with mammalianevolutionary history: all modern mammal orders are hypothesized to have diverged by 75 Ma thus providingsuitable habitat for the colonization and radiation of sucking lice. Despite the concordant timing of diversificationevents early in the association between anoplurans and mammals, there is substantial conflict between the hostand parasite phylogenies. This conflict is likely the result of a complex history of host switching and extinctionevents that occurred throughout the evolutionary association between sucking lice and their mammalian hosts.It is unlikely that there are any ectoparasite groups (including lice) that tracked the early and rapid radiation ofeutherian mammals.
BackgroundLice (Insecta: Phthiraptera) are obligate, permanentectoparasites of birds and mammals, entirely dependentupon their vertebrate hosts for survival. Four phthirap-teran suborders are recognized: the chewing louse sub-orders Amblycera, Ischnocera, and Rhynchophthirina,and the sucking louse suborder Anoplura [1]. As agroup, chewing lice parasitize birds and mammals, and
all have chewing mouthparts that they use to feed uponthe skin (feathers, fur, and dander) and sometimes theblood of their hosts [2]. Sucking lice, in contrast, parasi-tize only eutherian mammals and they are morphologi-cally adapted for life on their mammal hosts: they arewingless, dorso-ventrally flattened, possess adaptivetibio-tarsal claws that are used to cling to host hair, andhave modified piercing mouthparts for feeding. Theseectoparasitic insects are one of only a handful of haema-tophagous arthropod groups that use their highlyderived mouthparts to feed directly from host bloodvessels [3].
* Correspondence: [email protected] of Wildlife and Fisheries Sciences, Texas A&M University,College Station, Texas 77843, USAFull list of author information is available at the end of the article
Light et al. BMC Evolutionary Biology 2010, 10:292http://www.biomedcentral.com/1471-2148/10/292
© 2010 Light et al; licensee BioMed Central Ltd. This is an Open Access article distributed under the terms of the Creative CommonsAttribution License (http://creativecommons.org/licenses/by/2.0), which permits unrestricted use, distribution, and reproduction inany medium, provided the original work is properly cited.
The blood-feeding habits of sucking lice and the closeassociation they have with their mammalian hosts arehypothesized to have evolved via a particular sequence ofevents [4-6]. Early in their evolutionary history, suckinglouse ancestors had simple chewing mouthparts andwere free-living associates of the nests and burrows ofvertebrates. These nests and burrows served as protectivehabitats as well as a source of unlimited food suppliessuch as fungi, dung, and organic debris, specificallysloughed skin, fur, and feathers [5-7]. Over time, some ofthese nest associates became more directly dependent ontheir hosts and transitioned from opportunistic associatesto obligate parasites. These parasitic species fed directlyfrom their hosts, ingesting more nutritious and easier todigest blood (compared to organic debris such assloughed skin and feathers) and subsequently developedspecialized mouthparts modified to obtain blood meals[2,7]. This succession of events from free-living nestassociates to obligate parasites can be seen by examiningthe closest living relatives of the Anoplura, members ofother phthirapteran suborders, and the bark and booklice (order Psocoptera). The Psocoptera are closelyrelated to the Phthiraptera (together they form the super-order Psocodea), and these non-parasitic insects ofteninteract with vertebrate taxa, living in the nests, burrows,or among the fur and feathers of mammals and birds anduse their chewing mouthparts to feed on fungi or organicmatter [7-10]. Within the Phthiraptera, phylogenetic stu-dies have shown sucking lice to be monophyletic andderived, nested within the chewing lice and sister to theRhynchophthirina, a small suborder of chewing lice(3 known species) parasitic on warthogs, bush pigs, andelephants [1,11-13]. Rhynchophthirina species have mod-ified chewing mouthparts attached to the end of a longproboscis that are used to break through the skin of theirhosts allowing pools of blood to form. These chewinglice then use their mouthparts to feed on the bloodcollected in these pools. Thus, it is likely that sucking liceevolved from a blood-feeding Rhynchophthirina-likeancestor with the highly modified anopluran mouthpartsderived from the ancestral chewing mouthparts found inall other lice [14-16].When sucking lice began their associations with mam-
mals is uncertain because fossil evidence within thePhthiraptera is generally lacking [10,17,18]. Psocopterangroups are hypothesized to have originated in the Meso-zoic Era [5,10,18,19], with dates ranging from the Cretac-eous (65 Million Years Ago; Ma) as far back to thePermian (260 Ma) for the origin of the Phthiraptera[2,4,5,10,18,19]. However, the recent discovery of twoimportant fossils has shed light on the age of lice. Thefirst is an exceptionally preserved 44 Ma bird louse fossil[17], and the second is a 100 Ma fossil of the book-lousefamily Liposcelididae [18], which is the closest free-living
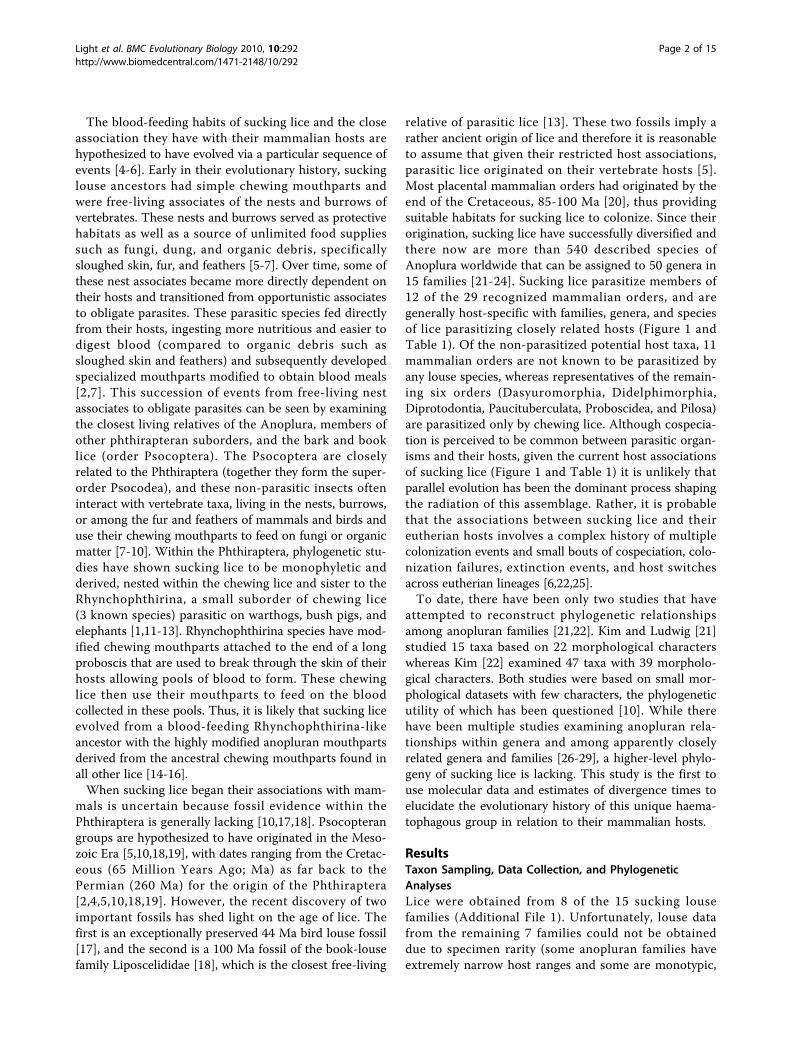
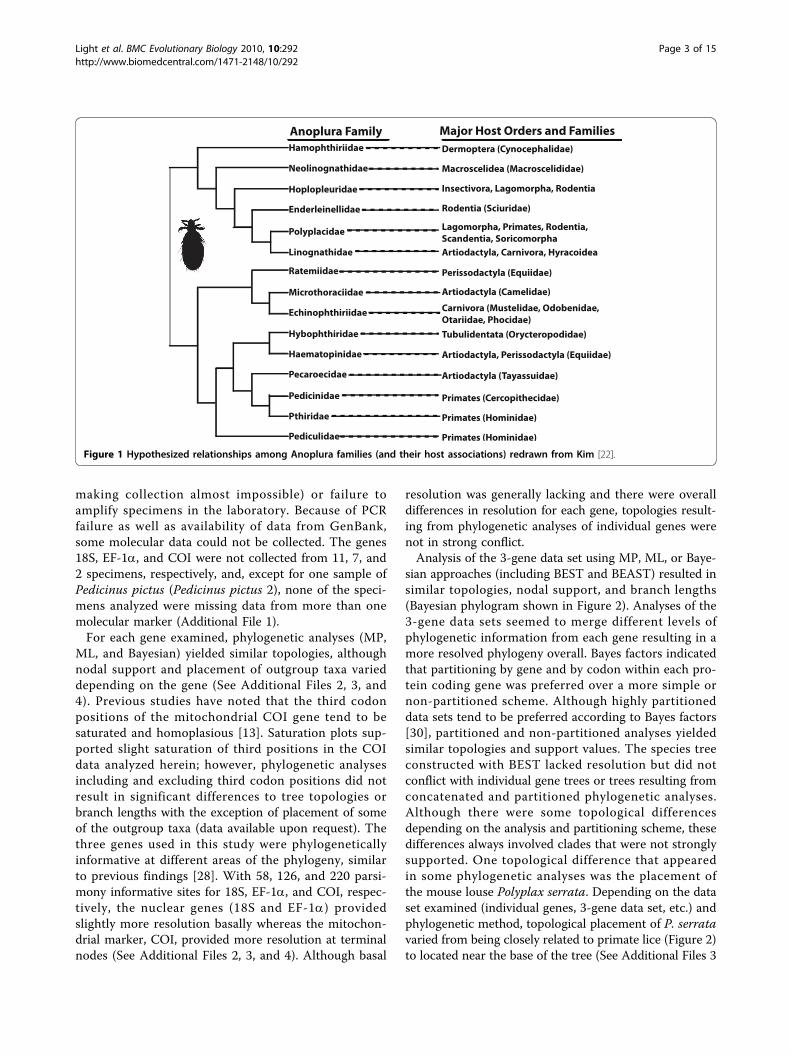
relative of parasitic lice [13]. These two fossils imply arather ancient origin of lice and therefore it is reasonableto assume that given their restricted host associations,parasitic lice originated on their vertebrate hosts [5].Most placental mammalian orders had originated by theend of the Cretaceous, 85-100 Ma [20], thus providingsuitable habitats for sucking lice to colonize. Since theirorigination, sucking lice have successfully diversified andthere now are more than 540 described species ofAnoplura worldwide that can be assigned to 50 genera in15 families [21-24]. Sucking lice parasitize members of12 of the 29 recognized mammalian orders, and aregenerally host-specific with families, genera, and speciesof lice parasitizing closely related hosts (Figure 1 andTable 1). Of the non-parasitized potential host taxa, 11mammalian orders are not known to be parasitized byany louse species, whereas representatives of the remain-ing six orders (Dasyuromorphia, Didelphimorphia,Diprotodontia, Paucituberculata, Proboscidea, and Pilosa)are parasitized only by chewing lice. Although cospecia-tion is perceived to be common between parasitic organ-isms and their hosts, given the current host associationsof sucking lice (Figure 1 and Table 1) it is unlikely thatparallel evolution has been the dominant process shapingthe radiation of this assemblage. Rather, it is probablethat the associations between sucking lice and theireutherian hosts involves a complex history of multiplecolonization events and small bouts of cospeciation, colo-nization failures, extinction events, and host switchesacross eutherian lineages [6,22,25].To date, there have been only two studies that have
attempted to reconstruct phylogenetic relationshipsamong anopluran families [21,22]. Kim and Ludwig [21]studied 15 taxa based on 22 morphological characterswhereas Kim [22] examined 47 taxa with 39 morpholo-gical characters. Both studies were based on small mor-phological datasets with few characters, the phylogeneticutility of which has been questioned [10]. While therehave been multiple studies examining anopluran rela-tionships within genera and among apparently closelyrelated genera and families [26-29], a higher-level phylo-geny of sucking lice is lacking. This study is the first touse molecular data and estimates of divergence times toelucidate the evolutionary history of this unique haema-tophagous group in relation to their mammalian hosts.
ResultsTaxon Sampling, Data Collection, and PhylogeneticAnalysesLice were obtained from 8 of the 15 sucking lousefamilies (Additional File 1). Unfortunately, louse datafrom the remaining 7 families could not be obtaineddue to specimen rarity (some anopluran families haveextremely narrow host ranges and some are monotypic,
Light et al. BMC Evolutionary Biology 2010, 10:292http://www.biomedcentral.com/1471-2148/10/292
Page 2 of 15
making collection almost impossible) or failure toamplify specimens in the laboratory. Because of PCRfailure as well as availability of data from GenBank,some molecular data could not be collected. The genes18S, EF-1a, and COI were not collected from 11, 7, and2 specimens, respectively, and, except for one sample ofPedicinus pictus (Pedicinus pictus 2), none of the speci-mens analyzed were missing data from more than onemolecular marker (Additional File 1).For each gene examined, phylogenetic analyses (MP,
ML, and Bayesian) yielded similar topologies, althoughnodal support and placement of outgroup taxa varieddepending on the gene (See Additional Files 2, 3, and4). Previous studies have noted that the third codonpositions of the mitochondrial COI gene tend to besaturated and homoplasious [13]. Saturation plots sup-ported slight saturation of third positions in the COIdata analyzed herein; however, phylogenetic analysesincluding and excluding third codon positions did notresult in significant differences to tree topologies orbranch lengths with the exception of placement of someof the outgroup taxa (data available upon request). Thethree genes used in this study were phylogeneticallyinformative at different areas of the phylogeny, similarto previous findings [28]. With 58, 126, and 220 parsi-mony informative sites for 18S, EF-1a, and COI, respec-tively, the nuclear genes (18S and EF-1a) providedslightly more resolution basally whereas the mitochon-drial marker, COI, provided more resolution at terminalnodes (See Additional Files 2, 3, and 4). Although basal
resolution was generally lacking and there were overalldifferences in resolution for each gene, topologies result-ing from phylogenetic analyses of individual genes werenot in strong conflict.Analysis of the 3-gene data set using MP, ML, or Baye-
sian approaches (including BEST and BEAST) resulted insimilar topologies, nodal support, and branch lengths(Bayesian phylogram shown in Figure 2). Analyses of the3-gene data sets seemed to merge different levels ofphylogenetic information from each gene resulting in amore resolved phylogeny overall. Bayes factors indicatedthat partitioning by gene and by codon within each pro-tein coding gene was preferred over a more simple ornon-partitioned scheme. Although highly partitioneddata sets tend to be preferred according to Bayes factors[30], partitioned and non-partitioned analyses yieldedsimilar topologies and support values. The species treeconstructed with BEST lacked resolution but did notconflict with individual gene trees or trees resulting fromconcatenated and partitioned phylogenetic analyses.Although there were some topological differencesdepending on the analysis and partitioning scheme, thesedifferences always involved clades that were not stronglysupported. One topological difference that appearedin some phylogenetic analyses was the placement ofthe mouse louse Polyplax serrata. Depending on the dataset examined (individual genes, 3-gene data set, etc.) andphylogenetic method, topological placement of P. serratavaried from being closely related to primate lice (Figure 2)to located near the base of the tree (See Additional Files 3
Figure 1 Hypothesized relationships among Anoplura families (and their host associations) redrawn from Kim [22].
Light et al. BMC Evolutionary Biology 2010, 10:292http://www.biomedcentral.com/1471-2148/10/292
Page 3 of 15
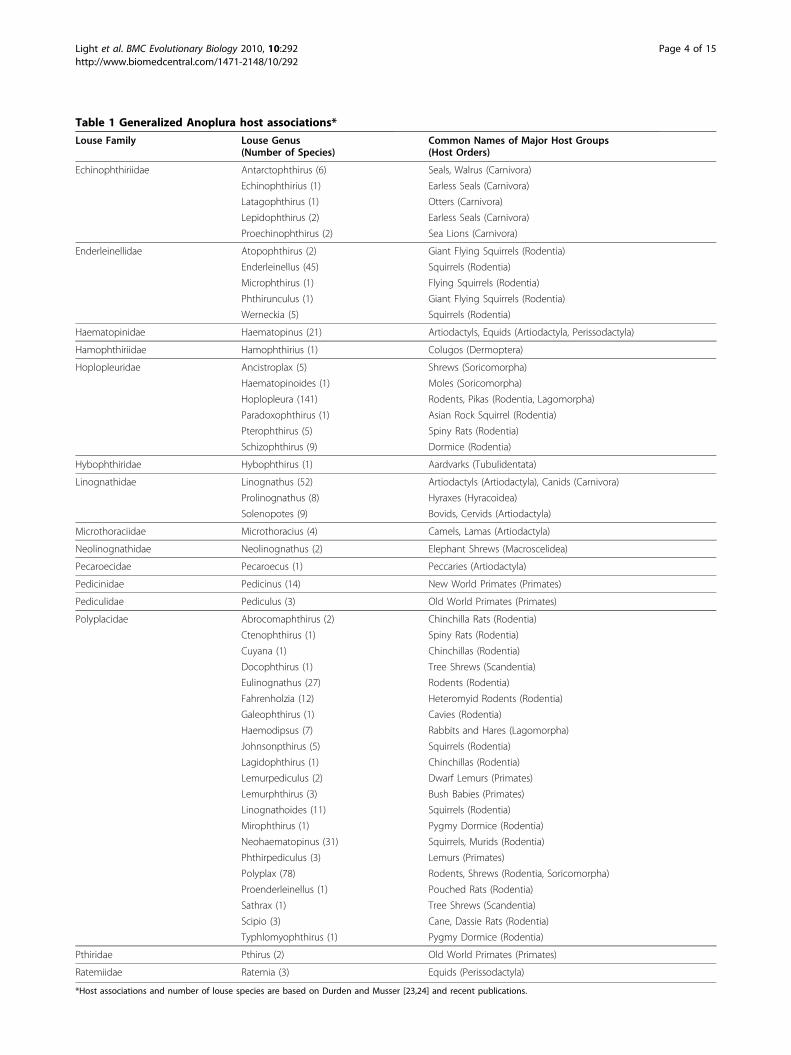
Table 1 Generalized Anoplura host associations*
Louse Family Louse Genus(Number of Species)
Common Names of Major Host Groups(Host Orders)
Echinophthiriidae Antarctophthirus (6) Seals, Walrus (Carnivora)
Echinophthirius (1) Earless Seals (Carnivora)
Latagophthirus (1) Otters (Carnivora)
Lepidophthirus (2) Earless Seals (Carnivora)
Proechinophthirus (2) Sea Lions (Carnivora)
Enderleinellidae Atopophthirus (2) Giant Flying Squirrels (Rodentia)
Enderleinellus (45) Squirrels (Rodentia)
Microphthirus (1) Flying Squirrels (Rodentia)
Phthirunculus (1) Giant Flying Squirrels (Rodentia)
Werneckia (5) Squirrels (Rodentia)
Haematopinidae Haematopinus (21) Artiodactyls, Equids (Artiodactyla, Perissodactyla)
Hamophthiriidae Hamophthirius (1) Colugos (Dermoptera)
Hoplopleuridae Ancistroplax (5) Shrews (Soricomorpha)
Haematopinoides (1) Moles (Soricomorpha)
Hoplopleura (141) Rodents, Pikas (Rodentia, Lagomorpha)
Paradoxophthirus (1) Asian Rock Squirrel (Rodentia)
Pterophthirus (5) Spiny Rats (Rodentia)
Schizophthirus (9) Dormice (Rodentia)
Hybophthiridae Hybophthirus (1) Aardvarks (Tubulidentata)
Linognathidae Linognathus (52) Artiodactyls (Artiodactyla), Canids (Carnivora)
Prolinognathus (8) Hyraxes (Hyracoidea)
Solenopotes (9) Bovids, Cervids (Artiodactyla)
Microthoraciidae Microthoracius (4) Camels, Lamas (Artiodactyla)
Neolinognathidae Neolinognathus (2) Elephant Shrews (Macroscelidea)
Pecaroecidae Pecaroecus (1) Peccaries (Artiodactyla)
Pedicinidae Pedicinus (14) New World Primates (Primates)
Pediculidae Pediculus (3) Old World Primates (Primates)
Polyplacidae Abrocomaphthirus (2) Chinchilla Rats (Rodentia)
Ctenophthirus (1) Spiny Rats (Rodentia)
Cuyana (1) Chinchillas (Rodentia)
Docophthirus (1) Tree Shrews (Scandentia)
Eulinognathus (27) Rodents (Rodentia)
Fahrenholzia (12) Heteromyid Rodents (Rodentia)
Galeophthirus (1) Cavies (Rodentia)
Haemodipsus (7) Rabbits and Hares (Lagomorpha)
Johnsonpthirus (5) Squirrels (Rodentia)
Lagidophthirus (1) Chinchillas (Rodentia)
Lemurpediculus (2) Dwarf Lemurs (Primates)
Lemurphthirus (3) Bush Babies (Primates)
Linognathoides (11) Squirrels (Rodentia)
Mirophthirus (1) Pygmy Dormice (Rodentia)
Neohaematopinus (31) Squirrels, Murids (Rodentia)
Phthirpediculus (3) Lemurs (Primates)
Polyplax (78) Rodents, Shrews (Rodentia, Soricomorpha)
Proenderleinellus (1) Pouched Rats (Rodentia)
Sathrax (1) Tree Shrews (Scandentia)
Scipio (3) Cane, Dassie Rats (Rodentia)
Typhlomyophthirus (1) Pygmy Dormice (Rodentia)
Pthiridae Pthirus (2) Old World Primates (Primates)
Ratemiidae Ratemia (3) Equids (Perissodactyla)
*Host associations and number of louse species are based on Durden and Musser [23,24] and recent publications.
Light et al. BMC Evolutionary Biology 2010, 10:292http://www.biomedcentral.com/1471-2148/10/292
Page 4 of 15
and 4). However, the phylogenetic position of P. serratanever received substantial support, and exclusion of thistaxon from phylogenetic analyses resulted in topologiesthat were not in conflict with the phylogeny shown inFigure 2.All phylogenetic trees reconstructed in our analyses
support a monophyletic Anoplura, sister to the chewinglouse suborder Rhychophthirina (Figure 2). Several ano-pluran families (Hoplopleuridae and Polyplacidae), gen-era (Hoplopleura and Pterophthirus), and species(H.ferrisi) were not monophyletic. Phylogenetic con-straints forcing the families and genera to be monophy-letic were significantly worse than the best tree (MLShimodaira-Hasegawa tests and examination of Bayesian
suboptimal trees; P < 0.05). The remaining louse familieswere all monophyletic, although it is important to notethat taxon sampling for many of these groups was low(Figure 2 and Additional Files 2, 3, and 4). Notably,primate lice (excluding the polyplacid louse Lemurpedi-culus verruculosus) belonging to the anopluran familiesPedicinidae, Pediculidae, and Pthiridae formed a highlysupported monophyletic group (Figure 2).For the most part, lice did not form monophyletic
groups according to host associations. There are twoclades of lice parasitizing artiodactyl mammals (Linog-nathus and Haematopinus, belonging to the familiesLinognathidae and Haematopinidae, respectively), prob-ably resulting from two independent colonization events
Figure 2 Bayesian phylogram of the Anoplura based on molecular data. This Bayesian phylogram is the result from the analysis of thecombined 3-gene data set partitioning the data by gene and by codon for the protein coding genes COI and EF-1a. Bayesian posteriorprobability greater than 0.95 and likelihood support values greater than 75 are indicated by the heavy branches. Taxon names correspond toAdditional File 1 and taxon colors correspond to louse family. Louse family and host associations are indicated to the right of each clade. Amonophyletic Anoplura is indicated by the arrow.
Light et al. BMC Evolutionary Biology 2010, 10:292http://www.biomedcentral.com/1471-2148/10/292
Page 5 of 15
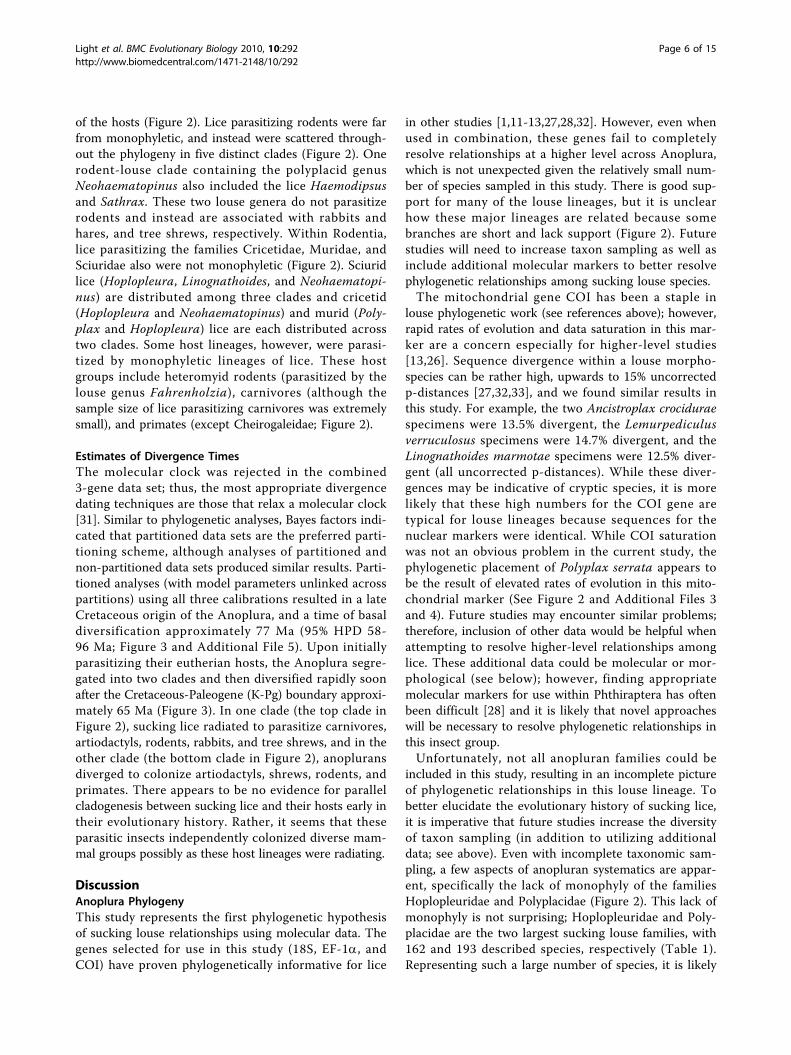
of the hosts (Figure 2). Lice parasitizing rodents were farfrom monophyletic, and instead were scattered through-out the phylogeny in five distinct clades (Figure 2). Onerodent-louse clade containing the polyplacid genusNeohaematopinus also included the lice Haemodipsusand Sathrax. These two louse genera do not parasitizerodents and instead are associated with rabbits andhares, and tree shrews, respectively. Within Rodentia,lice parasitizing the families Cricetidae, Muridae, andSciuridae also were not monophyletic (Figure 2). Sciuridlice (Hoplopleura, Linognathoides, and Neohaematopi-nus) are distributed among three clades and cricetid(Hoplopleura and Neohaematopinus) and murid (Poly-plax and Hoplopleura) lice are each distributed acrosstwo clades. Some host lineages, however, were parasi-tized by monophyletic lineages of lice. These hostgroups include heteromyid rodents (parasitized by thelouse genus Fahrenholzia), carnivores (although thesample size of lice parasitizing carnivores was extremelysmall), and primates (except Cheirogaleidae; Figure 2).
Estimates of Divergence TimesThe molecular clock was rejected in the combined3-gene data set; thus, the most appropriate divergencedating techniques are those that relax a molecular clock[31]. Similar to phylogenetic analyses, Bayes factors indi-cated that partitioned data sets are the preferred parti-tioning scheme, although analyses of partitioned andnon-partitioned data sets produced similar results. Parti-tioned analyses (with model parameters unlinked acrosspartitions) using all three calibrations resulted in a lateCretaceous origin of the Anoplura, and a time of basaldiversification approximately 77 Ma (95% HPD 58-96 Ma; Figure 3 and Additional File 5). Upon initiallyparasitizing their eutherian hosts, the Anoplura segre-gated into two clades and then diversified rapidly soonafter the Cretaceous-Paleogene (K-Pg) boundary approxi-mately 65 Ma (Figure 3). In one clade (the top clade inFigure 2), sucking lice radiated to parasitize carnivores,artiodactyls, rodents, rabbits, and tree shrews, and in theother clade (the bottom clade in Figure 2), anopluransdiverged to colonize artiodactyls, shrews, rodents, andprimates. There appears to be no evidence for parallelcladogenesis between sucking lice and their hosts early intheir evolutionary history. Rather, it seems that theseparasitic insects independently colonized diverse mam-mal groups possibly as these host lineages were radiating.
DiscussionAnoplura PhylogenyThis study represents the first phylogenetic hypothesisof sucking louse relationships using molecular data. Thegenes selected for use in this study (18S, EF-1a, andCOI) have proven phylogenetically informative for lice
in other studies [1,11-13,27,28,32]. However, even whenused in combination, these genes fail to completelyresolve relationships at a higher level across Anoplura,which is not unexpected given the relatively small num-ber of species sampled in this study. There is good sup-port for many of the louse lineages, but it is unclearhow these major lineages are related because somebranches are short and lack support (Figure 2). Futurestudies will need to increase taxon sampling as well asinclude additional molecular markers to better resolvephylogenetic relationships among sucking louse species.The mitochondrial gene COI has been a staple in
louse phylogenetic work (see references above); however,rapid rates of evolution and data saturation in this mar-ker are a concern especially for higher-level studies[13,26]. Sequence divergence within a louse morpho-species can be rather high, upwards to 15% uncorrectedp-distances [27,32,33], and we found similar results inthis study. For example, the two Ancistroplax crociduraespecimens were 13.5% divergent, the Lemurpediculusverruculosus specimens were 14.7% divergent, and theLinognathoides marmotae specimens were 12.5% diver-gent (all uncorrected p-distances). While these diver-gences may be indicative of cryptic species, it is morelikely that these high numbers for the COI gene aretypical for louse lineages because sequences for thenuclear markers were identical. While COI saturationwas not an obvious problem in the current study, thephylogenetic placement of Polyplax serrata appears tobe the result of elevated rates of evolution in this mito-chondrial marker (See Figure 2 and Additional Files 3and 4). Future studies may encounter similar problems;therefore, inclusion of other data would be helpful whenattempting to resolve higher-level relationships amonglice. These additional data could be molecular or mor-phological (see below); however, finding appropriatemolecular markers for use within Phthiraptera has oftenbeen difficult [28] and it is likely that novel approacheswill be necessary to resolve phylogenetic relationships inthis insect group.Unfortunately, not all anopluran families could be
included in this study, resulting in an incomplete pictureof phylogenetic relationships in this louse lineage. Tobetter elucidate the evolutionary history of sucking lice,it is imperative that future studies increase the diversityof taxon sampling (in addition to utilizing additionaldata; see above). Even with incomplete taxonomic sam-pling, a few aspects of anopluran systematics are appar-ent, specifically the lack of monophyly of the familiesHoplopleuridae and Polyplacidae (Figure 2). This lack ofmonophyly is not surprising; Hoplopleuridae and Poly-placidae are the two largest sucking louse families, with162 and 193 described species, respectively (Table 1).Representing such a large number of species, it is likely
Light et al. BMC Evolutionary Biology 2010, 10:292http://www.biomedcentral.com/1471-2148/10/292
Page 6 of 15
that these two louse families are taxonomic hodge-podges in need of additional examination and substan-tial revision. Revision of these two families (as well asgenera within both families) will not be possible withoutmore complete taxon sampling. At a lower taxonomiclevel, the results presented in the current study are inagreement with previous research that focused on smal-ler anopluran groups [27-29,34].Currently, the morphology-based classification of Ano-
plura detailed by Kim and Ludwig [21] and with modifica-tions by Durden and Musser [23] is followed by mostresearchers studying sucking lice. The molecular phylo-geny reported here (Figure 2) agrees with aspects of thismorphology-based classification such as the distinct
familial lineages of Anoplura associated with pinnipeds(anopluran family Echinophthiriidae), bovids (Linognathi-dae), bovids and suids (Haematopinidae), hominids (Pedi-culidae and Pthiridae) and cercopithecids (Pedicinidae).The differences between the two phylogenies (compareFigures 1 and 2) are intriguing; however, it is possible thatmorphological features may support some of the molecu-lar-based relationships proposed here. For example, themolecular phylogeny places the hoplopleurid genus Pter-ophthirus within the genus Hoplopleura (Figure 2). Mor-phologically, the only difference between these two generais the extension, to varying degrees, of the second pair ofparatergal plates on the abdomen. Perhaps the varyingextensions of the second pair or paratergal plates evolved
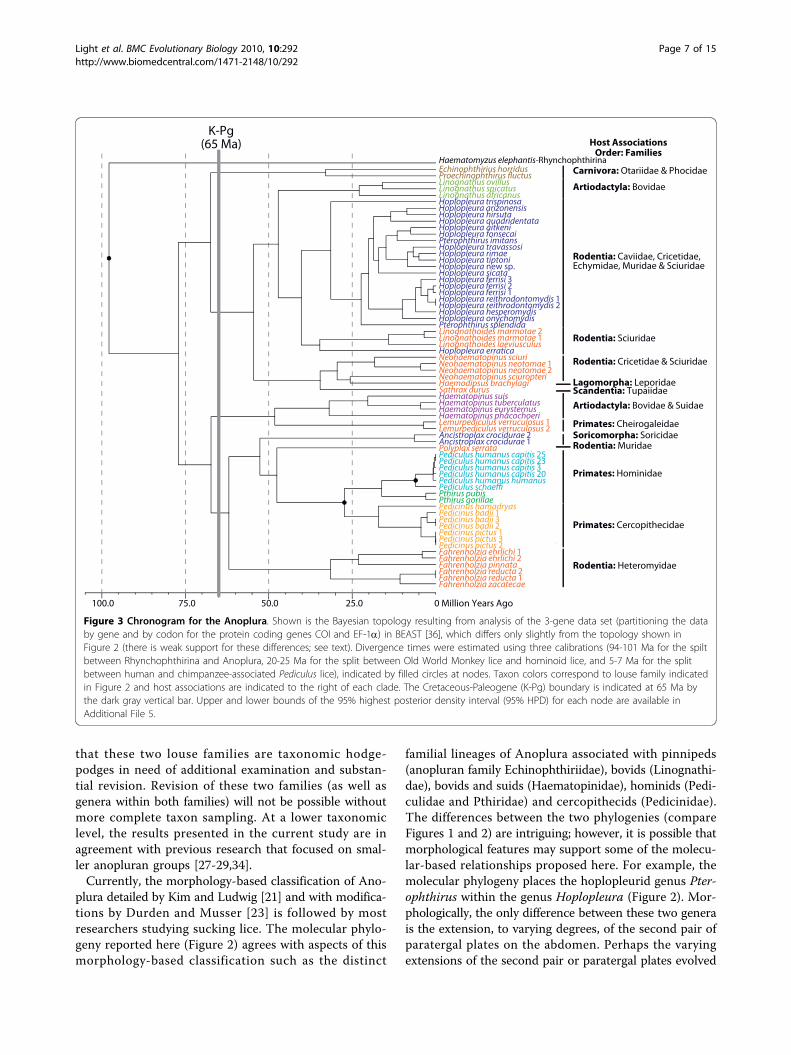
Figure 3 Chronogram for the Anoplura. Shown is the Bayesian topology resulting from analysis of the 3-gene data set (partitioning the databy gene and by codon for the protein coding genes COI and EF-1a) in BEAST [36], which differs only slightly from the topology shown inFigure 2 (there is weak support for these differences; see text). Divergence times were estimated using three calibrations (94-101 Ma for the spiltbetween Rhynchophthirina and Anoplura, 20-25 Ma for the split between Old World Monkey lice and hominoid lice, and 5-7 Ma for the splitbetween human and chimpanzee-associated Pediculus lice), indicated by filled circles at nodes. Taxon colors correspond to louse family indicatedin Figure 2 and host associations are indicated to the right of each clade. The Cretaceous-Paleogene (K-Pg) boundary is indicated at 65 Ma bythe dark gray vertical bar. Upper and lower bounds of the 95% highest posterior density interval (95% HPD) for each node are available inAdditional File 5.
Light et al. BMC Evolutionary Biology 2010, 10:292http://www.biomedcentral.com/1471-2148/10/292
Page 7 of 15
more than once within Hoplopleura and, as such, it maynot warrant the recognition of Pterophthirus as a distinctgenus [35]. The wide separation between hoplopleuridgenera Hoplopleura (including Pterophthirus) and Ancis-troplax in the molecular phylogeny (Figure 2) also hasmorphological ramifications. Kim and Ludwig [21] recog-nized two subfamilies within the Hoplopleuridae, the onlyanopluran family for which they recognized subfamilies.Members of the subfamily Hoplopleurinae (genera Hoplo-pleura, Pterophthirus, and Paradoxophthirus) have a largecontinuous sternite on abdomonal segment 2 that physi-cally connects with the corresponding paratergal plates,situated laterally. However, in members of the subfamilyHaematopinoidinae (genera Ancistroplax, Haematopi-noides, and Schizophthirus), the abdominal segment twosternite is clearly divided medially resulting in two sepa-rate plates. It is feasible that this morphological differenceactually defines two distinct families rather than subfami-lies as supported by the large separation between the twoclades in Figure 2. As such, it would be beneficial forfuture researchers to include other relevant hoplopleuridgenera in their molecular phylogenetic reconstructions ofAnoplura evolutionary history to determine if the twoHoplopleura subfamilies remain genetically distinct.The most obvious differences between the morpholo-
gical (Figure 1) and molecular (Figure 2) anopluran phy-logenies involve the family Polyplacidae, which ismonophyletic based on morphological data but para-phyletic based on molecular data. Interestingly, themorphological definition of the Polyplacidae is quitevariable. Notwithstanding the features they share withall other anopluran families, the only morphologicalcharacters that are common to all members of the Poly-placidae, as currently recognized, are the presence of 5antennal segments, 6 pairs of spiracles on the abdomen,small forelegs, and the absence of a notal pit on thethorax [21]. However, none of these characters aresynapomorphies for Polyplacidae. Statements reflectingthe morphological variability of Polyplacidae in currentdescriptions include: “antennae...usually sexuallydimorphic,” “thorax with mesothoracic phragma usuallypresent,” “abdomen with paratergites usually highlydeveloped...and occasionally represented by small scler-ites or completely lacking,” “tergal and sternal platesusually highly developed and at times reduced or lack-ing,” “male...with variously shaped basal apodeme, para-meres and pseudopenis,” and “female with...spermathecausually indistinct” [21]. This extreme morphologicalvariability within the Polyplacidae may actually encom-pass more than one family as suggested by the separatepolyplacid lineages shown in Figure 2. The moleculardata suggest that rigorous taxonomic reassessment ofwhat is currently treated as Polyplacidae is warranted.In fact, all five of the separate polyplacid lineages shown
in Figure 2 correspond with distinct morphologicalcharacters that could be used to define separate familiesand other suprageneric taxa if future taxonomic reeva-luation supports such action.Without complete taxonomic sampling at the family
level, it is difficult to compare Kim’s [22] morphologicalhypothesis of anopluran relationships (Figure 1) to themolecular phylogeny (Figure 2). A few additional differ-ences, however, are apparent. For one, morphological datasupport a sister relationships between Pedicinidae andPthiridae, and these two louse families are closely relatedto Pecaroecidae, Haematopinidae, and Hybophthiridae, allto the exclusion of Pediculidae [22]. Molecular data, how-ever, support monophyly of all non-polyplacid primate lice(families Pedicinidae, Pediculidae, and Pthiridae) with arelatively distant relationship to the Haematopinidae(Figure 2). Monophyly of these three primate lousefamilies has been found in previous molecular studies[28,29]; however, molecular data from the familiesHybophthiridae, and Pecaroecidae will be needed for amore rigorous comparison to the morphological study ofKim [22]. Interestingly, Kim [22] noted a relatively closerelationship among the families Hoplopleuridae, Linog-nathidae, and Polyplacidae (Figure 1). The molecular datapresented herein also support a close relationship amongthese three families (or at least specific clades withinHoplopleuridae and Polyplacidae; Figure 2) and it will beinteresting to see if these relationships hold with additionalinvestigations. Although a more comprehensive morpho-logical study is currently underway (Smith and Light,unpubl. data), additional molecular data and better taxonsampling will be necessary to properly compare morphol-ogy and molecules and it is likely that these data will bothagree that substantial taxonomic revision of Anoplura willbe necessary.
Host Associations and the Origin of AnopluraUsing a Bayesian approach implemented in the programBEAST v1.5.3 [31,36], we estimated a late Cretaceousdiversification of sucking lice (approximately 77 Ma;Figure 3 and Additional File 5). In this analysis, we uti-lized the 3-gene data set and three calibration points,and we allowed substitution and clock models to beunlinked. Divergence time estimates varied, however, ifclock models or clock and substitution models werelinked across the three data partitions, and when cali-bration points were not used concurrently or used ashard bounds. When clock models or clock and substitu-tion models were linked across the three data partitions,estimates of divergence times tended to be much morerecent, with an Eocene or Paleocene origin of theAnoplura, approximately 55 Ma. However, linking sub-stitution or clock models across partitioned data sets isthe equivalent of performing analyses on concatenated
Light et al. BMC Evolutionary Biology 2010, 10:292http://www.biomedcentral.com/1471-2148/10/292
Page 8 of 15
data sets (i.e., not applying different models of evolutionto each partition). Since Bayes Factors comparisons per-formed herein support partitioned analyses, we concen-trate our discussion below on the estimates obtainedwith unlinked model parameters.Of our three calibration points, one was located
basally whereas the other two were located more term-inally on the louse phylogeny (Figure 3). Previousstudies have found that the use of single calibrationpoints, especially when placed either basally or termin-ally, can result in erroneous estimations of divergencetimes [28,37-39]. Similarly, our analyses using only thebasal calibration resulted in overestimates of ages atterminal nodes and analyses using only the terminal pri-mate-louse calibrations resulted in underestimates of theages at basal nodes. In fact, these over- and underesti-mates were extreme, 63 Ma for the split between OldWorld and hominoid-associated lice, and 33 Ma for theage of Anoplura, respectively. Other studies have foundthat use of hard bounds is often ill-advised (especiallywhen there is a lack of confidence of the exact ages ofthe calibration) and that fossils provide poor hard maxi-mum bounds [38,40,41]. Analyses using only upperbounds also resulted in underestimates for the age ofAnoplura, thus providing additional support for thesimultaneous use of the three calibration points. Furtheranalyses incorporating increased taxon sampling andadditional calibrations (if available) will be necessary totest the hypotheses presented here.Because the fossil record for lice is so poor
[10,17,18,42], our calibrations were based on well-documented cospeciation events between these para-sites and their mammalian hosts. The primate-lousecalibrations have been used in several previous studies[28,29] and have generally proven useful to betterunderstand louse evolutionary history. For a basalcalibration representing the split between Rhynch-ophthirina and Anoplura, we chose the time of basaldiversification in placental mammals from Bininda-Emonds et al. [20] because we believed it reasonablethat sucking lice could not have diversified until theyhad appropriate hosts (i.e., placental mammals) tocolonize [5,20]. Additionally, the recent discovery oftwo louse fossils at 44 Ma [17] and 100 Ma [18] addsfurther weight to support an ancient origin of lice, asdoes results of a recent study examining diversificationtimes across all suborders of lice utilizing these fossils.This study found that sucking lice diversified approxi-mately 75 Ma [Smith VS, Ford T, Johnson KP, JohnsonPCD, Yoshizawa K, Light JE: Multiple lineages of licepass through the K-Pg boundary, Submitted]. Thisresult is similar to our own findings, further support-ing use of a basal calibration point of 94-109 Ma. It isimportant to note that because some of the outgroup
taxa used in this study (e.g., Bovicola, Felicola, andNeotrichodectes) also parasitize eutherian mammals,the Bininda-Emonds et al. [20] calibration could havebeen placed at the root of the phylogeny. However,these chewing lice are recently derived lineages withinIschnocera and likely radiated as a result of a recenthost switch to eutherian mammals [43].Soon after colonizing their hosts, sucking lice appear to
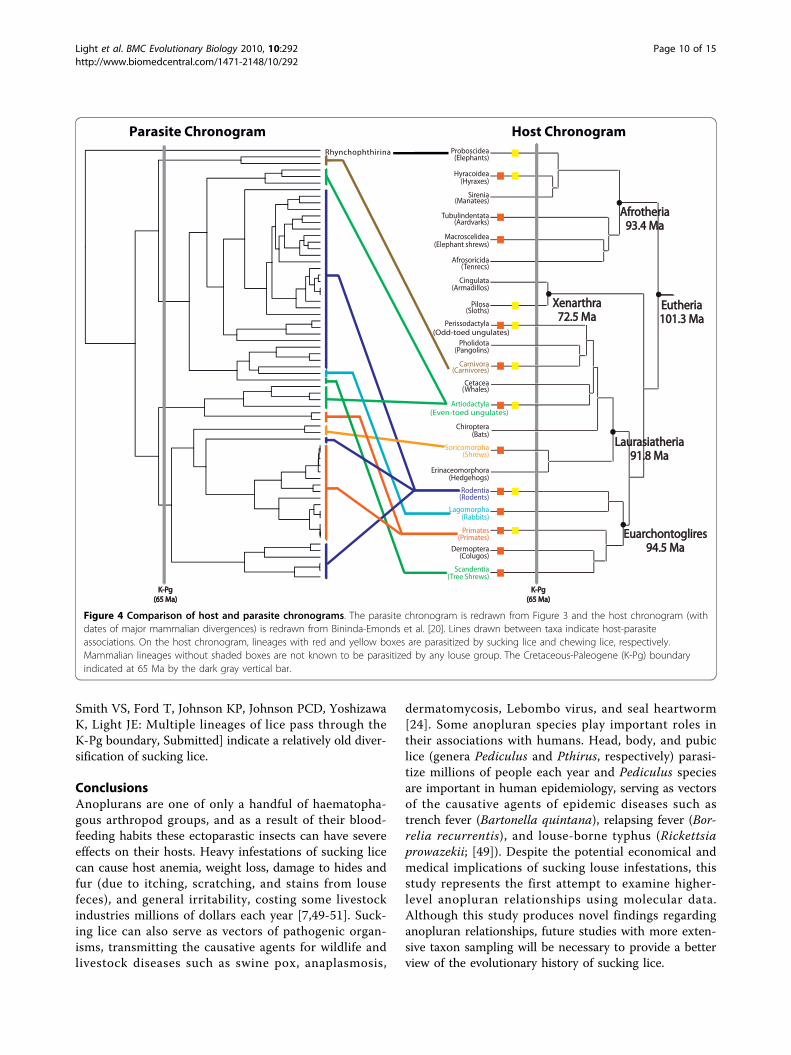
have diversified rapidly, parasitizing multiple mammalianorders and families soon after the Cretaceous-Paleogene(K-Pg) boundary, approximately 65 Ma (Figure 3). Twomajor louse clades formed relatively early in anopluranevolutionary history, and these two clades parasitizemembers of a diverse assortment of mammal orders: onelouse clade parasitizes Artiodactyla, Carnivora, Lagomor-pha, Rodentia, and Scandentia, whereas the other cladeparasitizes Artiodactyla, Primates, Rodentia, and Sorico-morpha (Figure 3). These host groups are often distantlyrelated, and thus the louse phylogeny bears little similar-ity to the host tree (Figure 4). Furthermore, several mam-mal groups, specifically artiodactyls, rodents, andprimates, are parasitized by multiple, distantly relatedlouse lineages (Figures 3 and 4). In fact, the majority ofAnoplura parasitize these host groups (approximately90%; Table 1). Thus, it is likely that the associationsbetween sucking lice and eutherian mammals are theresult of a complex history of host switching and extinc-tion events both early and late during their evolutionaryhistory. Host switching has been documented in the lit-erature for sucking lice [44] as well as other ectoparasites[45-47]. In this study, clear instances of recent hostswitching include Lemurpediculus parasitizing mouselemurs and Ancistroplax parasitizing shrews. These twolouse genera originated 5-10 Ma and their hosts, in con-trast, diverged 35 Ma (Cheirogaleidae) and 50 Ma [20],respectively. Cospeciation, however, also has played a sig-nificant role in shaping associations between sucking liceand their mammalian hosts, especially at lower taxo-nomic levels. Examples include squirrels and their lice[22,25], primates and lice belonging to the families Pedi-cinidae, Pediculidae, and Pthirdae [29], and heteromyidrodents and Fahrenholzia lice [20,26,48]. Interestingly,this study finds that Fahrenholzia lice diverged approxi-mately 31.6 Ma (95% HPD 49-16.6 Ma; Figure 3), a rangethat encompasses the divergence of their heteromyidhosts [48], further supporting cospeciation in thisrodent-louse assemblage [26]. It is likely that additionalinstances of cospeciation will be revealed as more ano-pluran groups are examined. Given the lack of concor-dance between host and parasite trees (Figure 4), it ispossible that anoplurans may have colonized their hostsand diversified after the initial radiation of eutherianmammals. Additional data and analyses will be necessaryto test this possibility as all current data [this study and
Light et al. BMC Evolutionary Biology 2010, 10:292http://www.biomedcentral.com/1471-2148/10/292
Page 9 of 15
Smith VS, Ford T, Johnson KP, Johnson PCD, YoshizawaK, Light JE: Multiple lineages of lice pass through theK-Pg boundary, Submitted] indicate a relatively old diver-sification of sucking lice.
ConclusionsAnoplurans are one of only a handful of haematopha-gous arthropod groups, and as a result of their blood-feeding habits these ectoparastic insects can have severeeffects on their hosts. Heavy infestations of sucking licecan cause host anemia, weight loss, damage to hides andfur (due to itching, scratching, and stains from lousefeces), and general irritability, costing some livestockindustries millions of dollars each year [7,49-51]. Suck-ing lice can also serve as vectors of pathogenic organ-isms, transmitting the causative agents for wildlife andlivestock diseases such as swine pox, anaplasmosis,
dermatomycosis, Lebombo virus, and seal heartworm[24]. Some anopluran species play important roles intheir associations with humans. Head, body, and pubiclice (genera Pediculus and Pthirus, respectively) parasi-tize millions of people each year and Pediculus speciesare important in human epidemiology, serving as vectorsof the causative agents of epidemic diseases such astrench fever (Bartonella quintana), relapsing fever (Bor-relia recurrentis), and louse-borne typhus (Rickettsiaprowazekii; [49]). Despite the potential economical andmedical implications of sucking louse infestations, thisstudy represents the first attempt to examine higher-level anopluran relationships using molecular data.Although this study produces novel findings regardinganopluran relationships, future studies with more exten-sive taxon sampling will be necessary to provide a betterview of the evolutionary history of sucking lice.
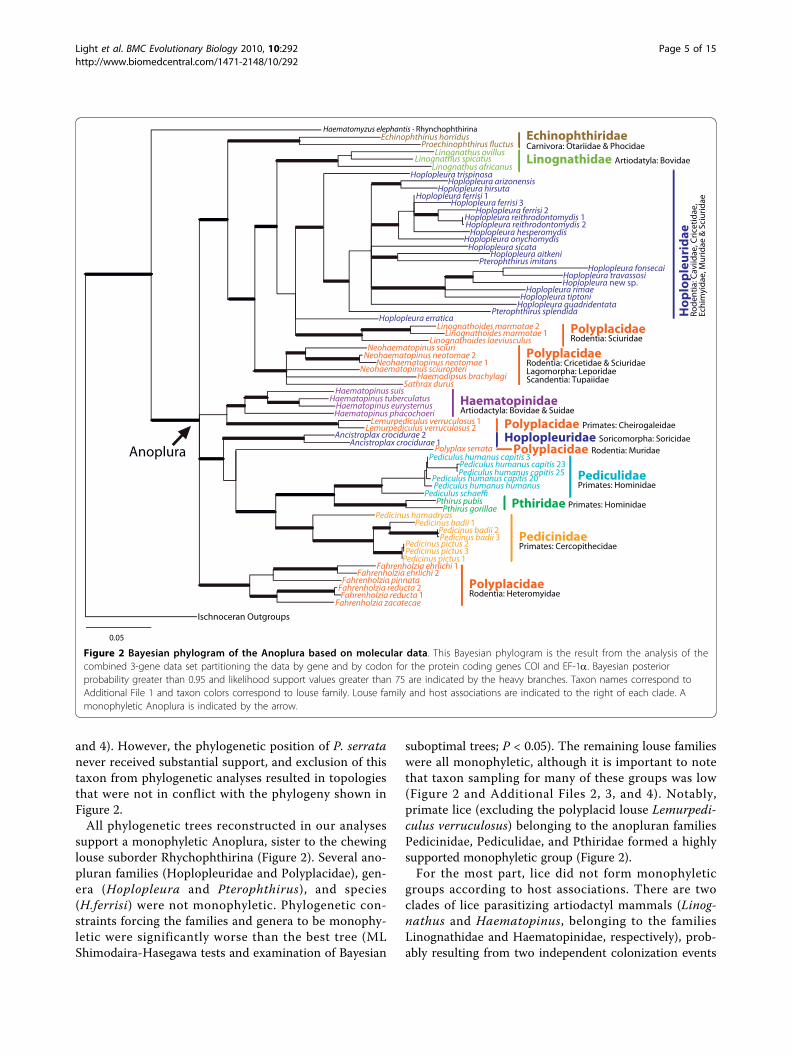
Figure 4 Comparison of host and parasite chronograms. The parasite chronogram is redrawn from Figure 3 and the host chronogram (withdates of major mammalian divergences) is redrawn from Bininda-Emonds et al. [20]. Lines drawn between taxa indicate host-parasiteassociations. On the host chronogram, lineages with red and yellow boxes are parasitized by sucking lice and chewing lice, respectively.Mammalian lineages without shaded boxes are not known to be parasitized by any louse group. The Cretaceous-Paleogene (K-Pg) boundaryindicated at 65 Ma by the dark gray vertical bar.
Light et al. BMC Evolutionary Biology 2010, 10:292http://www.biomedcentral.com/1471-2148/10/292
Page 10 of 15
Our analyses indicate that sucking lice diversified inthe late Cretaceous, approximately 77 Ma, and soonafter the Cretaceous-Paleogene boundary approximately65 Ma, these lice proliferated rapidly to parasitize multi-ple mammalian orders and families (Figure 3). Thesedates are in agreement with mammalian evolutionaryhistory: all modern mammal orders are hypothesized tohave diverged by 75 Ma [20] thus providing suitablehabitat for the colonization and radiation of suckinglice. Despite the concordant timing of diversificationevents early in the association between anoplurans andmammals, there is substantial conflict between the hostand parasite phylogenies (Figure 4). This conflict may bebecause the free-living psocopteran ancestors of licecolonized and began feeding on the blood of their verte-brate hosts several times as host orders were divergingbefore the K-Pg boundary [20,52]. Additionally, hostand parasite topological differences may be the result ofa complex history of host switching and extinctionevents that occurred throughout the evolutionary asso-ciation between sucking lice and their mammalian hosts.For example, multiple mammal lineages that radiatedduring the Early Tertiary (60-65 Ma) are now extinct asare their ectoparasitic lice (if present; although some ofthese lice may have successfully switched to an extanthost). Furthermore, many of the modern mammalfamilies did not diversify until recently, during the lateEocene to the Miocene (approximately 10-40 Ma), thusproviding ample new habitats for lice to colonize.It is unlikely that there are any ectoparasite groups
(including lice) that tracked the early and rapid radiationof eutherian mammals (red and yellow boxes in Figure 4).This is in some ways unfortunate because ectoparasitescould potentially be used as independent data points toinfer host evolutionary history, something that could havebeen valuable to help elucidate remaining questionsregarding the mammal phylogenetic tree [53,54]. Giventhe multiple host radiations and host extinction events[20], a combination of historical events such as extinction,host switching, and cospeciation likely dominated the evo-lutionary association between ectoparasites and theirmammalian hosts. The sucking louse data presentedherein support this scenario, and we expect that additionaldata from this group as well as other parasite lineages tofurther elucidate the complicated evolutionary historyshared between parasites and their mammalian hosts.
MethodsTaxon Sampling and Data CollectionData from 65 anopluran taxa (including 22 representa-tives from GenBank) representing 8 families and 48 spe-cies were included in the molecular analysis (AdditionalFile 1). Seven outgroup taxa, representing the chewinglouse suborders Rhynchophthirina and Ischnocera, also
were included in the analysis. DNA was isolatedfrom louse specimens using the DNAeasy Tissue Kit(QIAGEN Inc., Valencia, California) using louse specificprotocols [11,55]. After DNA extraction, lice weremounted on slides and retained as vouchers. Voucherspecimens are deposited in the Texas A&M UniversityInsect Collection, voucher number 684.Due to the large number of taxa obtained from
previous studies, we focused our laboratory work onthree genes that are well represented in GenBank. Por-tions of the nuclear 18S rRNA (18S; 460 or 508 basepairs [bp] depending on alignment methodology, seebelow) and elongation factor 1 alpha (EF-1a; 345 bp)genes and the mitochondrial cytochrome c oxidase sub-unit 1 (COI; 381 bp) gene were amplified and sequencedusing primers NS1 and NS2a [12], EF1For3 and Cho10[56], and L6625 and H7005 [57], respectively. Double-stranded PCR amplifications, PCR purification, andsequencing of these genes were undertaken followingprotocols detailed in Light and Reed [28]. Sequenceswere edited using Sequencher v. 4.2.2 (Gene CodesCorporation, Ann Arbor, Michigan) and primersequences were removed and sequences trimmed inreference to the translated protein sequence usingSe-AL v2.01a11 [58] and MacClade 4.0 [59]. The proteincoding genes EF-1a and COI were aligned by eye usingSe-Al v2.0a11 [58] and louse 18S rRNA sequences werealigned using CLUSTAL W [60] and MUSCLE [61].Phylogenetic analyses of CLUSTAL W and MUSCLEalignments of 18S yielded similar topologies and branchlengths. Results presented herein rely solely on theMUSCLE 18S alignment (results based on CLUSTALalignments are available upon request). Longersequences obtained from GenBank were pruned formaximum overlap with sequences generated herein. Allsequences are available in GenBank (Additional File 1)and alignments are available on TreeBase (http://purl.org/phylo/treebase/phylows/study/TB2:S10679; Submis-sion ID 10669).
Phylogenetic AnalysisPhylogenetic analyses of individual and combined geneswere performed using maximum parsimony (MP), maxi-mum likelihood (ML) and Bayesian approaches. Equallyweighted MP searches were performed with 10 randomaddition replicates and tree bisection-reconnectionbranch swapping using PAUP*4.0b10 [62]. To assessnodal support, nonparametric bootstrap analyses wereperformed [200 pseudoreplicates and 10 randomsequence additions; [63]]. To generate the best ML andBayesian trees, Modeltest [64] and MrModelTest [65]were used to examine models of nucleotide substitution(56 and 24, respectively) and to choose a best-fit modelof sequence evolution [66]. Models of evolution
Light et al. BMC Evolutionary Biology 2010, 10:292http://www.biomedcentral.com/1471-2148/10/292
Page 11 of 15
providing the best approximation of the data using thefewest parameters were chosen for subsequent analysesaccording to the Akaike Information Criterion [67,68].The general time reversible (GTR) model, includingamong-site rate variation (G) and invariable sites [I;[69,70]] was chosen as the best model of evolution inboth ModelTest and MrModelTest for the 18S rRNA,EF-1a (three codon positions combined and the thirdcodon position), COI (three codon positions combinedand the first and second codon positions), and the com-bined 3-gene data set. The GTR+G, SYM, and HKY+Gmodels were chosen as the best model of evolution forthe first EF-1a codon position, second EF-1a codonposition, and third COI codon position, respectively.Full heuristic ML searches were conducted using thebest-fit model in PAUP* 4.0b10 [62] and GARLI [71],and full heuristic ML bootstrap (100 pseudoreplicates)searches were conducted using the best-fit model inGARLI [71].Bayesian phylogenetic analyses were performed in
MrBayes 3.12 [72]. Model parameters were treated asunknown variables with uniform priors and were esti-mated as part of the analysis. Bayesian analyses wereinitiated from random starting trees, run for 10 milliongenerations with 4 incrementally heated chains [72], andsampled at intervals of 1000 generations. Two indepen-dent Bayesian analyses were run to avoid entrapment onlocal optima, and log-likelihood scores were comparedfor convergence so that burn-in generations (the first3000 trees) could be discarded. Tracer v1.4 [73] wasused to evaluate stability of all parameter estimates fol-lowing removal of burn-in generations.The 3-gene data set also was examined with parti-
tioned Bayesian phylogenetic analyses. Individual genesand codon positions were defined as partitions a priori,and each partition was assigned its own substitutionmodel according to MrModelTest (see above). Partition-ing schemes included non-partitioned, partitioned bygene, and partitioned by gene and by codon position ofthe protein coding genes COI and EF-1a. PartitionedBayesian analyses were performed as described above.Bayesian partitioning schemes were compared usingBayes factors [74], which were computed using the har-monic means of the likelihoods calculated from thesump command within MrBayes. A difference of 2lnBayes factor > 10 was used as the minimum value todiscriminate between analysis schemes [30,75].Bayesian Estimation of Species Trees [BEST; [76,77]]
was used to simultaneously estimate gene and speciestrees while allowing for independent evolutionary pro-cesses for each locus. This type of approach is usefulwhen multiple molecular markers are being used toinfer a species tree and, if there are short branch lengthsin the species tree, gene trees may not match the species
tree resulting in incorrect inferences of species relation-ships [76,78]. Because missing data in individual genetrees can result in analytical complications [79], all taxathat were missing data from an entire gene region wereremoved prior to BEST analyses. To aid with computa-tional time and to focus on the ingroup taxa, all out-group taxa except for Haematomyzus elephantis wereremoved from the data set resulting in a total of 47 indi-viduals analyzed. BEST analyses were initiated from ran-dom starting trees, run for 60 million generations andsampled at intervals of 1000 generations. The genemutation prior and the prior distribution for the effec-tive population size parameter were set at (0.5, 1.5) and0.05, respectively. The posterior distribution of speciestrees (post burn-in) was summarized with a 50% major-ity-rule consensus tree to obtain posterior probabilityvalues for species relationships.Alternative phylogenetic hypotheses were compared
statistically using the Shimodaira-Hasegawa tests asimplemented in PAUP*4.0b10 [80-82]. Additionally, sub-optimal trees from the Bayesian non-partitioned andpartitioned analyses were examined to assess alternativephylogenetic hypotheses. The frequency of the Markovchain Monte Carlo trees in agreement with an alterna-tive hypothesis equals the probability of that alternativehypothesis being correct [83]. The probability of treesagreeing with alternative subfamily hypotheses was cal-culated by applying constraint-based filter trees imple-mented in PAUP*4.0b10 [83].
Estimates of Divergence TimesDivergence times of the sucking louse 3-gene data setwere estimated using the Bayesian approach implemen-ted in BEAST v1.5.3 [31,36]. BEAST uses a Bayesianrelaxed molecular clock while incorporating tree uncer-tainty in the MCMC process to infer divergence times.Before estimating divergence times, a likelihood ratio testwas performed on the louse 3-gene data set using PAUP*4.0b10 [62] to determine if the sequence data departedsignificantly from clocklike behavior. In BEAST, a Yuleprocess speciation prior and an uncorrelated lognormalmodel of rate variation were implemented in each analy-sis [31]. Posterior probability distributions of node ageswere obtained for the 3-gene alignment with analysesperformed in a concatenated and partitioned framework(all model parameters were unlinked across partitions).Best-fit models of nucleotide substitution for each dataset were the same as those identified above as part of thephylogenetic analyses using MrModelTest [65]. Twoseparate MCMC analyses were run for 30,000,000 gen-erations (burnin 10%) with parameters sampled every1000 steps. Independent runs were combined usingLogCombiner v.1.5.3 [36]. Tracer v1.5 [73] was used tomeasure the effective sample size of each parameter
Light et al. BMC Evolutionary Biology 2010, 10:292http://www.biomedcentral.com/1471-2148/10/292
Page 12 of 15
(all resulting effective sample sizes exceeded 100) andcalculate the mean and upper and lower bounds of the95% highest posterior density interval (95% HPD) fordivergence times. Tree topologies were assessed usingTreeAnnotator v.1.5.3 [36] and FigTree v.1.3.1 [84].Bayes factors of non-partitioned and partitioned 3-genedata sets were assessed using Tracer v1.5 [73].Unfortunately, fossil calibrations for lice are lacking
[10,17,18]. But, given their parasitic nature and the poten-tial ancient origin of lice considering the recentlydescribed 100 Ma book louse fossil [Liposcelididae; [18]],it is reasonable to assume that sucking lice originated ontheir mammalian hosts by the end of the Cretaceous, 85-100 Ma [5,20]. Bininda-Emonds et al. [20] determined thattime of basal diversification in placental mammals was 94-109 Ma; therefore, a calibration with a mean of 101 (andstandard deviation of 3.5) was used to represent the basalsplit between the Rhychophthirina and Anoplura. Addi-tionally, some studies have documented cospeciation (i.e.,roughly contemporaneous speciation events) betweensucking lice and their hosts, specifically primates and pri-mate lice [29]. The sucking louse tree can therefore becalibrated by placing host fossil dates on the correspond-ing node of the louse tree. Corresponding to the splitbetween Old World monkeys and apes [85], a calibrationof 20-25 Ma was used to represent the split between OldWorld monkey lice (Pedicinus spp.) and hominoid-asso-ciated lice [29]. Furthermore, a calibration of 5-7 Ma(corresponding to the split between chimpanzees andhumans) was used to represent the split between humanPediculus lice (Pediculus humanus) and the chimpanzeelouse (Pediculus schaeffi; [86]). These three calibrationpoints were used in combination, as well as individually, tocross-check the other calibration points, in the divergencedating analyses. Node constraints were assigned a normalprior distribution, with the standard deviations encom-passing the minimum and maximum age of each calibra-tion. Utilizing a normal distribution allows for uncertaintyin the calibration estimates [87], which is important forour data because calibrations were taken from the hostfossil record rather than from louse fossils.
Additional material
Additional file 1: Louse taxa used in this study (arranged by family),host associations, and GenBank accession numbers.
Additional file 2: Bayesian phylogram of the Anoplura based on the18S rRNA gene. Bayesian posterior probability greater than 0.95 areindicated above the nodes. Taxon names correspond to Additional File 1and taxon colors correspond to louse family.
Additional file 3: Bayesian phylogram of the Anoplura based on thenuclear EF-1a gene. Bayesian posterior probability greater than 0.95 areindicated above the nodes. Taxon names correspond to Additional File 1and taxon colors correspond to louse family. This Bayesian phylogram isthe result from a partitioned analysis with each codon positionrepresenting a distinct partition.
Additional file 4: Bayesian phylogram of the Anoplura based on themitochondrial COI gene. Bayesian posterior probability greater than0.95 are indicated above the nodes. Taxon names correspond toAdditional File 1 and taxon colors correspond to louse family. ThisBayesian phylogram is the result from a partitioned analysis with eachcodon position representing a distinct partition.
Additional file 5: Chronogram for the Anoplura with the 95%highest posterior density interval indicated for each node. Bayesianchronogram resulting from analysis of the 3-gene partitioned data set inBEAST. This figure is identical to Figure 3 with the exception of includingthe upper and lower bounds of the 95% highest posterior densityinterval (95% HPD) for each node.
AcknowledgementsWe thank A. Abramov, L. Barrow, M. Branham, S. Bush, J. Cook, J. Demboski,T. Manning, P. Myers, R. Ream, J. Skinner, N. Whiteman, and S. Zohdy forproviding samples of lice to use in this study. Many of the samples used inthis study were collected as part of JEL’s dissertation research (supported byan NSF Dissertation Improvement Grant; DEB 0308878). M. Branham and J.Zaspel provided microscopical assistance. S. Jansa offered helpful feedback,and members of the Light and G. Voelker labs at Texas A&M Universitymade valuable comments on earlier drafts of the manuscript. We thank M.Gitzendanner and the Florida Museum of Natural History PhyloinformaticsCluster for High Performance Computing in the Life Sciences and theUniversity of Florida Genetics Institute’s Fisher Bioinformatics Cluster foranalytical support. Four anonymous reviewers offered helpful comments andsuggestions that greatly improved the manuscript. This is publicationnumber 184 of the Center for Biosystematics and Biodiversity, Texas A&MUniversity. This work was supported by a grant from the National ScienceFoundation (DEB 0717165) to JEL, VSS, LAD, and DLR.
Author details1Department of Wildlife and Fisheries Sciences, Texas A&M University,College Station, Texas 77843, USA. 2Florida Museum of Natural History,University of Florida, Gainesville, Florida 32611, USA. 3EntomologyDepartment, Natural History Museum, London SW7 5BD, UK. 4Department ofBiology, University of Florida, Gainesville, Florida 32611, USA. 5Department ofBiology, Georgia Southern University, Statesboro, Georgia 30460, USA.
Authors’ contributionsJEL conceived the study, carried out molecular studies and analyses, andwrote the manuscript. VSS and JMA collected molecular data and helped todraft the manuscript. LAD contributed samples to the study and helped todraft the manuscript. DLR participated in conceiving the study and draftingthe manuscript. All authors read and approved the final manuscript.
Received: 17 May 2010 Accepted: 22 September 2010Published: 22 September 2010
References1. Johnson KP, Yoshizawa K, Smith VS: Multiple origins of parasitism in lice.
Proc R Soc Lond Ser B-Biol Sci 2004, 271:1771-1776.2. Marshall AG: The Ecology of Ectoparasitic Insects. London: Academic Press
1981.3. Snodgrass RE: The feeding apperatus of biting and sucking insects
affecting man and animals. Smithsonian Miscellaneous Collections 1944,104:1-113.
4. Hopkins GHE: The host-associations of the lice of mammals. P Zool SocLond 1949, 119:387-581.
5. Lyal CHC: Phylogeny and classification of the Psocodea, wtih particularreference to the lice (Psocodea, Phthiraptera). Syst Entomol 1985,10:145-165.
6. Kim KC: Evolution and host associations of Anoplura. In Coevolution ofParasitic Arthropods and Mammals. Edited by: Kim KC. New York: John Wileyand Sons; 1985:197-231.
7. Lehane MJ: The Biology of the Blood Sucking Insects. New York:Cambridge University Press, 2 2005.
Light et al. BMC Evolutionary Biology 2010, 10:292http://www.biomedcentral.com/1471-2148/10/292
Page 13 of 15
8. Pearlman JV: Some African Psocoptera found on rats. Entomologist 1960,92:246-250.
9. Mockford EL: Some Psocoptera from plumage of birds. Proc Entomol SocWash 1967, 69:307-309.
10. Grimaldi D, Engel MS: The Evolution of the Insects. New York: CambridgeUniversity Press 2005.
11. Cruickshank RH, Johnson KP, Smith VS, Adams RJ, Clayton DH, Page RDM:Phylogenetic analysis of partial sequences of elongation factor 1 alphaidentifies major groups of lice (Insecta : Phthiraptera). Mol PhylogenetEvol 2001, 19:202-215.
12. Barker SC, Whiting M, Johnson KP, Murrell A: Phylogeny of the lice(Insecta, Phthiraptera) inferred from small subunit rRNA. Zool Scr 2003,32:407-414.
13. Yoshizawa K, Johnson KP: How stable is the “polyphyly of lice” hypothesis(Insecta: Psocodea)?: A comparison of phylogenetic signal in multiplegenes. Mol Phylogenet Evol 2010, 55:939-951.
14. Cummings BF: Note on the mouthparts of a species of Polyplax(Anoplura) and on the relationship between Anoplura and Mallophaga.Ann Mag Nat Hist (8) 1915, 15:256-259.
15. Stojanovich CJ: The head and mouthparts of the sucking lice (Insecta:Anoplura). Microentomol 1945, 10:1-46.
16. Symmons S: Comparative anatomy of the Mallophagan head. Trans ZoolSoc Lond 1952, 27:349-436.
17. Wappler T, Smith VS, Dalgleish RC: Scratching an ancient itch: an Eocenebird louse fossil. Proc R Soc Lond Ser B-Biol Sci 2004, 271:S255-S258.
18. Grimaldi D, Engel MS: Fossil Liposcelididae and the lice ages (Insecta :Psocodea). Proc R Soc Lond Ser B-Biol Sci 2006, 273:625-633.
19. Kim KC, Ludwig HW: Parallel evolution, cladistics, and classification ofparasitic Psocodea. Ann Entomol Soc Am 1982, 75:537-548.
20. Bininda-Emonds ORP, Cardillo M, Jones KE, MacPhee RDE, Beck RMD,Grenyer R, Price SA, Vos RA, Gittleman JL, Purvis A: The delayed rise ofpresent-day mammals. Nature 2007, 446:507-512.
21. Kim KC, Ludwig HW: The family classification of the Anoplura. SystEntomol 1978, 3:249-284.
22. Kim KC: Evolutionary parallelism in Anoplura and eutherian mammals. InBiosystematics of Haematophagous Insects. Edited by: Service MW. Oxford:Claredon Press; 1988:37:91-114.
23. Durden LA, Musser GG: The sucking lice (Insecta, Anoplura) of the world -a taxonomic checklist with records of mammalian hosts andgeographical distributions. Bull Amer Mus Nat Hist 1994, 218:1-90.
24. Durden LA, Musser GG: The mammalian hosts of the sucking lice(Anoplura) of the world: a host-parasite list. Bull Soc Vector Ecol 1994,19:130-168.
25. Kim KC: Blood-sucking lice (Anoplura) of small mammals: True parasites.In Micromammals and macroparasites: from evolutionary ecology tomanagement. Edited by: Morand S, Krasnov BR, Poulin R. Tokyo: Springer;2006:141-160.
26. Light JE, Hafner MS: Codivergence in heteromyid rodents (Rodentia :Heteromyidae) and their sucking lice of the genus Fahrenholzia(Phthiraptera : Anoplura). Syst Biol 2008, 57:449-465.
27. Light JE, Hafner MS: Phylogenetics and host associations of Fahrenholziasucking lice (Phthiraptera : Anoplura). Syst Entomol 2007, 32:359-370.
28. Light JE, Reed DL: Multigene analysis of phylogenetic relationships anddivergence times of primate sucking lice (Phthiraptera: Anoplura). MolPhylogenet Evol 2009, 50:376-390.
29. Reed DL, Light JE, Allen JM, Kirchman JJ: Pair of lice lost or parasitesregained: the evolutionary history of anthropoid primate lice. BMC Biol2007, 7(5):7.
30. Brandley MC, Schmitz A, Reeder TW: Partitioned Bayesian analyses,partition choice, and the phylogenetic relationships of scincid lizards.Syst Biol 2005, 54:373-390.
31. Drummond AJ, Ho SYW, Phillips MJ, Rambaut A: Relaxed phylogeneticsand dating with confidence. PLoS Biol 2006, 4:699-710.
32. Johnson KP, Reed DL, Parker SLH, Kim D, Clayton DH: Phylogeneticanalysis of nuclear and mitochondrial genes supports species groups forColumbicola (Insecta: Phthiraptera). Mol Phylogenet Evol 2007, 45:506-518.
33. Malenke JR, Johnson KP, Clayton DH: Host specialization differentiatescryptic species of feather-feeding lice. Evolution 2009, 63:1427-1438.
34. Smith VS, Light JE, Durden LA: Rodent louse diversity, phylogeny, andcospeciation in the Manu Biosphere Reserve, Peru. Biol J Linnean Soc2008, 95:598-610.
35. Johnson PT: Sucking lice of Venezuelan rodents, with remarks on relatedspecies (Anoplura). Brigham Young Univ Sci Bull, Biol Ser 1972, 17:1-62.
36. Drummond AJ, Rambaut A: BEAST: Bayesian evolutionary analysis bysampling trees. BMC Evol Biol 2007, 7:214.
37. Rutschmann F, Eriksson T, Salim KA, Conti E: Assessing calibrationuncertainty in molecular dating: the assignment of fossils to alternativecalibration points. Syst Biol 2007, 56:591-608.
38. Yang ZH, Rannala B: Bayesian estimation of species divergence timesunder a molecular clock using multiple fossil calibrations with softbounds. Mol Biol Evol 2006, 23:212-226.
39. Yang ZH, Yoder AD: Comparison of likelihood and Bayesian methods forestimating divergence times using multiple loci and calibration points,with application to a radiation of cute-looking mouse lemur species. SystBiol 2003, 52:705-716.
40. Rannala B, Yang ZH: Inferring speciation times under an episodicmolecular clock. Syst Biol 2007, 56:453-466.
41. Ho SYW, Phillips MJ: Accounting for calibration uncertainty inphylogenetic estimation of evolutionary divergence times. Syst Biol 2009,58:367-380.
42. Dalgleish RC, Palma RL, Price RD, Smith VS: Fossil lice (Insecta:Phthiraptera) reconsidered. Syst Entomol 2006, 31:648-651.
43. Taylor J, Purvis A: Have mammals and their chewing lice diversified inparallel? In Tangled Trees: phylogeny, cospeciation, and coevolution. Editedby: Page RDM. Chicago: University of Chicago Press; 2002:240-261.
44. Musser GG, Durden LA, Holden ME, Light JE: Systematic review ofendemic Sulawesi squirrels (Rodentia, Sciuridae), with descriptions ofnew species of associated sucking lice (Insecta, Anoplura), andphylogenetic and zoogeographic assessments of sciurid lice. Bull AmerMus Nat Hist 2010, 2010:1-260.
45. Lyal CHC: Coevolution of trichodectid lice (Insecta, Phthiraptera) andtheir mammalian hosts. J Nat Hist 1987, 21:1-28.
46. Hafner MS, Nadler SA: Phylogenetic trees support the coevolution ofparasites and their hosts. Nature 1988, 322:258-259.
47. Klompen JSH, Keirans JE, Durden LA: Three new species of ticks (Ixodida:Argasidae: Carios) from fruit bats (Chiroptera: Pteropodidae) in theAustralasian region with notes on host associations. Acarologia 1994,36:25-40.
48. Hafner JC, Light JE, Hafner DJ, Hafner MS, Reddington E, Rogers DS,Riddle BR: Basal clades and molecular systematics of heteromyidrodents. J Mamm 2007, 88:1129-1145.
49. Buxton PA: The Louse. An account of the lice which infest man, theirmedical importance and control. London: Edward-Arnold and Co, 2 1947.
50. Clifford CM, Yunker CE, Corwin MD: Control of louse Polyplax serrata withsystemic insecticides administered in silastic rubber implants. J EconEntomol 1967, 60:1210-1212.
51. Sosna CB, Medleau L: External parasites - life-cycles, transmission, andthe pathogenesis of disease. Vet Med 1992, 87:538.
52. Brown JW, Payne RB, Mindell DP: Nuclear DNA does not reconcile ‘rocks’and ‘clocks’ in Neoaves: a comment on Ericson et al. Biol Lett 2007,3:257-260.
53. Whiteman NK, Parker PG: Using parasites to infer host popuation history:a new rationale for parasite conservation. Anim Conserv 2005, 8:175-181.
54. Nieberding C, Morand S, Libois R, Michaux JR: A parasite reveals crypticphylogeographic history of its host. Proc R Soc Lond Ser B-Biol Sci 2004,271:2559-2568.
55. Johnson KP, Clayton DH: Coevolutionary history of ecological replicates:comparing phylogenies of wing and body lice to Columbiform hosts. InTangled Trees: phylogeny, cospeciation and coevolution. Edited by: Page RDM.Chicago: University of Chicago Press; 2002:262-286.
56. Danforth BN, Ji S: Elongation factor-1a occurs as two copies in bees:implications for phylogenetic analysis of EF-1a sequences in insects. MolBiol Evol 1998, 15:225-235.
57. Hafner MS, Sudman PD, Villablanca FX, Spradling TA, Demastes JW,Nadler SA: Disparate rates of molecular evolution in cospeciating hostsand parasites. Science 1994, 265:1087-1090.
58. Rambaut A: Se-AL: Sequence Alignment Editor. [http://tree.bio.ed.ac.uk/software/seal/.].
59. Maddison DR, Maddison WP: MacClade. Sunderland, MA, USA: SinauerAssociates, 4.06.OSX 2003.
60. Thompson JD, Higgins DG, Gibson TJ: Clustal-W-improving the sensitivityof progressive multiple sequence alignment through sequence
Light et al. BMC Evolutionary Biology 2010, 10:292http://www.biomedcentral.com/1471-2148/10/292
Page 14 of 15
weighting, position-specific gap penalties and weight matrix choice.Nucleic Acids Res 1994, 22:4673-4680.
61. Edgar RC: MUSCLE: multiple sequence alignment with high accuracy andhigh throughput. Nucleic Acids Res 2004, 32:1792-1797.
62. Swofford DL: PAUP*. Phylogenetic Analysis Using Parsimony (*and OtherMethods). Sunderland, Massachusetts: Sinauer Associates, 4 2002.
63. Felsenstein J: Confidence-limits on phylogenies - an approach using thebootstrap. Evolution 1985, 39:783-791.
64. Posada D, Crandall KA: MODELTEST: testing the model of DNAsubstitution. Bioinformatics 1998, 14:817-818.
65. Nylander JAA: MrModeltest v2. Program distributed by the author.Evolutionary Biology Centre, Uppsala University, 2 2004.
66. Posada D: jModelTest: Phylogenetic model averaging. Mol Biol Evol 2008,25:1253-1256.
67. Huelsenbeck JP, Rannala B: Phylogenetic methods come of age: Testinghypotheses in an evolutionary context. Science 1997, 276:227-232.
68. Posada D, Buckley TR: Model selection and model averaging inphylogenetics: Advantages of akaike information criterion and Bayesianapproaches over likelihood ratio tests. Syst Biol 2004, 53:793-808.
69. Gu X, Fu YX, Li WH: Maximum-likelihood-estimation of the heterogeneityof substitution rate among nucleotide sites. Mol Biol Evol 1995,12:546-557.
70. Yang ZH: Maximum-likelihood phylogenetic estimation from DNA-sequences with variable rates over sites-approximate methods. J MolEvol 1994, 39:306-314.
71. Zwickl DJ: Genetic algorithm approaches for the phylogenetic analysis oflarge biological sequence data sets under the maximum likelihoodcriterion. Ph.D. dissertation. The University of Texas at Austin 2006.
72. Huelsenbeck JP, Ronquist F: MRBAYES: Bayesian inference of phylogenetictrees. Bioinformatics 2001, 17:754-755.
73. Rambaut A, Drummond AJ: TRACER. Oxford: University of Oxford 2004.74. Nylander JAA, Ronquist F, Huelsenbeck JP, Nieves-Aldrey JL: Bayesian
phylogenetic analysis of combined data. Syst Biol 2004, 53:47-67.75. Brown JM, Lemmon AR: The importance of data partitioning and the
utility of bayes factors in Bayesian phylogenetics. Syst Biol 2007,56:643-655.
76. Edwards SV, Liu L, Pearl DK: High-resolution species trees withoutconcatenation. Proc Natl Acad Sci USA 2007, 104:5936-5941.
77. Liu L, Pearl DK: Species trees from gene trees: Reconstructing Bayesianposterior distributions of a species phylogeny using estimated gene treedistributions. Syst Biol 2007, 56:504-514.
78. Degnan JH, Rosenberg NA: Discordance of species trees with their mostlikely gene trees. PLoS Genet 2006, 2:762-768.
79. Leaché AD: Species tree discordance traces to phylogeographic cladeboundaries in North American fence lizards (Sceloporus). Syst Biol 2009,58:547-559.
80. Kishino H, Hasegawa M: Evaluation of the maximum-likelihood estimateof the evolutionary tree topologies from DNA-sequence data, and thebranching order in Hominoidea. J Mol Evol 1989, 29:170-179.
81. Goldman N, Anderson JP, Rodrigo AG: Likelihood-based tests oftopologies in phylogenetics. Syst Biol 2000, 49:652-670.
82. Shimodaira H: An approximately unbiased test for phylogenetic treeselection. Syst Biol 2002, 51:492-508.
83. Ihlen PG, Ekman S: Outline of phylogeny and character evolution inRhizocarpon (Rhizocarpaceae, lichenized Ascomycoa) based on nuclearITS and mitochondrial SSU ribosomal DNA sequences. Biol J Linnean Soc2002, 77:535-546.
84. Rambaut A: FigTree. [http://tree.bio.ed.ac.uk/software/figtree/].85. Kumar S, Filipski A, Swarna V, Walker A, Hedges SB: Placing confidence
limits on the molecular age of the human-chimpanzee divergence. ProcNatl Acad Sci USA 2005, 102:18842-18847.
86. Stauffer RL, Walker A, Ryder OA, Lyons-Weiler M, Hedges SB: Human andape molecular clocks and constraints on paleontological hypotheses.J Hered 2001, 92:469-474.
87. Ho SYW: Calibrating molecular estimates of substitution rates anddivergence times in birds. J Avian Biol 2007, 38:409-414.
doi:10.1186/1471-2148-10-292Cite this article as: Light et al.: Evolutionary history of mammaliansucking lice (Phthiraptera: Anoplura). BMC Evolutionary Biology 201010:292.
Submit your next manuscript to BioMed Centraland take full advantage of:
• Convenient online submission
• Thorough peer review
• No space constraints or color figure charges
• Immediate publication on acceptance
• Inclusion in PubMed, CAS, Scopus and Google Scholar
• Research which is freely available for redistribution
Submit your manuscript at www.biomedcentral.com/submit
Light et al. BMC Evolutionary Biology 2010, 10:292http://www.biomedcentral.com/1471-2148/10/292
Page 15 of 15