Embed Size (px)
Citation preview
Evolutionary genomics of peach and almond
domestication
∗,†,1Dianne Velasco, †Mallikarjuna Aradhya, ‡Jeffrey Ross-Ibarra
∗Department of Plant Sciences, University of California, Davis, California95616, †USDA-ARS National Clonal Germplasm Repository, Davis, California95616, USA, ‡Department of Plant Sciences, Center for Population Biology andGenome Center, University of California, Davis CA 95616
Abstract
The domesticated almond [Prunus dulcis (L.) Batsch] and peach [P.persica (Mill.) D. A. Webb] originate on opposite sides of Asia and wereindependently domesticated approximately 5000 years ago. While inter-fertile, they possess alternate mating systems and differ in a number ofmorphological and physiological traits. Here we evaluated thirteen rese-quenced genomes of both almond and peach for signatures of selection andto better understand their relationship. Almond has ˜7X the genetic di-versity of peach and high genome-wide FST values support their status asseparate species. We estimated a divergence time of approximately 8 Mya,coinciding with an active period of uplift in the northeast Tibetan Plateauand subsequent Asian climate change. We identify a number of regions inboth genomes showing signatures of selection during domestication, and asignificant overlap in candidate regions between peach and almond. Whilewe expected gene expression in fruit to overlap with candidate selectedregions, instead we find enrichment for loci highly differentiated betweenthe species, consistent with recent fossil evidence suggesting fruit diver-gence long preceded domestication. Taken together this study tells ushow closely related tree species evolve and are domesticated, the impactof these events on their genomes, and the utility of genomic informationfor long-lived species. Further exploration of this data will contribute tothe genetic knowledge of these species and provide information regardingtargets of selection for breeding application and further the understandingof evolution in these species.
Keywords: Prunus persica, peach, Prunus dulcis, almond, domestication, mat-ingsystem
1Dept. of Plant Sciences, University of California, Davis, CA. 95616; [email protected]
1
.CC-BY-NC-ND 4.0 International licensepeer-reviewed) is the author/funder. It is made available under aThe copyright holder for this preprint (which was not. http://dx.doi.org/10.1101/060160doi: bioRxiv preprint first posted online Jun. 22, 2016;
Introduction
Prunus is a large genus in the family Rosaceae with approximately two hundredspecies, including multiple domesticated crops such as almond, apricot, cherry,peach, and plum (Rehder, 1940; Potter, 2011). Peach [P. persica (Mill.) D. A.Webb] and almond [P. dulcis (L.) Batsch] are two of the three most economicallyimportant domesticates in Prunus globally, and share a number of similarities,including perenniality, precocity, and genome size and organization (Baird et al.,1994; Arus et al., 2012). However, the two species also have striking differences.While peaches are harvested for their indehiscent fleshy mesocarp, almonds areharvested for their seed, encased in a stony endocarp and a leathery, dehiscentmesocarp and exocarp (see Figure S1). And while almond, like most Prunusspecies, exhibits S -RNase based gametophytic self-incompatibility, peach is self-compatible (Hedrick et al., 1917; Wellington et al., 1929). Almond and peachalso differ for other traits, such as life span (Gradziel, 2011), chilling require-ments (Alonso et al., 2005; Dozier et al., 1990; Scorza and Okie, 1991), andadventitious root generation (Kester and Sartori, 1966).
Domestication of almond and peach occurred independently approximately5000 BP in the Fertile Crescent and China (Zohary et al., 2012), respectively,followed by global dissemination beginning before 2300 BP (Hedrick et al., 1917;Edwards, 1975; Gradziel, 2011; Zheng et al., 2014). The few obvious domesti-cation traits in almond are reduced toxicity, thinner endocarp, and increasedseed size, while domestication in peach is characterized by diverse fruit morphol-ogy (size, color, texture, shape, etc.) and self-compatibility. Other traits nottypically associated with domestication, such as precocity, adventitious rooting,graft compatibility, or tree architecture, may also have been selected duringdomestication or subsequent breeding (reviewed in Miller and Gross, 2011;Spiegel-Roy, 1986). Efforts to identify the wild progenitors of either almondor peach by examining species relationships within subgenus Amygdalus haveproduced inconsistent species trees and numerous polytomies (Mowrey et al.,1990; Browicz and Zohary, 1996; Ladizinsky, 1999; Aradhya et al., 2004; Bassiand Monet, 2008; Zeinalabedini et al., 2010; Verde et al., 2013). QTL-mappingapproaches to investigate peach or almond domestication are thus impracticalgiven uncertainty in the wild progenitors and the difficulties associated with longgeneration times. In contrast, comparatively fast and inexpensive sequencingmakes population genetic approaches (cf. Ross-Ibarra et al., 2007) an attrac-tive option, enabling the identification of domestication loci and study of thegenome-wide impacts of changes in mating system.
Both domestication and mating system have been shown to shape genomicpatterns of diversity in annual species (Glemin et al., 2006; Doebley et al., 2006;Hazzouri et al., 2013; Slotte et al., 2013), but the impacts of these forces on treespecies remains poorly documented (McKey et al. 2010; Miller and Gross 2011;Gaut et al. 2015; but see Hamrick et al. 1992 for relevant analyses of allozymediversity data). Mating system differences between closely related species pairshas been shown to significantly affect many aspects of genome evolution in Ara-bidopsis, Capsella, and Collinsia, including lower nucleotide diversity, higher
2
.CC-BY-NC-ND 4.0 International licensepeer-reviewed) is the author/funder. It is made available under aThe copyright holder for this preprint (which was not. http://dx.doi.org/10.1101/060160doi: bioRxiv preprint first posted online Jun. 22, 2016;
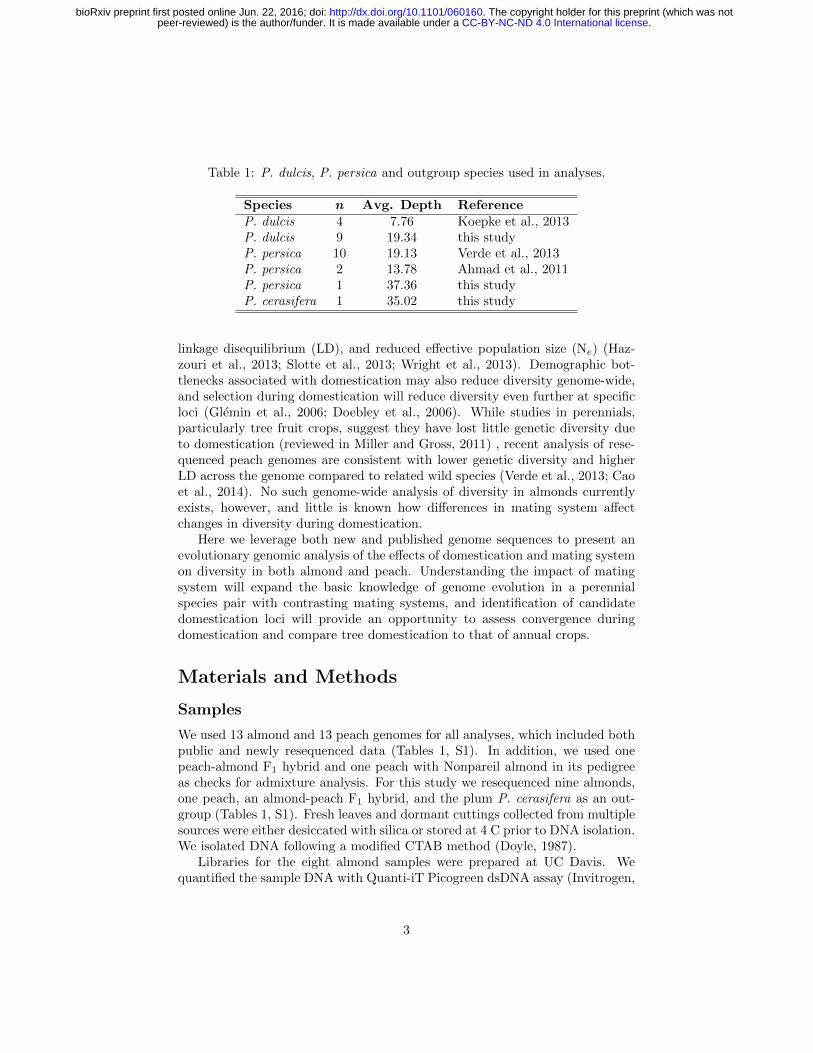
Table 1: P. dulcis, P. persica and outgroup species used in analyses.
Species n Avg. Depth ReferenceP. dulcis 4 7.76 Koepke et al., 2013P. dulcis 9 19.34 this studyP. persica 10 19.13 Verde et al., 2013P. persica 2 13.78 Ahmad et al., 2011P. persica 1 37.36 this studyP. cerasifera 1 35.02 this study
linkage disequilibrium (LD), and reduced effective population size (Ne) (Haz-zouri et al., 2013; Slotte et al., 2013; Wright et al., 2013). Demographic bot-tlenecks associated with domestication may also reduce diversity genome-wide,and selection during domestication will reduce diversity even further at specificloci (Glemin et al., 2006; Doebley et al., 2006). While studies in perennials,particularly tree fruit crops, suggest they have lost little genetic diversity dueto domestication (reviewed in Miller and Gross, 2011) , recent analysis of rese-quenced peach genomes are consistent with lower genetic diversity and higherLD across the genome compared to related wild species (Verde et al., 2013; Caoet al., 2014). No such genome-wide analysis of diversity in almonds currentlyexists, however, and little is known how differences in mating system affectchanges in diversity during domestication.
Here we leverage both new and published genome sequences to present anevolutionary genomic analysis of the effects of domestication and mating systemon diversity in both almond and peach. Understanding the impact of matingsystem will expand the basic knowledge of genome evolution in a perennialspecies pair with contrasting mating systems, and identification of candidatedomestication loci will provide an opportunity to assess convergence duringdomestication and compare tree domestication to that of annual crops.
Materials and Methods
Samples
We used 13 almond and 13 peach genomes for all analyses, which included bothpublic and newly resequenced data (Tables 1, S1). In addition, we used onepeach-almond F1 hybrid and one peach with Nonpareil almond in its pedigreeas checks for admixture analysis. For this study we resequenced nine almonds,one peach, an almond-peach F1 hybrid, and the plum P. cerasifera as an out-group (Tables 1, S1). Fresh leaves and dormant cuttings collected from multiplesources were either desiccated with silica or stored at 4 C prior to DNA isolation.We isolated DNA following a modified CTAB method (Doyle, 1987).
Libraries for the eight almond samples were prepared at UC Davis. Wequantified the sample DNA with Quanti-iT Picogreen dsDNA assay (Invitrogen,
3
.CC-BY-NC-ND 4.0 International licensepeer-reviewed) is the author/funder. It is made available under aThe copyright holder for this preprint (which was not. http://dx.doi.org/10.1101/060160doi: bioRxiv preprint first posted online Jun. 22, 2016;
Life Technologies) and then fragmented 1 µg with a Bioruptor (Diagenode) for11 cycles of 30 seconds ON and 30 seconds OFF per cycle. The resulting DNAfragment ends were then repaired with NEBNext End Repair (New EnglandBioLabs) followed by the addition of deoxyadenosine triphosphate to the 3-primeends with Klenow Fragment (New England BioLabs). We then ligated barcodedIllumina TrueSeq adapters (Affymetrix) to the A-tailed fragments with QuickLigase (New England BioLabs). Between each enzymatic step we washed theDNA with Sera-Mag SpeedBeads (GE Life Sciences, Pittsburgh). The resultinglibraries were quantified with a Qubit (Life Technologies) and sized using aBioAnalyzer DNA 12000 chip (Agilent Technologies). Libraries were sent toUC Berkeley (Berkeley, Qb3) for quantification by qPCR, multiplexing, andsequencing for 100 bp paired-end reads in a single HiSeq 2000 (Illumina) lane.DNA from the remaining four samples (Tables 1, S1) was submitted to BGI(Shenzen, China) for library preparation and sequenced using 100 bp paired-end reads at their facility in Hong Kong.
Analysis
Quality Control and Mapping
All FASTQ files were trimmed of remnant adapter sequences using Scythe(github.com/vsbuffalo/scythe) and then further trimmed for base qualitywith Sickle (github.com/najoshi/sickle) using default parameters for both.Trimmed reads were then aligned to the P. persica v1.0 reference (www.rosaceae.org) using BWA-MEM (Li, 2013) with a minimum seed length of 10 and inter-nal seed length of 2.85. After filtering for a minimum mapping quality of 30 andbase quality of 20, sequence depth averaged 15.8X (4.7X to 34.6X) in almondand 19.7X (11.2X to 35.4X in peach; Table S1, Figure S2).
Diversity and Candidate Gene Identification
We estimated initial genotype likelihoods directly from aligned and filtered BAMfiles using ANGSD (Korneliussen et al., 2014). We then estimated inbreed-ing coefficients using ngsF in the ngsTools suite (Fumagalli et al., 2014), andrecalculated genotype likelihoods incorporating our inbreeding estimates. Wecalculated several population genetics statistics, including pairwise nucleotidediversity (θπ; Nei and Li, 1979), Tajima’s D (D ; Tajima, 1989), Fay and Wu’s H(H ; Fay and Wu, 2000), and Zeng’s E (E ; Zeng et al., 2006) using the thetaStatsubprogram in ANGSD. Diversity values were estimated in overlapping 1000 bpwindows with 50 bp steps, removing windows with less than 150 bp of sequenceafter filtering. Additionally we calculated a normalized θπ value by dividing perwindow θπ by mean θπ in each species. To identify candidate genes possiblyselected during domestication, we filtered for genes in the lowest 5% empiricalquantile of each diversity statistic. We further analyzed candidate loci for geneontology (GO) using P. persica protein gene identifiers in the singular enrich-ment analysis tool and Fisher’s exact test using default statistical options atthe AgriGO website (http://bioinfo.cau.edu.cn/agriGO/).
4
.CC-BY-NC-ND 4.0 International licensepeer-reviewed) is the author/funder. It is made available under aThe copyright holder for this preprint (which was not. http://dx.doi.org/10.1101/060160doi: bioRxiv preprint first posted online Jun. 22, 2016;
Population Comparisons
We treated peach samples and almond samples as two populations to evaluatepopulation structure. We performed a principal component analysis (PCA)with ngsPopGen (Fumagalli et al., 2014) and used NGSadmix (Skotte et al.,2013) to perform an admixture analysis and assign proportions of almond andpeach population to individuals using K = 2 through K = 6 as the numberof potential subpopulations. Finally, we examined population differentiation byestimating FST genome-wide and in sliding windows (1000 bp windows with a50 bp step) after removing windows with < 150bp of sequence.
Gene Expression
We downloaded expression tracks of peach leaf, fruit, cotyledon and embryo, androot tissue from the Istituto di Genomica Applicata (IGA) peach gbrowse inter-face (http://services.appliedgenomics.org/fgb2/iga/prunus_public/gbrowse/prunus_public/). Expression values were multiplied by window length andthen summed for each gene. We calculated the ratio of fruit expression to themean of the non-fruit values for each gene and divided them into groups ofcandidate and non-candidate genes based on FST , θπ, D, or E values.
Results and Discussion
Diversity
Genome-wide nucleotide diversity (θπ) in almond is nearly sevenfold higher thanin peach (0.0186 and 0.0027, respectively), and these differences were more pro-nounced in non-genic regions of the genome (Tables 2 and S3). Though differ-ences in diversity between peach and almond have been known from analysesusing multiple marker systems (Mowrey et al., 1990; Byrne, 1990; Martınez-Gomez et al., 2003; Aradhya et al., 2004), this study is the first comparison ofwhole genome sequences using multiple diverse individuals from both species.Previous genome scans of peach found low levels of genetic diversity compared tothe closely related wild species, P. kansuensis, P. mira, and P. davidiana (Verdeet al., 2013; Cao et al., 2014). Of these, only P. davidiana is outcrossing, andVerde et al. (2013) found it had the greatest nucleotide diversity of the speciesthey examined, approximately three-fold higher than domesticated peach. De-spite its domesticated status, almond retains more genetic diversity than anyof the peach species studied thus far, suggesting that mating system explainsmore of the differences in diversity among species than domestication. Finally,we observed considerable variation in diversity statistics among chromosomesin both species, including up to two-fold differences in nucleotide diversity inpeach (Table S3), perhaps suggesting the relatively recent effects of selectionduring domestication.
Mean values of Tajima’s D were negative for both almond and peach (Table2), suggesting a genome-wide excess of rare variants likely consistent with a
5
.CC-BY-NC-ND 4.0 International licensepeer-reviewed) is the author/funder. It is made available under aThe copyright holder for this preprint (which was not. http://dx.doi.org/10.1101/060160doi: bioRxiv preprint first posted online Jun. 22, 2016;
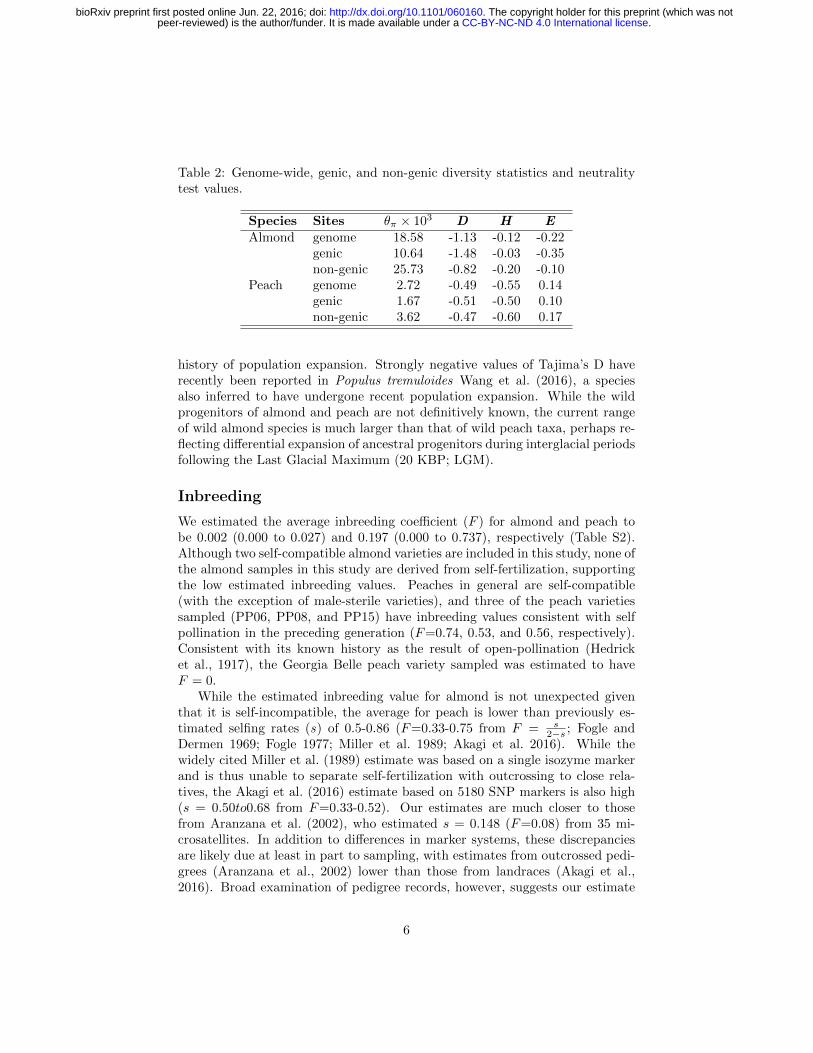
Table 2: Genome-wide, genic, and non-genic diversity statistics and neutralitytest values.
Species Sites θπ × 103 D H EAlmond genome 18.58 -1.13 -0.12 -0.22
genic 10.64 -1.48 -0.03 -0.35non-genic 25.73 -0.82 -0.20 -0.10
Peach genome 2.72 -0.49 -0.55 0.14genic 1.67 -0.51 -0.50 0.10non-genic 3.62 -0.47 -0.60 0.17
history of population expansion. Strongly negative values of Tajima’s D haverecently been reported in Populus tremuloides Wang et al. (2016), a speciesalso inferred to have undergone recent population expansion. While the wildprogenitors of almond and peach are not definitively known, the current rangeof wild almond species is much larger than that of wild peach taxa, perhaps re-flecting differential expansion of ancestral progenitors during interglacial periodsfollowing the Last Glacial Maximum (20 KBP; LGM).
Inbreeding
We estimated the average inbreeding coefficient (F ) for almond and peach tobe 0.002 (0.000 to 0.027) and 0.197 (0.000 to 0.737), respectively (Table S2).Although two self-compatible almond varieties are included in this study, none ofthe almond samples in this study are derived from self-fertilization, supportingthe low estimated inbreeding values. Peaches in general are self-compatible(with the exception of male-sterile varieties), and three of the peach varietiessampled (PP06, PP08, and PP15) have inbreeding values consistent with selfpollination in the preceding generation (F=0.74, 0.53, and 0.56, respectively).Consistent with its known history as the result of open-pollination (Hedricket al., 1917), the Georgia Belle peach variety sampled was estimated to haveF = 0.
While the estimated inbreeding value for almond is not unexpected giventhat it is self-incompatible, the average for peach is lower than previously es-timated selfing rates (s) of 0.5-0.86 (F=0.33-0.75 from F = s
2−s ; Fogle andDermen 1969; Fogle 1977; Miller et al. 1989; Akagi et al. 2016). While thewidely cited Miller et al. (1989) estimate was based on a single isozyme markerand is thus unable to separate self-fertilization with outcrossing to close rela-tives, the Akagi et al. (2016) estimate based on 5180 SNP markers is also high(s = 0.50to0.68 from F=0.33-0.52). Our estimates are much closer to thosefrom Aranzana et al. (2002), who estimated s = 0.148 (F=0.08) from 35 mi-crosatellites. In addition to differences in marker systems, these discrepanciesare likely due at least in part to sampling, with estimates from outcrossed pedi-grees (Aranzana et al., 2002) lower than those from landraces (Akagi et al.,2016). Broad examination of pedigree records, however, suggests our estimate
6
.CC-BY-NC-ND 4.0 International licensepeer-reviewed) is the author/funder. It is made available under aThe copyright holder for this preprint (which was not. http://dx.doi.org/10.1101/060160doi: bioRxiv preprint first posted online Jun. 22, 2016;
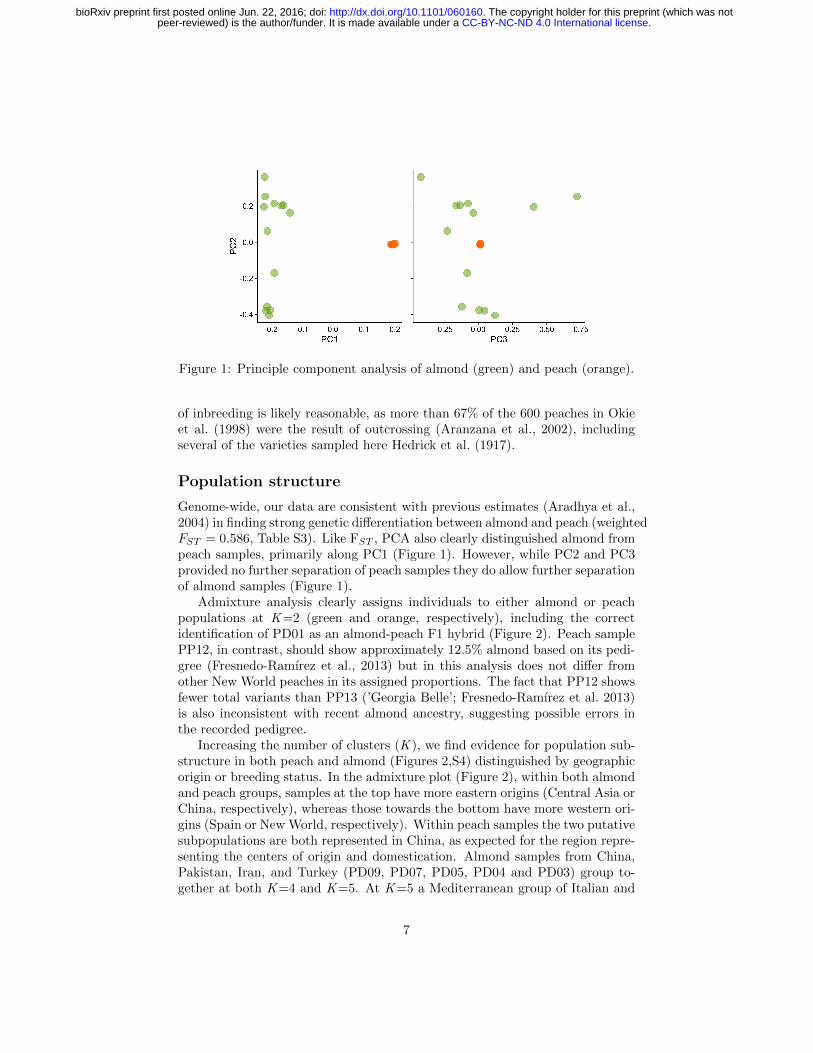
Figure 1: Principle component analysis of almond (green) and peach (orange).
of inbreeding is likely reasonable, as more than 67% of the 600 peaches in Okieet al. (1998) were the result of outcrossing (Aranzana et al., 2002), includingseveral of the varieties sampled here Hedrick et al. (1917).
Population structure
Genome-wide, our data are consistent with previous estimates (Aradhya et al.,2004) in finding strong genetic differentiation between almond and peach (weightedFST = 0.586, Table S3). Like FST , PCA also clearly distinguished almond frompeach samples, primarily along PC1 (Figure 1). However, while PC2 and PC3provided no further separation of peach samples they do allow further separationof almond samples (Figure 1).
Admixture analysis clearly assigns individuals to either almond or peachpopulations at K =2 (green and orange, respectively), including the correctidentification of PD01 as an almond-peach F1 hybrid (Figure 2). Peach samplePP12, in contrast, should show approximately 12.5% almond based on its pedi-gree (Fresnedo-Ramırez et al., 2013) but in this analysis does not differ fromother New World peaches in its assigned proportions. The fact that PP12 showsfewer total variants than PP13 (’Georgia Belle’; Fresnedo-Ramırez et al. 2013)is also inconsistent with recent almond ancestry, suggesting possible errors inthe recorded pedigree.
Increasing the number of clusters (K ), we find evidence for population sub-structure in both peach and almond (Figures 2,S4) distinguished by geographicorigin or breeding status. In the admixture plot (Figure 2), within both almondand peach groups, samples at the top have more eastern origins (Central Asia orChina, respectively), whereas those towards the bottom have more western ori-gins (Spain or New World, respectively). Within peach samples the two putativesubpopulations are both represented in China, as expected for the region repre-senting the centers of origin and domestication. Almond samples from China,Pakistan, Iran, and Turkey (PD09, PD07, PD05, PD04 and PD03) group to-gether at both K =4 and K =5. At K =5 a Mediterranean group of Italian and
7
.CC-BY-NC-ND 4.0 International licensepeer-reviewed) is the author/funder. It is made available under aThe copyright holder for this preprint (which was not. http://dx.doi.org/10.1101/060160doi: bioRxiv preprint first posted online Jun. 22, 2016;
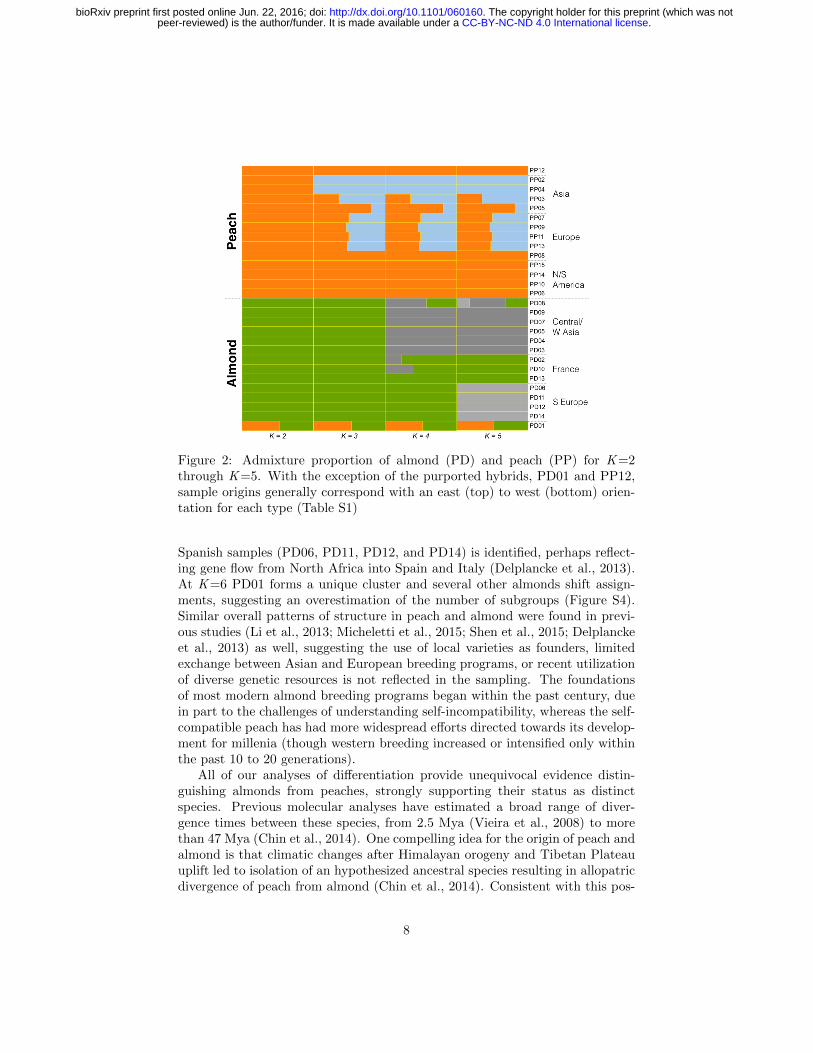
Figure 2: Admixture proportion of almond (PD) and peach (PP) for K =2through K =5. With the exception of the purported hybrids, PD01 and PP12,sample origins generally correspond with an east (top) to west (bottom) orien-tation for each type (Table S1)
Spanish samples (PD06, PD11, PD12, and PD14) is identified, perhaps reflect-ing gene flow from North Africa into Spain and Italy (Delplancke et al., 2013).At K =6 PD01 forms a unique cluster and several other almonds shift assign-ments, suggesting an overestimation of the number of subgroups (Figure S4).Similar overall patterns of structure in peach and almond were found in previ-ous studies (Li et al., 2013; Micheletti et al., 2015; Shen et al., 2015; Delplanckeet al., 2013) as well, suggesting the use of local varieties as founders, limitedexchange between Asian and European breeding programs, or recent utilizationof diverse genetic resources is not reflected in the sampling. The foundationsof most modern almond breeding programs began within the past century, duein part to the challenges of understanding self-incompatibility, whereas the self-compatible peach has had more widespread efforts directed towards its develop-ment for millenia (though western breeding increased or intensified only withinthe past 10 to 20 generations).
All of our analyses of differentiation provide unequivocal evidence distin-guishing almonds from peaches, strongly supporting their status as distinctspecies. Previous molecular analyses have estimated a broad range of diver-gence times between these species, from 2.5 Mya (Vieira et al., 2008) to morethan 47 Mya (Chin et al., 2014). One compelling idea for the origin of peach andalmond is that climatic changes after Himalayan orogeny and Tibetan Plateauuplift led to isolation of an hypothesized ancestral species resulting in allopatricdivergence of peach from almond (Chin et al., 2014). Consistent with this pos-
8
.CC-BY-NC-ND 4.0 International licensepeer-reviewed) is the author/funder. It is made available under aThe copyright holder for this preprint (which was not. http://dx.doi.org/10.1101/060160doi: bioRxiv preprint first posted online Jun. 22, 2016;
sibility, our estimates of FST and nucleotide diversity give a divergence time of≈ 8 million years under a simple model of divergence in isolation (cf Holsingerand Weir, 2009) and assuming a mutation rate of µ = 10−8 per nucleotide and ageneration time of ≈ 10 years. This corresponds to a period of climatic changefollowing significant geologic activity and uplift specifically in the northeasternsection of the Tibetan Plateau (Fang et al., 2007; Molnar et al., 2010).
Candidate Loci
We next scanned the genomes of both almond and peach for potential candidategenes targeted by selection during domestication.
In the lowest 5% quantile of Zeng’s E, we found 1334 and 1315 genes inpeach and almond, respectively. Of these, peach and almond share 104, nearlydouble that expected by chance (permutation p-value¡0.001) and suggesting con-vergence in the process of domestication. In almond, candidate genes showedenrichment for gene ontology (GO) categories related to protein amino acidphosphorylation, ATP biosynthetic processes, regulation of ADP ribosylationfactor (ARF) protein signal transduction, membrane and nucleus cellular com-ponents, ATP binding, ATPase and protein tyrosine kinase activities, and zincion binding; candidate genes in peach showed enrichment for the GO categoryrelated to cellular catabolic processes.
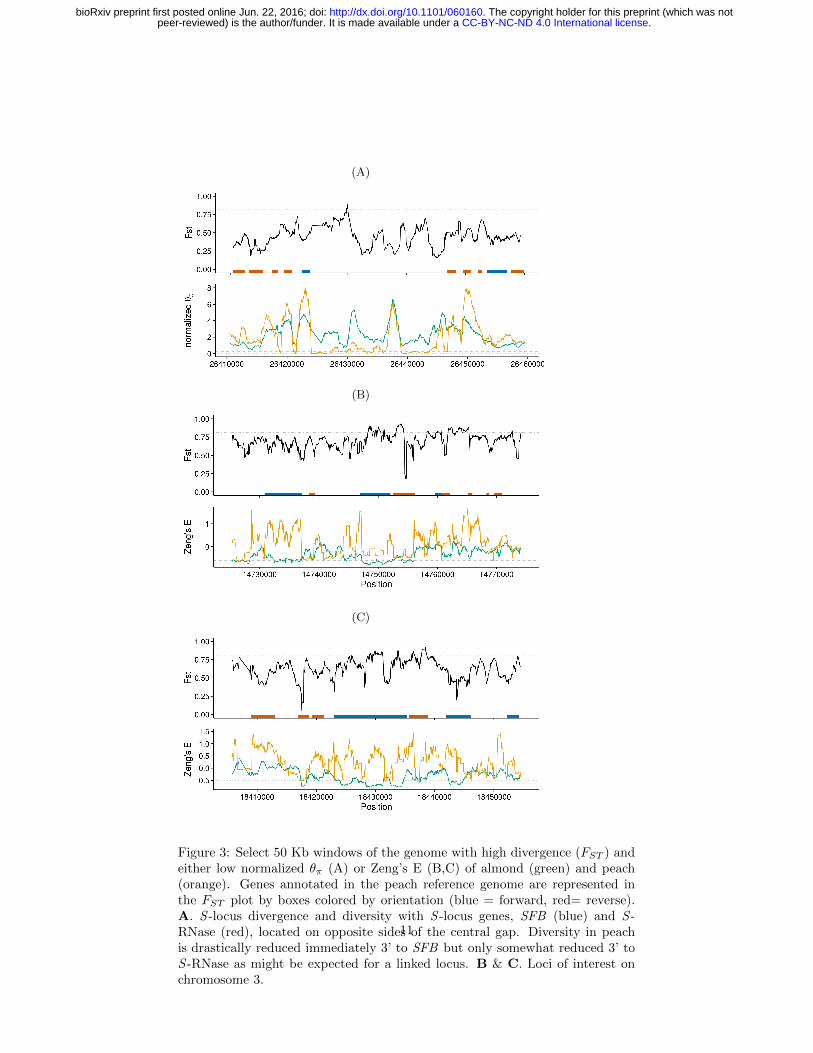
We first investigated the S -locus in order to examine a genomic region knownto differ between almond and peach both in sequence and function (Tao et al.,2007; Hanada et al., 2014). The S -locus, which controls gametophytic self-incompatibility in Prunus (reviewed in Wu et al. 2013). The S -locus haplotypeblock consists of two genes, S -RNase and the S -haplotype-specific F-box (SFB),which function in the pistil and pollen, respectively. In our data, the intergenicregion 3’ to both the S -RNase and SFB loci in peach shows extremely highdifferentiation between taxa and low nucleotide diversity in peach (Figure 3A),observations consistent with recent work showing peach having only five knownS -haplotypes, two of which have identical SFB alleles (Tao et al., 2007; Hanadaet al., 2014).
Windows in the lowest 5% quantile of the summary statistics investigatedwere generally enriched for genic regions of the genome in both taxa, but thesignal in peach was weak and enrichment was not consistent across all statisticsevaluated (Table S5). Nonetheless, a number of individual regions genome-wide showed strong signatures of selection. We examined 50 kb regions withcontiguous windows in the bottom 5% quantile to focus our investigations ofcandidate genes. We focused on regions in both species for which there wereoverlapping regions of high FST and low θπ or Zeng’s E as these were significantfor both peach and almond (permutation p-values 0-0.034; Table 3).
While many intergenic and putative regulatory regions also showed interest-ing patterns in diversity statistics, we examined two regions of chromosome 3with moderate to high FST and divergent values of Zeng’s E between peach andalmond, specifically low values of Zeng’s E in almond (Figures 3B, 3C). The firstof these regions (Figure 3B), contains the uncharacterized gene ppa004369mg
9
.CC-BY-NC-ND 4.0 International licensepeer-reviewed) is the author/funder. It is made available under aThe copyright holder for this preprint (which was not. http://dx.doi.org/10.1101/060160doi: bioRxiv preprint first posted online Jun. 22, 2016;
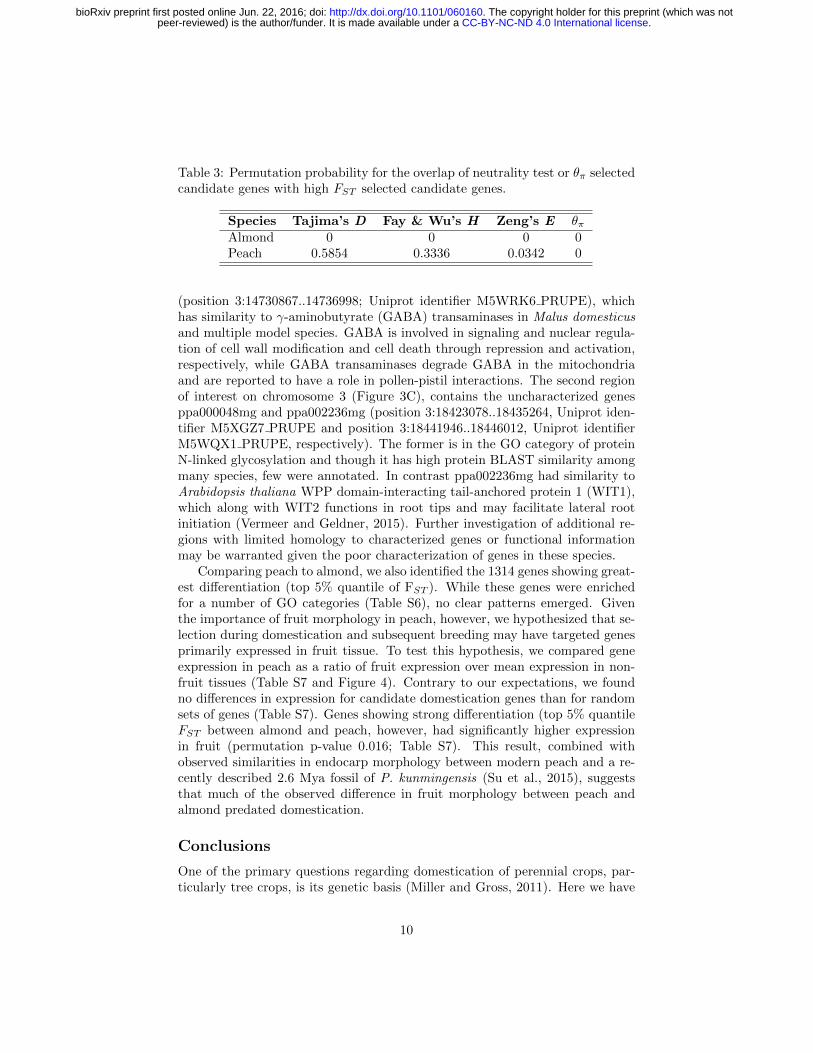
Table 3: Permutation probability for the overlap of neutrality test or θπ selectedcandidate genes with high FST selected candidate genes.
Species Tajima’s D Fay & Wu’s H Zeng’s E θπAlmond 0 0 0 0Peach 0.5854 0.3336 0.0342 0
(position 3:14730867..14736998; Uniprot identifier M5WRK6 PRUPE), whichhas similarity to γ-aminobutyrate (GABA) transaminases in Malus domesticusand multiple model species. GABA is involved in signaling and nuclear regula-tion of cell wall modification and cell death through repression and activation,respectively, while GABA transaminases degrade GABA in the mitochondriaand are reported to have a role in pollen-pistil interactions. The second regionof interest on chromosome 3 (Figure 3C), contains the uncharacterized genesppa000048mg and ppa002236mg (position 3:18423078..18435264, Uniprot iden-tifier M5XGZ7 PRUPE and position 3:18441946..18446012, Uniprot identifierM5WQX1 PRUPE, respectively). The former is in the GO category of proteinN-linked glycosylation and though it has high protein BLAST similarity amongmany species, few were annotated. In contrast ppa002236mg had similarity toArabidopsis thaliana WPP domain-interacting tail-anchored protein 1 (WIT1),which along with WIT2 functions in root tips and may facilitate lateral rootinitiation (Vermeer and Geldner, 2015). Further investigation of additional re-gions with limited homology to characterized genes or functional informationmay be warranted given the poor characterization of genes in these species.
Comparing peach to almond, we also identified the 1314 genes showing great-est differentiation (top 5% quantile of FST ). While these genes were enrichedfor a number of GO categories (Table S6), no clear patterns emerged. Giventhe importance of fruit morphology in peach, however, we hypothesized that se-lection during domestication and subsequent breeding may have targeted genesprimarily expressed in fruit tissue. To test this hypothesis, we compared geneexpression in peach as a ratio of fruit expression over mean expression in non-fruit tissues (Table S7 and Figure 4). Contrary to our expectations, we foundno differences in expression for candidate domestication genes than for randomsets of genes (Table S7). Genes showing strong differentiation (top 5% quantileFST between almond and peach, however, had significantly higher expressionin fruit (permutation p-value 0.016; Table S7). This result, combined withobserved similarities in endocarp morphology between modern peach and a re-cently described 2.6 Mya fossil of P. kunmingensis (Su et al., 2015), suggeststhat much of the observed difference in fruit morphology between peach andalmond predated domestication.
Conclusions
One of the primary questions regarding domestication of perennial crops, par-ticularly tree crops, is its genetic basis (Miller and Gross, 2011). Here we have
10
.CC-BY-NC-ND 4.0 International licensepeer-reviewed) is the author/funder. It is made available under aThe copyright holder for this preprint (which was not. http://dx.doi.org/10.1101/060160doi: bioRxiv preprint first posted online Jun. 22, 2016;
(A)
(B)
(C)
Figure 3: Select 50 Kb windows of the genome with high divergence (FST ) andeither low normalized θπ (A) or Zeng’s E (B,C) of almond (green) and peach(orange). Genes annotated in the peach reference genome are represented inthe FST plot by boxes colored by orientation (blue = forward, red= reverse).A. S -locus divergence and diversity with S -locus genes, SFB (blue) and S -RNase (red), located on opposite sides of the central gap. Diversity in peachis drastically reduced immediately 3’ to SFB but only somewhat reduced 3’ toS -RNase as might be expected for a linked locus. B & C. Loci of interest onchromosome 3.
11
.CC-BY-NC-ND 4.0 International licensepeer-reviewed) is the author/funder. It is made available under aThe copyright holder for this preprint (which was not. http://dx.doi.org/10.1101/060160doi: bioRxiv preprint first posted online Jun. 22, 2016;
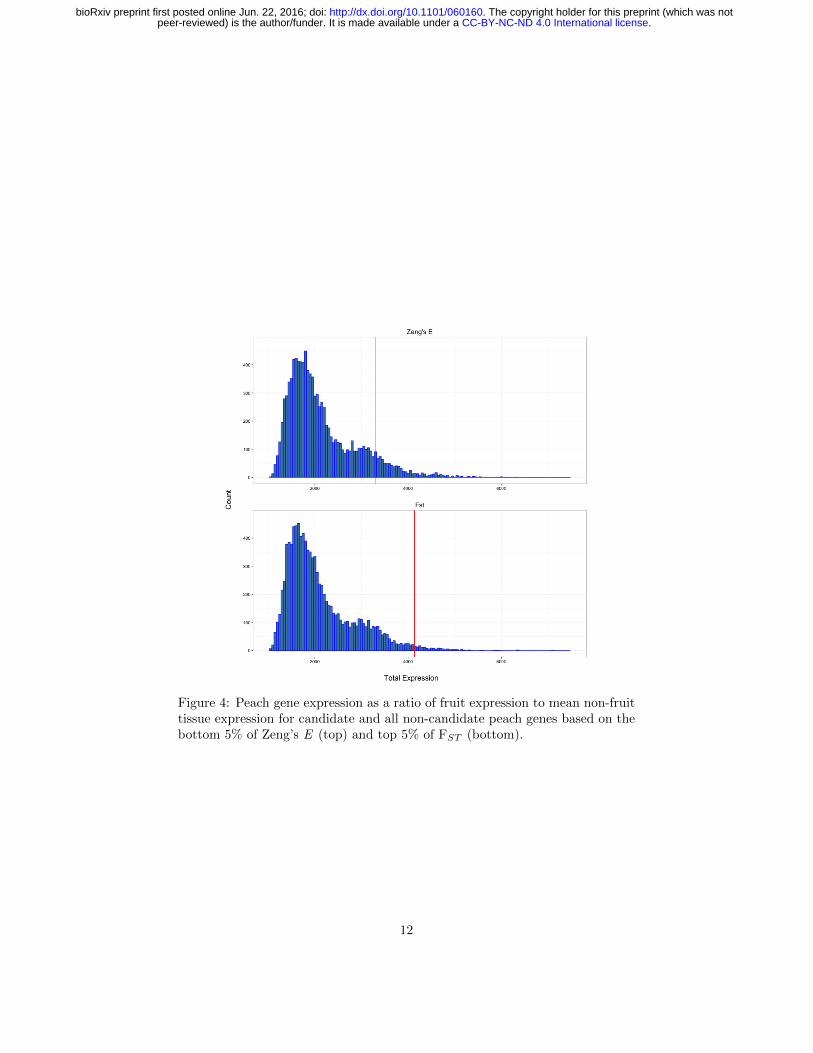
Figure 4: Peach gene expression as a ratio of fruit expression to mean non-fruittissue expression for candidate and all non-candidate peach genes based on thebottom 5% of Zeng’s E (top) and top 5% of FST (bottom).
12
.CC-BY-NC-ND 4.0 International licensepeer-reviewed) is the author/funder. It is made available under aThe copyright holder for this preprint (which was not. http://dx.doi.org/10.1101/060160doi: bioRxiv preprint first posted online Jun. 22, 2016;
examined two closely related domesticated tree species with alternate matingsystems in an attempt to tease apart the genomic signatures of domesticationand mating system and better understand these processes in perennial species.In addition to demonstrating the importance of mating system in determiningoverall patterns of genetic diversity, our results identify numerous genes and ge-nomic regions showing evidence of selection, provide evidence of convergence inthe domestication of almond and peach, and show that genes highly expressed inthe fruit were not preferentially targeted during domestication but likely selectedmuch earlier during species divergence. Finally, the high-coverage sequence weprovide for a number of important cultivars may be useful to breeders and ge-neticists in identifying the causal basis of quantitative trait loci or developingmarker sets for marker-assisted selection or genomic prediction.
Acknowledgments
Support for DV provided by the McDonald Endowment for UC Davis Plant Sci-ences Graduate Student Research Assistantship and the Almond Board of Cali-fornia (ABC; grant HORT16-Aradhya/Ledbetter). Resequencing funded by theABC (grant HORT16-Aradhya/ Ledbetter) and a Henry A. Jastro Research Fel-lowship. Resequencing funded by the Henry A. Jastro Research Fellowship usedthe Vincent J. Coates Genomics Sequencing Laboratory at UC Berkeley, sup-ported by NIH S10 Instrumentation Grants S10RR029668 and S10RR027303.
13
.CC-BY-NC-ND 4.0 International licensepeer-reviewed) is the author/funder. It is made available under aThe copyright holder for this preprint (which was not. http://dx.doi.org/10.1101/060160doi: bioRxiv preprint first posted online Jun. 22, 2016;
References
Ahmad, R., Parfitt, D. E., Fass, J., Ogundiwin, E., Dhingra, A., Gradziel,T. M., Lin, D., Joshi, N. A., Martinez-Garcia, P. J., and Crisosto, C. H.(2011). Whole genome sequencing of peach (Prunus persica L.) for SNPidentification and selection. BMC Genomics, 12(1):569.
Akagi, T., Hanada, T., Yaegaki, H., Gradziel, T. M., and Tao, R. (2016).Genome-wide view of genetic diversity reveals paths of selection and culti-var differentiation in peach domestication. DNA Research, page dsw014.
Alonso, J., Anson, J., Espiau, M., and Socias i Company, R. (2005). Determi-nation of endodormancy break in almond flower buds by a correlation modelusing the average temperature of different day intervals and its application tothe estimation of chill and heat requirements and blooming date. Journal ofthe American Society for Horticultural Science, 130(3):308–318.
Aradhya, M. K., Weeks, C., and Simon, C. J. (2004). Molecular characteriza-tion of variability and relationships among seven cultivated and selected wildspecies of Prunus L. using amplified fragment length polymorphism. ScientiaHorticulturae, 103(1):131–144.
Aranzana, M., Garcia-Mas, J., Carbo, J., and Arus, P. (2002). Developmentand variability analysis of microsatellite markers in peach. Plant Breeding,121(1):87–92.
Arus, P., Verde, I., Sosinski, B., Zhebentyayeva, T., and Abbott, A. G. (2012).The peach genome. Tree Genetics & Genomes, 8(3):531–547.
Baird, W. V., Estager, A. S., and Wells, J. K. (1994). Estimating nuclearDNA content in peach and related diploid species using laser flow cytometryand DNA hybridization. Journal of the American Society for HorticulturalScience, 119(6):1312–1316.
Bassi, D. and Monet, R. (2008). Botany and taxonomy. In Layne, D. R. andBassi, D., editors, The Peach: Botany, Production and Uses, chapter 1, pages1–36. CABI, Oxfordshire, UK.
Browicz, K. and Zohary, D. (1996). The genus Amygdalus L. (Rosaceae): speciesrelationships, distribution and evolution under domestication. Genetic Re-sources and Crop Evolution, 43(3):229–247.
Byrne, D. (1990). Isozyme variability in four diploid stone fruits compared withother woody perennial plants. Journal of Heredity, 81(1):68–71.
Cao, K., Zheng, Z., Wang, L., Liu, X., Zhu, G., Fang, W., Cheng, S., Zeng, P.,Chen, C., Wang, X., et al. (2014). Comparative population genomics revealsthe domestication history of the peach, Prunus persica, and human influenceson perennial fruit crops. Genome biology, 15(7):415.
14
.CC-BY-NC-ND 4.0 International licensepeer-reviewed) is the author/funder. It is made available under aThe copyright holder for this preprint (which was not. http://dx.doi.org/10.1101/060160doi: bioRxiv preprint first posted online Jun. 22, 2016;
Chin, S.-W., Shaw, J., Haberle, R., Wen, J., and Potter, D. (2014). Diversi-fication of almonds, peaches, plums and cherries–molecular systematics andbiogeographic history of Prunus (Rosaceae). Molecular phylogenetics andevolution, 76:34–48.
Delplancke, M., Alvarez, N., Benoit, L., Espındola, A., I Joly, H., Neuenschwan-der, S., and Arrigo, N. (2013). Evolutionary history of almond tree domesti-cation in the mediterranean basin. Molecular ecology, 22(4):1092–1104.
Doebley, J. F., Gaut, B. S., and Smith, B. D. (2006). The molecular genetics ofcrop domestication. Cell, 127(7):1309–1321.
Doyle, J. J. (1987). A rapid DNA isolation procedure for small quantities offresh leaf tissue. Phytochem Bull, 19:11–15.
Dozier, W., Powell, A., Caylor, A., McDaniel, N., Carden, E., and McGuire,J. (1990). Hydrogen cyanamide induces budbreak of peaches and nectarinesfollowing inadequate chilling. HortScience, 25(12):1573–1575.
Edwards, S. (1975). The almond industry of Mexico. Master’s thesis, OregonState University.
Fang, X., Zhang, W., Meng, Q., Gao, J., Wang, X., King, J., Song, C., Dai, S.,and Miao, Y. (2007). High-resolution magnetostratigraphy of the NeogeneHuaitoutala section in the eastern Qaidam Basin on the NE Tibetan Plateau,Qinghai Province, China and its implication on tectonic uplift of the NETibetan Plateau. Earth and Planetary Science Letters, 258(1):293–306.
Fay, J. C. and Wu, C.-I. (2000). Hitchhiking under positive Darwinian selection.Genetics, 155(3):1405–1413.
Fogle, H. (1977). Self-pollination and its implications in peach improvement.Fruit Varieties Journal.
Fogle, H. W. and Dermen, H. (1969). Genetic and chimeral constitution of threeleaf variegations in the peach. Journal of Heredity, 60(6):323–328.
Fresnedo-Ramırez, J., Martınez-Garcıa, P. J., Parfitt, D. E., Crisosto, C. H.,and Gradziel, T. M. (2013). Heterogeneity in the entire genome for threegenotypes of peach [prunus persica (l.) batsch] as distinguished from sequenceanalysis of genomic variants. BMC genomics, 14(1):750.
Fumagalli, M., Vieira, F. G., Linderoth, T., and Nielsen, R. (2014). ngsTools:methods for population genetics analyses from next-generation sequencingdata. Bioinformatics, 30(10):1486–1487.
Gaut, B. S., Dıez, C. M., and Morrell, P. L. (2015). Genomics and the contrast-ing dynamics of annual and perennial domestication. Trends in Genetics.
15
.CC-BY-NC-ND 4.0 International licensepeer-reviewed) is the author/funder. It is made available under aThe copyright holder for this preprint (which was not. http://dx.doi.org/10.1101/060160doi: bioRxiv preprint first posted online Jun. 22, 2016;
Glemin, S., Bazin, E., and Charlesworth, D. (2006). Impact of mating systemson patterns of sequence polymorphism in flowering plants. Proceedings of theRoyal Society B: Biological Sciences, 273(1604):3011–3019.
Gradziel, T. M. (2011). Origin and dissemination of almond. Horti Rev, 38:23–81.
Hamrick, J. L., Godt, M. J. W., and Sherman-Broyles, S. L. (1992). Factorsinfluencing levels of genetic diversity in woody plant species. In Populationgenetics of forest trees, pages 95–124. Springer.
Hanada, T., Watari, A., Kibe, T., Yamane, H., Wunsch Blanco, A., Gradziel,T. M., Sasabe, Y., Yaegaki, H., Yamaguchi, M., and Tao, R. (2014). Twonovel self-compatible S haplotypes in peach (Prunus persica). Journal of theJapanese Society for Horticultural Science, 83(3):203–213.
Hazzouri, K. M., Escobar, J. S., Ness, R. W., Killian Newman, L., Randle,A. M., Kalisz, S., and Wright, S. I. (2013). Comparative population genomicsin Collinsia sister species reveals evidence for reduced effective populationsize, relaxed selection, and evolution of biased gene conversion with an ongoingmating system shift. Evolution, 67(5):1263–1278.
Hedrick, U. P., Howe, G. H., Taylor, O. M., and Tubergen, C. B. (1917). ThePeaches of New York. JB Lyon Company, Albany, NY.
Holsinger, K. E. and Weir, B. S. (2009). Genetics in geographically structuredpopulations: defining, estimating and interpreting FST. Nature Reviews Ge-netics, 10(9):639–650.
Kester, D. E. and Sartori, E. (1966). Rooting of cuttings in populations of peach(Prunus persica l.), almond (Prunus amygdalus batsch) and their F1 hybrids.In Proceedings of the American Society for Horticultural Science, volume 88,pages 219–223.
Koepke, T., Schaeffer, S., Harper, A., Dicenta, F., Edwards, M., Henry, R. J.,Møller, B. L., Meisel, L., Oraguzie, N., Silva, H., et al. (2013). Comparativegenomics analysis in Prunoideae to identify biologically relevant polymor-phisms. Plant Biotechnology Journal, 11(7):883–893.
Korneliussen, T. S., Albrechtsen, A., and Nielsen, R. (2014). ANGSD: analysisof next generation sequencing data. BMC Bioinformatics, 15(1):356.
Ladizinsky, G. (1999). On the origin of almond. Genetic Resources and CropEvolution, 46(2):143–147.
Li, H. (2013). Aligning sequence reads, clone sequences and assembly contigswith BWA-MEM. arXiv preprint arXiv:1303.3997.
16
.CC-BY-NC-ND 4.0 International licensepeer-reviewed) is the author/funder. It is made available under aThe copyright holder for this preprint (which was not. http://dx.doi.org/10.1101/060160doi: bioRxiv preprint first posted online Jun. 22, 2016;
Li, X.-w., Meng, X.-q., Jia, H.-j., Yu, M.-l., Ma, R.-j., Wang, L.-r., Cao, K.,Shen, Z.-j., Niu, L., Tian, J.-b., Chen, M.-j., Xie, M., Arus, P., Gao, Z.-s.,and Aranzana, M. J. (2013). Peach genetic resources: diversity, populationstructure and linkage disequilibrium. BMC genetics, 14(1):1.
Martınez-Gomez, P., Arulsekar, S., Potter, D., and Gradziel, T. M. (2003).An extended interspecific gene pool available to peach and almond breedingas characterized using simple sequence repeat (SSR) markers. Euphytica,131(3):313–322.
McKey, D., Elias, M., Pujol, B., and Duputie, A. (2010). The evolutionary ecol-ogy of clonally propagated domesticated plants. New Phytologist, 186(2):318–332.
Micheletti, D., Dettori, M. T., Micali, S., Aramini, V., Pacheco, I., Linge, C.D. S., Foschi, S., Banchi, E., Barreneche, T., Quilot-Turion, B., et al. (2015).Whole-genome analysis of diversity and SNP-major gene association in peachgermplasm. PloS one, 10(9):e0136803.
Miller, A. J. and Gross, B. L. (2011). From forest to field: perennial fruit cropdomestication. American Journal of Botany, 98(9):1389–1414.
Miller, P. J., Parfitt, D. E., and Weinbaum, S. A. (1989). Outcrossing in peach.HortScience, 24(2):359–360.
Molnar, P., Boos, W. R., and Battisti, D. S. (2010). Orographic controls on cli-mate and paleoclimate of Asia: thermal and mechanical roles for the TibetanPlateau. Annual Review of Earth and Planetary Sciences, 38(1):77.
Mowrey, B. D., Werner, D. J., and Byrne, D. H. (1990). Isozyme survey ofvarious species of Prunus in the subgenus Amygdalus. Scientia Horticulturae,44(3):251–260.
Nei, M. and Li, W.-H. (1979). Mathematical model for studying genetic vari-ation in terms of restriction endonucleases. Proceedings of the NationalAcademy of Sciences, 76(10):5269–5273.
Okie, W. R. et al. (1998). Handbook of peach and nectarine varieties. Perfor-mance in the Southeastern United States and index of names. AgricultureHandbook (Washington), (714).
Potter, D. (2011). Prunus. In Wild Crop Relatives: Genomic and BreedingResources, pages 129–145. Springer.
Rehder, A. (1940). Manual of Cultivated Trees and Shrubs. Macmillan Company,New York.
Ross-Ibarra, J., Morrell, P. L., and Gaut, B. S. (2007). Plant domestication, aunique opportunity to identify the genetic basis of adaptation. Proceedings ofthe National Academy of Sciences, 104(suppl 1):8641–8648.
17
.CC-BY-NC-ND 4.0 International licensepeer-reviewed) is the author/funder. It is made available under aThe copyright holder for this preprint (which was not. http://dx.doi.org/10.1101/060160doi: bioRxiv preprint first posted online Jun. 22, 2016;
Scorza, R. and Okie, W. R. (1991). Peaches (Prunus). Acta Horticulturae,290:177–234.
Shen, Z., Ma, R., Cai, Z., Yu, M., and Zhang, Z. (2015). Diversity, populationstructure, and evolution of local peach cultivars in china identified by simplesequence repeats. Genetics and molecular research: GMR, 14(1):101.
Skotte, L., Korneliussen, T. S., and Albrechtsen, A. (2013). Estimating individ-ual admixture proportions from next generation sequencing data. Genetics,195(3):693–702.
Slotte, T., Hazzouri, K. M., Agren, J. A., Koenig, D., Maumus, F., Guo, Y.-L., Steige, K., Platts, A. E., Escobar, J. S., Newman, L. K., Wang, W.,Mandakova, T., Vello, E., Smith, L. M., Henz, S. R., Steffen, J., Takuno, S.,Brandvain, Y., Coop, G., Andolfatto, P., Hu, T. T., Blanchette, M., Clark,R. M., Quesneville, H., Nordborg, M., Gaut, B. S., Lysak, M. A., Jenkins, J.,Grimwood, J., Chapman, J., Prochnik, S., Shu, S., Rokhsar, D., Schmutz, J.,Weigel, D., and Wright, S. I. (2013). The Capsella rubella genome and thegenomic consequences of rapid mating system evolution. Nature Genetics,45(7):831–835.
Spiegel-Roy, P. (1986). Domestication of fruit trees. Developments in agricul-tural and managed-forest ecology, 16:201–211.
Su, T., Wilf, P., Huang, Y., Zhang, S., and Zhou, Z. (2015). Peaches precededhumans: Fossil evidence from SW China. Scientific Reports, 5:16794–16794.
Tajima, F. (1989). Statistical method for testing the neutral mutation hypoth-esis by DNA polymorphism. Genetics, 123(3):585–595.
Tao, R., Watari, A., Hanada, T., Habu, T., Yaegaki, H., Yamaguchi, M., andYamane, H. (2007). Self-compatible peach (Prunus persica) has mutant ver-sions of the S haplotypes found in self-incompatible Prunus species. PlantMolecular Biology, 63(1):109–123.
Verde, I., Abbott, A. G., Scalabrin, S., Jung, S., Shu, S., Marroni, F.,Zhebentyayeva, T., Dettori, M. T., Grimwood, J., Cattonaro, F., Zuccolo,A., Rossini, L., Jenkins, J., Vendramin, E., Meisel, L. A., Decroocq, V.,Sosinski, B., Prochnik, S., Mitros, T., Policriti, A., Cipriani, G., Dondini,L., Ficklin, S., Goodstein, D. M., Xuan, P., Del Fabbro, C., Aramini, V.,Copetti, D., Gonzalez, S., Horner, D. S., Falchi, R., Lucas, S., Mica, E., Mal-donado, J., Lazzari, B., Bielenberg, D., Pirona, R., Miculan, M., Barakat,A., Testolin, R., Stella, A., Tartarini, S., Tonutti, P., Arus, P., Orellana, A.,Wells, C., Main, D., Vizzotto, G., Silva, H., Salamini, F., Schmutz, J., Mor-gante, M., and Rokhsar, D. S. (2013). The high-quality draft genome of peach(Prunus persica) identifies unique patterns of genetic diversity, domesticationand genome evolution. Nature Genetics, 45(5):487–494.
18
.CC-BY-NC-ND 4.0 International licensepeer-reviewed) is the author/funder. It is made available under aThe copyright holder for this preprint (which was not. http://dx.doi.org/10.1101/060160doi: bioRxiv preprint first posted online Jun. 22, 2016;
Vermeer, J. E. and Geldner, N. (2015). Lateral root initiation in arabidopsisthaliana: a force awakens. F1000prime reports, 7.
Vieira, J., Fonseca, N. A., Santos, R. A., Habu, T., Tao, R., and Vieira, C. P.(2008). The number, age, sharing and relatedness of S -locus specificities inPrunus. Genetics research, 90(01):17–26.
Wang, J., Street, N. R., Scofield, D. G., and Ingvarsson, P. K. (2016). Naturalselection and recombination rate variation shape nucleotide polymorphismacross the genomes of three related populus species. Genetics, pages 1185–1200.
Wellington, R., Stout, A. B., Einset, O., and Van Alstyne, L. M. (1929). Polli-nation of fruit trees. Bulletin of the New York State Agricultural ExperimentStation, 577:3–54.
Wright, S. I., Kalisz, S., and Slotte, T. (2013). Evolutionary consequences ofself-fertilization in plants. Proceedings of the Royal Society of London B:Biological Sciences, 280(1760):20130133.
Wu, J., Gu, C., Khan, M. A., Wu, J., Gao, Y., Wang, C., Korban, S. S., andZhang, S. (2013). Molecular determinants and mechanisms of gametophyticself-incompatibility in fruit trees of Rosaceae. Critical Reviews in Plant Sci-ences, 32(1):53–68.
Zeinalabedini, M., Khayam-Nekoui, M., Grigorian, V., Gradziel, T., andMartinez-Gomez, P. (2010). The origin and dissemination of the cultivated al-mond as determined by nuclear and chloroplast SSR marker analysis. ScientiaHorticulturae, 125(4):593–601.
Zeng, K., Fu, Y.-X., Shi, S., and Wu, C.-I. (2006). Statistical tests for detectingpositive selection by utilizing high-frequency variants. Genetics, 174(3):1431–1439.
Zheng, Y., Crawford, G. W., and Chen, X. (2014). Archaeological evidence forpeach (Prunus persica) cultivation and domestication in China. PloS One,9(9):e106595.
Zohary, D., Hopf, M., and Weiss, E. (2012). Domestication of Plants in the OldWorld. Oxford University Press, Oxford.
19
.CC-BY-NC-ND 4.0 International licensepeer-reviewed) is the author/funder. It is made available under aThe copyright holder for this preprint (which was not. http://dx.doi.org/10.1101/060160doi: bioRxiv preprint first posted online Jun. 22, 2016;
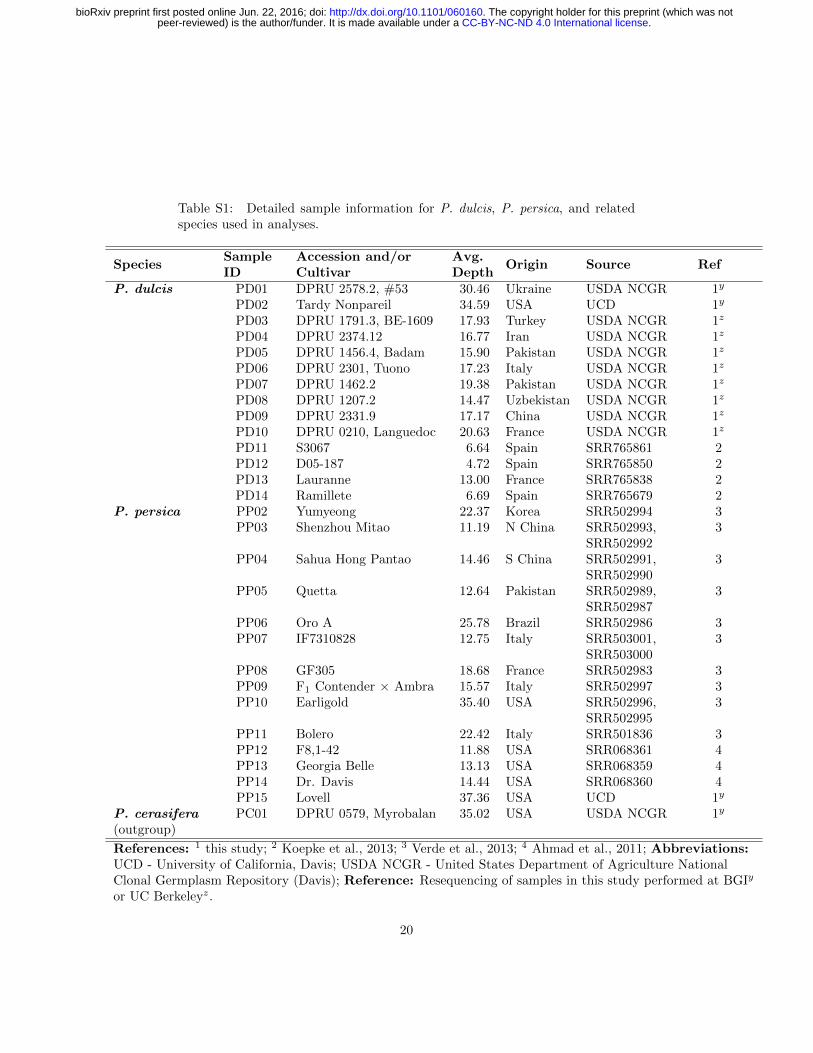
Table S1: Detailed sample information for P. dulcis, P. persica, and relatedspecies used in analyses.
SpeciesSampleID
Accession and/orCultivar
Avg.Depth
Origin Source Ref
P. dulcis PD01 DPRU 2578.2, #53 30.46 Ukraine USDA NCGR 1y
PD02 Tardy Nonpareil 34.59 USA UCD 1y
PD03 DPRU 1791.3, BE-1609 17.93 Turkey USDA NCGR 1z
PD04 DPRU 2374.12 16.77 Iran USDA NCGR 1z
PD05 DPRU 1456.4, Badam 15.90 Pakistan USDA NCGR 1z
PD06 DPRU 2301, Tuono 17.23 Italy USDA NCGR 1z
PD07 DPRU 1462.2 19.38 Pakistan USDA NCGR 1z
PD08 DPRU 1207.2 14.47 Uzbekistan USDA NCGR 1z
PD09 DPRU 2331.9 17.17 China USDA NCGR 1z
PD10 DPRU 0210, Languedoc 20.63 France USDA NCGR 1z
PD11 S3067 6.64 Spain SRR765861 2PD12 D05-187 4.72 Spain SRR765850 2PD13 Lauranne 13.00 France SRR765838 2PD14 Ramillete 6.69 Spain SRR765679 2
P. persica PP02 Yumyeong 22.37 Korea SRR502994 3PP03 Shenzhou Mitao 11.19 N China SRR502993,
SRR5029923
PP04 Sahua Hong Pantao 14.46 S China SRR502991,SRR502990
3
PP05 Quetta 12.64 Pakistan SRR502989,SRR502987
3
PP06 Oro A 25.78 Brazil SRR502986 3PP07 IF7310828 12.75 Italy SRR503001,
SRR5030003
PP08 GF305 18.68 France SRR502983 3PP09 F1 Contender × Ambra 15.57 Italy SRR502997 3PP10 Earligold 35.40 USA SRR502996,
SRR5029953
PP11 Bolero 22.42 Italy SRR501836 3PP12 F8,1-42 11.88 USA SRR068361 4PP13 Georgia Belle 13.13 USA SRR068359 4PP14 Dr. Davis 14.44 USA SRR068360 4PP15 Lovell 37.36 USA UCD 1y
P. cerasifera(outgroup)
PC01 DPRU 0579, Myrobalan 35.02 USA USDA NCGR 1y
References: 1 this study; 2 Koepke et al., 2013; 3 Verde et al., 2013; 4 Ahmad et al., 2011; Abbreviations:UCD - University of California, Davis; USDA NCGR - United States Department of Agriculture NationalClonal Germplasm Repository (Davis); Reference: Resequencing of samples in this study performed at BGIy
or UC Berkeleyz.
20
.CC-BY-NC-ND 4.0 International licensepeer-reviewed) is the author/funder. It is made available under aThe copyright holder for this preprint (which was not. http://dx.doi.org/10.1101/060160doi: bioRxiv preprint first posted online Jun. 22, 2016;
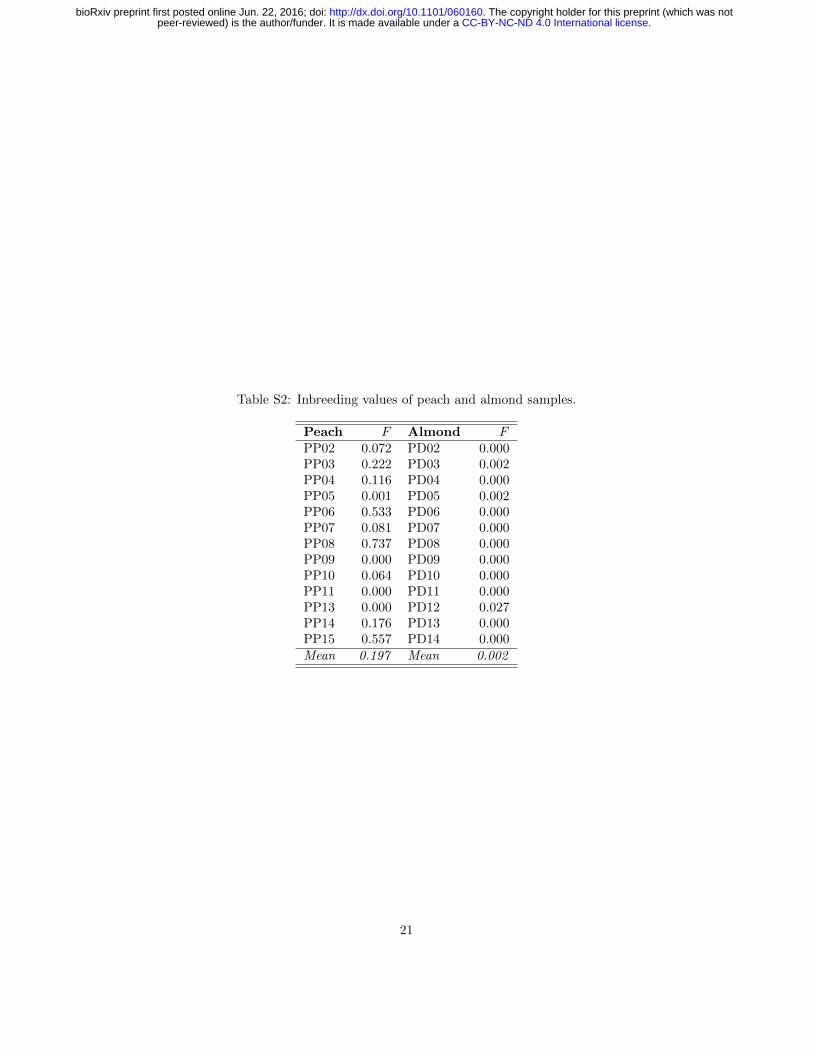
Table S2: Inbreeding values of peach and almond samples.
Peach F Almond FPP02 0.072 PD02 0.000PP03 0.222 PD03 0.002PP04 0.116 PD04 0.000PP05 0.001 PD05 0.002PP06 0.533 PD06 0.000PP07 0.081 PD07 0.000PP08 0.737 PD08 0.000PP09 0.000 PD09 0.000PP10 0.064 PD10 0.000PP11 0.000 PD11 0.000PP13 0.000 PD12 0.027PP14 0.176 PD13 0.000PP15 0.557 PD14 0.000Mean 0.197 Mean 0.002
21
.CC-BY-NC-ND 4.0 International licensepeer-reviewed) is the author/funder. It is made available under aThe copyright holder for this preprint (which was not. http://dx.doi.org/10.1101/060160doi: bioRxiv preprint first posted online Jun. 22, 2016;
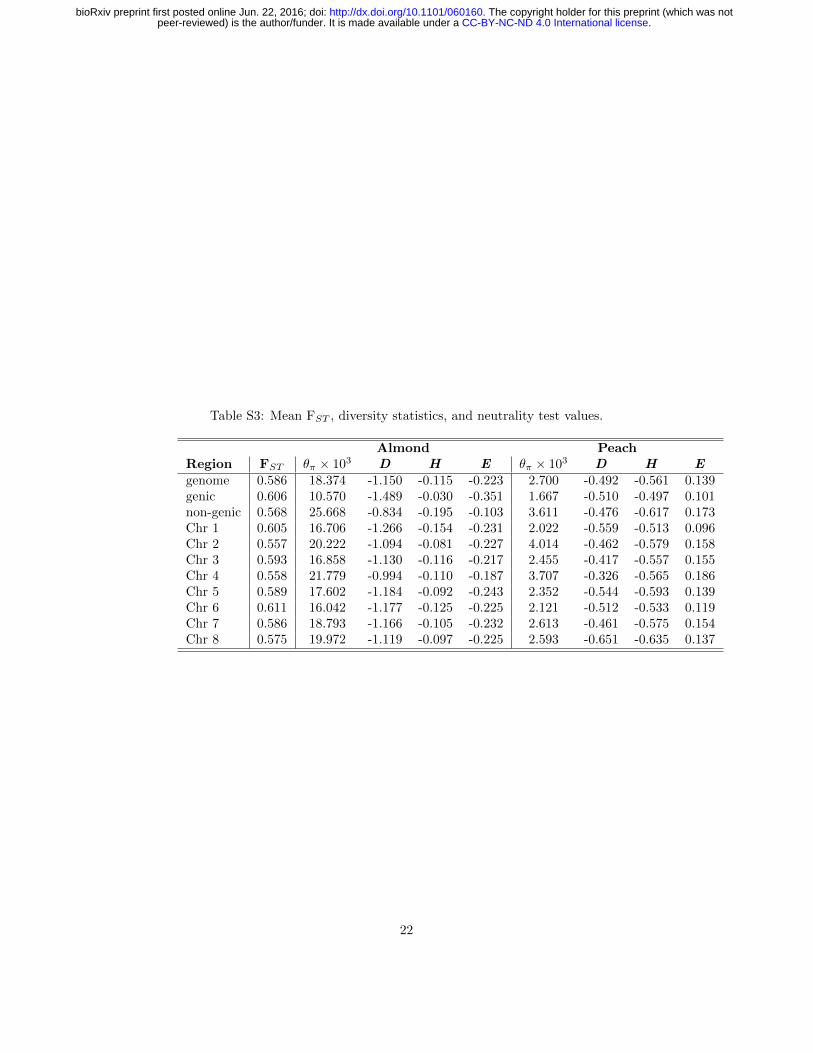
Table S3: Mean FST , diversity statistics, and neutrality test values.
Almond PeachRegion FST θπ × 103 D H E θπ × 103 D H Egenome 0.586 18.374 -1.150 -0.115 -0.223 2.700 -0.492 -0.561 0.139genic 0.606 10.570 -1.489 -0.030 -0.351 1.667 -0.510 -0.497 0.101non-genic 0.568 25.668 -0.834 -0.195 -0.103 3.611 -0.476 -0.617 0.173Chr 1 0.605 16.706 -1.266 -0.154 -0.231 2.022 -0.559 -0.513 0.096Chr 2 0.557 20.222 -1.094 -0.081 -0.227 4.014 -0.462 -0.579 0.158Chr 3 0.593 16.858 -1.130 -0.116 -0.217 2.455 -0.417 -0.557 0.155Chr 4 0.558 21.779 -0.994 -0.110 -0.187 3.707 -0.326 -0.565 0.186Chr 5 0.589 17.602 -1.184 -0.092 -0.243 2.352 -0.544 -0.593 0.139Chr 6 0.611 16.042 -1.177 -0.125 -0.225 2.121 -0.512 -0.533 0.119Chr 7 0.586 18.793 -1.166 -0.105 -0.232 2.613 -0.461 -0.575 0.154Chr 8 0.575 19.972 -1.119 -0.097 -0.225 2.593 -0.651 -0.635 0.137
22
.CC-BY-NC-ND 4.0 International licensepeer-reviewed) is the author/funder. It is made available under aThe copyright holder for this preprint (which was not. http://dx.doi.org/10.1101/060160doi: bioRxiv preprint first posted online Jun. 22, 2016;
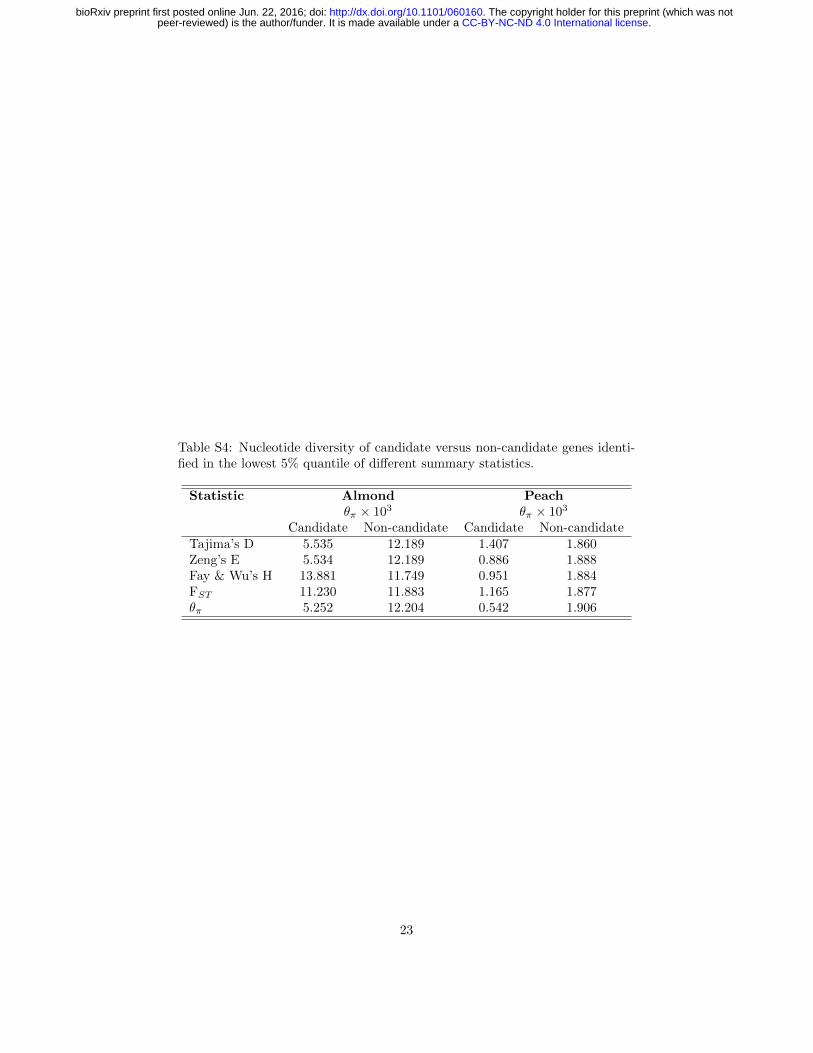
Table S4: Nucleotide diversity of candidate versus non-candidate genes identi-fied in the lowest 5% quantile of different summary statistics.
Statistic Almond Peachθπ × 103 θπ × 103
Candidate Non-candidate Candidate Non-candidateTajima’s D 5.535 12.189 1.407 1.860Zeng’s E 5.534 12.189 0.886 1.888Fay & Wu’s H 13.881 11.749 0.951 1.884FST 11.230 11.883 1.165 1.877θπ 5.252 12.204 0.542 1.906
23
.CC-BY-NC-ND 4.0 International licensepeer-reviewed) is the author/funder. It is made available under aThe copyright holder for this preprint (which was not. http://dx.doi.org/10.1101/060160doi: bioRxiv preprint first posted online Jun. 22, 2016;
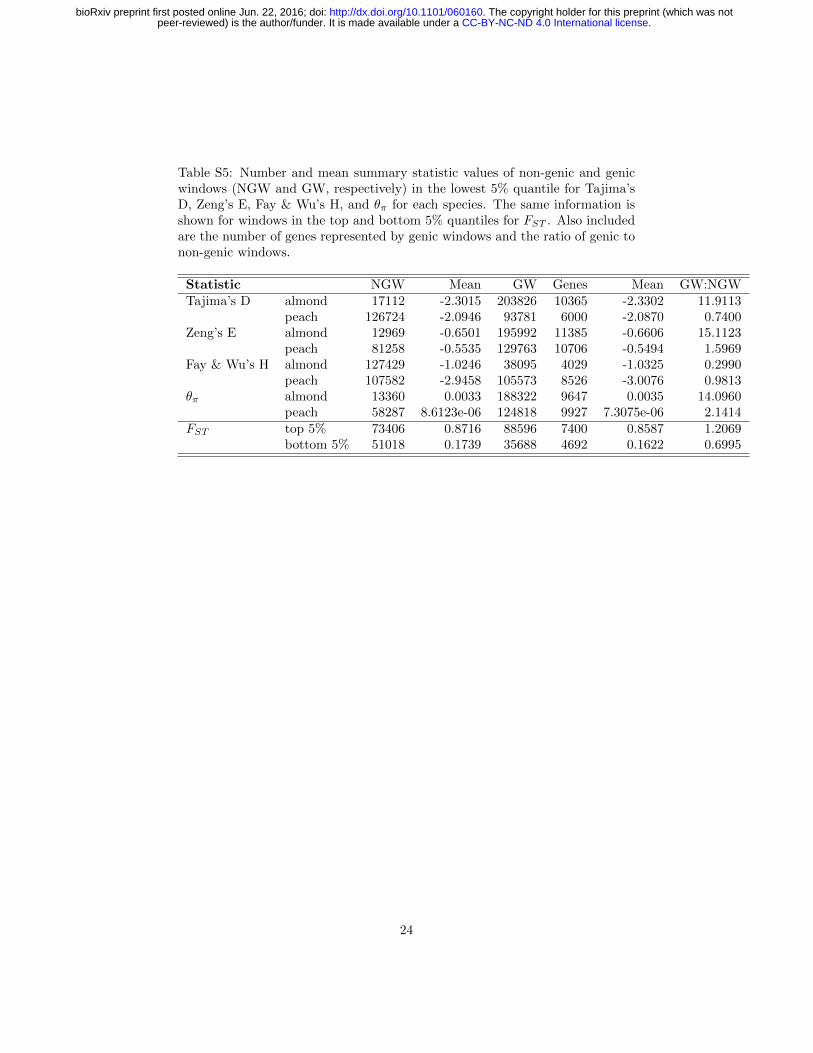
Table S5: Number and mean summary statistic values of non-genic and genicwindows (NGW and GW, respectively) in the lowest 5% quantile for Tajima’sD, Zeng’s E, Fay & Wu’s H, and θπ for each species. The same information isshown for windows in the top and bottom 5% quantiles for FST . Also includedare the number of genes represented by genic windows and the ratio of genic tonon-genic windows.
Statistic NGW Mean GW Genes Mean GW:NGWTajima’s D almond 17112 -2.3015 203826 10365 -2.3302 11.9113
peach 126724 -2.0946 93781 6000 -2.0870 0.7400Zeng’s E almond 12969 -0.6501 195992 11385 -0.6606 15.1123
peach 81258 -0.5535 129763 10706 -0.5494 1.5969Fay & Wu’s H almond 127429 -1.0246 38095 4029 -1.0325 0.2990
peach 107582 -2.9458 105573 8526 -3.0076 0.9813θπ almond 13360 0.0033 188322 9647 0.0035 14.0960
peach 58287 8.6123e-06 124818 9927 7.3075e-06 2.1414FST top 5% 73406 0.8716 88596 7400 0.8587 1.2069
bottom 5% 51018 0.1739 35688 4692 0.1622 0.6995
24
.CC-BY-NC-ND 4.0 International licensepeer-reviewed) is the author/funder. It is made available under aThe copyright holder for this preprint (which was not. http://dx.doi.org/10.1101/060160doi: bioRxiv preprint first posted online Jun. 22, 2016;
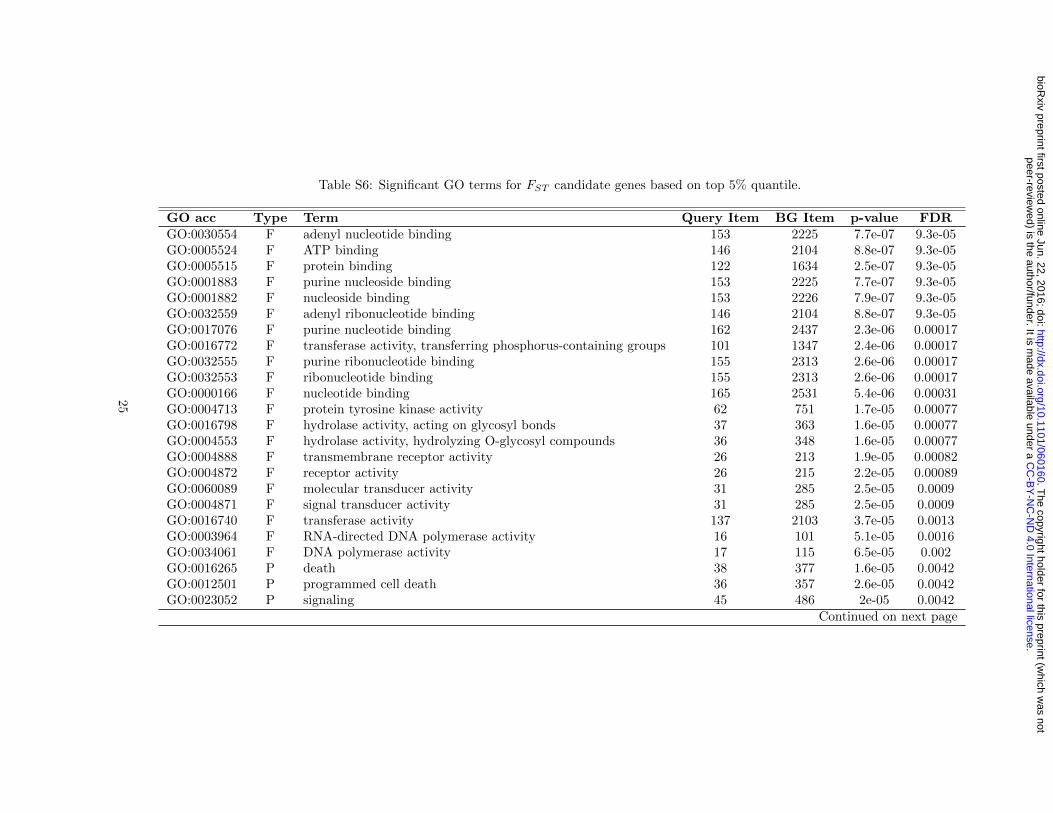
Table S6: Significant GO terms for FST candidate genes based on top 5% quantile.
GO acc Type Term Query Item BG Item p-value FDRGO:0030554 F adenyl nucleotide binding 153 2225 7.7e-07 9.3e-05GO:0005524 F ATP binding 146 2104 8.8e-07 9.3e-05GO:0005515 F protein binding 122 1634 2.5e-07 9.3e-05GO:0001883 F purine nucleoside binding 153 2225 7.7e-07 9.3e-05GO:0001882 F nucleoside binding 153 2226 7.9e-07 9.3e-05GO:0032559 F adenyl ribonucleotide binding 146 2104 8.8e-07 9.3e-05GO:0017076 F purine nucleotide binding 162 2437 2.3e-06 0.00017GO:0016772 F transferase activity, transferring phosphorus-containing groups 101 1347 2.4e-06 0.00017GO:0032555 F purine ribonucleotide binding 155 2313 2.6e-06 0.00017GO:0032553 F ribonucleotide binding 155 2313 2.6e-06 0.00017GO:0000166 F nucleotide binding 165 2531 5.4e-06 0.00031GO:0004713 F protein tyrosine kinase activity 62 751 1.7e-05 0.00077GO:0016798 F hydrolase activity, acting on glycosyl bonds 37 363 1.6e-05 0.00077GO:0004553 F hydrolase activity, hydrolyzing O-glycosyl compounds 36 348 1.6e-05 0.00077GO:0004888 F transmembrane receptor activity 26 213 1.9e-05 0.00082GO:0004872 F receptor activity 26 215 2.2e-05 0.00089GO:0060089 F molecular transducer activity 31 285 2.5e-05 0.0009GO:0004871 F signal transducer activity 31 285 2.5e-05 0.0009GO:0016740 F transferase activity 137 2103 3.7e-05 0.0013GO:0003964 F RNA-directed DNA polymerase activity 16 101 5.1e-05 0.0016GO:0034061 F DNA polymerase activity 17 115 6.5e-05 0.002GO:0016265 P death 38 377 1.6e-05 0.0042GO:0012501 P programmed cell death 36 357 2.6e-05 0.0042GO:0023052 P signaling 45 486 2e-05 0.0042
Continued on next page
25
.C
C-B
Y-N
C-N
D 4.0 International license
peer-reviewed) is the author/funder. It is m
ade available under aT
he copyright holder for this preprint (which w
as not.
http://dx.doi.org/10.1101/060160doi:
bioRxiv preprint first posted online Jun. 22, 2016;
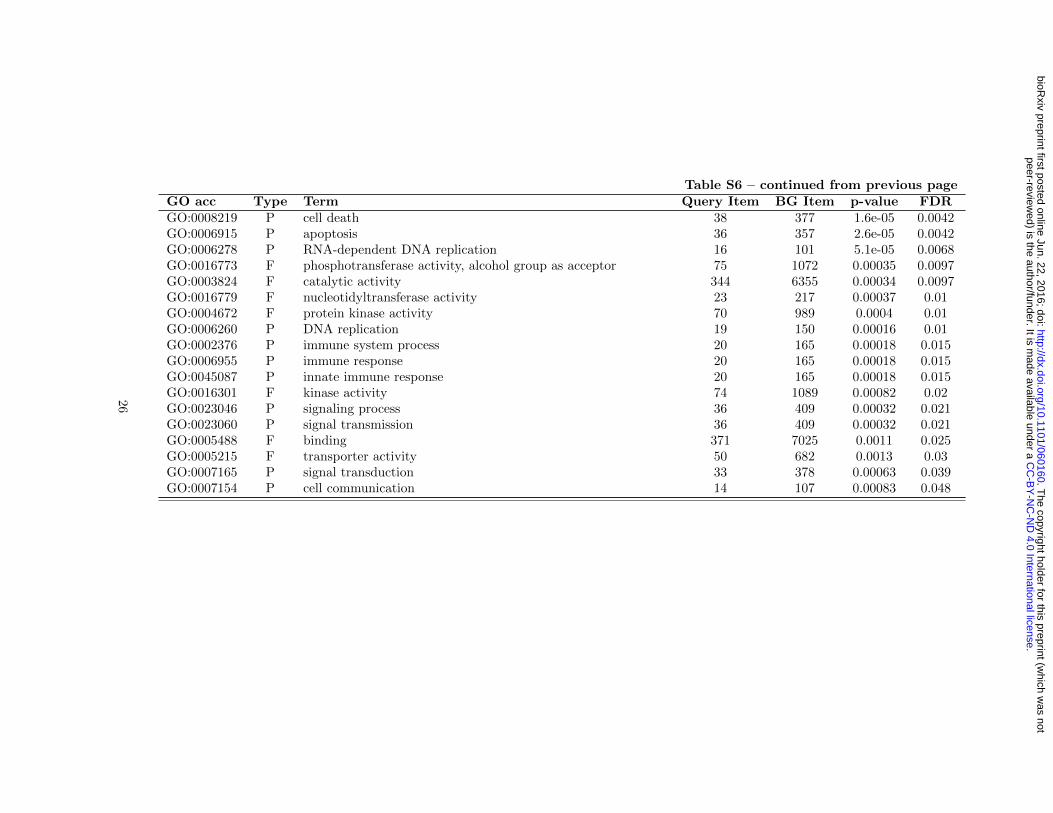
Table S6 – continued from previous pageGO acc Type Term Query Item BG Item p-value FDRGO:0008219 P cell death 38 377 1.6e-05 0.0042GO:0006915 P apoptosis 36 357 2.6e-05 0.0042GO:0006278 P RNA-dependent DNA replication 16 101 5.1e-05 0.0068GO:0016773 F phosphotransferase activity, alcohol group as acceptor 75 1072 0.00035 0.0097GO:0003824 F catalytic activity 344 6355 0.00034 0.0097GO:0016779 F nucleotidyltransferase activity 23 217 0.00037 0.01GO:0004672 F protein kinase activity 70 989 0.0004 0.01GO:0006260 P DNA replication 19 150 0.00016 0.01GO:0002376 P immune system process 20 165 0.00018 0.015GO:0006955 P immune response 20 165 0.00018 0.015GO:0045087 P innate immune response 20 165 0.00018 0.015GO:0016301 F kinase activity 74 1089 0.00082 0.02GO:0023046 P signaling process 36 409 0.00032 0.021GO:0023060 P signal transmission 36 409 0.00032 0.021GO:0005488 F binding 371 7025 0.0011 0.025GO:0005215 F transporter activity 50 682 0.0013 0.03GO:0007165 P signal transduction 33 378 0.00063 0.039GO:0007154 P cell communication 14 107 0.00083 0.048
26
.C
C-B
Y-N
C-N
D 4.0 International license
peer-reviewed) is the author/funder. It is m
ade available under aT
he copyright holder for this preprint (which w
as not.
http://dx.doi.org/10.1101/060160doi:
bioRxiv preprint first posted online Jun. 22, 2016;
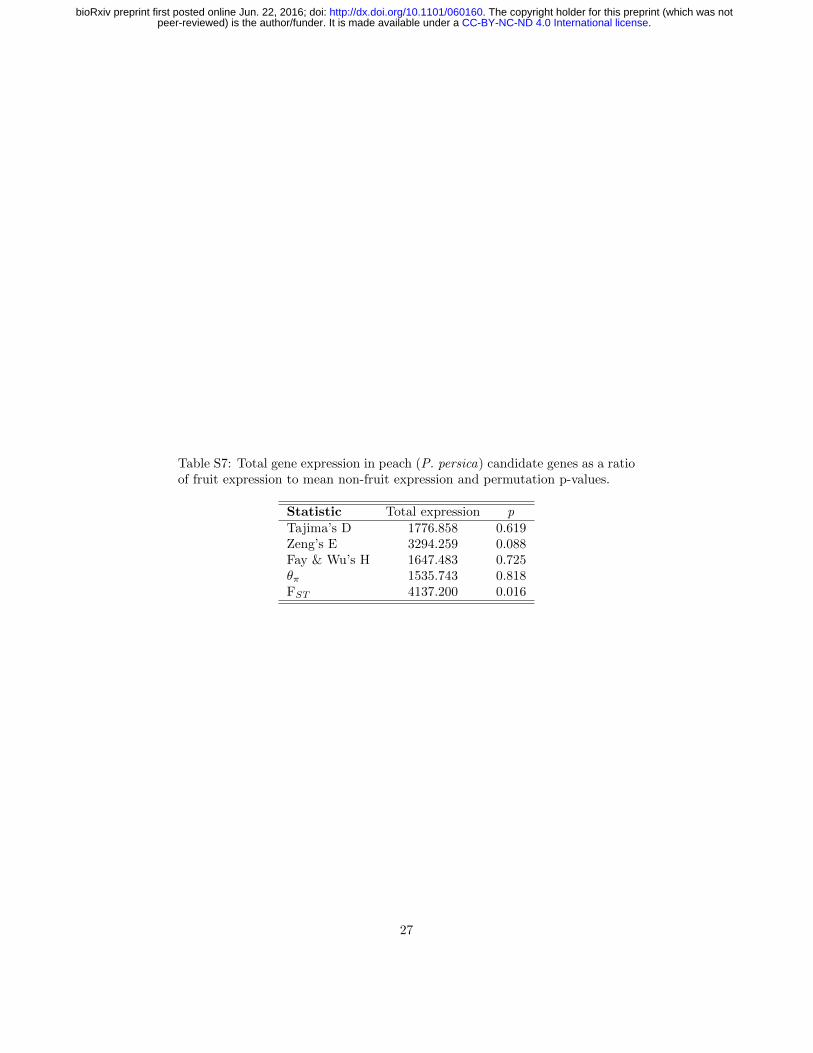
Table S7: Total gene expression in peach (P. persica) candidate genes as a ratioof fruit expression to mean non-fruit expression and permutation p-values.
Statistic Total expression pTajima’s D 1776.858 0.619Zeng’s E 3294.259 0.088Fay & Wu’s H 1647.483 0.725θπ 1535.743 0.818FST 4137.200 0.016
27
.CC-BY-NC-ND 4.0 International licensepeer-reviewed) is the author/funder. It is made available under aThe copyright holder for this preprint (which was not. http://dx.doi.org/10.1101/060160doi: bioRxiv preprint first posted online Jun. 22, 2016;
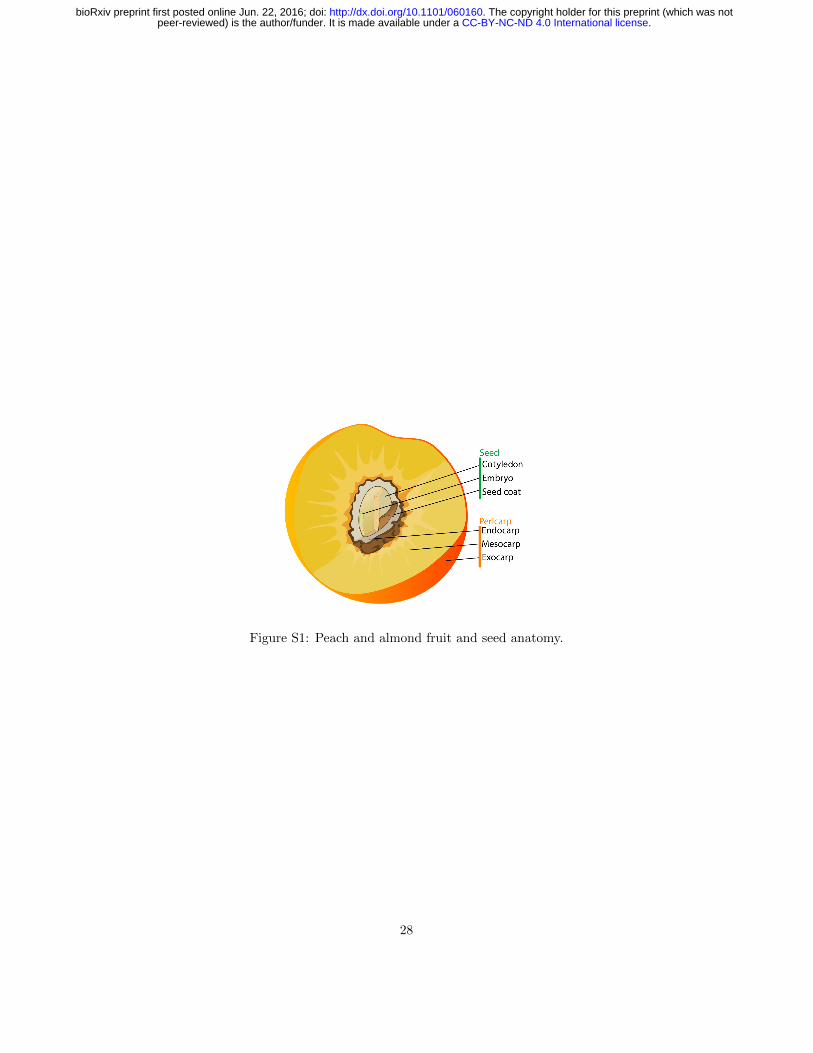
Figure S1: Peach and almond fruit and seed anatomy.
28
.CC-BY-NC-ND 4.0 International licensepeer-reviewed) is the author/funder. It is made available under aThe copyright holder for this preprint (which was not. http://dx.doi.org/10.1101/060160doi: bioRxiv preprint first posted online Jun. 22, 2016;
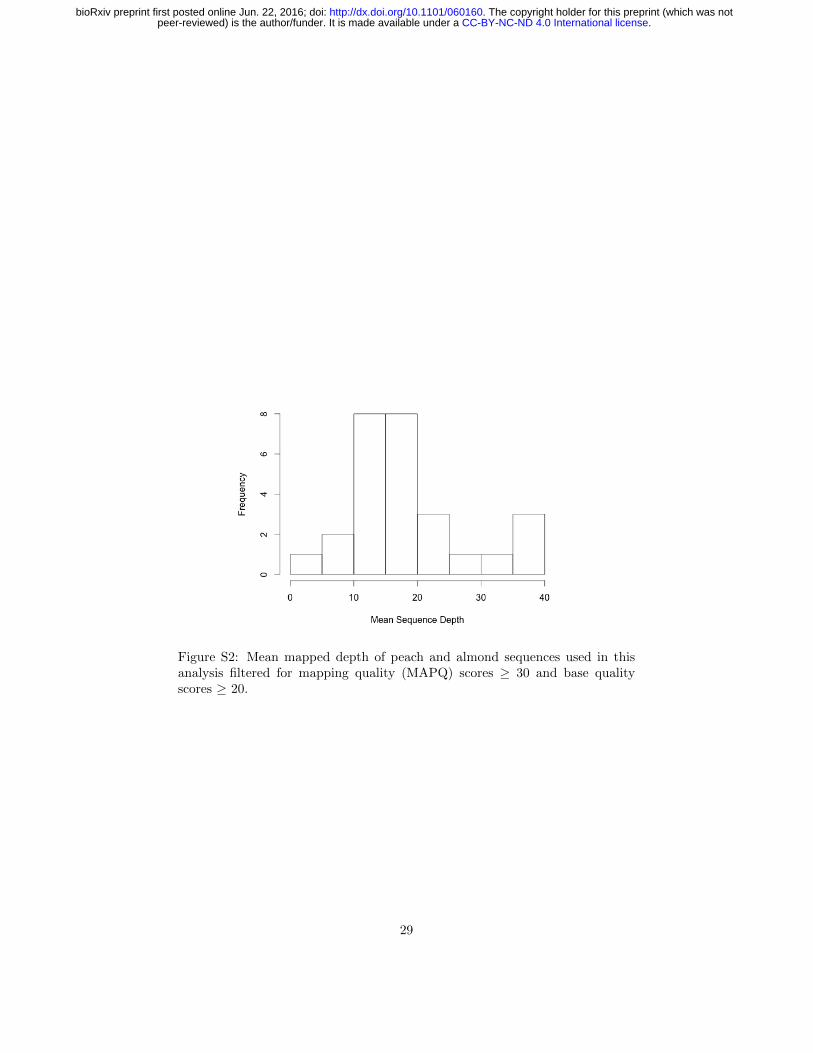
Figure S2: Mean mapped depth of peach and almond sequences used in thisanalysis filtered for mapping quality (MAPQ) scores ≥ 30 and base qualityscores ≥ 20.
29
.CC-BY-NC-ND 4.0 International licensepeer-reviewed) is the author/funder. It is made available under aThe copyright holder for this preprint (which was not. http://dx.doi.org/10.1101/060160doi: bioRxiv preprint first posted online Jun. 22, 2016;
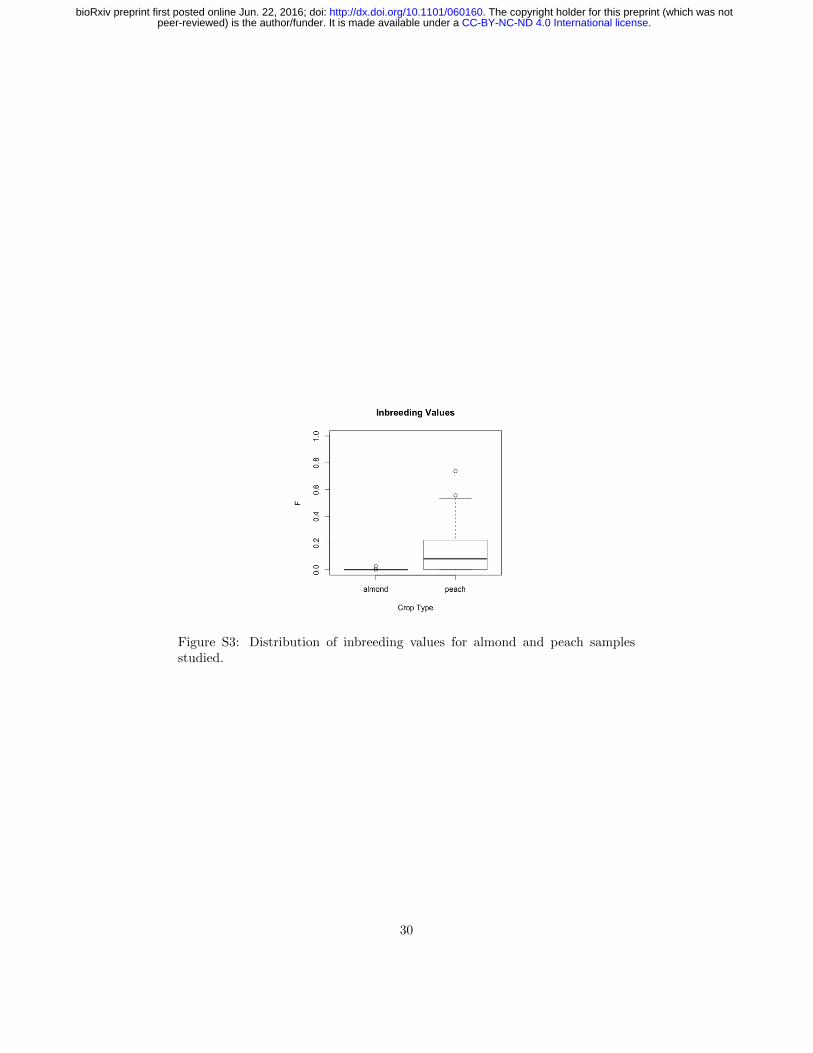
Figure S3: Distribution of inbreeding values for almond and peach samplesstudied.
30
.CC-BY-NC-ND 4.0 International licensepeer-reviewed) is the author/funder. It is made available under aThe copyright holder for this preprint (which was not. http://dx.doi.org/10.1101/060160doi: bioRxiv preprint first posted online Jun. 22, 2016;
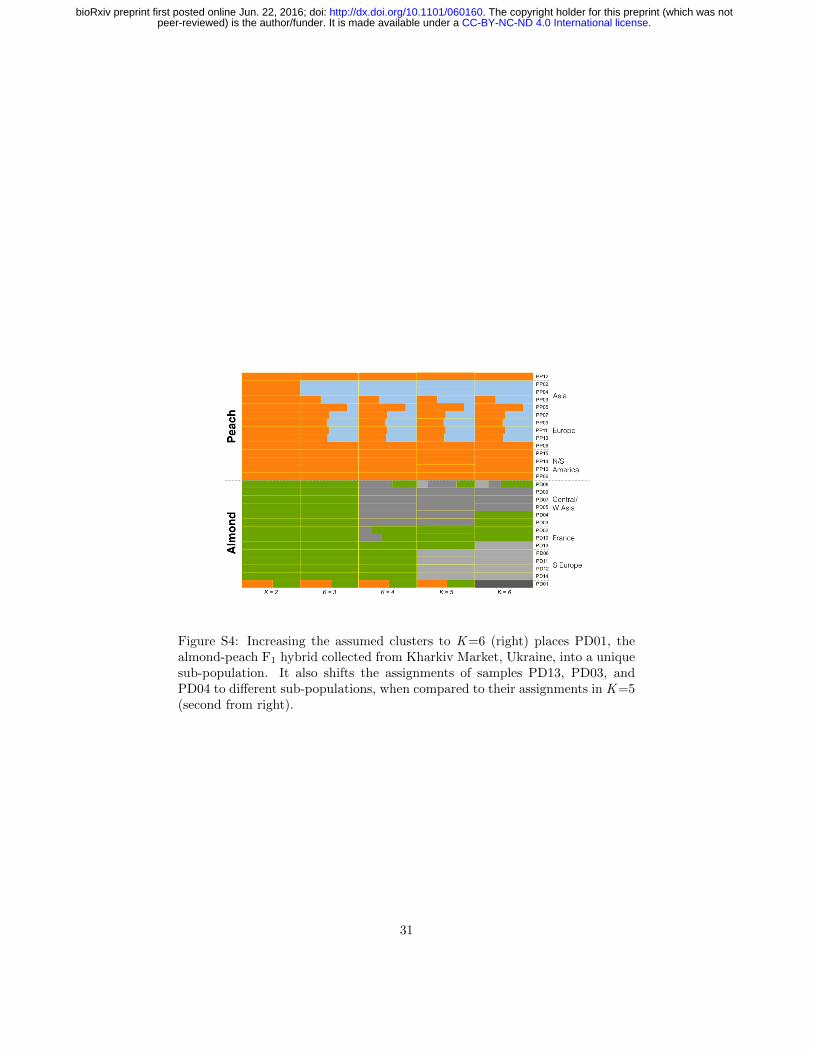
Figure S4: Increasing the assumed clusters to K =6 (right) places PD01, thealmond-peach F1 hybrid collected from Kharkiv Market, Ukraine, into a uniquesub-population. It also shifts the assignments of samples PD13, PD03, andPD04 to different sub-populations, when compared to their assignments in K =5(second from right).
31
.CC-BY-NC-ND 4.0 International licensepeer-reviewed) is the author/funder. It is made available under aThe copyright holder for this preprint (which was not. http://dx.doi.org/10.1101/060160doi: bioRxiv preprint first posted online Jun. 22, 2016;
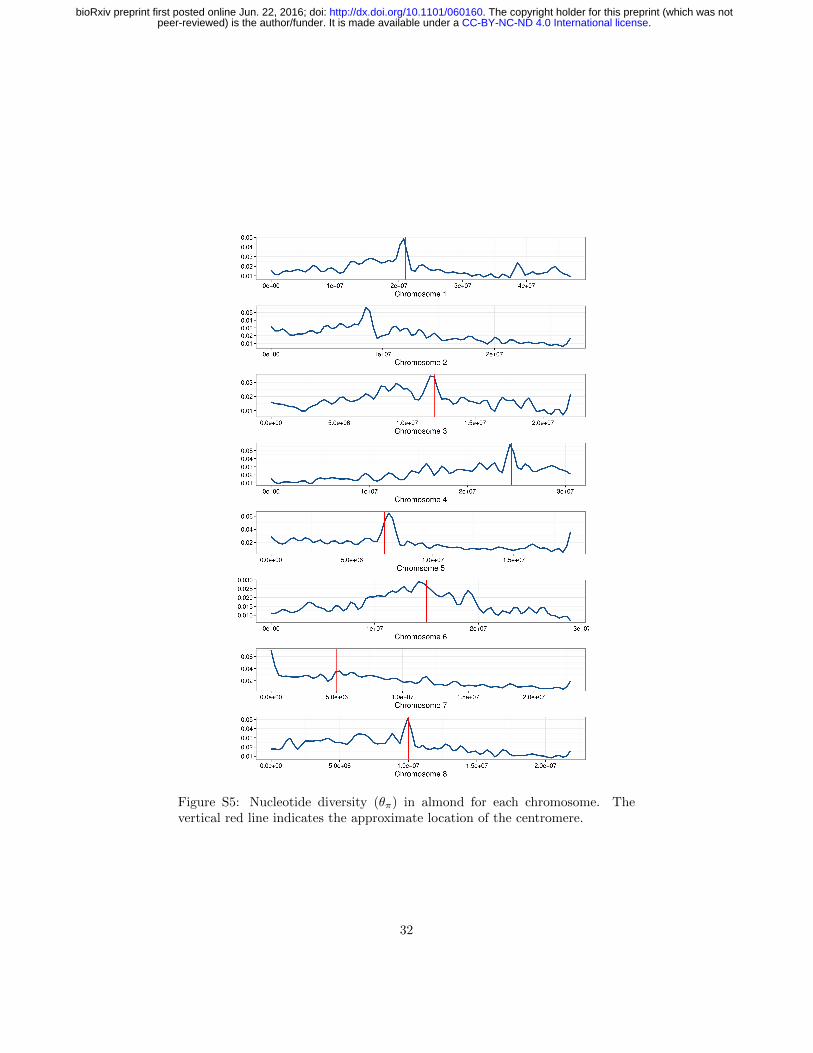
Figure S5: Nucleotide diversity (θπ) in almond for each chromosome. Thevertical red line indicates the approximate location of the centromere.
32
.CC-BY-NC-ND 4.0 International licensepeer-reviewed) is the author/funder. It is made available under aThe copyright holder for this preprint (which was not. http://dx.doi.org/10.1101/060160doi: bioRxiv preprint first posted online Jun. 22, 2016;
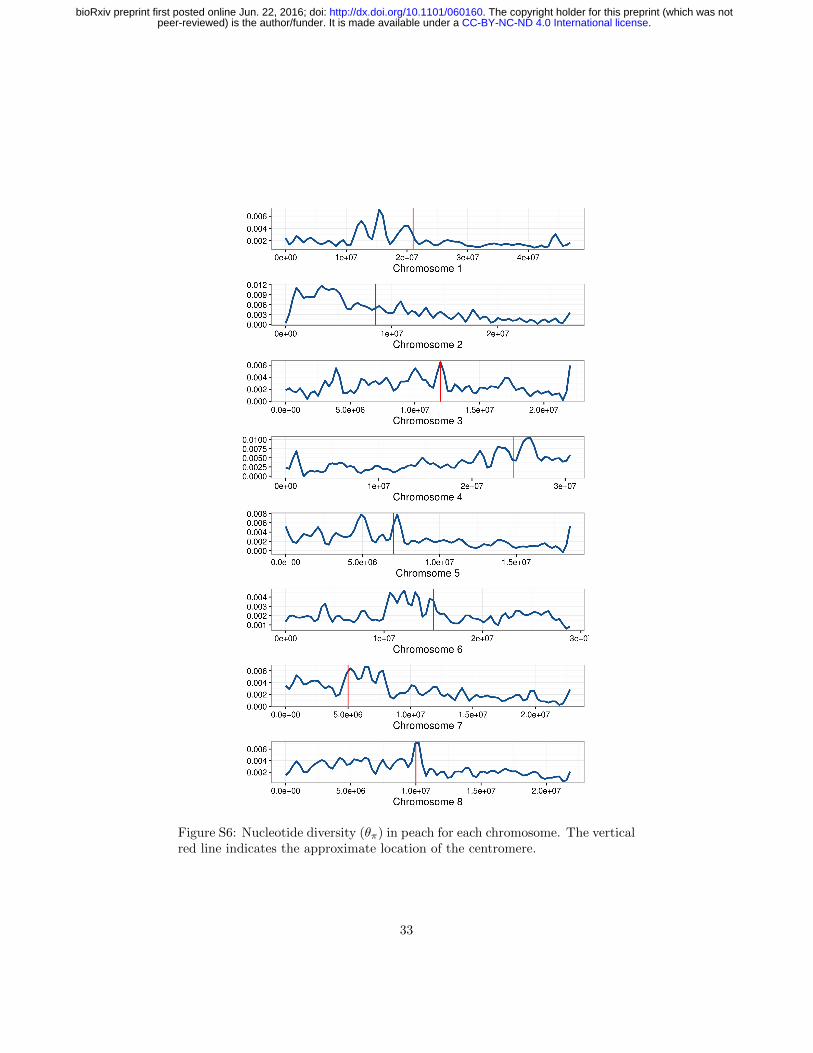
Figure S6: Nucleotide diversity (θπ) in peach for each chromosome. The verticalred line indicates the approximate location of the centromere.
33
.CC-BY-NC-ND 4.0 International licensepeer-reviewed) is the author/funder. It is made available under aThe copyright holder for this preprint (which was not. http://dx.doi.org/10.1101/060160doi: bioRxiv preprint first posted online Jun. 22, 2016;
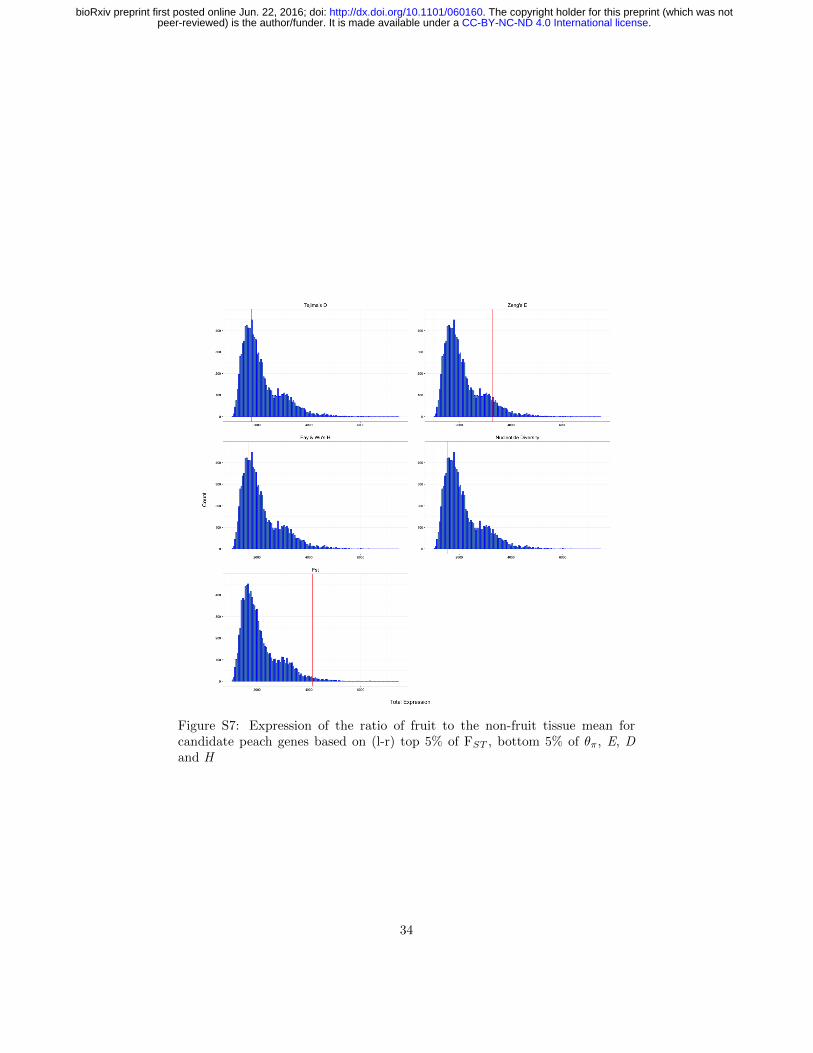
Figure S7: Expression of the ratio of fruit to the non-fruit tissue mean forcandidate peach genes based on (l-r) top 5% of FST , bottom 5% of θπ, E, Dand H
34
.CC-BY-NC-ND 4.0 International licensepeer-reviewed) is the author/funder. It is made available under aThe copyright holder for this preprint (which was not. http://dx.doi.org/10.1101/060160doi: bioRxiv preprint first posted online Jun. 22, 2016;