Embed Size (px)
Citation preview
Evolutionary dynamics of metabolic
resistance against ALS herbicides
Otto Richter1, Dirk Langemann2 and Roland Beffa3
1 Technische Universität Braunschweig, Institut für Geoökologie 2Technische Universität Braunschweig, Institut Computational Mathematics 3 BAYERCrop Science, Frankfurt am Main
Contents
•Mechanism of metabolic resistance against ALS inhibitors
•Polygenic inheritance model
•Gene expression
•Approach of Renton
•Derivation from metabolic model
•Time discrete model for weed development
•Assessment of management strategies
•Low dose or high dose?

Metabolic pathways
2 y1 y2 Valiney3
z1 z2
Leucine
ALS
x1 x2x3 x4 Isoleucine
Inhibitor
I2 I3 I4
P450 GST ABC
Breakdown products
Threonine
y4
z3
Pyruvate
I1
x5
y5
z4
2 y1 y2 Valiney3
z1 z2
Leucine
ALS
x1 x2x3 x4 Isoleucine
Inhibitor
I2 I3 I4
P450 GST ABC
Breakdown products
Threonine
y4
z3
Pyruvate
I1
x5
y5
z4
Note that phase I products may still act as inhibitor to ALS
(Werck-Reichardt et al. 2000).

Kinetic model
inputKI
IV
dt
dI
P
P
1
14501
G
GST
P
P
KI
IV
KI
IV
dt
dI
2
214502
ABC
ABS
G
GST
KI
IV
KI
IV
dt
dI
3
3
2
23
),,(2 511 yIyv
dt
dyALS
Oxidation of herbicide by cytochrome P450 monooxygenase (1.term).
Gluthatione conjugation of oxidized herbicide
Vacuolar transport of oxidized and conjugated herbicide
2 PYR 2-acetolactate
Key reaction of branched amino acids synthesis

ALS Kinetics
22
22
22
max
)1()1(
)1()1(
,,,)1()1(
)1(),,(
IV
IVss
ALS
ccLL
K
I
K
V
K
S
cL
VIVSv
Pyr Val ALS inhibitor

P450 activity low
(poor metabolizer)
0 50 100 1500
0.2
0.4ALS activity
µM
ol/m
in/m
g
0 50 100 1500
50Inhibitor
0 50 100 1500
2
4intermediates
Concentr
ation
0 50 100 1500
50Ox. inhibitor
0 50 100 1500
20
40cumulated valine
Concentr
ation
Time [min]
0 50 100 1500
50conj. inhibitor
Time [min]

P450 activity high
GST activity low
0 50 100 1500
0.2
0.4ALS activity
µM
ol/m
in/m
g
0 50 100 1500
50Inhibitor
0 50 100 1500
2
4intermediates
Concentr
ation
0 50 100 1500
50Ox. inhibitor
0 50 100 1500
20
40cumulated valine
Concentr
ation
Time [min]
0 50 100 1500
50conj. inhibitor
Time [min]

0 50 100 1500
0.2
0.4ALS activity
µM
ol/m
in/m
g
0 50 100 1500
50Inhibitor
0 50 100 1500
2
4intermediates
Concentr
ation
0 50 100 1500
50Ox. inhibitor
0 50 100 1500
20
40cumulated valine
Concentr
ation
Time [min]
0 50 100 1500
50conj. inhibitor
Time [min]
P450 and GST activity high
(rapid metabolizer)

Simulated dose response curves
10-2
10-1
100
101
0
0.1
0.2
0.3
0.4
0.5
0.6
0.7
0.8
0.9
1
Herbicide concentration
Cum
ula
ted v
alin
e
10-2
10-1
100
101
0
0.1
0.2
0.3
0.4
0.5
0.6
0.7
0.8
0.9
1
Herbicide concentration
Cum
ula
ted v
alin
eGST Aktivität
P450 Aktivität

Logistic dose-response
function
10 4 0.001 0.01 0.1 1 100.0
0.2
0.4
0.6
0.8
1.0
Inhibitor concentration
Vali
ne
Vali
nem
ax
)]log()(log(exp[1
1)(
edbdS
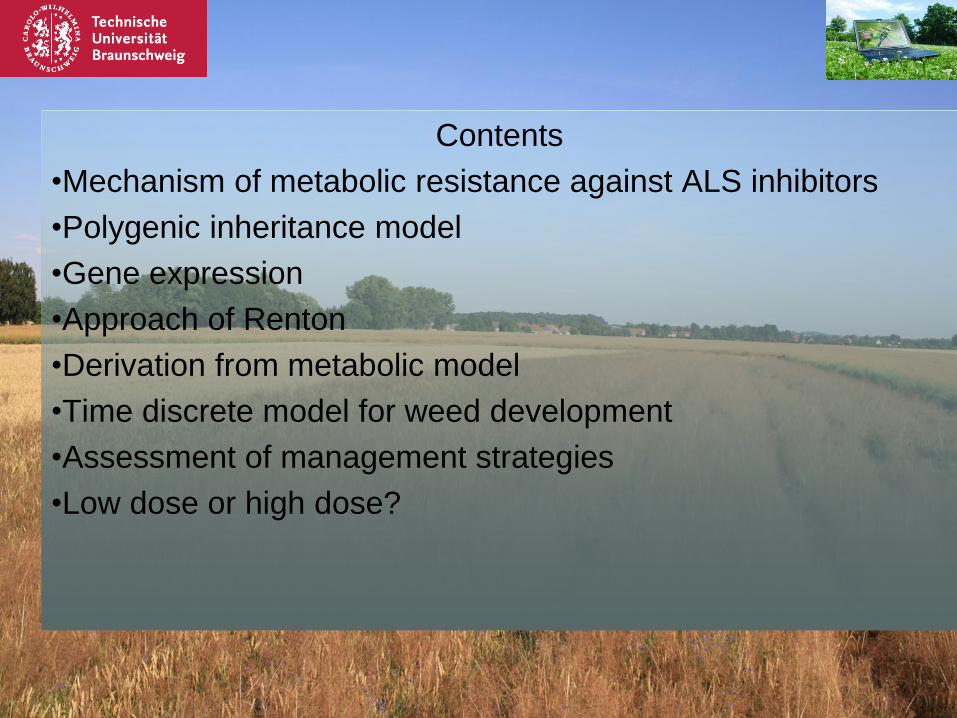
Polygenic inheritance model
Number of loci: ng
Number of biotypes: m=3ng
……………………………………
Biotype 1
Biotype 2
Biotype g
Genetic submodel

Evolutionary dynamics
t
mRRR ),,( 1
m
i itotal RR1
total
i
t
iR
RWRRg )(
iAi SpK
m
i iKK1
K
K
LK
KDJ i
i
max
)(hSuJR iii
)(expmax RgTh
RAS i
a
totalHi
wHtsAFttF pSppSS ))1(()1(
Seedlings
Young plants
Adult plants
Heredity function
Number of seeds
Index „i“ refers to biotype
Number of seeds
spring next year
Survival probability as a function of
application rate h
Heredity transmission matrix

Genetics: evaluation of
heredity transmission matrices
t
Xv )02/11(
t
xv )12/10(
t
XX vvV 1
t
Xx
t
xX vvvvV 2
t
xx vvV 3
imiii VVVW 21
000
04/12/1
02/11
1V
02/11
2/12/12/1
12/10
2V
12/10
2/14/10
000
3V
General case
Langemann, Richter and Vollrath 2012

Heredity transmission matrix
of biotype1, ng=3, m=27

Heredity transmission matrix of biotype 42
ng=4, m=81

Gene expression:
general approach of Renton
],,,[ 321 ngxxxxgt genotype
]2,1,0[ix
0: no resistant gene at locus i
1: one resistant gene at locus i
2: two resistant genes at locus i
epis
ng
xgrxxxxfr
ng
i i
ng
2
1max321
)(]),,,([
21
1
00
)(
i
i
i
i
xif
xifdom
xif
xg
with ]1,0[dom
resistance factor
Renton et al. 2011
epistasis factor

Derivation from metabolic
model
33
22
11
yx
yx
yx
gt
],[, hlyx ii
P450: low/ high metabolizer
GST: low/ high metabolizer
ABC: low/ high transport capacity
Assignment of resistance factor to genotypes
hh
hh
hh
gtmaxrr
ll
ll
ll
gtminrr
ll
ll
hh
gt max3.0 rr
)]()((exp[1
1),(
sEDrLogdLogbrdS
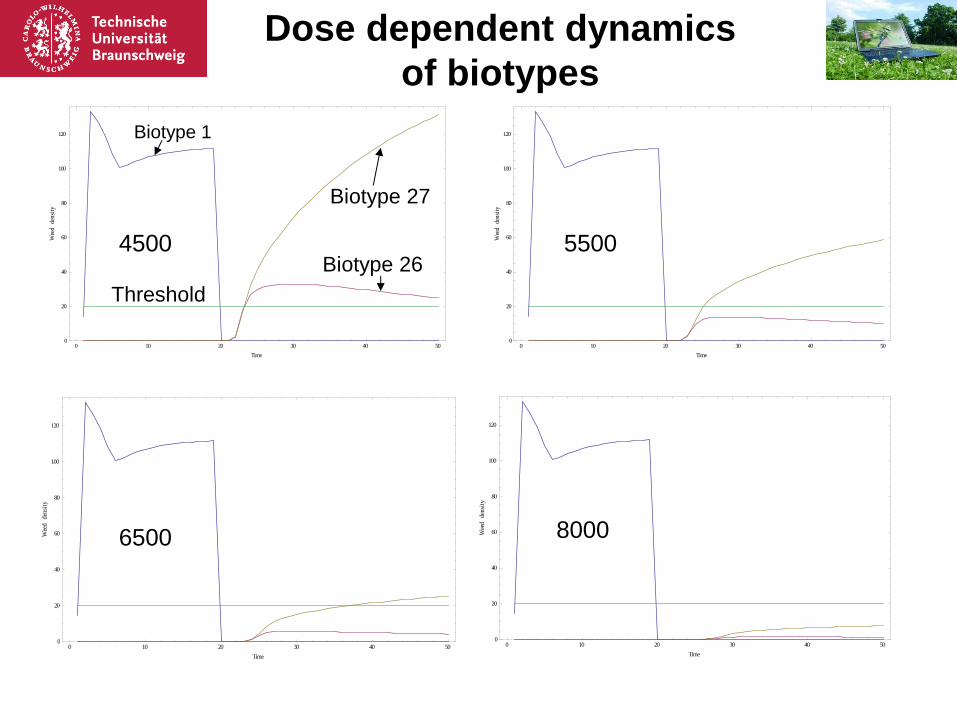
Dose dependent dynamics
of biotypes
0 10 20 30 40 500
20
40
60
80
100
120
Time
Wee
dde
nsit
y
0 10 20 30 40 500
20
40
60
80
100
120
Time
Wee
dde
nsit
y
0 10 20 30 40 500
20
40
60
80
100
120
Time
Wee
dde
nsit
y
0 10 20 30 40 500
20
40
60
80
100
120
Time
Wee
dde
nsit
y
4500 5500
6500 8000
Biotype 1
Biotype 27
Biotype 26
Threshold

Evolution of population
dose-response curves
D=1000

Evolution of biotypes
D=1000

Evolution of biotypes
D=4000
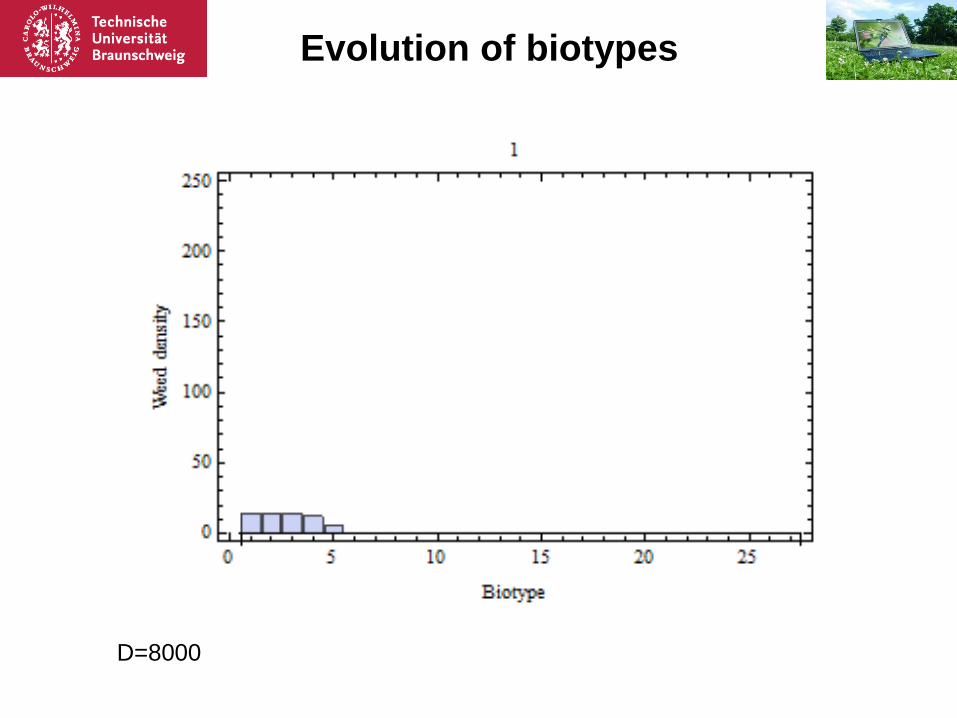
Evolution of biotypes
D=8000

Thank you for your attention!

Low dose vs high dose
8 9 10 11 12 13 14 150
100
200
300
400
500
600
Time
Wee
dde
nsit
y
8 9 10 11 12 13 14 150
100000
200000
300000
400000
500000
600000
700000
Time
See
dde
nsit
y
S1={ Dmax, Dmax, Dmax,Dmax,…}
S2={0.2 Dmax, 0.5 Dmax, Dmax,…}
S1
S2
S1 S2