Embed Size (px)
Citation preview
IWPCUltraHighCapacityNetworksWhitePaperVersion1.1 Page1
Do Not Copy or Distribute to ANY third party without prior written permission from IWPC © 2014, IWPC, TEL: +1‐215‐293‐9000, [email protected]
Evolutionary&DisruptiveVisionsTowardsUltraHighCapacityNetworks
ForCrowdandBroadband/DenseApplications
Access,BackhaulandUserEquipment
April2,2014
‐‐‐‐‐‐‐‐‐‐‐‐‐‐‐‐‐‐‐‐‐‐‐‐‐‐‐‐‐‐‐‐‐‐‐‐‐‐‐‐‐‐‐‐‐‐‐‐‐‐‐‐‐‐‐‐‐‐‐‐‐‐‐‐‐‐‐‐‐‐‐‐‐‐‐‐‐‐‐‐‐‐‐‐‐‐‐‐‐‐‐‐‐‐‐‐‐‐‐‐‐‐‐‐‐‐‐‐‐‐‐‐‐‐‐‐‐‐‐‐‐‐‐‐‐
Notice and Disclaimer –
The statements and viewpoints expressed in this White Paper are those of the IWPC 5000 X Working Group as of the release date
noted on the cover page. Except as expressly stated, they may not reflect the views of individual IWPC members. The IWPC 5000 X
Working Group has endeavored to provide information that is current and accurate as of the Release Date, but it does not warrant
that all information is complete and error‐free. Nor does it undertake to update this white paper based upon new information and
developments, though it may elect to do so in its sole discretion and without notice. All information in this white paper is provided
on an “AS IS” basis. The IWPC disclaims all express and implied warranties relating to the contents of this white paper.
The IWPC has not investigated or made an independent determination regarding title or non‐infringement of any technologies that
may be described or reference in this white paper. Persons seeking to implement such technologies are solely responsible for
making all assessments relating to title and non‐infringement of any technology, standard, or specification referenced in this
document and for obtaining appropriate authorization to use such technologies, standards, and specification, including through the
payment of any required license fees. IWPC and the IWPC Logo are trademarks of the IWPC.

IWPCUltraHighCapacityNetworksWhitePaperVersion1.1 Page2
Do Not Copy or Distribute to ANY third party without prior written permission from IWPC © 2014, IWPC, TEL: +1‐215‐293‐9000, [email protected]
Table of Contents
Access, Backhaul and User Equipment ................................................................................................................ 1
Table of Contents ............................................................................................................................................... 2
Table of Figures .................................................................................................................................................. 5
1 Whitepaper Objectives .............................................................................................................................. 6
2 Executive Summary ................................................................................................................................... 7
3 Introduction .............................................................................................................................................. 9
4 Key Incentives for 5G ................................................................................................................................ 11
4.1 Massive growth in traffic ........................................................................................................................... 11
4.1.1 Use cases that drive future traffic growth ............................................................................................. 13
4.2 Massive growth in the number of connected devices ................................................................................ 14
4.3 Wide range of requirements and characteristics ....................................................................................... 15
5 Requirements and Challenges for future wireless systems (may be termed as 5G) ..................................... 16
5.1 Architecture trends in 3G and 4G ............................................................................................................... 17
5.2 Architecture Requirements and Solutions for future Wireless Systems ..................................................... 17
5.3 Deployment Models in Future Wireless Systems ........................................................................................ 19
5.3.1 Planned Small Cells Deployment ........................................................................................................... 19
5.3.2 Unplanned Small Cells Deployment ....................................................................................................... 20
6 Spectrum & Propagation Aspects .............................................................................................................. 21
6.1 New spectrum from 6 GHz to 100 GHz ....................................................................................................... 21
6.2 Other uses of the spectrum above 6 GHz. .................................................................................................. 22
6.3 Propagation in mm‐wave bands ................................................................................................................ 23
6.4 Terrestrial propagation and deployment issues for mm‐wave systems ..................................................... 26
6.5 The interference and power advantage of mm‐wave spectrum ................................................................ 28
7 Propagation characteristics of mm‐wave bands ......................................................................................... 29
7.1 Frequency dependence of propagation mechanisms ................................................................................. 29
7.1.1 Free‐space propagation: ........................................................................................................................ 29
7.1.2 Atmospheric effects: .............................................................................................................................. 30
7.1.3 Penetration losses: ................................................................................................................................ 30
7.1.4 Reflection: .............................................................................................................................................. 31
IWPCUltraHighCapacityNetworksWhitePaperVersion1.1 Page3
Do Not Copy or Distribute to ANY third party without prior written permission from IWPC © 2014, IWPC, TEL: +1‐215‐293‐9000, [email protected]
7.1.1 Diffraction: ............................................................................................................................................. 32
7.1.2 Scattering: .............................................................................................................................................. 33
7.1.3 Foliage losses: ........................................................................................................................................ 33
7.2 Radio channel characterization and modeling ........................................................................................... 33
7.2.1 Path loss and time dispersion ................................................................................................................ 38
7.3 Challenges with respect to mm‐wave outdoor channel modeling ............................................................. 40
7.4 Summary observations of mm‐wave prospects ......................................................................................... 41
8 Overview of Access and Backhaul Technologies for 4G systems ................................................................. 42
8.1 Overview of 4G LTE Access Technology ...................................................................................................... 42
8.1.1 Downlink ................................................................................................................................................ 43
8.1.2 Uplink ..................................................................................................................................................... 44
8.2 LTE‐Advanced Technology .......................................................................................................................... 45
8.3 Overview of 4G Backhaul Technology ........................................................................................................ 45
8.3.1 Backhaul Taxonomy ............................................................................................................................... 46
9 Access and Backhaul Technologies for 5G systems ..................................................................................... 46
9.1 General requirements................................................................................................................................. 46
9.2 Future Cellular Architecture: Scenario with radically more spectrum and cell densification ..................... 47
9.3 Current mm‐wave Standards for Future Cellular Systems ......................................................................... 48
9.3.1 802.11ad for Backhaul ........................................................................................................................... 50
9.4 Overview of 5G mm‐wave Access Technology ........................................................................................... 51
9.4.1 Waveform Selection .............................................................................................................................. 51
9.4.2 Frame Structure ..................................................................................................................................... 52
9.4.3 Duplexing Scheme ................................................................................................................................. 52
9.4.4 Multiple Access ...................................................................................................................................... 53
9.4.5 Link Budget ............................................................................................................................................ 53
9.5 Topology Options ....................................................................................................................................... 55
9.5.1 Topology Gaps ....................................................................................................................................... 56
10 Enabling Technologies for Base Station and User Equipments for 5G Systems ............................................ 57
10.1 2D Phased Array Antenna .......................................................................................................................... 57
10.2 2D Phased Array Antenna Processing for 3 to 6 GHz Systems ................................................................... 61
10.3 2D Phased Array Antenna Processing for mm‐wave Systems .................................................................... 62
10.4 UE Antennas for 3 to 6 GHz ........................................................................................................................ 65
10.5 IC Technology for mm‐wave Systems ......................................................................................................... 66
10.6 On‐chip and In‐Package Antennas for mm‐wave Systems ......................................................................... 67
IWPCUltraHighCapacityNetworksWhitePaperVersion1.1 Page4
Do Not Copy or Distribute to ANY third party without prior written permission from IWPC © 2014, IWPC, TEL: +1‐215‐293‐9000, [email protected]
10.7 User Equipment Power Consumption ......................................................................................................... 68
10.8 Massive MIMO ........................................................................................................................................... 69
10.9 Device Integration for mm‐Wave ............................................................................................................... 69
10.10 Mobility considerations for mm‐wave antennas ................................................................................... 69
11 Proposed Network Features for Future Cellular Systems (may be termed as 5G systems) .......................... 70
11.1 Mobility Management ............................................................................................................................... 70
11.1.1 Idle Mobility ...................................................................................................................................... 71
11.1.1.1 Discovery ....................................................................................................................................... 71
11.1.1.2 Paging Load Optimization ............................................................................................................. 71
11.1.2 Connected‐Mode Mobility ................................................................................................................ 72
11.1.2.1 Selection of Physical Layer Identifier ............................................................................................ 72
11.1.2.2 Neighbor Discovery ....................................................................................................................... 73
11.2 Frequent Handover Mitigation ................................................................................................................... 74
11.3 Transmit Power Management ................................................................................................................... 75
11.4 Radio Resource and Interference Management ......................................................................................... 77
11.5 Backhaul Management .............................................................................................................................. 78
11.6 Power Saving .............................................................................................................................................. 78
11.7 Centralized versus Distributed RAN ............................................................................................................ 79
12 List of Contributors ................................................................................................................................... 80
13 List of acronyms ........................................................................................................................................ 81
14 References ................................................................................................................................................ 83
IWPCUltraHighCapacityNetworksWhitePaperVersion1.1 Page5
Do Not Copy or Distribute to ANY third party without prior written permission from IWPC © 2014, IWPC, TEL: +1‐215‐293‐9000, [email protected]
Table of Figures
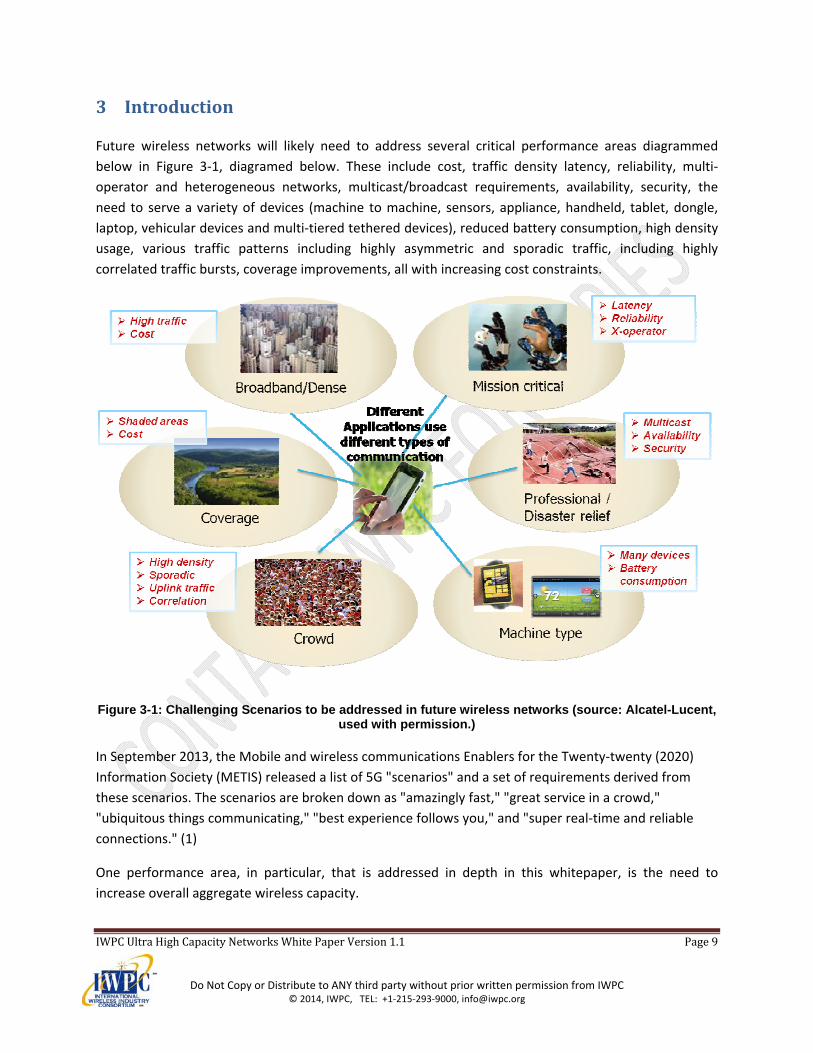
Figure 3‐1. Challenging Scenarios to be addressed in future wireless networks (source: Alcatel‐Lucent, used with
permission.) ............................................................................................................................................... 9
Figure 3‐2. Illustrating 3 components to achieve 5000 x capacity relative to a LTE release 8 .............................. 10
Figure 4‐1. Forecasted wireless traffic from Ericsson .......................................................................................... 12
Figure 4‐2. Wireless Traffic data and forecasts all normalized to 2011 for ease of comparison. ........................... 13
Figure 6‐1: ITU mm‐wave mobile frequency allocations. .................................................................................... 26
Figure 6‐2: Direct comparison of LOS and NLOS propagation as a function of frequency. .................................... 26
Figure 6‐3. Attenuation due to rain in the mm‐wave spectrum. ......................................................................... 27
Figure 6‐4. Atmospheric attenuation in the mm‐wave spectrum. ....................................................................... 28
Figure 7‐1. Block diagram of a 72 GHz E‐Band Channel Sounder used to collect Power Delay Profile
measurements (52). .................................................................................................................................. 34
Figure 7‐2. Photograph of the 72 GHz channel sounder receiver ........................................................................ 35
Figure 7‐3. Photograph of the 72 GHz channel sounder transmitter ................................................................... 35
Figure 7‐4. Small scale fading in the 28 GHz mm‐wave channel is quite small, only on the order of 4 dB as the
receiver is moved across a very small track (51) (23) .................................................................................. 37
Figure 7‐5. Power Delay Profile measured in New York City at 28 GHz in a LOS environment. ............................. 37
Figure 7‐6. Scatter plot of 28 GHz path loss at many different NLOS and LOS locations in New York City............. 38
Figure 8.1. LTE system architecture. .................................................................................................................. 43
Figure 8‐2. Taxonomy of Backhaul Solutions ...................................................................................................... 46
Figure 9‐1. mm‐Wave Hot Spot Tiered Architecture (Source Interdigital, used with permission.) ........................ 47
Figure 9‐2. PTP, PMP and Mesh topologies (73) ................................................................................................. 55
Figure 9‐3. Industry Coverage of Small Cell Backhaul Solutions .......................................................................... 56
Figure 10‐1. Notional design of 10x10 element 2D planar phased array. ............................................................ 58
Figure 10‐2. Number of antenna elements per row for frequencies of interest – 12” column width. ................... 60
Figure 10‐3. Number of antenna elements per row for frequencies of interest – 18” column width. ................... 60
Figure 10‐4. Simplified block diagram of components supporting each antenna element. .................................. 62
Figure 10‐5. Simplified block diagram of mm‐wave transmitter and receiver. .................................................... 63
Figure 10‐6. Tx RF Beam former with two RF chains ........................................................................................... 64
Figure 10‐7. Rx RF Beam former with two RF chains. ......................................................................................... 64
Figure 11‐1: Scenarios for Mobility Management in a Neighborhood Small Cell Network .................................. 71
Figure 11‐2. Case of PCI Confusion. Small Cell 1 cannot uniquely identify Small Cell 2 and Small Cell 3 from their
PCI ............................................................................................................................................................ 73
Figure 11‐3: Scenarios of frequent handovers in neighborhood small cell deployment ...................................... 74
Figure 11‐4. Pilot pollution regions: shows pilot pollution without power calibration ....................................... 76
Figure 11‐5. Pilot pollution regions: shows pilot pollution with power calibration ............................................ 76
Figure 11‐6. Small cell coverage footprints: shows coverage footprints without power calibration ................... 77
Figure 11‐7. cell coverage footprints: shows coverage footprints with power calibration .................................. 77
IWPCUltraHighCapacityNetworksWhitePaperVersion1.1 Page6
Do Not Copy or Distribute to ANY third party without prior written permission from IWPC © 2014, IWPC, TEL: +1‐215‐293‐9000, [email protected]
1 WhitepaperObjectives
This whitepaper is aimed at the technical and contributing members of 5G development organizations
including:
Radio Access Network (RAN) Executives from Operators
Wireless standards representatives and delegates
OEMs, device manufacturers and ecosystem planners
Spectrum Regulators
ITU and WRC Delegates
Researchers contributing to the Beyond 2020 and 5G fora.
The aim of this whitepaper is to advance certain understandings and concepts for adoption in wireless
systems to be deployed beyond the year 2020, referred to here as “5G.” It is understood that the
nomenclature “5G” will be fluid and used by various organizations and that the generational numbering
scheme is not formally defined1. Mindful of this ambiguity, the term “5G” is used here to advocate for
specific technologies, architectures, and spectrum that will require changes to the wireless networks
which will not be backward compatible with existing wireless systems, hence the increment to the “G”
number.
Several organizations of standing are working to define “5G.” The European Commission has co‐funded
the Mobile and wireless communications Enablers for the Twenty‐twenty Information Society (METIS
2020 Project) under the Seventh Framework Program for R&D (FP7) with the objective of laying the
technical foundation of “5G.” 5GNow and 5GrEEn are also supported by the European Commission
under FP7 but with a focus on making a more energy efficient wireless network. China’s Ministry of
Industry and Information Technology has established the IMT‐2020 (5G) Promotion working Group.
The International Telecommunications Union Radiocommunication Sector (ITU‐R) study group 5 has
approved work items to estimate the amount of spectrum required beyond 2020 in ITU‐R M.
[IMT.2020.ESTIMATE] and [IMT.2020.INPUT], the consideration of appropriate technologies to support
these trends in ITU‐R M. [IMT.FUTURE TECHNOLOGY TRENDS], a study of global market and technology
trends in ITU‐R M. [IMT.VISION], and a new report on potential IMT at higher frequencies by ITU‐R M.
[IMT.ABOVE 6 GHz].
1 The International Telecommunications Union (ITU) specified requirements for IMT‐2000. This six Radio Access Technologies (RATs) meeting IMT‐2000 requirements were collectively referred to by the industry as 3G systems. Subsequent evolution of these “3G” technologies were informally referred to as 3.5G, 3.75G and 3.9G in anticipation of the ITU requirements for IMT‐Advanced which were informally referred to as 4G. However, the use of the term 4G by the industry to refer to technologies pre‐dating IMT‐Advanced has diluted the meaning of the term 4G. In this context, and prior to any direction from the ITU, it is anticipated the industry use of the term 5G may be even more varied than it was for 4G.
IWPCUltraHighCapacityNetworksWhitePaperVersion1.1 Page7
Do Not Copy or Distribute to ANY third party without prior written permission from IWPC © 2014, IWPC, TEL: +1‐215‐293‐9000, [email protected]
While this whitepaper does not authoritatively prescribe what “5G” standards are or of what they will
consist, the paper presents technical details and tradeoffs that should be considered in defining “5G.” It
is expected these contributions will empower the networks beyond 2020 with critically needed
spectrum, air interface advances, and architectural structure to address the rapidly developing demands
and imaginative new applications envisioned for this next decade.
2 ExecutiveSummary
a. This paper provides a summary of factors that will influence the next generation of cellular systems which can also be termed as 5G systems. Specifically, the following conclusions are drawn. Future wireless networks will likely need to address several critical performance areas which include:
1. Cost
2. Traffic density
3. Latency
4. Reliability including availability, connection retention, and redundancy of network elements
5. Multi‐operator and heterogeneous networks
6. Multicast/broadcast requirements
7. Security
8. The need to serve a variety of devices
9. Reduced battery consumption
10. High density usage
11. Various traffic patterns
12. Coverage improvements
b. The three elements required to achieve the projected capacity demand beyond 2020 are increased spectral efficiency, opportunity to use new spectrum bands including those above 6 GHz and increase in spectral reuse through deploying a much increased number of smaller base stations.
c. The main requirements for future access technologies are driven by people and machines having gigabit experience with ultra‐low latency. To meet these requirements ultra‐densification of networks is required. Additional 5G requirements are driven by the contrasting need for low
IWPCUltraHighCapacityNetworksWhitePaperVersion1.1 Page8
Do Not Copy or Distribute to ANY third party without prior written permission from IWPC © 2014, IWPC, TEL: +1‐215‐293‐9000, [email protected]
power wide area (LPWA) technology for low cost and low date rate machine‐to‐machine applications like cheap sensors and gas, electricity and water meters.
d. Availability of spectrum > 6GHz is one of the key requirements for meeting the goals of 5G. This paper discusses in detail the spectrum and propagation characteristics with new measurements at bands > 28 GHz. These new measurements suggest that access technologies with inter‐site distance (ISD) of 100 to 200 meters can be deployed in 28‐100 GHz bands to meet the requirements for next generation wireless technologies.
e. In general, mm‐wave communication links often require solutions that provide methods to mitigate Line of Sight (LOS) blockage. One means to achieve this is to utilize steerable, directional antenna arrays. These arrays steer the beam in a direction that achieves a link by i) access to an alternate base station node that is LOS or ii) access to the main, or alternate, base stations with a suitable low loss reflection.
f. In this paper, multiple access schemes of next generation wireless access and backhaul technologies are discussed along with various beamforming solutions like baseband, RF and hybrid schemes. It is shown that massive antenna arrays need to be supported to close the link budget at mm‐wave bands. However, for baseband beamforming one transceiver behind every antenna element needs to be used which will consume large amounts of power and be cost prohibitive. As such, RF or hybrid beamforming approaches are more attractive in these bands.
g. The network features for future cellular systems with focus on Self Organizing Network (SON), cell identity management, load balancing, mobility robustness and power saving features are also discussed.
h. Future 5G networks are expected to be complimentary to and integrated with existing cellular and Wi‐Fi networks below 6 GHz, and will not replace them in the foreseeable future.
IWPCUltraHighCapacityNetworksWhitePaperVersion1.1 Page9
Do Not Copy or Distribute to ANY third party without prior written permission from IWPC © 2014, IWPC, TEL: +1‐215‐293‐9000, [email protected]
3 Introduction
Future wireless networks will likely need to address several critical performance areas diagrammed
below in Figure 3‐1, diagramed below. These include cost, traffic density latency, reliability, multi‐
operator and heterogeneous networks, multicast/broadcast requirements, availability, security, the
need to serve a variety of devices (machine to machine, sensors, appliance, handheld, tablet, dongle,
laptop, vehicular devices and multi‐tiered tethered devices), reduced battery consumption, high density
usage, various traffic patterns including highly asymmetric and sporadic traffic, including highly
correlated traffic bursts, coverage improvements, all with increasing cost constraints.
Figure 3-1: Challenging Scenarios to be addressed in future wireless networks (source: Alcatel-Lucent, used with permission.)
In September 2013, the Mobile and wireless communications Enablers for the Twenty‐twenty (2020)
Information Society (METIS) released a list of 5G "scenarios" and a set of requirements derived from
these scenarios. The scenarios are broken down as "amazingly fast," "great service in a crowd,"
"ubiquitous things communicating," "best experience follows you," and "super real‐time and reliable
connections." (1)
One performance area, in particular, that is addressed in depth in this whitepaper, is the need to
increase overall aggregate wireless capacity.
IWPCUltraHighCapacityNetworksWhitePaperVersion1.1 Page10
Do Not Copy or Distribute to ANY third party without prior written permission from IWPC © 2014, IWPC, TEL: +1‐215‐293‐9000, [email protected]
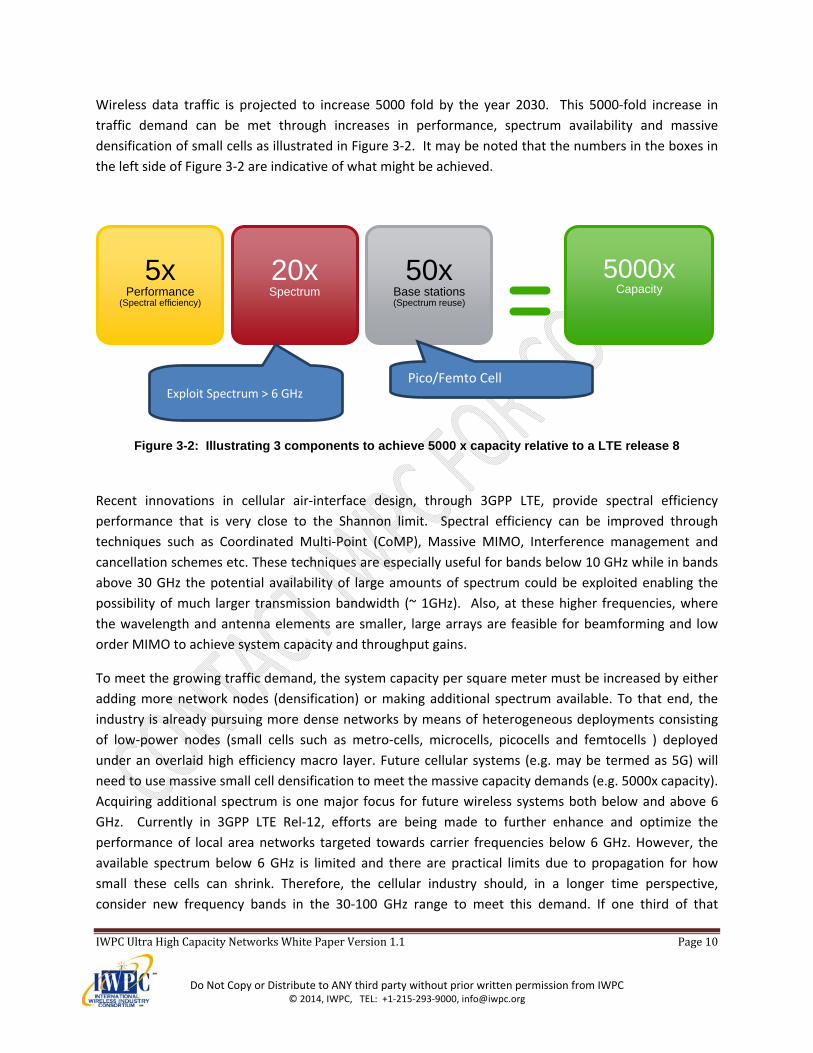
Wireless data traffic is projected to increase 5000 fold by the year 2030. This 5000‐fold increase in
traffic demand can be met through increases in performance, spectrum availability and massive
densification of small cells as illustrated in Figure 3‐2. It may be noted that the numbers in the boxes in
the left side of Figure 3‐2 are indicative of what might be achieved.
Figure 3-2: Illustrating 3 components to achieve 5000 x capacity relative to a LTE release 8
Recent innovations in cellular air‐interface design, through 3GPP LTE, provide spectral efficiency
performance that is very close to the Shannon limit. Spectral efficiency can be improved through
techniques such as Coordinated Multi‐Point (CoMP), Massive MIMO, Interference management and
cancellation schemes etc. These techniques are especially useful for bands below 10 GHz while in bands
above 30 GHz the potential availability of large amounts of spectrum could be exploited enabling the
possibility of much larger transmission bandwidth (~ 1GHz). Also, at these higher frequencies, where
the wavelength and antenna elements are smaller, large arrays are feasible for beamforming and low
order MIMO to achieve system capacity and throughput gains.
To meet the growing traffic demand, the system capacity per square meter must be increased by either
adding more network nodes (densification) or making additional spectrum available. To that end, the
industry is already pursuing more dense networks by means of heterogeneous deployments consisting
of low‐power nodes (small cells such as metro‐cells, microcells, picocells and femtocells ) deployed
under an overlaid high efficiency macro layer. Future cellular systems (e.g. may be termed as 5G) will
need to use massive small cell densification to meet the massive capacity demands (e.g. 5000x capacity).
Acquiring additional spectrum is one major focus for future wireless systems both below and above 6
GHz. Currently in 3GPP LTE Rel‐12, efforts are being made to further enhance and optimize the
performance of local area networks targeted towards carrier frequencies below 6 GHz. However, the
available spectrum below 6 GHz is limited and there are practical limits due to propagation for how
small these cells can shrink. Therefore, the cellular industry should, in a longer time perspective,
consider new frequency bands in the 30‐100 GHz range to meet this demand. If one third of that
5000xCapacity
5x Performance
(Spectral efficiency)
20x Spectrum
50x Base stations (Spectrum reuse)
Pico/Femto Cell Exploit Spectrum > 6 GHz
IWPCUltraHighCapacityNetworksWhitePaperVersion1.1 Page11
Do Not Copy or Distribute to ANY third party without prior written permission from IWPC © 2014, IWPC, TEL: +1‐215‐293‐9000, [email protected]
spectrum could be made available longer term for mobile broadband that would mount to 23 GHz
around 50 times the typical deployed cellular spectrum in most regions today below 6 GHz.
Like 4G systems, future wireless systems will evolve both in the licensed (e.g. 3GPP) and unlicensed
bands (e.g. 802.11‐ad). In other words, technologies developed in both licensed and unlicensed bands
will continue to contribute to wireless usage, both as complementary air interfaces and in sharing
spectrum with each other and with other wireless systems including RADAR and broadcast services
among others. Finally, it needs to be emphasized that 5G will not replace 4G but will complement 4G
LTE systems ‐ for example in local area scenarios.
4 KeyIncentivesfor5G
4.1 Massivegrowthintraffic
Wireless data traffic has grown at an astonishing rate. AT&T, for example, reports 30,000% growth from
2007 through 2012. (2) This corresponds to a compound annual growth rate (CAGR) of √301 ‐1 = 2.59‐1 or 159%, which averages more than doubling per year over more than 6 years. However, this is down
slightly from the tripling per year seen in the years immediately following the introduction of the iPhone
in 2007. (3)
CISCO’s VNI statistics show that the total wireless data traffic in TB/month nearly doubled for both
North American and global wireless traffic growth with an average CAGR of 77% forecasted from 2012
through 2017 globally and 56% for North America (which had a larger base of traffic in 2012). (4) This
explains CISCO’s forecast, “Global mobile data traffic will increase 13‐fold between 2012 and 2017.”
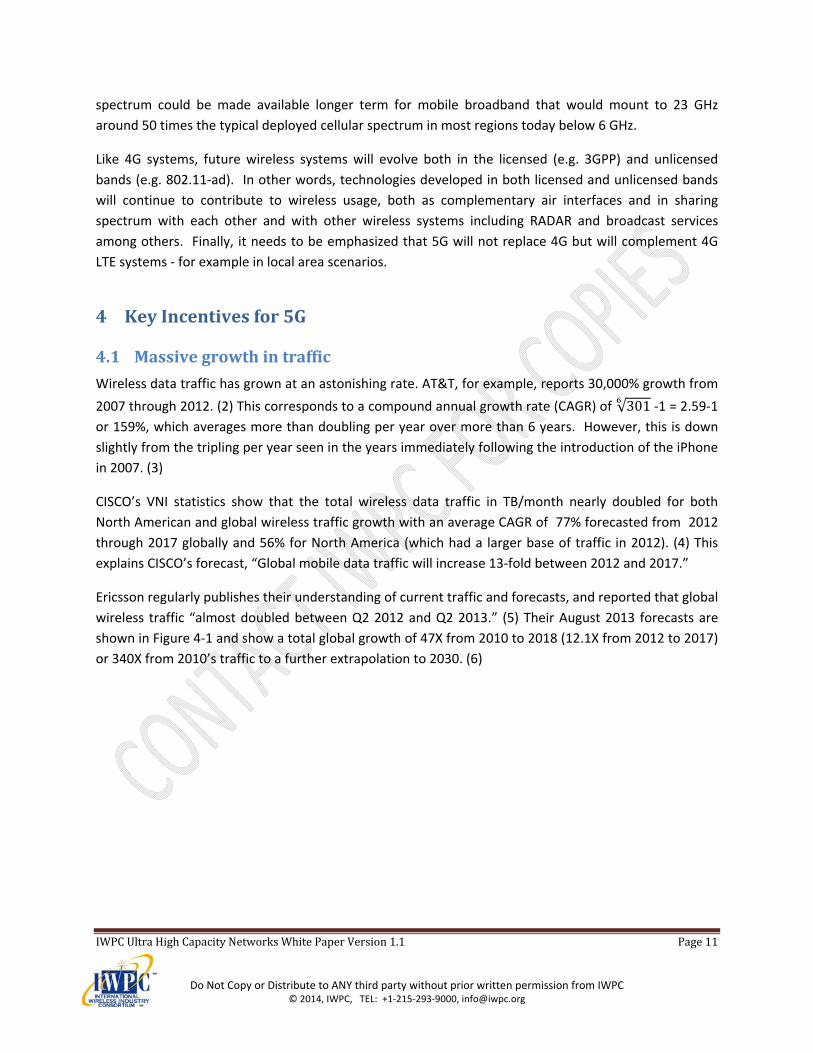
Ericsson regularly publishes their understanding of current traffic and forecasts, and reported that global
wireless traffic “almost doubled between Q2 2012 and Q2 2013.” (5) Their August 2013 forecasts are
shown in Figure 4‐1 and show a total global growth of 47X from 2010 to 2018 (12.1X from 2012 to 2017)
or 340X from 2010’s traffic to a further extrapolation to 2030. (6)
IWPCUltraHighCapacityNetworksWhitePaperVersion1.1 Page12
Do Not Copy or Distribute to ANY third party without prior written permission from IWPC © 2014, IWPC, TEL: +1‐215‐293‐9000, [email protected]
Figure 4-1 : Forecasted wireless traffic from Ericsson
Notably, even as the percentage growth has fallen below 100% recently, this decline is due to the large
cumulative base in the denominator; the absolute increase in traffic is seen to continue to climb to
record breaking levels year after year. That is to say, the growth while substantial is not exponential.
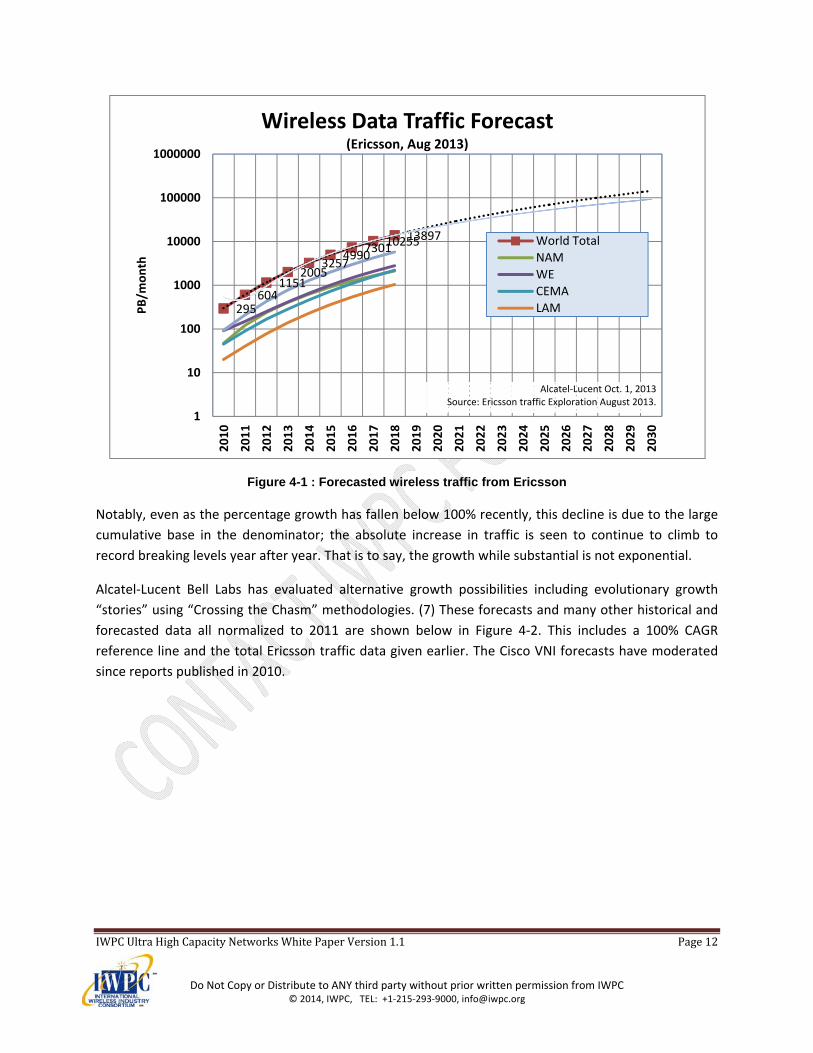
Alcatel‐Lucent Bell Labs has evaluated alternative growth possibilities including evolutionary growth
“stories” using “Crossing the Chasm” methodologies. (7) These forecasts and many other historical and
forecasted data all normalized to 2011 are shown below in Figure 4‐2. This includes a 100% CAGR
reference line and the total Ericsson traffic data given earlier. The Cisco VNI forecasts have moderated
since reports published in 2010.
295604
11512005
32574990
73011025513897
1
10
100
1000
10000
100000
1000000
2010
2011
2012
2013
2014
2015
2016
2017
2018
2019
2020
2021
2022
2023
2024
2025
2026
2027
2028
2029
2030
PB/m
onth
Wireless Data Traffic Forecast (Ericsson, Aug 2013)
World Total
NAM
WE
CEMA
LAM
Alcatel‐Lucent Oct. 1, 2013Source: Ericsson traffic Exploration August 2013.
IWPCUltraHighCapacityNetworksWhitePaperVersion1.1 Page13
Do Not Copy or Distribute to ANY third party without prior written permission from IWPC © 2014, IWPC, TEL: +1‐215‐293‐9000, [email protected]
Figure 4-2 : Wireless Traffic data and forecasts all normalized to 2011 for ease of comparison.
For many years, forecasts of wireless subscriber penetration, subscriber data usage and Minutes of Use
(MOU) notoriously underestimated the actual demands placed upon earlier wireless systems, and the
same was true for the first decade of this century concerning mobile broadband traffic. And while
forecasts have been moderating lately, forecasts are, as the expression goes, “extremely difficult,
particularly about the future.” As new applications and use cases arise, the historical trends may, yet
again, not hold true for the future and traffic may surge with the next generation and demand 100 or
perhaps 1000 times more traffic. Traffic growth may also be fueled by emerging applications and new
use cases associated with “communicating machines” as elaborated below. In all these cases however,
traffic consumption will ultimately be moderated by the achievable cost of delivery.
4.1.1 Usecasesthatdrivefuturetrafficgrowth
0.0
0.1
1.0
10.0
100.0
2006 2008 2010 2012 2014 2016 2018 2020
Traffic Norm
alized to 2011
Historical and Trends of Wireless Traffic
T1 Operator A FCC Fcst
T1 Operator B FCC Filing
Cisco VNI 2/2012
CTIA Snapshots
ALU Revolutionary
ALU Evolutionary
European Operator
Yankee 6/2009
Doubling YoY (100% CAGR)
Ericsson's Aug 2013 Forecast
Cisco VNI 2/2013 Global
Alcatel-Lucent, March 2012
1/30
100% CAGR
23X
IWPCUltraHighCapacityNetworksWhitePaperVersion1.1 Page14
Do Not Copy or Distribute to ANY third party without prior written permission from IWPC © 2014, IWPC, TEL: +1‐215‐293‐9000, [email protected]
Video is the KEY driving force
From a consumer devices point of view, application usage and over the top (OTT) services have
drastically changed the experience, habits and thereby the consumption of viewing. The mobility aspect
and the freedom given to control one´s viewing experience have pushed for a distinctive increase of
video consumption over the last years. It is expected by 2017 that more than 50% of the mobile cloud
traffic is expected to be video traffic. The evolution of improved video quality and on‐demand, seamless
video streaming and sharing will set even higher requirements on future connectivity and system
capacity.
Cloud intelligence and big data analytics
The role of devices in future systems could be seen from the perspective on where the intelligence and
processing capabilities lie. The devices in a 5G scenario could, as one extreme, act as pure windows to
the cloud with basic connectivity functions, while all the intelligence processing is in the cloud. The other
extreme is devices that are powerful and intelligent and uses the classic cloud only as a complement.
Combining the intelligence, computation capacities and storage with the avalanche of all devices on the
market, new distributed cloud can be created and utilized.
Consumer devices are the key for big data analytics since they can collect and/or enable the collection of
user data (especially behavioral). The user may not see a direct benefit of the data collected however
this data is vital for the businesses that will rely on big data for their services.
Seamless mobility
From the consumer device point of view, the full access to use cases anywhere and anytime will put
further requirements on wireless link reliability and availability. The user wants the optimal experience
of seamlessness, without the knowledge upon which RAT the connectivity is established, as far as the
pricing is acceptable for the service that is utilized.
4.2 Massivegrowthinthenumberofconnecteddevices
There are currently on the order of 7 billion connected devices worldwide, most of which are mobile
phones, smart phones, tablets, and laptops with wireless connectivity. In the future, these currently
dominating human‐centric devices are expected to be surpassed tenfold and more by new machine
types of devices such as surveillance cameras, smart‐home/grid devices, connected sensors etc. Just as
the many tens of billions of microprocessors embedded in the world’s infrastructure have become
nearly uncountable, a future with several 100 billion connected devices may be expected. To handle
such an enormous number of devices will, in itself, be a formidable challenge for future wireless access
networks.
IWPCUltraHighCapacityNetworksWhitePaperVersion1.1 Page15
Do Not Copy or Distribute to ANY third party without prior written permission from IWPC © 2014, IWPC, TEL: +1‐215‐293‐9000, [email protected]
4.3 Widerangeofrequirementsandcharacteristics
Future mobile‐communication systems will also have to cope with a much wider range of applications
and use cases, with a correspondingly much wider range of requirements and characteristics, compared
to today. Mobile broadband services, including web browsing, video streaming and different forms of
data sharing (e.g.: your hard disk in the cloud, real time backup services, etc.), will remain key
applications and will continue to drive demand for higher data rates. Future demands for data rates
exceeding peak rates of 10 Gbit/s in specific scenarios and general availability of data rates at least in
the order of 100 Mbit/s can be anticipated.
In addition, the large‐scale introduction of communicating machines will go hand in hand with the
emergence of many new applications and use cases with characteristics and requirements that will not
only differ significantly from the currently dominating mobile‐broadband applications, but which will
also vary significantly between applications.
Some applications, such as augmented reality, may require data plane latency in the order of 1 ms or less, while, for other application the latency requirements may be very relaxed
Applications related to the control of critical infrastructure, (e.g. the electrical grid or industrial control) may require extremely high reliability in terms of availability or some “guaranteed” maximum latency. In other cases (E.g. certain types of sensors such as temperature or moisture sensors in the home) the reliability and latency requirements may be much less critical.
Some applications may be associated with major volumes of information to be conveyed while other applications, such as cargo tracking in the shipping industry, may be associated with very small data payloads.
In some cases (e.g. battery‐powered sensor networks) low device cost and/or energy consumption is extremely important while for other applications, this may be less of an issue.
To summarize, future wireless networks should be able to:
Handle hugely more aggregate traffic than 2013’s networks (e.g. 5000x)
Handle 100+ billion devices
Provide end‐user‐experienced data rates of at least 10 Gbps in specific scenarios
Provide generally available end‐user‐experienced data rates of at least 100 Mbps
Provide the possibility for latency of 1 ms or less for some scenarios
Provide the possibility for extreme reliability/availability for specific services and applications
Provide the possibility for very low device cost and power consumption for specific applications
IWPCUltraHighCapacityNetworksWhitePaperVersion1.1 Page16
Do Not Copy or Distribute to ANY third party without prior written permission from IWPC © 2014, IWPC, TEL: +1‐215‐293‐9000, [email protected]
Enable new business models
Wireless backhaul should be included as an integrated part of future wireless‐access technologies to handle situations where wired (fiber) backhaul is not suitable.
Different means for self‐organization, self‐configuration, etc. should be an integral part of future wireless technologies.
It is desirable that the overall network energy consumption should be minimized compared to the wireless access networks of today: 5000x capacity cannot mean 5000x energy consumption.
Must be able to support very long life sensors or M2M nodes with battery lifetimes of at least 10 years.
An increasingly diverse set of networks operating with different air interface generations, in licensed and unlicensed bands, and possibly sharing spectrum with other radio systems may be required.
It is desirable that these requirements should be fulfilled in an affordable and sustainable way. Thus,
future wireless‐access networks should allow for low CapEx and OpEx.
5 RequirementsandChallengesforfuturewirelesssystems(maybetermedas5G)
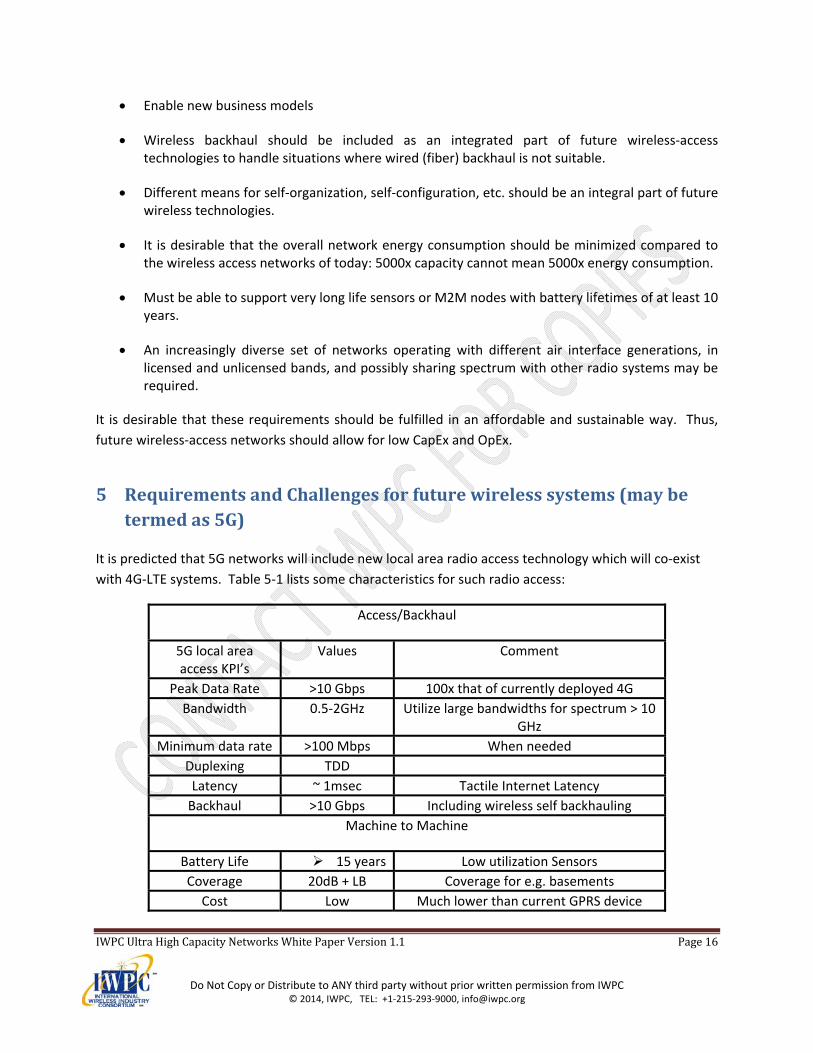
It is predicted that 5G networks will include new local area radio access technology which will co‐exist
with 4G‐LTE systems. Table 5‐1 lists some characteristics for such radio access:
Access/Backhaul
5G local area access KPI’s
Values Comment
Peak Data Rate >10 Gbps 100x that of currently deployed 4G
Bandwidth 0.5‐2GHz Utilize large bandwidths for spectrum > 10 GHz
Minimum data rate >100 Mbps When needed
Duplexing TDD
Latency ~ 1msec Tactile Internet Latency
Backhaul >10 Gbps Including wireless self backhauling
Machine to Machine
Battery Life 15 years Low utilization Sensors
Coverage 20dB + LB Coverage for e.g. basements
Cost Low Much lower than current GPRS device
IWPCUltraHighCapacityNetworksWhitePaperVersion1.1 Page17
Do Not Copy or Distribute to ANY third party without prior written permission from IWPC © 2014, IWPC, TEL: +1‐215‐293‐9000, [email protected]
Table 5-1: Radio Requirements for 5G Local Area Technology
5.1 Architecturetrendsin3Gand4G
In order to meet the traffic volume and latency requirements for projected mobile data traffic, several
broad trends have been emerging in both 3G and 4G networks.
1st Trend: A flattening of the network to reduce the number of operator nodes the traffic must traverse before reaching its destination in order to minimize latency. Since each node that the traffic passes through incurs a processing cost and management cost, reducing the number of nodes is a clear direction to prepare networks for large traffic volumes. Direct Tunneling in UMTS and the flat RAN architecture in LTE are manifestations of this trend.
2nd Trend: A related trend is to allow traffic to “break out” to the internet as soon as possible. This also reduces the number of nodes traffic traverses before reaching its destination, and contributes to latency reduction. Breakout of traffic in the Visited Operator network is one of the first examples of break‐out related enhancements, and provides significant latency and transport cost reductions in cases of roaming. More recently, Local IP Access (LIPA) and Selective IP Traffic Offload (SIPTO) were introduced in 3GPP to move the break‐out function closer to the radio nodes. In fact, with LIPA, the traffic traverses exactly one operator node, which is the cell itself.
3rd Trend: The rapid improvement in Content Delivery Networks. These improvements serve both wireless and wire‐line traffic, and focus on bringing the content closer to the end user in a transparent manner. Bringing the content closer reduces the latency and also reduces the transport cost of moving content across the internet.
4th Trend: The adoption of architectural solutions that allow closer interworking of different radio technologies, in particular licensed band technologies and unlicensed or shared spectrum technologies. Given that the challenge of traffic increase is foreseen to be met by an appropriate combination of several technologies, providing a seamless user experience across technologies is becoming increasingly important. Work in this area has been occurring in both 3GPP and the Wi‐Fi Alliance. Although improved interworking does not by itself directly reduce latency (as the first three trends do) improved interworking contributes to improved load balancing across technologies which indirectly reduces latency by balancing the queue sizes across technologies.
5.2 ArchitectureRequirementsandSolutionsforfutureWirelessSystems
Architecture solutions as listed in Table 5‐2 for 5G are expected to continue the trends from 3G and 4G.
Flat RAN has already been successfully deployed in LTE and should be considered a requirement for
future wireless systems (e.g. 5G) in order to maintain latency and scalability advantages. Solutions that
make the network more flat should be considered, e.g. moving some of the Mobility Management Entity
(MME) functions to the periphery of the RAN architecture. This may mean, as well, the movement of
node B functions closer to the physical core network (fronthauling or cloud RAN) to take advantage of
pooling and virtualization opportunities.
IWPCUltraHighCapacityNetworksWhitePaperVersion1.1 Page18
Do Not Copy or Distribute to ANY third party without prior written permission from IWPC © 2014, IWPC, TEL: +1‐215‐293‐9000, [email protected]
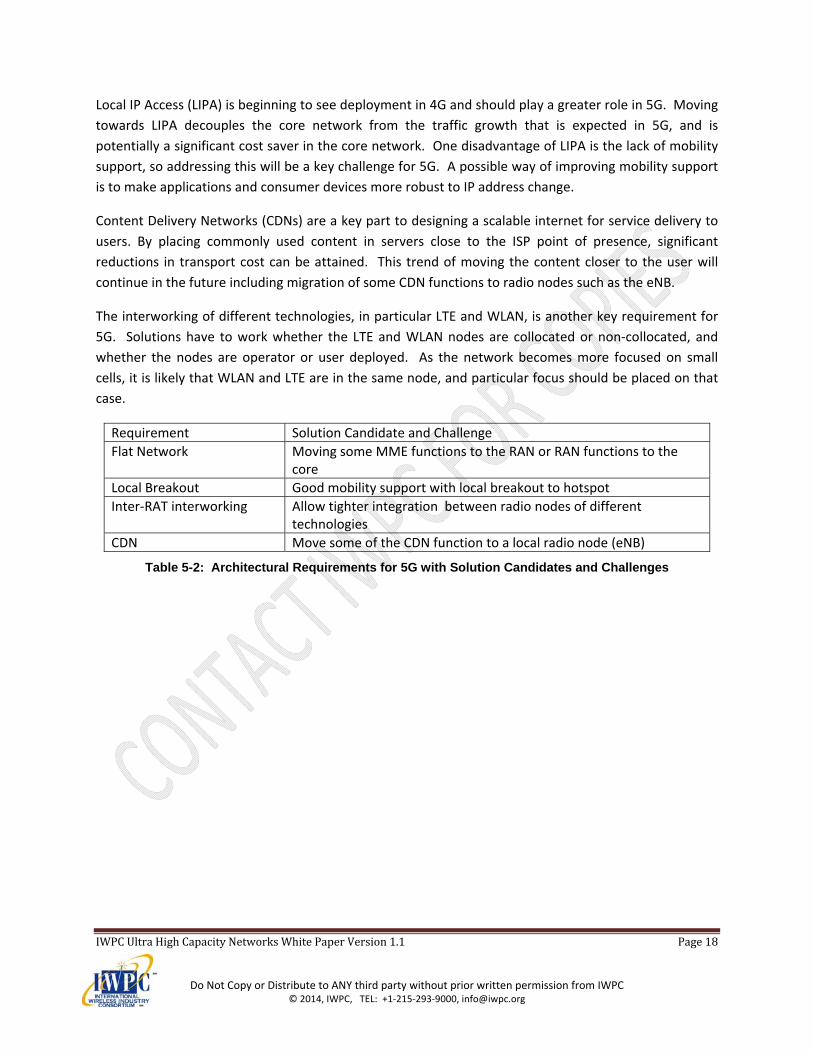
Local IP Access (LIPA) is beginning to see deployment in 4G and should play a greater role in 5G. Moving
towards LIPA decouples the core network from the traffic growth that is expected in 5G, and is
potentially a significant cost saver in the core network. One disadvantage of LIPA is the lack of mobility
support, so addressing this will be a key challenge for 5G. A possible way of improving mobility support
is to make applications and consumer devices more robust to IP address change.
Content Delivery Networks (CDNs) are a key part to designing a scalable internet for service delivery to
users. By placing commonly used content in servers close to the ISP point of presence, significant
reductions in transport cost can be attained. This trend of moving the content closer to the user will
continue in the future including migration of some CDN functions to radio nodes such as the eNB.
The interworking of different technologies, in particular LTE and WLAN, is another key requirement for
5G. Solutions have to work whether the LTE and WLAN nodes are collocated or non‐collocated, and
whether the nodes are operator or user deployed. As the network becomes more focused on small
cells, it is likely that WLAN and LTE are in the same node, and particular focus should be placed on that
case.
Requirement Solution Candidate and Challenge
Flat Network Moving some MME functions to the RAN or RAN functions to the core
Local Breakout Good mobility support with local breakout to hotspot
Inter‐RAT interworking Allow tighter integration between radio nodes of different technologies
CDN Move some of the CDN function to a local radio node (eNB)
Table 5-2: Architectural Requirements for 5G with Solution Candidates and Challenges
IWPCUltraHighCapacityNetworksWhitePaperVersion1.1 Page19
Do Not Copy or Distribute to ANY third party without prior written permission from IWPC © 2014, IWPC, TEL: +1‐215‐293‐9000, [email protected]
5.3 DeploymentModelsinFutureWirelessSystems
5.3.1 PlannedSmallCellsDeployment
The advent of smart phones has served as a catalyst for the significant increase in mobile broadband
data traffic on cellular networks. The mobile data demand continues to grow prodigiously (70‐100%
annually) (8). In the not so distant future, there will be a need to support vastly more mobile data traffic
(e.g. 5000x) compared to traffic carried by today’s cellular networks due to increased smart phone and
tablet usage as well as an increase in data consumed per user. This data demand needs to be met at a
low cost to the operator as well as the end user to sustain and further fuel wireless data growth.
Addressing this massive data demand in a cost‐effective manner presents formidable technical
challenges and requires innovative solutions. Today’s cellular technology standards are already
designed to exploit very high radio link spectral efficiencies (e.g., LTE Rel. 10 has peak downlink spectral
efficiency of 30 bps/Hz), but operation at such efficiencies due to achievable SINR is impractical and so
radio link level enhancements at PHY/MAC layers alone will not solve the capacity problem. Several
alternative approaches are needed including:
Increased spectral reuse (~50x) through network densification, i.e., deploying more base
stations and repeaters/relays, each with a small coverage footprint, in geographical areas with high data demand,
Additional spectrum (~20x), and
Improvement in system efficiency (~5x) (e.g., more efficient use of existing spectrum, optimal use of multiple technologies concurrently).
This section focusses on network densification.
Network densification boosts system capacity through increased spectrum re‐use by cell‐splitting. In
addition, it brings base stations closer to users, thereby reducing path losses and serving fewer users per
base station which provides additional improvement in capacity as well as reduced battery
consumption. However, network densification by deploying more traditional macro‐base stations is
unviable due to difficulty in finding suitable installation sites as well as high costs of
installing/maintaining macro‐base stations. Rather, network densification (small cells) is achieved
through deploying base stations having a small form factor with increased flexibility for rapid
deployment, and low transmit power.
Offloading users from macro to small cells not only increases overall capacity but significantly enhances
experience of both macro and small cell users. Splitting traffic into macro cells and small cells increases
the share of available data pipes for all users and thus boosts users’ data rates. Further, technological

IWPCUltraHighCapacityNetworksWhitePaperVersion1.1 Page20
Do Not Copy or Distribute to ANY third party without prior written permission from IWPC © 2014, IWPC, TEL: +1‐215‐293‐9000, [email protected]
advances in the last several years have dramatically reduced the cost of small cells compared to
traditional macro cells.
Considering these benefits, 3GPP made small cells an integral part of LTE in Rel. 10 (LTE Advanced) by
developing the concept of HetNets, i.e., heterogeneous networks consisting of a mix of macro cells and
small cells (comprising picocells, femtocells, metrocells). LTE Rel. 12, studied small cells as one of the
key areas for LTE evolution (9), (10), (11).
Several major operators worldwide are either in the process of or planning to deploy HetNet to densify
their networks in the next few years. Such HetNet deployments consist of a few to tens of small cells
deployed by an operator to meet high data demand in specific areas (e.g., malls, downtown areas, event
venues). These traditional HetNet deployments can meet near‐term mobile data demand, but it is
questionable to whether the same deployment model can scale to meet the projected massive data
demand of the future (e.g. 5000x).
Even though the small cell equipment costs have been dramatically reduced, there are significant
hurdles for scalability of such an operator‐deployed network densification when deploying millions of
such cells. Traditionally, operators have had to perform RF planning to find the optimal locations to
place cell‐sites and then send technicians to install them. This situation is changing with the gradual
introduction of SON in 4G, and the adoption and further development of SON will need to be integral to
5G systems.
Also, a suitable grade of backhaul needs to be provisioned if it is not already available.
Not only do the above require a lot of effort from the operator but the site rent, utilities, and backhaul
are all recurring costs that contribute to high OpEx. The traditional deployment approach then incurs
high cost that is not scalable as the number of small cells increase into the millions.
5.3.2 UnplannedSmallCellsDeployment
One approach that can provide scalability is to move to more of an unplanned deployment where cells
can be installed with minimal supervision and/or RF provisioning (reducing installation costs) and utilize
commercially available backhauls (reducing cost of high QoS backhaul enjoyed in current macro/pico
deployment).
While solving scalability to a great extent, this approach, if not properly implemented, could have
serious impacts on users’ experiences and expected QoS that includes:
non provisioned backhaul may lead to poor performance compared to what the user can get on macro sites deeming the small cell not useful for a class of users
With high density, random selection of pilot signatures (PN in C2K, PSC in UMTS and PCI in LTE) can lead to ambiguity during mobility and consequently call drops
IWPCUltraHighCapacityNetworksWhitePaperVersion1.1 Page21
Do Not Copy or Distribute to ANY third party without prior written permission from IWPC © 2014, IWPC, TEL: +1‐215‐293‐9000, [email protected]
The unplanned nature of deployment can cause highly interference‐contaminated areas due to many
small cells within a close range to the user, i.e. areas with very limited link quality. Conversely, it may
cause areas of limited coverage.
However, if the carrier frequency is dramatically increased from today's 1‐2 GHz range, the wavelength
will proportionally decrease, thereby allowing physically small, high‐gain, adaptive antennas that
provide real‐time beam forming at both mobile devices and infrastructure equipment. When combined
with cooperation techniques across the array of infrastructure equipment in a particular coverage or
capacity zone, low cost base stations and relays with real‐time beam forming will be able to optimize
connectivity between UEs and the infrastructure, as well as backhaul connectivity between the
infrastructure equipment (12), (13).
6 Spectrum&PropagationAspects
6.1 Newspectrumfrom6GHzto100GHz
New techniques applied to existing cellular spectrum can and will provide needed capacity increases,
but these increases will not be enough to meet anticipated demand. CoMP techniques, which are not
trivial in complexity, are expected to provide up to ~2x improvements. Massive MIMO gains and its cost
and complexity are difficult to predict, but it should not be expected that massive MIMO will save us
from the bandwidth crunch either.
New spectrum, and a lot of it, will ultimately need to be part of the solution to meet anticipated data
capacity.
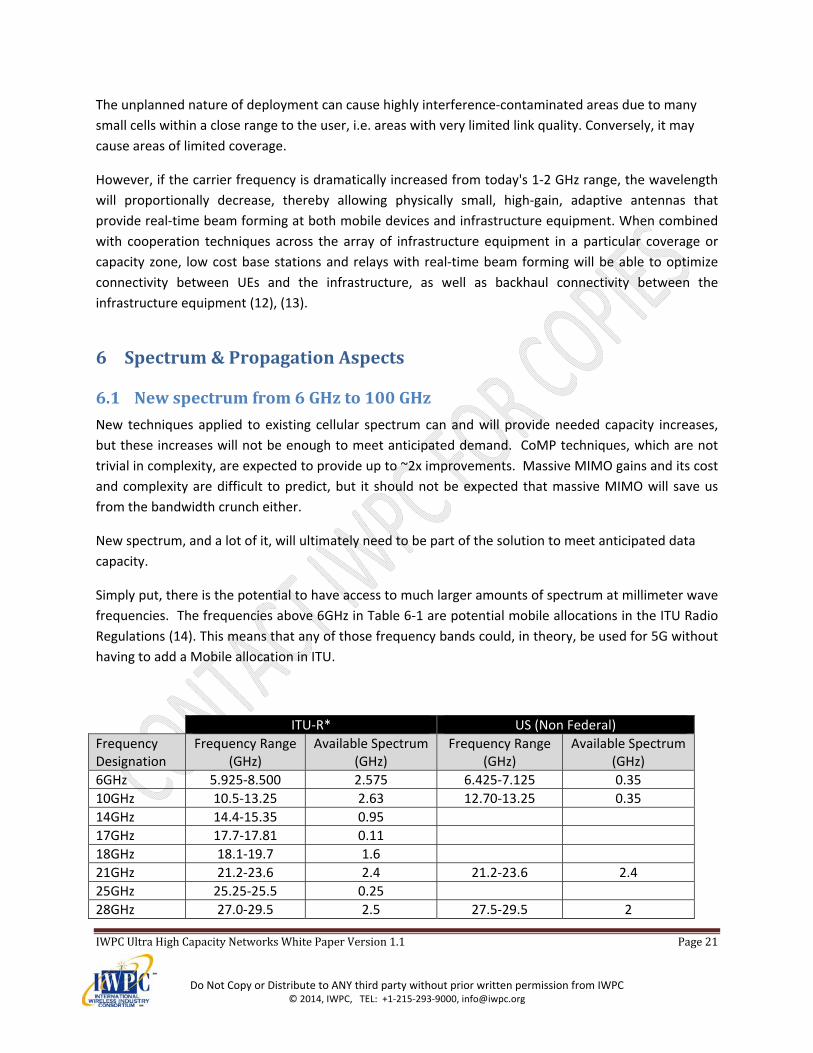
Simply put, there is the potential to have access to much larger amounts of spectrum at millimeter wave
frequencies. The frequencies above 6GHz in Table 6‐1 are potential mobile allocations in the ITU Radio
Regulations (14). This means that any of those frequency bands could, in theory, be used for 5G without
having to add a Mobile allocation in ITU.
ITU‐R* US (Non Federal)
Frequency Designation
Frequency Range (GHz)
Available Spectrum (GHz)
Frequency Range (GHz)
Available Spectrum (GHz)
6GHz 5.925‐8.500 2.575 6.425‐7.125 0.35
10GHz 10.5‐13.25 2.63 12.70‐13.25 0.35
14GHz 14.4‐15.35 0.95
17GHz 17.7‐17.81 0.11
18GHz 18.1‐19.7 1.6
21GHz 21.2‐23.6 2.4 21.2‐23.6 2.4
25GHz 25.25‐25.5 0.25
28GHz 27.0‐29.5 2.5 27.5‐29.5 2
IWPCUltraHighCapacityNetworksWhitePaperVersion1.1 Page22
Do Not Copy or Distribute to ANY third party without prior written permission from IWPC © 2014, IWPC, TEL: +1‐215‐293‐9000, [email protected]
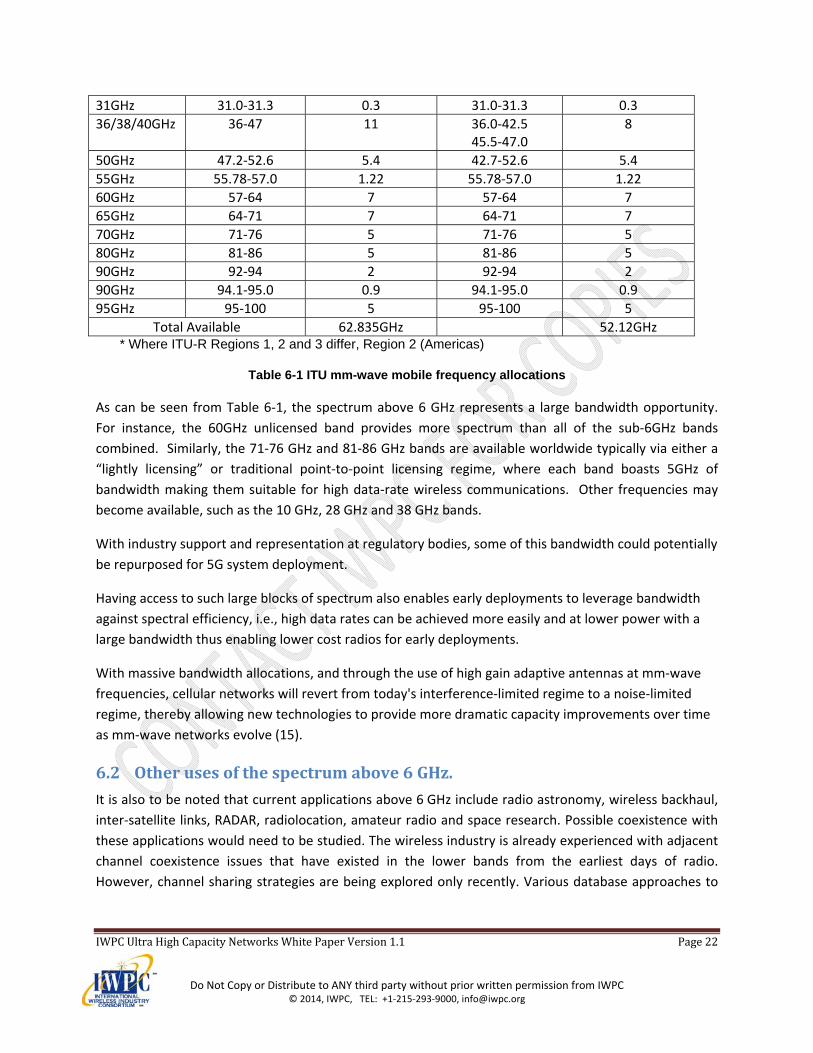
31GHz 31.0‐31.3 0.3 31.0‐31.3 0.3
36/38/40GHz 36‐47 11 36.0‐42.5 45.5‐47.0
8
50GHz 47.2‐52.6 5.4 42.7‐52.6 5.4
55GHz 55.78‐57.0 1.22 55.78‐57.0 1.22
60GHz 57‐64 7 57‐64 7
65GHz 64‐71 7 64‐71 7
70GHz 71‐76 5 71‐76 5
80GHz 81‐86 5 81‐86 5
90GHz 92‐94 2 92‐94 2
90GHz 94.1‐95.0 0.9 94.1‐95.0 0.9
95GHz 95‐100 5 95‐100 5
Total Available 62.835GHz 52.12GHz * Where ITU-R Regions 1, 2 and 3 differ, Region 2 (Americas)
Table 6-1 ITU mm-wave mobile frequency allocations
As can be seen from Table 6‐1, the spectrum above 6 GHz represents a large bandwidth opportunity.
For instance, the 60GHz unlicensed band provides more spectrum than all of the sub‐6GHz bands
combined. Similarly, the 71‐76 GHz and 81‐86 GHz bands are available worldwide typically via either a
“lightly licensing” or traditional point‐to‐point licensing regime, where each band boasts 5GHz of
bandwidth making them suitable for high data‐rate wireless communications. Other frequencies may
become available, such as the 10 GHz, 28 GHz and 38 GHz bands.
With industry support and representation at regulatory bodies, some of this bandwidth could potentially
be repurposed for 5G system deployment.
Having access to such large blocks of spectrum also enables early deployments to leverage bandwidth
against spectral efficiency, i.e., high data rates can be achieved more easily and at lower power with a
large bandwidth thus enabling lower cost radios for early deployments.
With massive bandwidth allocations, and through the use of high gain adaptive antennas at mm‐wave
frequencies, cellular networks will revert from today's interference‐limited regime to a noise‐limited
regime, thereby allowing new technologies to provide more dramatic capacity improvements over time
as mm‐wave networks evolve (15).
6.2 Otherusesofthespectrumabove6GHz.
It is also to be noted that current applications above 6 GHz include radio astronomy, wireless backhaul,
inter‐satellite links, RADAR, radiolocation, amateur radio and space research. Possible coexistence with
these applications would need to be studied. The wireless industry is already experienced with adjacent
channel coexistence issues that have existed in the lower bands from the earliest days of radio.
However, channel sharing strategies are being explored only recently. Various database approaches to
IWPCUltraHighCapacityNetworksWhitePaperVersion1.1 Page23
Do Not Copy or Distribute to ANY third party without prior written permission from IWPC © 2014, IWPC, TEL: +1‐215‐293‐9000, [email protected]
Spectrum Authorization Systems (SAS) and Licensed Shared Access (LSA) are emerging as important
ways for multiple services to share frequency bands based upon time and geography.
6.3 Propagationinmm‐wavebands
Propagation losses at millimeter wave frequencies have historically been thought to be too large for
practical communication in large networks that involve links of more than a few tens of meters. The
dependency of the free‐space path loss can be clearly seen in the well‐known Friis equation for free
space propagation loss (16).
Pr Pt
4r2
2
4
Pt
4r
2
Pr Pt
cf
4r
2
Pt
c
4rf
2
(1)
The first term in the top of Equation (1),
Pt
4r2
is the transmit power density on a sphere of radius r.
The second term is the “capture area” or aperture of the receive antenna for a half wave dipole of
dimension
2 , the factor of in the denominator is a correction for the dipole characteristic. This
states that the receive power is equal to the transmit power density at the receiver, times the effective
capture area of the receive antenna. This is also expressed in terms of frequency in the second line of
Equation (1). This shows that just by moving from a 2 GHz carrier to a 60 GHz carrier (an emerging
unlicensed millimeter wave band), the path loss PL= Pt/Pr (without considering atmospheric absorption)
increases by nearly 30 dB in free space, yet the wavelength , given by = c/f, shrinks from one sixth of
a meter at 2 GHz to a miniscule 5 millimeters at 60 GHz. The loss at 60 GHz is even greater than 30 dB in
practice, since oxygen absorption causes an additional 20 dB/km of loss on top of the theoretical free
space propagation loss (17). The 30 dB increase in free space loss sounds disastrous for millimeter
waves at first, but this is not the case, since propagation must also consider the impact of the transmit
and receive antennas used in a communications link.
Fortunately, the gain of a receiver antenna can completely mitigate the increase in path loss with
frequency given in Equation (1). For a given physical size or aperture, an antenna has greater gain as the
wavelength shrinks, such that path loss is not frequency dependent as long as receiver antennas with
the same physical size are used in comparing different frequencies. This is illustrated in Figure 6‐1 for
three cases of antenna combinations. On the left is the case representative of Equation (1) in which both
transmit and receive antennas are omnidirectional. The middle shows an omnidirectional antenna
paired with a horn antenna of fixed aperture (fixed in terms of square meters not square wavelengths).
IWPCUltraHighCapacityNetworksWhitePaperVersion1.1 Page24
Do Not Copy or Distribute to ANY third party without prior written permission from IWPC © 2014, IWPC, TEL: +1‐215‐293‐9000, [email protected]
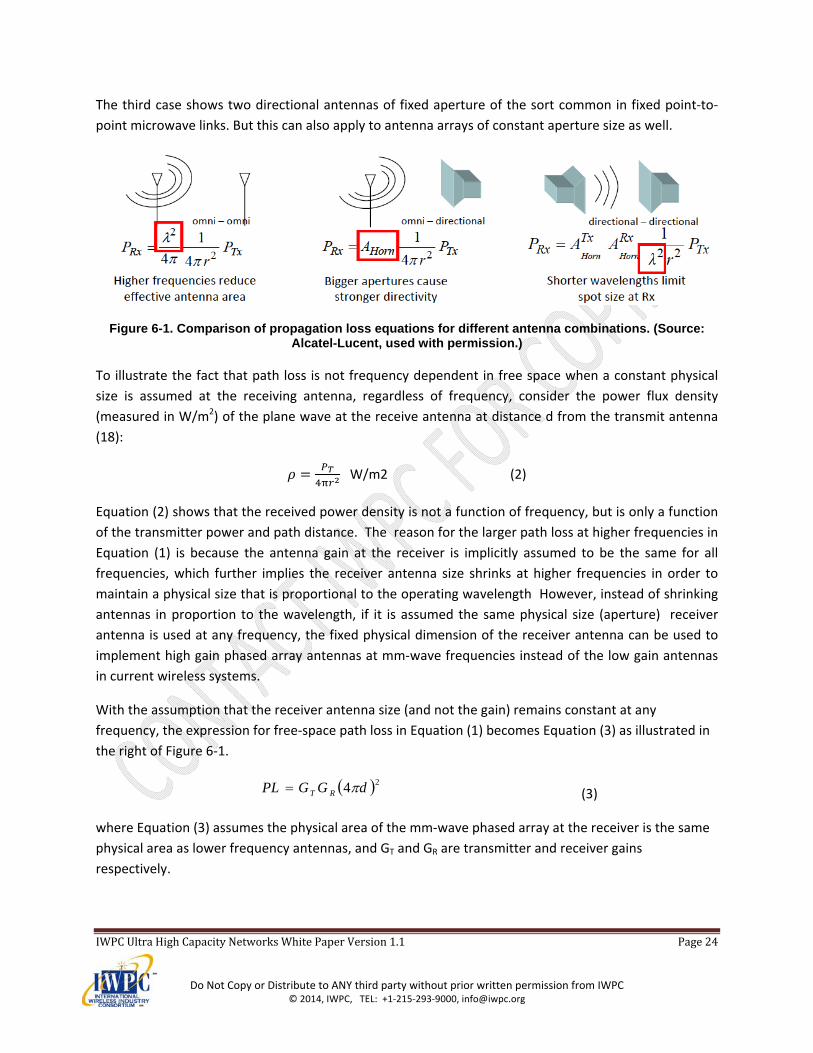
The third case shows two directional antennas of fixed aperture of the sort common in fixed point‐to‐
point microwave links. But this can also apply to antenna arrays of constant aperture size as well.
Figure 6-1. Comparison of propagation loss equations for different antenna combinations. (Source: Alcatel-Lucent, used with permission.)
To illustrate the fact that path loss is not frequency dependent in free space when a constant physical
size is assumed at the receiving antenna, regardless of frequency, consider the power flux density
(measured in W/m2) of the plane wave at the receive antenna at distance d from the transmit antenna
(18):
W/m2 (2)
Equation (2) shows that the received power density is not a function of frequency, but is only a function
of the transmitter power and path distance. The reason for the larger path loss at higher frequencies in
Equation (1) is because the antenna gain at the receiver is implicitly assumed to be the same for all
frequencies, which further implies the receiver antenna size shrinks at higher frequencies in order to
maintain a physical size that is proportional to the operating wavelength However, instead of shrinking
antennas in proportion to the wavelength, if it is assumed the same physical size (aperture) receiver
antenna is used at any frequency, the fixed physical dimension of the receiver antenna can be used to
implement high gain phased array antennas at mm‐wave frequencies instead of the low gain antennas
in current wireless systems.
With the assumption that the receiver antenna size (and not the gain) remains constant at any
frequency, the expression for free‐space path loss in Equation (1) becomes Equation (3) as illustrated in
the right of Figure 6‐1.
24 dGGPL RT (3)
where Equation (3) assumes the physical area of the mm‐wave phased array at the receiver is the same
physical area as lower frequency antennas, and GT and GR are transmitter and receiver gains
respectively.
IWPCUltraHighCapacityNetworksWhitePaperVersion1.1 Page25
Do Not Copy or Distribute to ANY third party without prior written permission from IWPC © 2014, IWPC, TEL: +1‐215‐293‐9000, [email protected]
It is noted that Equation (3), as in Equation (2), is independent of operating frequency, since the
assumption of identical physical sized antennas at any frequency causes the path loss to decrease (e.g.
the channel gain to increase) by a factor of λ as the frequency increases, since the gain of the receiving
antenna implicitly increases with increasing frequency.
The result in Equation (3) can be implemented at mm‐wave frequencies using a phased array antenna
that has an area comprised of a number of smaller individual antenna elements that are proportional to
λ in area such that a fixed physical antenna area will have more elements in a phased array as the
frequency increases, thus providing greater gain at higher frequencies.
The high gains achievable by phased array antennas can more than make up for the perceived
propagation loss at mm‐wave frequencies from Equation (1), while adding the benefit of flexible,
steerable beams that can adapt to changing interference and propagation conditions in real time.
The assumption that the antenna gain increases with frequency is equivalent to saying that the
directionality of antennas increases with frequency. From this arises an important challenge for mobile
access – how to aim the antennas at each other? There are in addition, hands, heads and other nearby
obstructions that deform the antenna patterns at the UE that threatens to make high gain antennas in
the handset unusable for access. It becomes a bit like making one’s way through a thicket at night with a
laser pointer when a broad beamed flashlight is needed. Significant innovation will be needed to enable
frequencies currently limited to fixed point backhaul to be usable for mobile access.
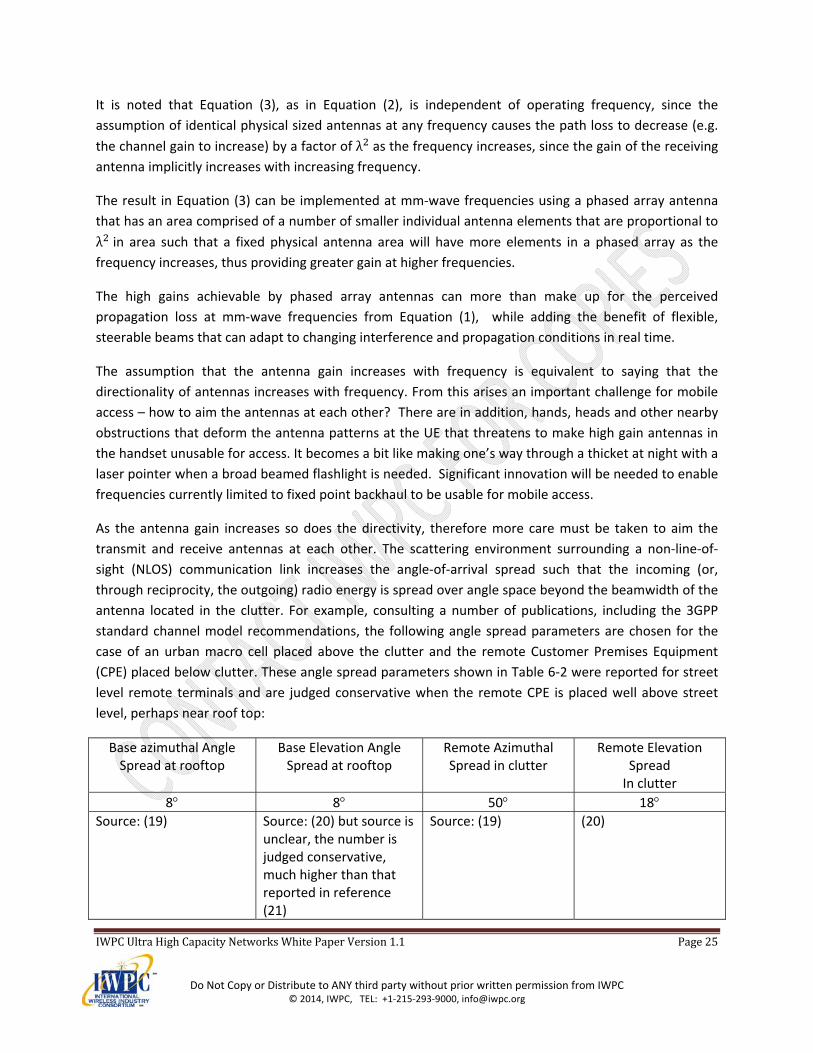
As the antenna gain increases so does the directivity, therefore more care must be taken to aim the
transmit and receive antennas at each other. The scattering environment surrounding a non‐line‐of‐
sight (NLOS) communication link increases the angle‐of‐arrival spread such that the incoming (or,
through reciprocity, the outgoing) radio energy is spread over angle space beyond the beamwidth of the
antenna located in the clutter. For example, consulting a number of publications, including the 3GPP
standard channel model recommendations, the following angle spread parameters are chosen for the
case of an urban macro cell placed above the clutter and the remote Customer Premises Equipment
(CPE) placed below clutter. These angle spread parameters shown in Table 6‐2 were reported for street
level remote terminals and are judged conservative when the remote CPE is placed well above street
level, perhaps near roof top:
Base azimuthal Angle Spread at rooftop
Base Elevation Angle Spread at rooftop
Remote Azimuthal Spread in clutter
Remote Elevation Spread In clutter
8 8 50 18 Source: (19) Source: (20) but source is
unclear, the number is judged conservative, much higher than that reported in reference (21)
Source: (19) (20)
IWPCUltraHighCapacityNetworksWhitePaperVersion1.1 Page26
Do Not Copy or Distribute to ANY third party without prior written permission from IWPC © 2014, IWPC, TEL: +1‐215‐293‐9000, [email protected]
Table 6‐2 – Angle Spread Parameters
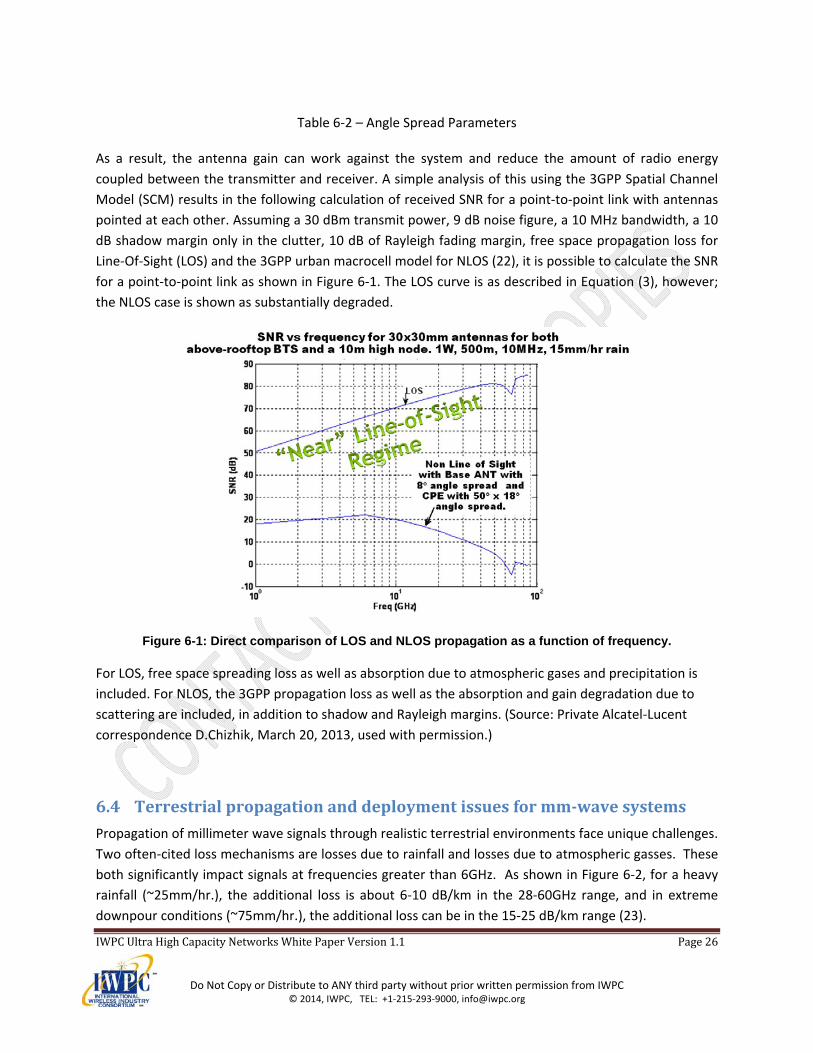
As a result, the antenna gain can work against the system and reduce the amount of radio energy
coupled between the transmitter and receiver. A simple analysis of this using the 3GPP Spatial Channel
Model (SCM) results in the following calculation of received SNR for a point‐to‐point link with antennas
pointed at each other. Assuming a 30 dBm transmit power, 9 dB noise figure, a 10 MHz bandwidth, a 10
dB shadow margin only in the clutter, 10 dB of Rayleigh fading margin, free space propagation loss for
Line‐Of‐Sight (LOS) and the 3GPP urban macrocell model for NLOS (22), it is possible to calculate the SNR
for a point‐to‐point link as shown in Figure 6‐1. The LOS curve is as described in Equation (3), however;
the NLOS case is shown as substantially degraded.
Figure 6-1: Direct comparison of LOS and NLOS propagation as a function of frequency.
For LOS, free space spreading loss as well as absorption due to atmospheric gases and precipitation is
included. For NLOS, the 3GPP propagation loss as well as the absorption and gain degradation due to
scattering are included, in addition to shadow and Rayleigh margins. (Source: Private Alcatel‐Lucent
correspondence D.Chizhik, March 20, 2013, used with permission.)
6.4 Terrestrialpropagationanddeploymentissuesformm‐wavesystems
Propagation of millimeter wave signals through realistic terrestrial environments face unique challenges.
Two often‐cited loss mechanisms are losses due to rainfall and losses due to atmospheric gasses. These
both significantly impact signals at frequencies greater than 6GHz. As shown in Figure 6‐2, for a heavy
rainfall (~25mm/hr.), the additional loss is about 6‐10 dB/km in the 28‐60GHz range, and in extreme
downpour conditions (~75mm/hr.), the additional loss can be in the 15‐25 dB/km range (23).
IWPCUltraHighCapacityNetworksWhitePaperVersion1.1 Page27
Do Not Copy or Distribute to ANY third party without prior written permission from IWPC © 2014, IWPC, TEL: +1‐215‐293‐9000, [email protected]
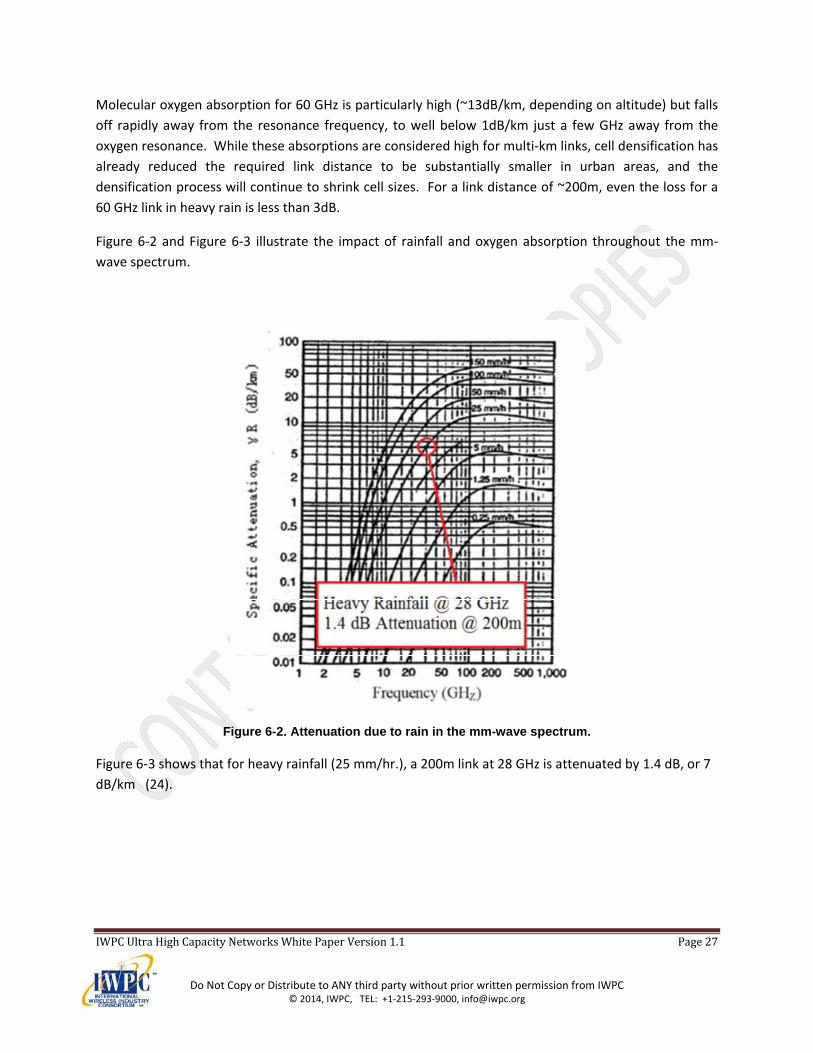
Molecular oxygen absorption for 60 GHz is particularly high (~13dB/km, depending on altitude) but falls
off rapidly away from the resonance frequency, to well below 1dB/km just a few GHz away from the
oxygen resonance. While these absorptions are considered high for multi‐km links, cell densification has
already reduced the required link distance to be substantially smaller in urban areas, and the
densification process will continue to shrink cell sizes. For a link distance of ~200m, even the loss for a
60 GHz link in heavy rain is less than 3dB.
Figure 6‐2 and Figure 6‐3 illustrate the impact of rainfall and oxygen absorption throughout the mm‐
wave spectrum.
Figure 6-2. Attenuation due to rain in the mm-wave spectrum.
Figure 6‐3 shows that for heavy rainfall (25 mm/hr.), a 200m link at 28 GHz is attenuated by 1.4 dB, or 7
dB/km (24).
IWPCUltraHighCapacityNetworksWhitePaperVersion1.1 Page28
Do Not Copy or Distribute to ANY third party without prior written permission from IWPC © 2014, IWPC, TEL: +1‐215‐293‐9000, [email protected]
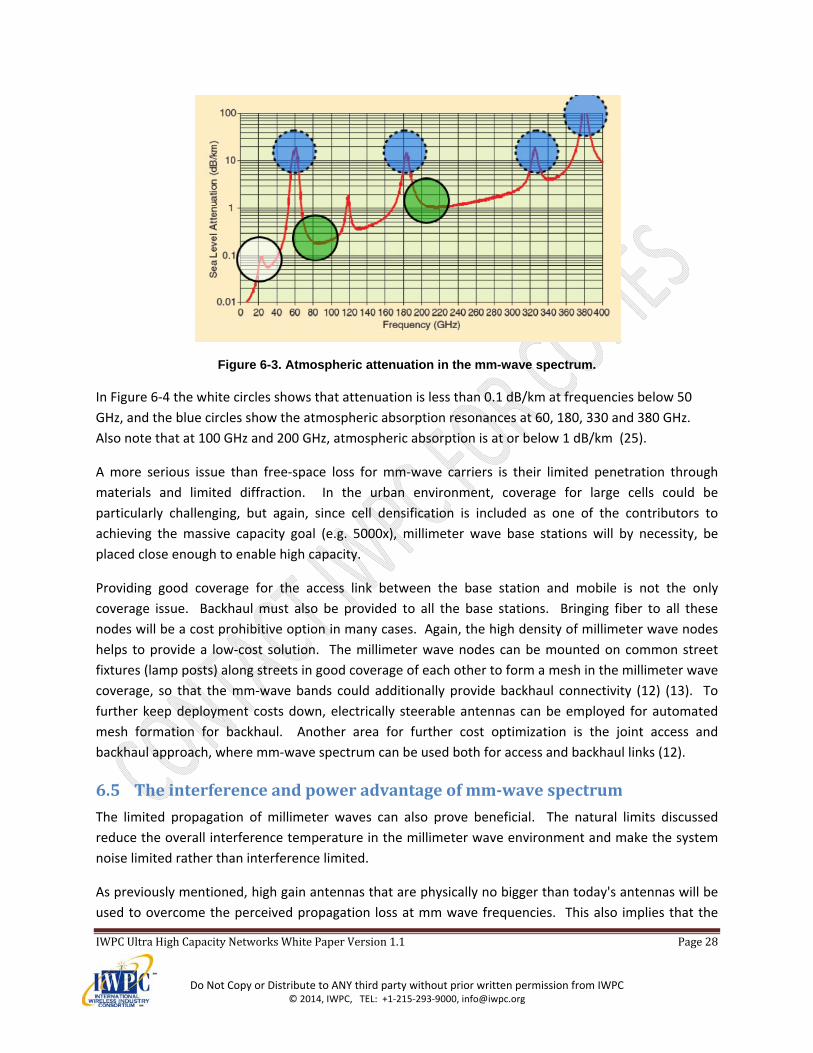
Figure 6-3. Atmospheric attenuation in the mm-wave spectrum.
In Figure 6‐4 the white circles shows that attenuation is less than 0.1 dB/km at frequencies below 50
GHz, and the blue circles show the atmospheric absorption resonances at 60, 180, 330 and 380 GHz.
Also note that at 100 GHz and 200 GHz, atmospheric absorption is at or below 1 dB/km (25).
A more serious issue than free‐space loss for mm‐wave carriers is their limited penetration through
materials and limited diffraction. In the urban environment, coverage for large cells could be
particularly challenging, but again, since cell densification is included as one of the contributors to
achieving the massive capacity goal (e.g. 5000x), millimeter wave base stations will by necessity, be
placed close enough to enable high capacity.
Providing good coverage for the access link between the base station and mobile is not the only
coverage issue. Backhaul must also be provided to all the base stations. Bringing fiber to all these
nodes will be a cost prohibitive option in many cases. Again, the high density of millimeter wave nodes
helps to provide a low‐cost solution. The millimeter wave nodes can be mounted on common street
fixtures (lamp posts) along streets in good coverage of each other to form a mesh in the millimeter wave
coverage, so that the mm‐wave bands could additionally provide backhaul connectivity (12) (13). To
further keep deployment costs down, electrically steerable antennas can be employed for automated
mesh formation for backhaul. Another area for further cost optimization is the joint access and
backhaul approach, where mm‐wave spectrum can be used both for access and backhaul links (12).
6.5 Theinterferenceandpoweradvantageofmm‐wavespectrum
The limited propagation of millimeter waves can also prove beneficial. The natural limits discussed
reduce the overall interference temperature in the millimeter wave environment and make the system
noise limited rather than interference limited.
As previously mentioned, high gain antennas that are physically no bigger than today's antennas will be
used to overcome the perceived propagation loss at mm wave frequencies. This also implies that the
IWPCUltraHighCapacityNetworksWhitePaperVersion1.1 Page29
Do Not Copy or Distribute to ANY third party without prior written permission from IWPC © 2014, IWPC, TEL: +1‐215‐293‐9000, [email protected]
antennas have very narrow beamwidth. The narrow beams and high gain antennas provide further
advantage in interference mitigation. The transmit energy is focused in a narrow direction towards the
intended receiver, and thereby does not interfere with most of the coverage area. At the receiver,
additional spatial filtering is performed with another high gain steerable antenna, and any residual
interference arriving outside of the receiver's beamwidth is further reduced by the spatial discrimination
of the high gain antenna.
The directional beams of both the transmitter and receiver work in tandem leading to a system that is
primarily noise (or power) limited rather than interference limited – effectively eliminating the
traditional interference limited cell‐edge problem.
While this concept is not new, the ability to integrate small, high gain antennas in UE equipment has
only recently been available with the interest in 60 GHz WiGig and WirelessHD (17) (26).
Another benefit from high gain antennas is better energy efficiency. At the transmitter, a much higher
Effective Isotropic Radiated Power (EIRP) is achieved for a given total radiated power budget. At the
receiver, the high gain adds directly to performance (or reduced TX power requirement).
Technological developments are still needed, e.g. to make very efficient high gain antennas and mm‐
wave RF power amplifiers in integrated form factors. Work is rapidly advancing in this field, and new
theories have recently been developed to allow engineers to more effectively design mm‐wave
components (17) (27).
7 Propagationcharacteristicsofmm‐wavebands
7.1 Frequencydependenceofpropagationmechanisms
In general, radio wave propagation is affected by diverse physical mechanisms that more or less corrupt
the original transmitted signal arriving at the receiver. Propagation mechanisms include free‐space
propagation, object penetration, reflection, scattering, diffraction as well as absorption caused by
atmospheric gases, fog and precipitation. To what extent each mechanism contributes to the overall
signal attenuation and distortion depends greatly on the propagation scenario (e.g. link distance,
indoor/outdoor, LOS/NLOS) and the radio frequency of operation.
7.1.1 Free‐spacepropagation:
Free‐space propagation conditions can be assumed if the first Fresnel zone is substantially free of
obstacles. According to the well‐known Friis equation (28) (29), the free‐space path loss increase with
the square of link distance and carrier frequency, as shown in Equation (1). If either the distance or the
frequency is doubled, the propagation path loss increases by 6 dB (20 dB increase per decade). As a
result, a transmitted signal at 60 GHz undergoes an almost 36 dB higher attenuation on the same way to
the receiver compared to a signal at 1 GHz, even before the atmospheric absorption due to Oxygen as
shown in Figure 6‐3
IWPCUltraHighCapacityNetworksWhitePaperVersion1.1 Page30
Do Not Copy or Distribute to ANY third party without prior written permission from IWPC © 2014, IWPC, TEL: +1‐215‐293‐9000, [email protected]
7.1.2 Atmosphericeffects:
Atmospheric effects mainly involve oxygen and water vapor absorption as well as fog and precipitation.
They scale exponentially with the link distance (30). Confining to distances below 1 km, attenuation
caused by atmospheric gases can be neglected up to 50 GHz, as shown in Figure 6‐3. However, above 50
GHz, it becomes important to take into account the oxygen absorption peak of approx. 15 dB/km at 60
GHz and the water vapor resonance peak at 183 GHz (approx. 29 dB for rel. humidity of 44% under
standard conditions). Neither fog nor rain is relevant for frequencies below 5 GHz. At frequencies
above 80 GHz, dense fog related to a visibility of less than 70 m has a visible impact ( 3 dB/km) and
becomes severe above 200 GHz ( 10 dB/km). Drizzle and steady rain are not a substantial issue for
distances up to 1 km (3.0–4.4 dB/km above 70 GHz). However, as shown in Figure 6‐3, heavy rain yields
values up to 10‐15 dB/km, and for downpours, attenuations up to 40 dB/km can be experienced. Also,
hail storms, while rare, can greatly attenuate links, causing as much as 35 dB of attenuation on a 670 m
path (31).
In summary, atmospheric effects, especially under bad weather conditions are relevant for mm‐wave
links over distances above 100 m and a crucial issue for longer distances of 1 km.
7.1.3 Penetrationlosses:
Electromagnetic waves are attenuated when they propagate through objects. It is well known that the
transmission coefficient for dielectric materials is a function of the wavelength (32) (33), although recent
works shows that at mm‐wave frequencies, most outdoor building materials, such as tinted glass and
brick, are high loss, but indoor materials are relatively easy to penetrate (34).
At frequencies up to several GHz, it is possible to achieve coverage inside buildings from a base station
outside, though the signals can be attenuated by several dB up to around 20 dB (35) (36).
The attenuation depends on the building materials and the building type, especially on the type of
windows and the percentage of the windowed area. The reason for that is that glass can provide a
relatively low loss path even to millimeter waves on the one hand (37) (38). On the other hand, losses
due to glass with metallic tints and coating can be as high as 30 dB, even in the lower GHz range (39).
The attenuation caused by concrete or brick walls becomes very high in the mm‐wave band, on the
order of 30‐40 dB as shown in Figure 7‐1 and Figure 7‐2, which means that solid walls and buildings are
practically impenetrable (32) (38) (34).
However, recent work at 28 and 72 GHz demonstrate that once inside of a building, propagation
between rooms is relatively easy to accomplish, as shown in Table 7‐1 and Table 7‐2 of penetration
measurements (34) (40).
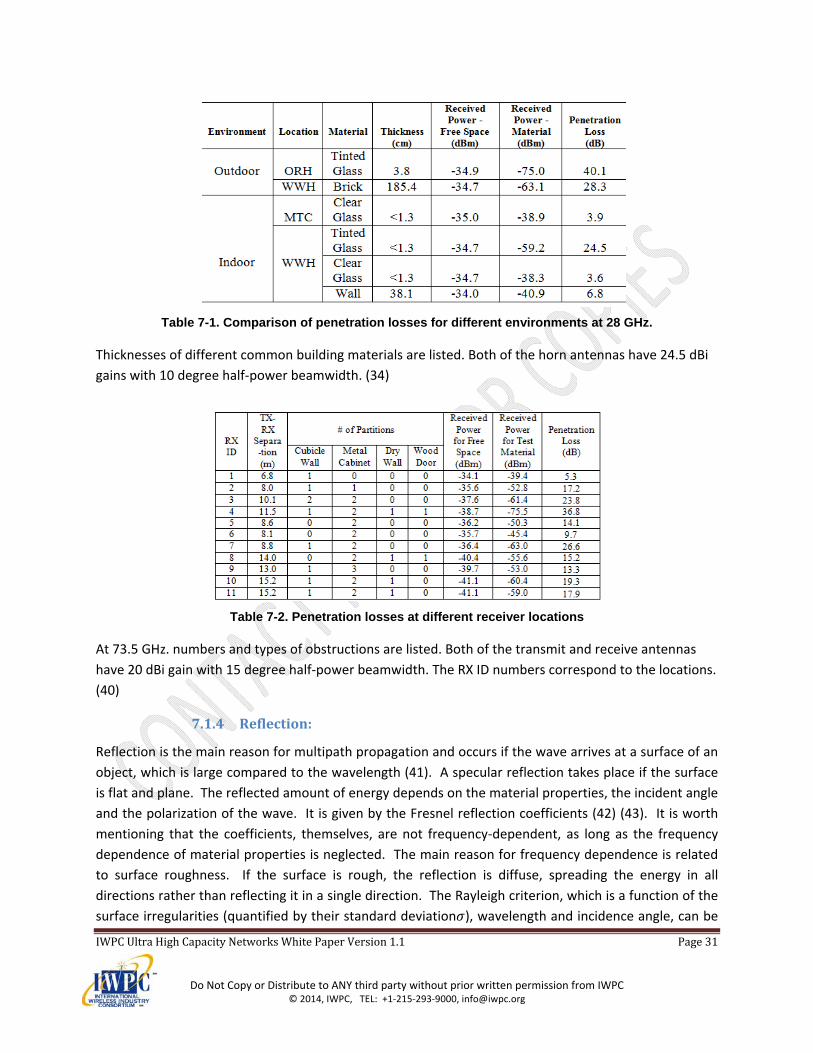
IWPCUltraHighCapacityNetworksWhitePaperVersion1.1 Page31
Do Not Copy or Distribute to ANY third party without prior written permission from IWPC © 2014, IWPC, TEL: +1‐215‐293‐9000, [email protected]
Table 7-1. Comparison of penetration losses for different environments at 28 GHz.
Thicknesses of different common building materials are listed. Both of the horn antennas have 24.5 dBi
gains with 10 degree half‐power beamwidth. (34)
Table 7-2. Penetration losses at different receiver locations
At 73.5 GHz. numbers and types of obstructions are listed. Both of the transmit and receive antennas
have 20 dBi gain with 15 degree half‐power beamwidth. The RX ID numbers correspond to the locations.
(40)
7.1.4 Reflection:
Reflection is the main reason for multipath propagation and occurs if the wave arrives at a surface of an
object, which is large compared to the wavelength (41). A specular reflection takes place if the surface
is flat and plane. The reflected amount of energy depends on the material properties, the incident angle
and the polarization of the wave. It is given by the Fresnel reflection coefficients (42) (43). It is worth
mentioning that the coefficients, themselves, are not frequency‐dependent, as long as the frequency
dependence of material properties is neglected. The main reason for frequency dependence is related
to surface roughness. If the surface is rough, the reflection is diffuse, spreading the energy in all
directions rather than reflecting it in a single direction. The Rayleigh criterion, which is a function of the
surface irregularities (quantified by their standard deviation ), wavelength and incidence angle, can be
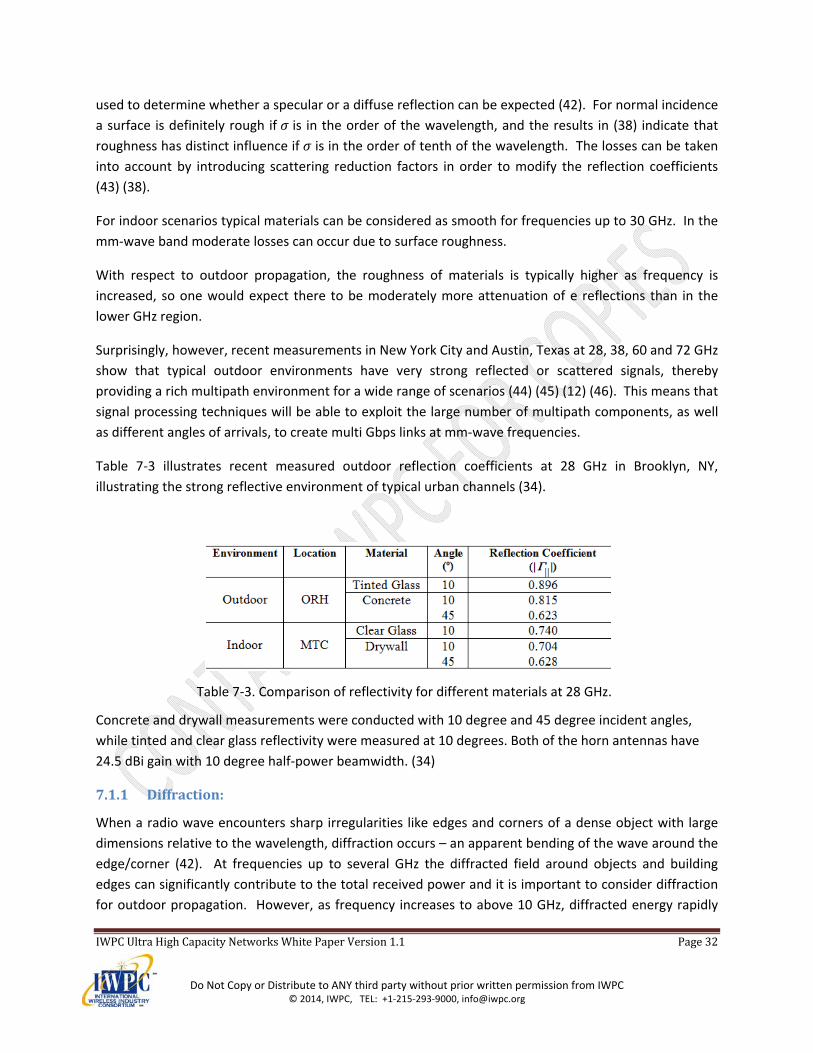
IWPCUltraHighCapacityNetworksWhitePaperVersion1.1 Page32
Do Not Copy or Distribute to ANY third party without prior written permission from IWPC © 2014, IWPC, TEL: +1‐215‐293‐9000, [email protected]
used to determine whether a specular or a diffuse reflection can be expected (42). For normal incidence
a surface is definitely rough if is in the order of the wavelength, and the results in (38) indicate that
roughness has distinct influence if is in the order of tenth of the wavelength. The losses can be taken
into account by introducing scattering reduction factors in order to modify the reflection coefficients
(43) (38).
For indoor scenarios typical materials can be considered as smooth for frequencies up to 30 GHz. In the
mm‐wave band moderate losses can occur due to surface roughness.
With respect to outdoor propagation, the roughness of materials is typically higher as frequency is
increased, so one would expect there to be moderately more attenuation of e reflections than in the
lower GHz region.
Surprisingly, however, recent measurements in New York City and Austin, Texas at 28, 38, 60 and 72 GHz
show that typical outdoor environments have very strong reflected or scattered signals, thereby
providing a rich multipath environment for a wide range of scenarios (44) (45) (12) (46). This means that
signal processing techniques will be able to exploit the large number of multipath components, as well
as different angles of arrivals, to create multi Gbps links at mm‐wave frequencies.
Table 7‐3 illustrates recent measured outdoor reflection coefficients at 28 GHz in Brooklyn, NY,
illustrating the strong reflective environment of typical urban channels (34).
Table 7‐3. Comparison of reflectivity for different materials at 28 GHz.
Concrete and drywall measurements were conducted with 10 degree and 45 degree incident angles,
while tinted and clear glass reflectivity were measured at 10 degrees. Both of the horn antennas have
24.5 dBi gain with 10 degree half‐power beamwidth. (34)
7.1.1 Diffraction:
When a radio wave encounters sharp irregularities like edges and corners of a dense object with large
dimensions relative to the wavelength, diffraction occurs – an apparent bending of the wave around the
edge/corner (42). At frequencies up to several GHz the diffracted field around objects and building
edges can significantly contribute to the total received power and it is important to consider diffraction
for outdoor propagation. However, as frequency increases to above 10 GHz, diffracted energy rapidly
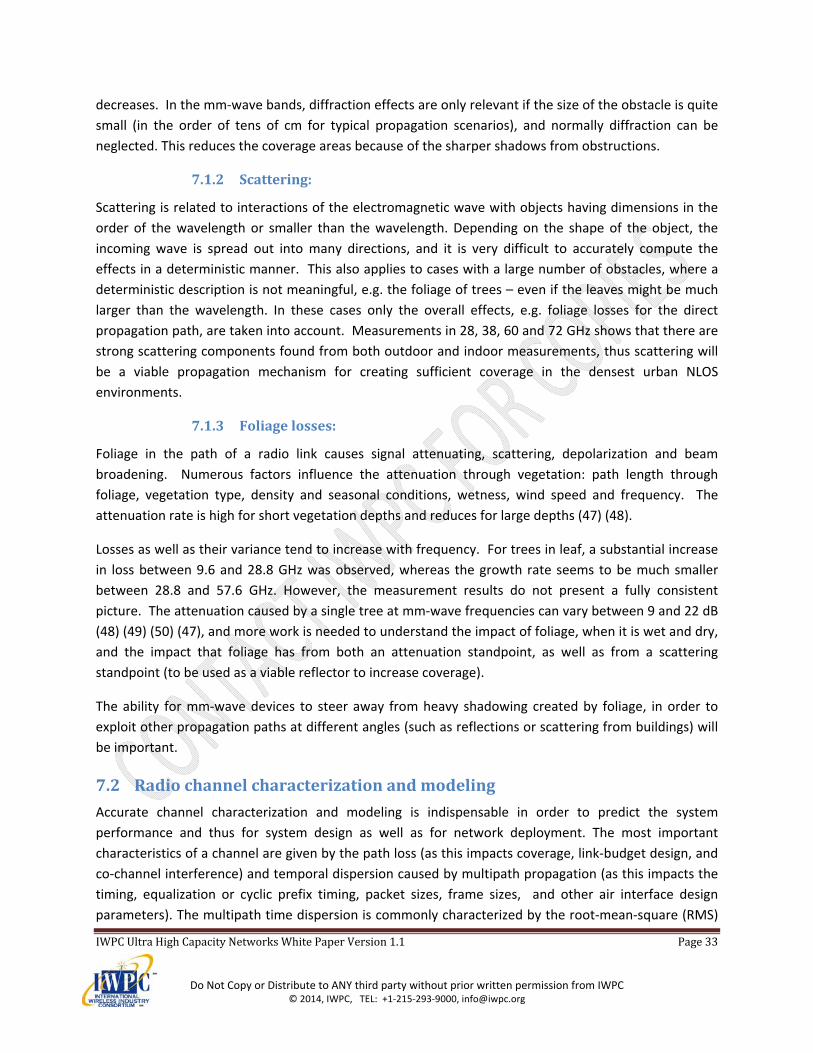
IWPCUltraHighCapacityNetworksWhitePaperVersion1.1 Page33
Do Not Copy or Distribute to ANY third party without prior written permission from IWPC © 2014, IWPC, TEL: +1‐215‐293‐9000, [email protected]
decreases. In the mm‐wave bands, diffraction effects are only relevant if the size of the obstacle is quite
small (in the order of tens of cm for typical propagation scenarios), and normally diffraction can be
neglected. This reduces the coverage areas because of the sharper shadows from obstructions.
7.1.2 Scattering:
Scattering is related to interactions of the electromagnetic wave with objects having dimensions in the
order of the wavelength or smaller than the wavelength. Depending on the shape of the object, the
incoming wave is spread out into many directions, and it is very difficult to accurately compute the
effects in a deterministic manner. This also applies to cases with a large number of obstacles, where a
deterministic description is not meaningful, e.g. the foliage of trees – even if the leaves might be much
larger than the wavelength. In these cases only the overall effects, e.g. foliage losses for the direct
propagation path, are taken into account. Measurements in 28, 38, 60 and 72 GHz shows that there are
strong scattering components found from both outdoor and indoor measurements, thus scattering will
be a viable propagation mechanism for creating sufficient coverage in the densest urban NLOS
environments.
7.1.3 Foliagelosses:
Foliage in the path of a radio link causes signal attenuating, scattering, depolarization and beam
broadening. Numerous factors influence the attenuation through vegetation: path length through
foliage, vegetation type, density and seasonal conditions, wetness, wind speed and frequency. The
attenuation rate is high for short vegetation depths and reduces for large depths (47) (48).
Losses as well as their variance tend to increase with frequency. For trees in leaf, a substantial increase
in loss between 9.6 and 28.8 GHz was observed, whereas the growth rate seems to be much smaller
between 28.8 and 57.6 GHz. However, the measurement results do not present a fully consistent
picture. The attenuation caused by a single tree at mm‐wave frequencies can vary between 9 and 22 dB
(48) (49) (50) (47), and more work is needed to understand the impact of foliage, when it is wet and dry,
and the impact that foliage has from both an attenuation standpoint, as well as from a scattering
standpoint (to be used as a viable reflector to increase coverage).
The ability for mm‐wave devices to steer away from heavy shadowing created by foliage, in order to
exploit other propagation paths at different angles (such as reflections or scattering from buildings) will
be important.
7.2 Radiochannelcharacterizationandmodeling
Accurate channel characterization and modeling is indispensable in order to predict the system
performance and thus for system design as well as for network deployment. The most important
characteristics of a channel are given by the path loss (as this impacts coverage, link‐budget design, and
co‐channel interference) and temporal dispersion caused by multipath propagation (as this impacts the
timing, equalization or cyclic prefix timing, packet sizes, frame sizes, and other air interface design
parameters). The multipath time dispersion is commonly characterized by the root‐mean‐square (RMS)
IWPCUltraHighCapacityNetworksWhitePaperVersion1.1 Page34
Do Not Copy or Distribute to ANY third party without prior written permission from IWPC © 2014, IWPC, TEL: +1‐215‐293‐9000, [email protected]
delay spread. With high gain directional mm‐wave antennas, important consideration will also need to
be given to spatial channel models, such as the angle of arrival (AOA) and angle of departure (AOD) of
multipath, as well as the beamwidths used to capture signals (51). Typically, a channel sounder is used
to collect power delay profiles (PDPs) of typical mobile channel scenarios. A block diagram of a typical
channel sounder, used to generate a 400 Megachip per second spread spectrum signal (e.g. 800 MHz RF
bandwidth), is shown in Figure 7‐1 with photographs in Figure 7‐2 and Figure 7‐3.
Figure 7-1. Block diagram of a 72 GHz E-Band Channel Sounder used to collect Power Delay Profile measurements (52).
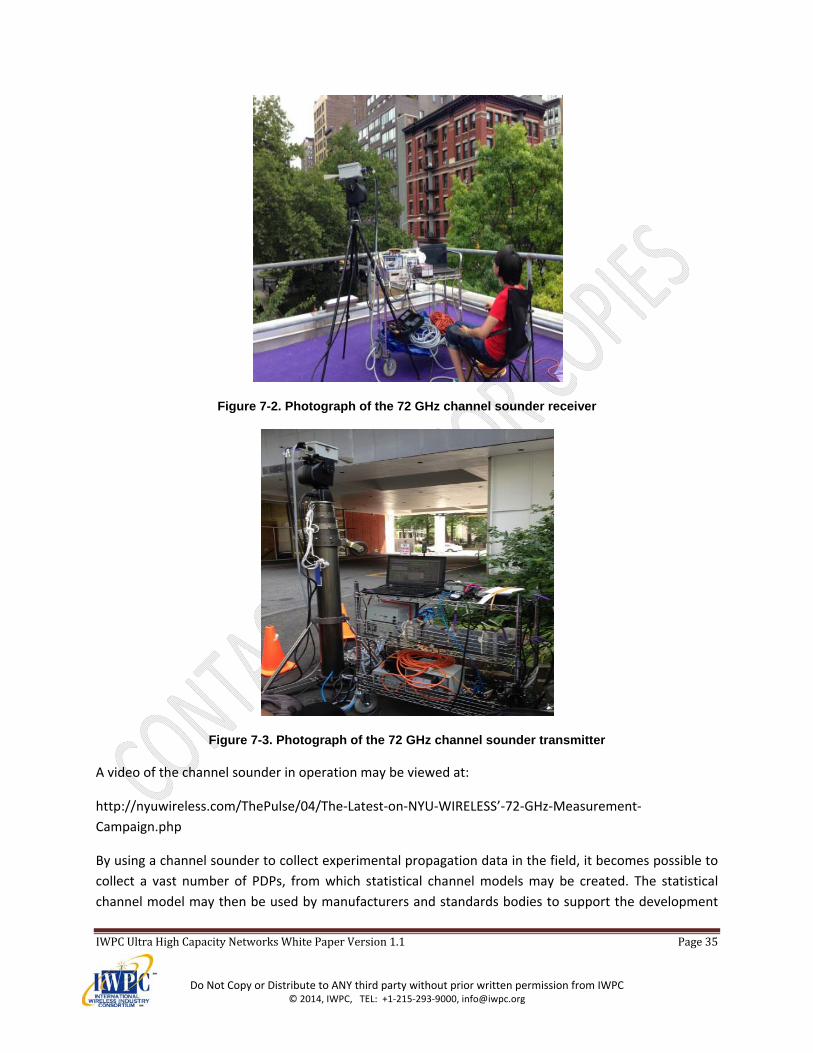
IWPCUltraHighCapacityNetworksWhitePaperVersion1.1 Page35
Do Not Copy or Distribute to ANY third party without prior written permission from IWPC © 2014, IWPC, TEL: +1‐215‐293‐9000, [email protected]
Figure 7-2. Photograph of the 72 GHz channel sounder receiver
Figure 7-3. Photograph of the 72 GHz channel sounder transmitter
A video of the channel sounder in operation may be viewed at:
http://nyuwireless.com/ThePulse/04/The‐Latest‐on‐NYU‐WIRELESS’‐72‐GHz‐Measurement‐
Campaign.php
By using a channel sounder to collect experimental propagation data in the field, it becomes possible to
collect a vast number of PDPs, from which statistical channel models may be created. The statistical
channel model may then be used by manufacturers and standards bodies to support the development
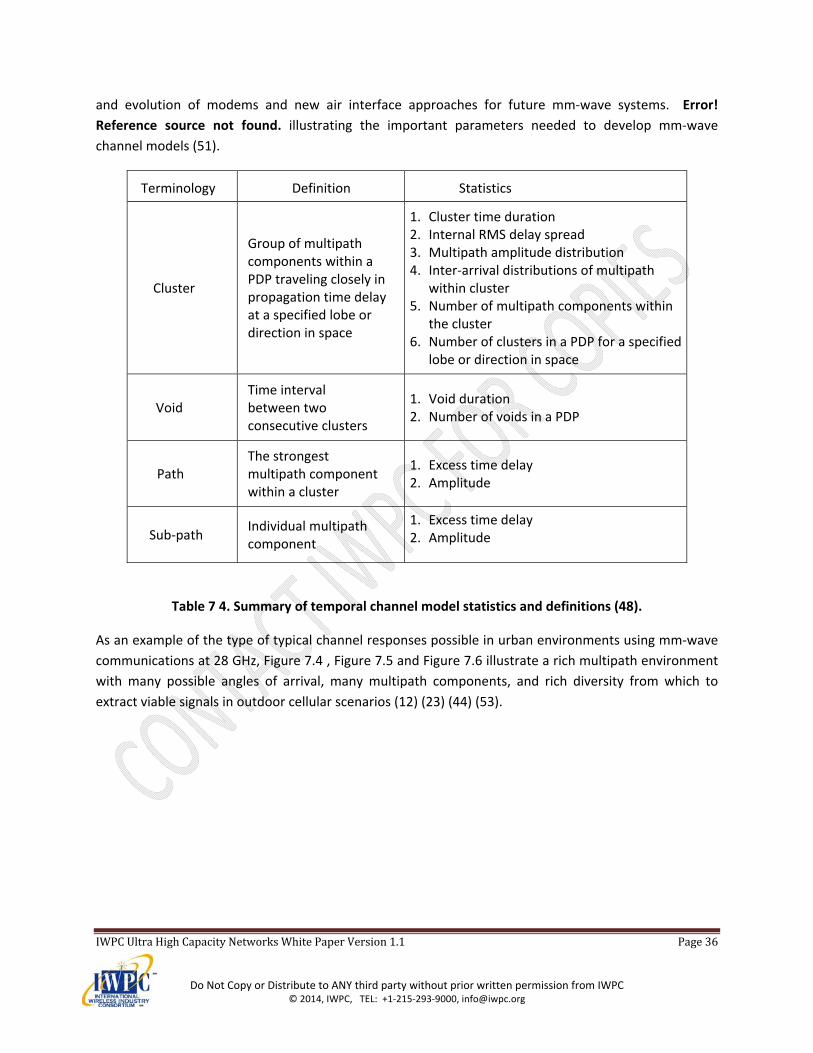
IWPCUltraHighCapacityNetworksWhitePaperVersion1.1 Page36
Do Not Copy or Distribute to ANY third party without prior written permission from IWPC © 2014, IWPC, TEL: +1‐215‐293‐9000, [email protected]
and evolution of modems and new air interface approaches for future mm‐wave systems. Error!
Reference source not found. illustrating the important parameters needed to develop mm‐wave
channel models (51).
Terminology Definition Statistics
Cluster
Group of multipath components within a PDP traveling closely in propagation time delay at a specified lobe or direction in space
1. Cluster time duration 2. Internal RMS delay spread 3. Multipath amplitude distribution 4. Inter‐arrival distributions of multipath
within cluster 5. Number of multipath components within
the cluster 6. Number of clusters in a PDP for a specified
lobe or direction in space
Void Time interval between two consecutive clusters
1. Void duration 2. Number of voids in a PDP
Path The strongest multipath component within a cluster
1. Excess time delay 2. Amplitude
Sub‐path Individual multipath component
1. Excess time delay 2. Amplitude
Table 7 4. Summary of temporal channel model statistics and definitions (48).
As an example of the type of typical channel responses possible in urban environments using mm‐wave
communications at 28 GHz, Figure 7.4 , Figure 7.5 and Figure 7.6 illustrate a rich multipath environment
with many possible angles of arrival, many multipath components, and rich diversity from which to
extract viable signals in outdoor cellular scenarios (12) (23) (44) (53).
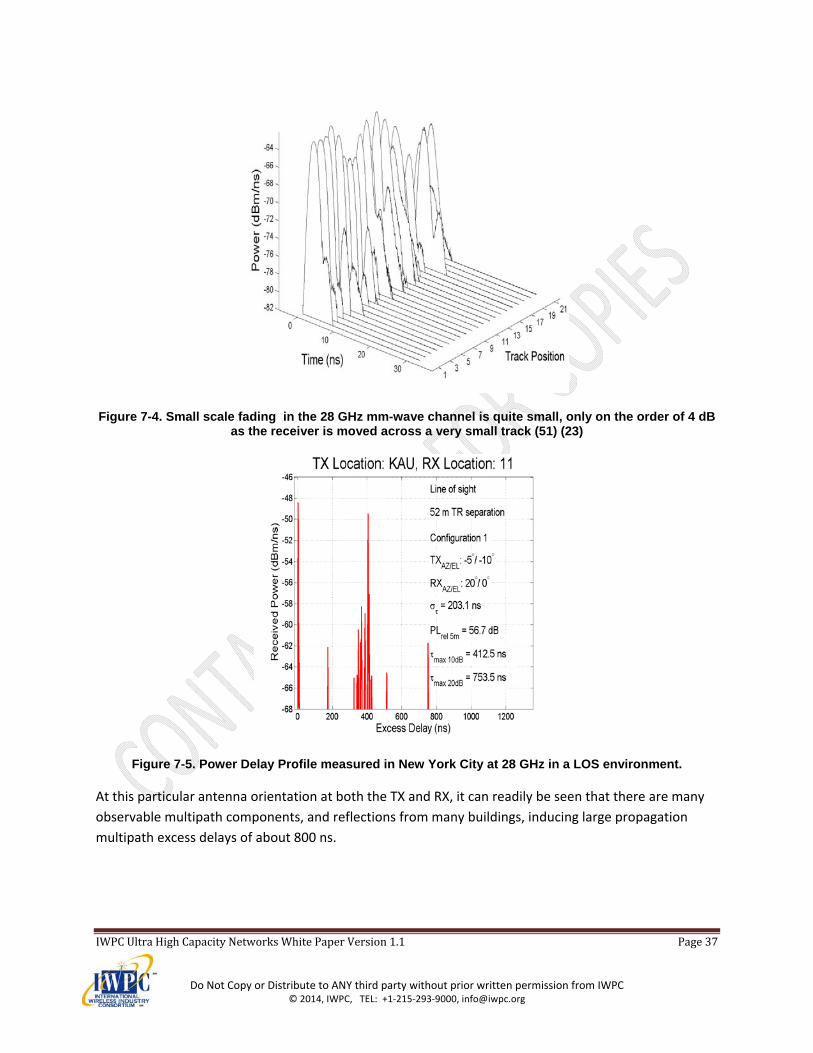
IWPCUltraHighCapacityNetworksWhitePaperVersion1.1 Page37
Do Not Copy or Distribute to ANY third party without prior written permission from IWPC © 2014, IWPC, TEL: +1‐215‐293‐9000, [email protected]
Figure 7-4. Small scale fading in the 28 GHz mm-wave channel is quite small, only on the order of 4 dB as the receiver is moved across a very small track (51) (23)
Figure 7-5. Power Delay Profile measured in New York City at 28 GHz in a LOS environment.
At this particular antenna orientation at both the TX and RX, it can readily be seen that there are many
observable multipath components, and reflections from many buildings, inducing large propagation
multipath excess delays of about 800 ns.
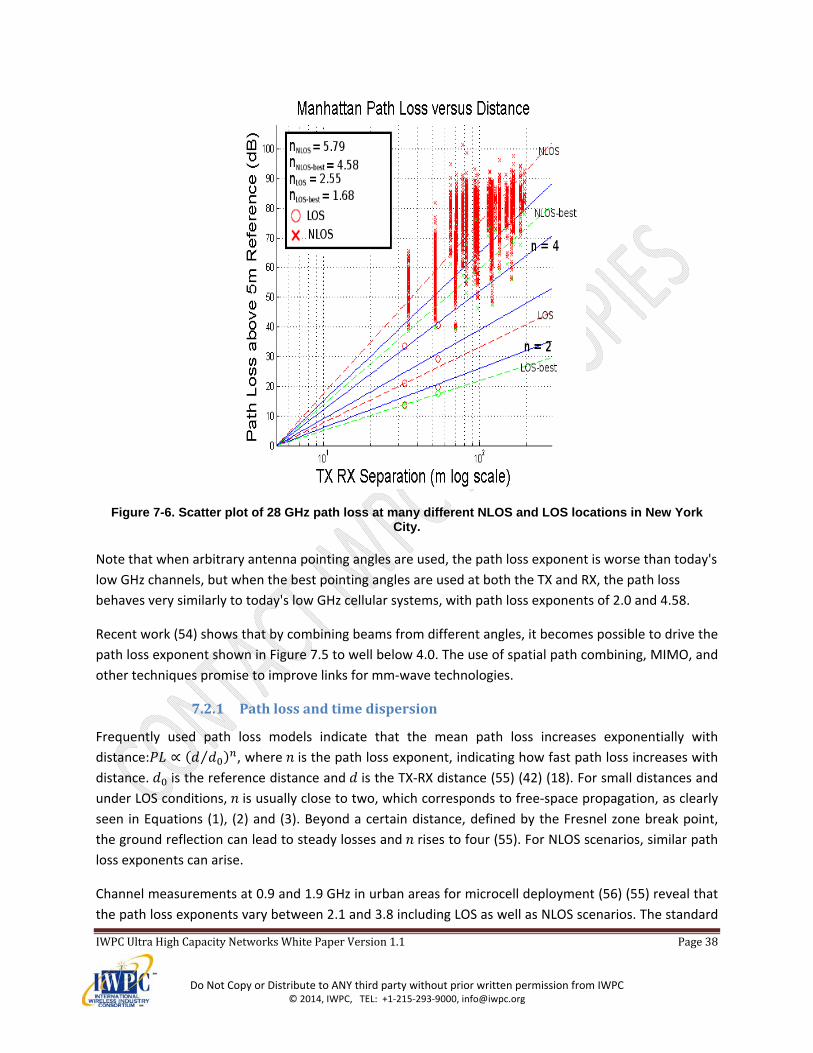
IWPCUltraHighCapacityNetworksWhitePaperVersion1.1 Page38
Do Not Copy or Distribute to ANY third party without prior written permission from IWPC © 2014, IWPC, TEL: +1‐215‐293‐9000, [email protected]
Figure 7-6. Scatter plot of 28 GHz path loss at many different NLOS and LOS locations in New York City.
Note that when arbitrary antenna pointing angles are used, the path loss exponent is worse than today's
low GHz channels, but when the best pointing angles are used at both the TX and RX, the path loss
behaves very similarly to today's low GHz cellular systems, with path loss exponents of 2.0 and 4.58.
Recent work (54) shows that by combining beams from different angles, it becomes possible to drive the
path loss exponent shown in Figure 7.5 to well below 4.0. The use of spatial path combining, MIMO, and
other techniques promise to improve links for mm‐wave technologies.
7.2.1 Pathlossandtimedispersion
Frequently used path loss models indicate that the mean path loss increases exponentially with
distance: ∝ ⁄ , where is the path loss exponent, indicating how fast path loss increases with
distance. is the reference distance and is the TX‐RX distance (55) (42) (18). For small distances and
under LOS conditions, is usually close to two, which corresponds to free‐space propagation, as clearly
seen in Equations (1), (2) and (3). Beyond a certain distance, defined by the Fresnel zone break point,
the ground reflection can lead to steady losses and rises to four (55). For NLOS scenarios, similar path
loss exponents can arise.
Channel measurements at 0.9 and 1.9 GHz in urban areas for microcell deployment (56) (55) reveal that
the path loss exponents vary between 2.1 and 3.8 including LOS as well as NLOS scenarios. The standard
IWPCUltraHighCapacityNetworksWhitePaperVersion1.1 Page39
Do Not Copy or Distribute to ANY third party without prior written permission from IWPC © 2014, IWPC, TEL: +1‐215‐293‐9000, [email protected]
deviation of the actual path loss around the mean is between 7.7 dB and 10 dB. The RMS delay
spread was found to be a strong function of antenna height [FBR+94], and the maximum values varied
between 732 and 1860 ns. Confirmed by (56), the delay spread seems to be typically less than 2 µs for
microcellular sites in the lower GHz range.
With respect to mm‐wave propagation considerable work has been carried out since the 1990s, mainly
related to 60 GHz indoor propagation, but also to outdoor channels (57) (58) (59) (60). As mobile data
rates are continuously increasing, mm‐wave outdoor propagation for access links has become a current
research topic (53) (61) (45) (62) (12) (44).
The most important finding of previous studies is that multipath propagation is an issue for outdoor
scenarios as is it for indoor propagation. Though it might be difficult to penetrate buildings, cars and also
smaller objects like trash cans or signs are potential reflectors, and recent measurements show that
even humans are highly reflective at mm‐wave frequencies (45). Due to reflections from these objects
and the ground, as well as tunnel walls, measurements in environments like airport fields, urban streets,
city tunnels, parking lots and parking garages show that the received signal is constituted by the sum of
several rays (57). More recent measurements in New York City and Austin, Texas in outdoor
environments show that there is rich multipath, and many angles of arrival are possible for propagation
at most locations. While perhaps not surprising, (12) shows that there is greater loss in deep urban
canyons when compared to light urban environments, yet in all cases, the propagation distance for
modest powered (13 dBm) mm‐wave systems with reasonable gain antennas (15 to 25 dB steerable
antennas at TX and RX) permitted coverage distances of up to 200m in virtually all NLOS environments,
with path loss exponents not far different from today's cellular systems (53) Dominant contributions to
the received power result from specular reflections, either induced by smooth surfaces or small
incidence angles with respect to the surface. The ground reflection can have an important impact and
result in typical two‐ray propagation fading (63) (64). However, as the wavelength is very small at mm‐
wave bands, the break point distance easily exceeds the targeted transmission distance even for small
antenna heights. This means that the fourth order power law for LOS propagation is not expected to
apply. Measurement results consistently confirm that the path loss exponent is very close to two for
LOS propagation (53) (62) (61) (60). Some variation towards smaller or larger values in the range
between 1.9–2.5 can be observed due to strong multipath or partially obstructed LOS conditions,
respectively. Trees primarily cause losses when they obstruct relevant propagation paths. Related
diffuse scattering is negligible and cannot be exploited (57).
In the mm‐wave band, shadowing effects are considerably more severe and losses due to trees, rooftops
and human bodies. In the past, it was commonly thought that only LOS conditions could possibly yield
sufficient signal strength for radio transmission. However, the presence of specular reflections with
significant power motivates the use of mm‐waves for cellular applications even under obstructed LOS
(OLOS) or NLOS conditions – at least for small cell sizes below 200 m in radius. Assuming that highly
directional steerable antennas can be utilized, a receiver might be able to establish a link by pointing to
one of the available reflection sources in relation to a rooftop‐mounted transmitter (45) (61) (62) (44)
IWPCUltraHighCapacityNetworksWhitePaperVersion1.1 Page40
Do Not Copy or Distribute to ANY third party without prior written permission from IWPC © 2014, IWPC, TEL: +1‐215‐293‐9000, [email protected]
(12). Exploitable NLOS paths were found to be 10 to 40 dB weaker compared to LOS, and NLOS path loss
exponents are in the range 3.2–4.2 in connection with 8.4–13.4 dB. It can be concluded that these
results are quite similar to the path loss behavior at lower frequencies, but keeping in mind that the
results are related to much smaller cell sizes and to applying high‐gain steerable antennas.
Time dispersion under LOS conditions was found to be very small in most of the cases, but expectably is
highly dependent on the environment as well as on the antennas. According to [SC97] city streets and
tunnels do not present a severe multipath situation and RMS delay spread values are typically lower
than 20 ns. However, the street width has large effect (58). Stronger dispersion can occur on city
squares, and especially in parking garages because of the large dimensions and the relatively smooth
surfaces (57). In accordance to these declarations, very low RMS delay spreads (up to 1.4 ns) were
observed for the peer‐to‐peer and cellular scenario in (53) (45) (38 and 60 GHz), where 25 dBi antennas
were used at both sides. Values to be considered for point‐to‐point links with higher antenna gains are
even lower ( rms 0.21 ns with 45 dBi antennas according to E‐band specifications stated in (65)).
When also (partially) obstructed LOS conditions are taken into account, the delay spread increases and
can take values up to 16 ns (62).
The conditions change when NLOS scenarios are considered. Though average RMS delay spreads are
still in the moderate range 7–24 ns, maximum values up to 133 ns can be observed (62) (53). It was
further found that the RMS delay spread is a strong function of the off‐bore sight pointing angles and
TX‐RX separation, respectively excess path loss (62) (53) (45).
In summary, the RMS delay spread of mm‐wave outdoor channels seems be of the same order as for
indoor and in‐cabin propagation, where values between 10–100 ns have been found (57) (66) (67) and it
stays one order below the spread occurring at classical cellular frequencies. Again, it should be noted
these results must be seen in relation to transmission distances below 200 m and high‐gain steerable
antennas considered for the mm‐wave outdoor links.
7.3 Challengeswithrespecttomm‐waveoutdoorchannelmodeling
A channel model is intended to include all relevant propagation aspects and to comprehensively
describe the channel behavior on a detailed level. In principle, it can either be of deterministic or
statistical nature (57). There are well established models for cellular scenarios in the classical frequency
band (68), whereas comprehensive mm‐wave outdoor channel modeling is still at the beginning.
With regard to high‐gain LOS point‐to‐point links, modeling in good approximation is equivalent to
predicting the path loss between two aligned antennas. In the lower GHz region, atmospheric effects
can be neglected for short links. However, for mm‐wave links, effects such as oxygen and water vapor
absorption as well as fog and rain attenuation have to be taken into account. Comprehensive path loss
models like (30) can be applied for this task.
Things become more complex when multipath propagation is an issue, which is the case if obstacles are
close to the LOS path, antenna gains are lower, or if even NLOS links are considered. Ray tracing (RT)
IWPCUltraHighCapacityNetworksWhitePaperVersion1.1 Page41
Do Not Copy or Distribute to ANY third party without prior written permission from IWPC © 2014, IWPC, TEL: +1‐215‐293‐9000, [email protected]
has already been shown to be an appropriate tool to predict mm‐wave outdoor propagation (57).
Though RT relates to deterministic modeling, in the mm‐wave range it has usually been more intended
to roughly reproduce the channel characteristics on a site‐specific basis rather than to predict the
channel impulse response with very high accuracy. Results indicate that models based on a highly
simplified geometry can deliver good results and reflections of third order or higher as well as diffraction
may be neglected as long modeling of the path loss is focused. Geometric models besides RT are useful
to cover special scenarios like propagation in street canyons with lower computational complexity (69)
(65).
In order to achieve meaningful predictions for rich multipath environments and for OLOS and NLOS
scenarios, the requirements on model accuracy rise significantly. It is absolutely crucial to involve
appropriate material parameters and thoroughly consider surface roughness: it may decide between a
good and an infeasible link. As the materials highly depend on the building type and their effective
roughness is a strong function of the incidence angle, results will be extremely dependent on the
propagation scenario. This dependence can expect to be stronger than for lower frequencies – a trend,
which seems to be confirmed by the measurement results (53) (61) (45) (62). They reveal vast variations
of the received power and the RMS delay spread even within the same measurement site.
Generic statistical models will not be sufficient in order to assess the performance of system
approaches. Instead, site‐specific models related to real‐world reference scenarios and fine
classification of sites, also with regard to involved building materials, are required. Further channel
measurement campaigns as well as site‐related characterization of building materials are highly needed
to cover typical propagation scenarios and to derive highly‐accurate RT models. The latter provide full
access to angular information, which is of great importance for the development of appropriate beam
steering algorithms, and can be also be used as basis for precise site‐specific statistical models.
7.4 Summaryobservationsofmm‐waveprospects
There are significant challenges with using the mm‐wave spectrum for access. In general, mm‐wave
communication links often require solutions that provide methods to mitigate LOS blockage. One
means to achieve this is to utilize steerable, directional antenna arrays. These arrays steer the beam in a
direction that achieves a link via i) access an alternate base station node this is LOS or ii) access the
main, or alternate, base stations with a suitable low loss reflection. Areas that have been identified for
further study to optimize the mm‐wave solution for access are as follows:
a. Base station node placement
b. User device antenna configuration
c. Detailed channel modeling
d. Antenna control for supporting steered beam solutions
e. Low cost mm‐wave IC design
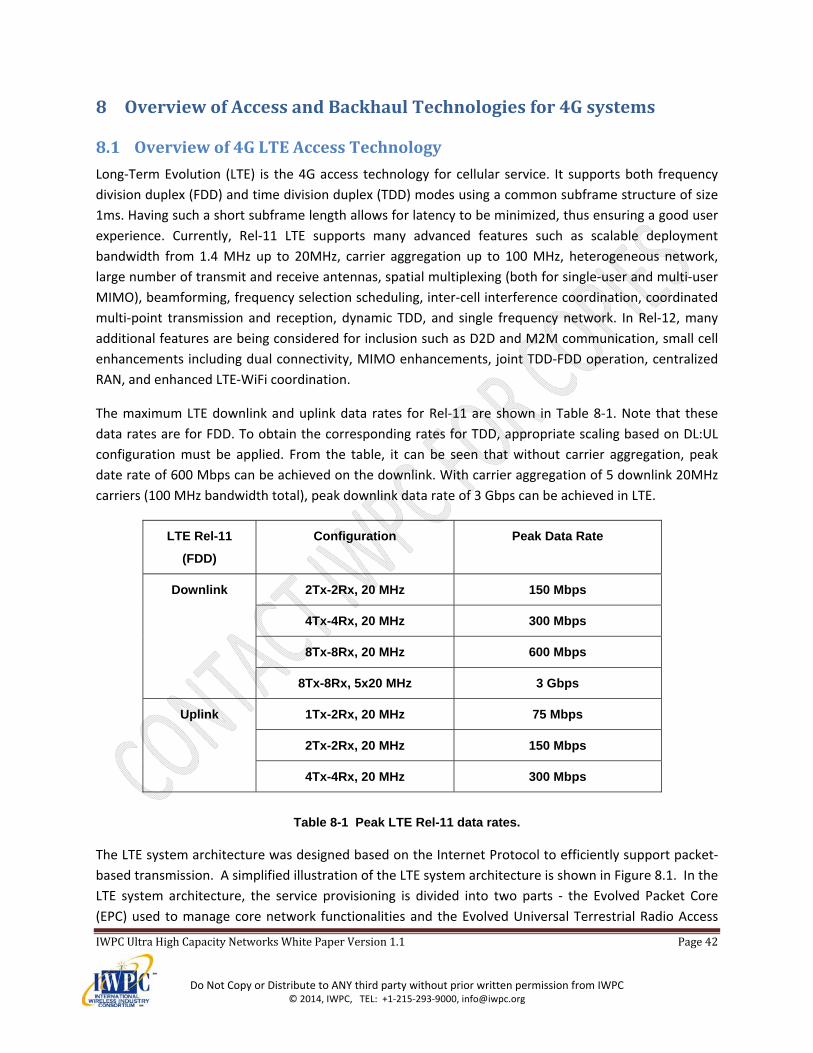
IWPCUltraHighCapacityNetworksWhitePaperVersion1.1 Page42
Do Not Copy or Distribute to ANY third party without prior written permission from IWPC © 2014, IWPC, TEL: +1‐215‐293‐9000, [email protected]
8 OverviewofAccessandBackhaulTechnologiesfor4Gsystems
8.1 Overviewof4GLTEAccessTechnology
Long‐Term Evolution (LTE) is the 4G access technology for cellular service. It supports both frequency
division duplex (FDD) and time division duplex (TDD) modes using a common subframe structure of size
1ms. Having such a short subframe length allows for latency to be minimized, thus ensuring a good user
experience. Currently, Rel‐11 LTE supports many advanced features such as scalable deployment
bandwidth from 1.4 MHz up to 20MHz, carrier aggregation up to 100 MHz, heterogeneous network,
large number of transmit and receive antennas, spatial multiplexing (both for single‐user and multi‐user
MIMO), beamforming, frequency selection scheduling, inter‐cell interference coordination, coordinated
multi‐point transmission and reception, dynamic TDD, and single frequency network. In Rel‐12, many
additional features are being considered for inclusion such as D2D and M2M communication, small cell
enhancements including dual connectivity, MIMO enhancements, joint TDD‐FDD operation, centralized
RAN, and enhanced LTE‐WiFi coordination.
The maximum LTE downlink and uplink data rates for Rel‐11 are shown in Table 8‐1. Note that these
data rates are for FDD. To obtain the corresponding rates for TDD, appropriate scaling based on DL:UL
configuration must be applied. From the table, it can be seen that without carrier aggregation, peak
date rate of 600 Mbps can be achieved on the downlink. With carrier aggregation of 5 downlink 20MHz
carriers (100 MHz bandwidth total), peak downlink data rate of 3 Gbps can be achieved in LTE.
LTE Rel-11
(FDD)
Configuration Peak Data Rate
Downlink 2Tx-2Rx, 20 MHz 150 Mbps
4Tx-4Rx, 20 MHz 300 Mbps
8Tx-8Rx, 20 MHz 600 Mbps
8Tx-8Rx, 5x20 MHz 3 Gbps
Uplink 1Tx-2Rx, 20 MHz 75 Mbps
2Tx-2Rx, 20 MHz 150 Mbps
4Tx-4Rx, 20 MHz 300 Mbps
Table 8-1 Peak LTE Rel-11 data rates.
The LTE system architecture was designed based on the Internet Protocol to efficiently support packet‐
based transmission. A simplified illustration of the LTE system architecture is shown in Figure 8.1. In the
LTE system architecture, the service provisioning is divided into two parts ‐ the Evolved Packet Core
(EPC) used to manage core network functionalities and the Evolved Universal Terrestrial Radio Access
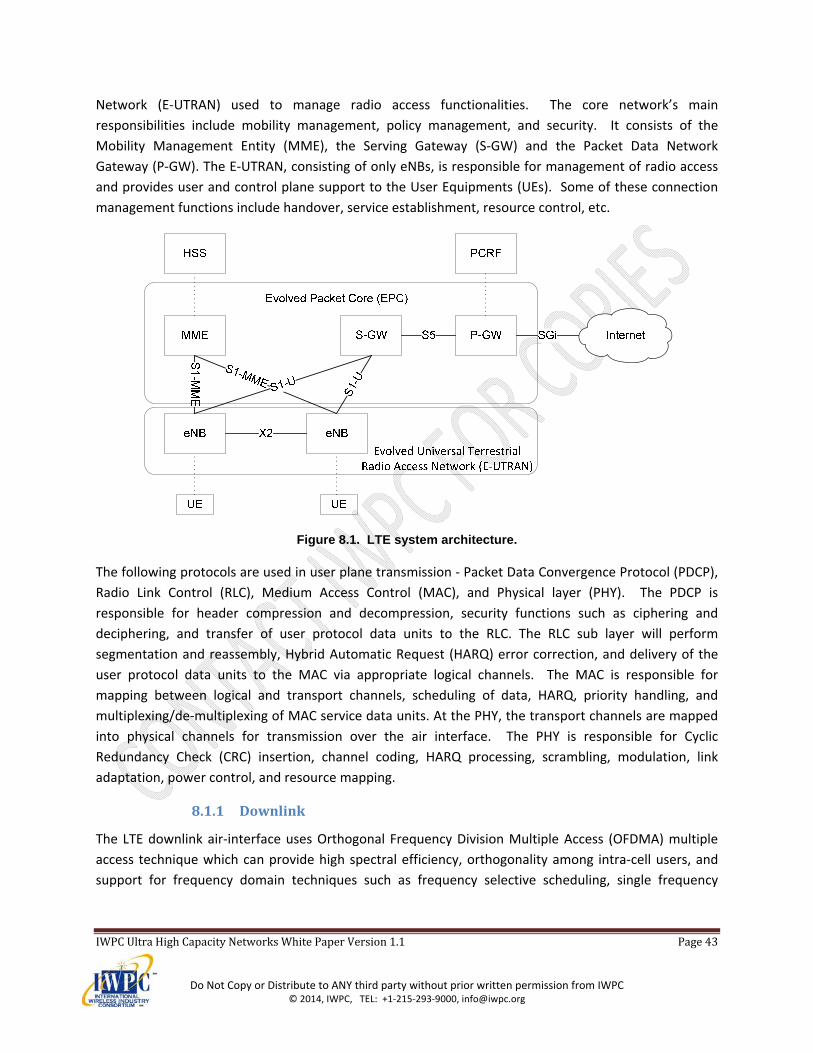
IWPCUltraHighCapacityNetworksWhitePaperVersion1.1 Page43
Do Not Copy or Distribute to ANY third party without prior written permission from IWPC © 2014, IWPC, TEL: +1‐215‐293‐9000, [email protected]
Network (E‐UTRAN) used to manage radio access functionalities. The core network’s main
responsibilities include mobility management, policy management, and security. It consists of the
Mobility Management Entity (MME), the Serving Gateway (S‐GW) and the Packet Data Network
Gateway (P‐GW). The E‐UTRAN, consisting of only eNBs, is responsible for management of radio access
and provides user and control plane support to the User Equipments (UEs). Some of these connection
management functions include handover, service establishment, resource control, etc.
Figure 8.1. LTE system architecture.
The following protocols are used in user plane transmission ‐ Packet Data Convergence Protocol (PDCP),
Radio Link Control (RLC), Medium Access Control (MAC), and Physical layer (PHY). The PDCP is
responsible for header compression and decompression, security functions such as ciphering and
deciphering, and transfer of user protocol data units to the RLC. The RLC sub layer will perform
segmentation and reassembly, Hybrid Automatic Request (HARQ) error correction, and delivery of the
user protocol data units to the MAC via appropriate logical channels. The MAC is responsible for
mapping between logical and transport channels, scheduling of data, HARQ, priority handling, and
multiplexing/de‐multiplexing of MAC service data units. At the PHY, the transport channels are mapped
into physical channels for transmission over the air interface. The PHY is responsible for Cyclic
Redundancy Check (CRC) insertion, channel coding, HARQ processing, scrambling, modulation, link
adaptation, power control, and resource mapping.
8.1.1 Downlink
The LTE downlink air‐interface uses Orthogonal Frequency Division Multiple Access (OFDMA) multiple
access technique which can provide high spectral efficiency, orthogonality among intra‐cell users, and
support for frequency domain techniques such as frequency selective scheduling, single frequency
IWPCUltraHighCapacityNetworksWhitePaperVersion1.1 Page44
Do Not Copy or Distribute to ANY third party without prior written permission from IWPC © 2014, IWPC, TEL: +1‐215‐293‐9000, [email protected]
network and soft fractional frequency reuse. The following downlink physical layer channels are
supported ‐
Physical Downlink Shared Channel (PDSCH) carries unicast data traffic and common messages
such as paging, System Information Blocks, and random access response.
Physical Broadcast Channel (PBCH) carries the Master Information Block required for system
access.
Physical Multicast Channel (PMCH) carries multicast and broadcast data traffic.
Physical Control Format Indicator Channel (PCFICH) carries indication of the size of the control
portion for each subframe.
Physical Downlink Control Channel (PDCCH) carries scheduling and power control information
for both downlink and uplink.
Physical Hybrid ARQ Indicator Channel (PHICH) carries HARQ‐ACK information corresponding to
uplink transmission.
In addition to the channels, physical‐layer signals are also supported. They include –
Primary and Secondary synchronization signals used for cell acquisition, detection of frame
timing, and handover purposes.
Cell‐specific reference signal used for demodulation of downlink channels, for estimating
channel quality, and also for handoff measurements.
UE‐specific dedicated reference signals used for demodulation of downlink channels.
8.1.2 Uplink
The LTE uplink air‐interface uses Single‐Carrier Frequency Division Multiple Access (SC‐FDMA)
transmission scheme. SC‐FDMA can provide similar advantages to OFDM such as orthogonality among
users and robustness to multipath. However, it has much lower peak‐to‐average power ratio and
sensitivity to the UE amplifier’s “cubic metric”. This allows for maintaining a low power amplifier back‐
off or de‐rating requirement which translates into higher coverage in the uplink. The following downlink
physical layer channels are supported ‐
Physical Uplink Shared Channel (PUSCH) carries data traffic and is assigned to users via the
uplink scheduling assignment.
Physical Uplink Control Channel (PUCCH) carries three types of control signalling – ACK/NACK for
downlink transmission, scheduling request indicator and feedback of downlink channel
information including channel quality indicator, precoding matrix indicator, and rank indicator.
Physical Random Access Channel (PRACH) carries the random access channel used to request
initial access, initiate handoff procedure, and transition from idle to connected state.
In addition to the channels, physical‐layer signals are also supported. They include –
Demodulation reference signal used for demodulation of data and control information.
IWPCUltraHighCapacityNetworksWhitePaperVersion1.1 Page45
Do Not Copy or Distribute to ANY third party without prior written permission from IWPC © 2014, IWPC, TEL: +1‐215‐293‐9000, [email protected]
Sounding reference signal used for sounding of the uplink channel response.
8.2 LTE‐AdvancedTechnology
In addition to features introduced in the first LTE release, advanced features are continuously being
added into LTE. As of Rel‐11, the following advanced features are supported ‐
Carrier aggregation to enable the system to support aggregated bandwidth of up to 100 MHz: This
allows LTE‐A target peak target data rates of 3 Gbps in the downlink and can also be used by operators
to aggregate non‐adjacent frequency bands. In addition to the individual increased peak data rates,
carrier aggregation also allows advanced features such as multi‐carrier scheduling, load balancing,
quality‐of‐service differentiation, interference coordination, and heterogeneous deployment to be used
to further increase the spectral efficiency of the system. Carrier Aggregation is also enabling operators
to use unpaired spectrum such as the lower 700 MHz D and E blocks (band 29) for downlink only
operation. This supplemental downlink addresses the fact that there tends to be much more downlink
than uplink traffic, and makes use of previously “stranded” spectrum.
Heterogeneous network and small cell support to provide network densification: Heterogeneous
networks consist of a traditional macro‐cell based network augmented with various types of low power
network nodes that address the capacity and coverage challenges resulting from the growth of data
services. To efficiently support small cells, various intercell interference co‐ordination techniques have
been developed.
Coordinated multi‐point transmission (CoMP) to enable cooperation among eNBs to determine the
scheduling, transmission parameters and transmit antenna weights for a particular UE: This cooperation
will depend on a high capacity backhaul link between eNBs. Closed loop beamforming or precoding
based transmissions will be supported in CoMP. Similar to multi‐point transmission, multi‐point
reception is also supported. In this case, transmission from the UE is received at multiple points and
combined to provide gain.
Multi‐antenna transmission at the UE where up to four power amplifiers and RF transmitter chains will
be supported: This allows for MIMO transmission by the UE to increase peak data rate for stronger
SINR’s.
8.3 Overviewof4GBackhaulTechnology
The backhaul for small cells is currently seen as a major challenge for 4G small cell deployments. As the
number of cell sites multiply to keep with capacity demand, so can the cost of the operator’s backhaul
network. While fiber is widely used for macro‐cell backhaul, many operators are suggesting that the
high cost of fiber installation and leasing fees will kill the small cell business case. Instead, operators are
estimating that 80% of the small cells will be connected with wireless backhaul (70). This leads to the
technological challenge of finding wireless solutions that provide enough spectrum in a cost effective
manner, and that can sustain the expected continued growth in capacity.
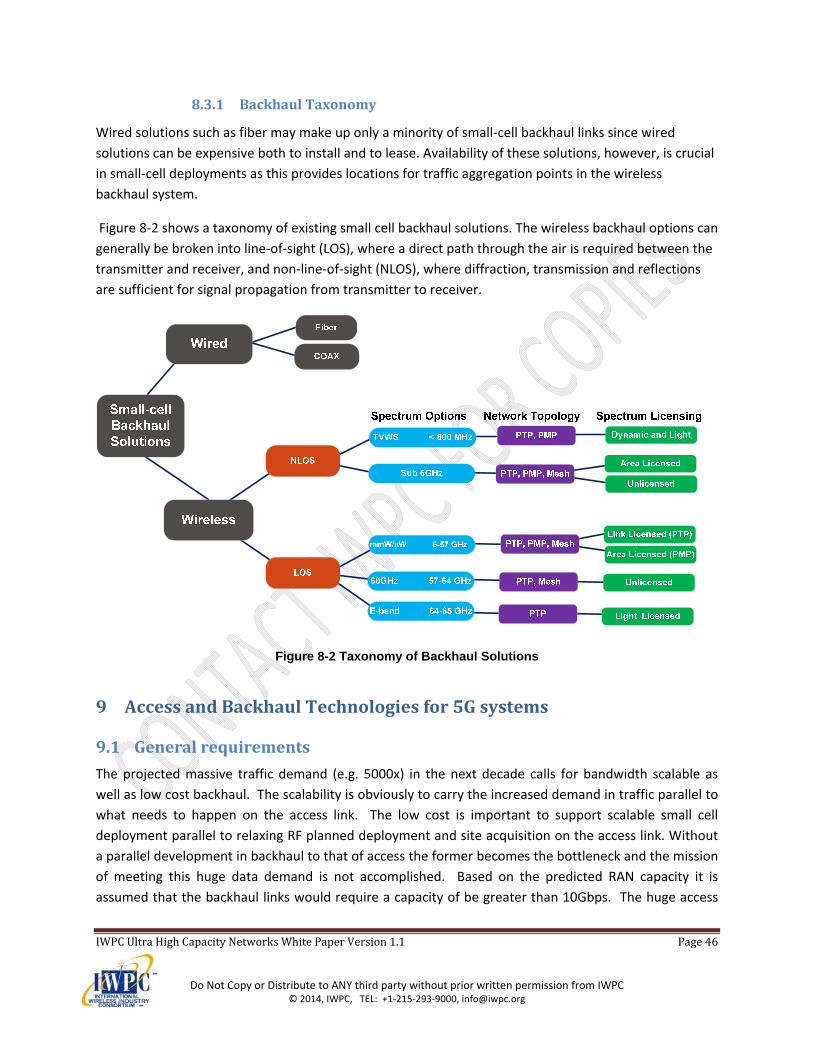
IWPCUltraHighCapacityNetworksWhitePaperVersion1.1 Page46
Do Not Copy or Distribute to ANY third party without prior written permission from IWPC © 2014, IWPC, TEL: +1‐215‐293‐9000, [email protected]
8.3.1 BackhaulTaxonomy
Wired solutions such as fiber may make up only a minority of small‐cell backhaul links since wired
solutions can be expensive both to install and to lease. Availability of these solutions, however, is crucial
in small‐cell deployments as this provides locations for traffic aggregation points in the wireless
backhaul system.
Figure 8‐2 shows a taxonomy of existing small cell backhaul solutions. The wireless backhaul options can
generally be broken into line‐of‐sight (LOS), where a direct path through the air is required between the
transmitter and receiver, and non‐line‐of‐sight (NLOS), where diffraction, transmission and reflections
are sufficient for signal propagation from transmitter to receiver.
Figure 8-2 Taxonomy of Backhaul Solutions
9 AccessandBackhaulTechnologiesfor5Gsystems
9.1 Generalrequirements
The projected massive traffic demand (e.g. 5000x) in the next decade calls for bandwidth scalable as
well as low cost backhaul. The scalability is obviously to carry the increased demand in traffic parallel to
what needs to happen on the access link. The low cost is important to support scalable small cell
deployment parallel to relaxing RF planned deployment and site acquisition on the access link. Without
a parallel development in backhaul to that of access the former becomes the bottleneck and the mission
of meeting this huge data demand is not accomplished. Based on the predicted RAN capacity it is
assumed that the backhaul links would require a capacity of be greater than 10Gbps. The huge access
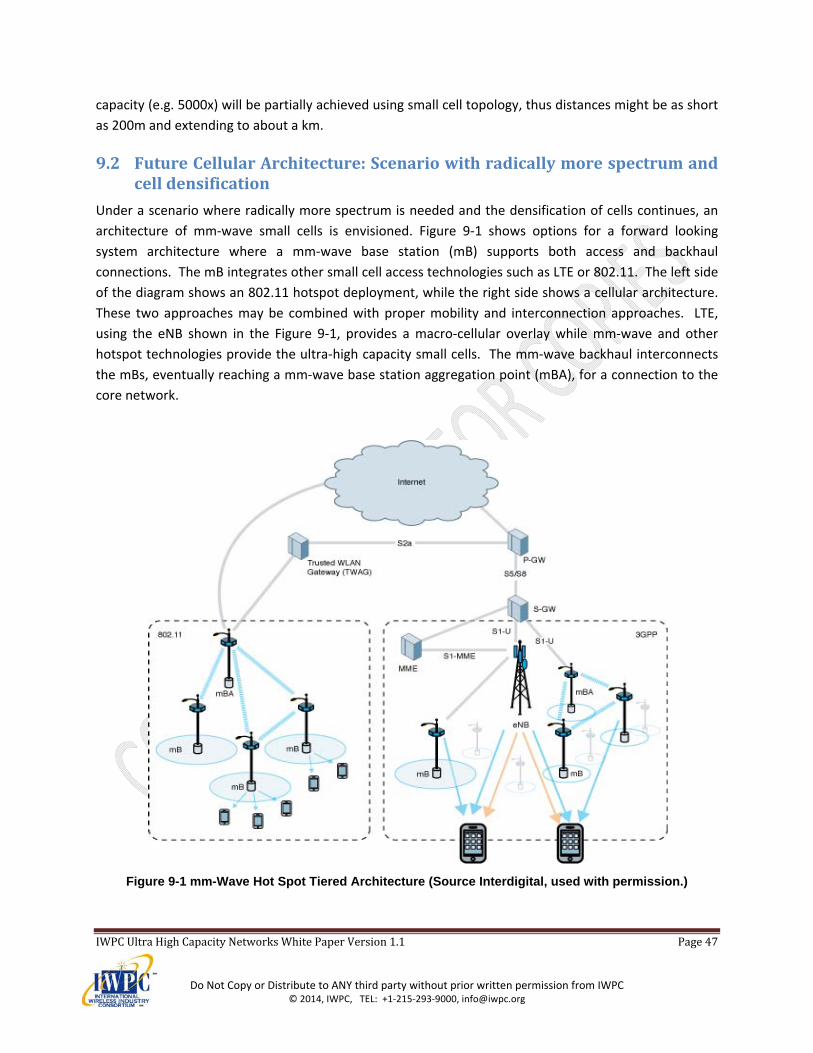
IWPCUltraHighCapacityNetworksWhitePaperVersion1.1 Page47
Do Not Copy or Distribute to ANY third party without prior written permission from IWPC © 2014, IWPC, TEL: +1‐215‐293‐9000, [email protected]
capacity (e.g. 5000x) will be partially achieved using small cell topology, thus distances might be as short
as 200m and extending to about a km.
9.2 FutureCellularArchitecture:Scenariowithradicallymorespectrumandcelldensification
Under a scenario where radically more spectrum is needed and the densification of cells continues, an
architecture of mm‐wave small cells is envisioned. Figure 9‐1 shows options for a forward looking
system architecture where a mm‐wave base station (mB) supports both access and backhaul
connections. The mB integrates other small cell access technologies such as LTE or 802.11. The left side
of the diagram shows an 802.11 hotspot deployment, while the right side shows a cellular architecture.
These two approaches may be combined with proper mobility and interconnection approaches. LTE,
using the eNB shown in the Figure 9‐1, provides a macro‐cellular overlay while mm‐wave and other
hotspot technologies provide the ultra‐high capacity small cells. The mm‐wave backhaul interconnects
the mBs, eventually reaching a mm‐wave base station aggregation point (mBA), for a connection to the
core network.
Figure 9-1 mm-Wave Hot Spot Tiered Architecture (Source Interdigital, used with permission.)
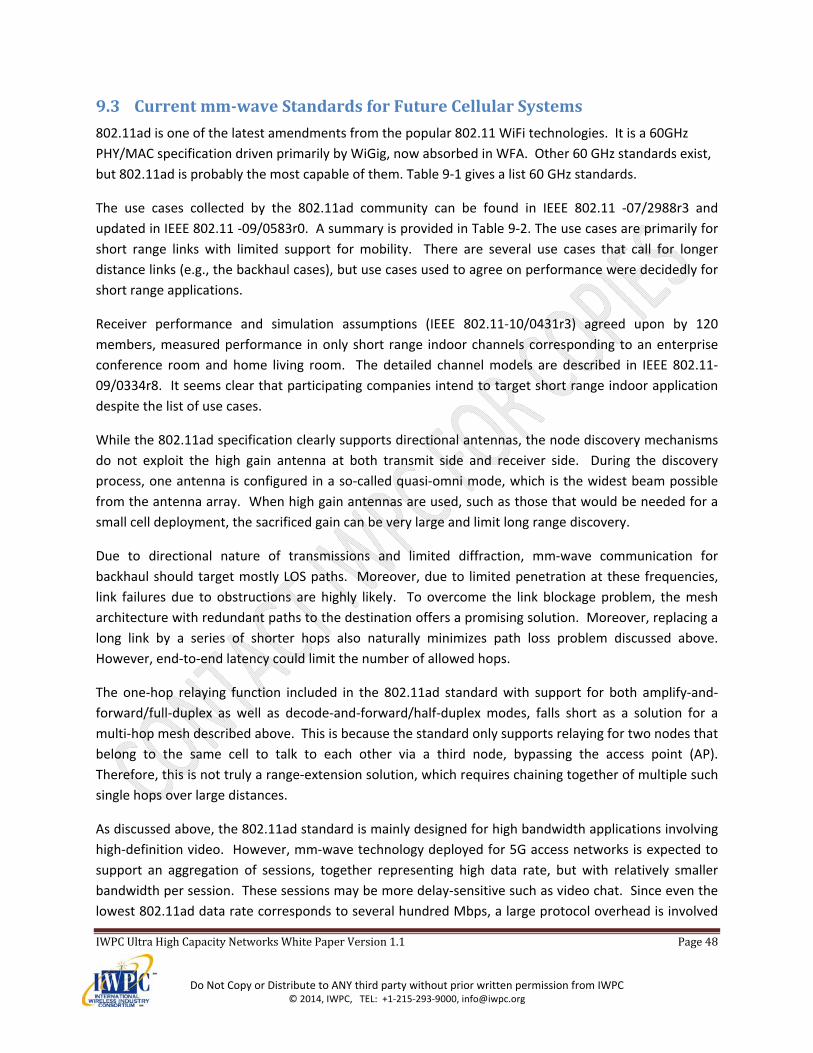
IWPCUltraHighCapacityNetworksWhitePaperVersion1.1 Page48
Do Not Copy or Distribute to ANY third party without prior written permission from IWPC © 2014, IWPC, TEL: +1‐215‐293‐9000, [email protected]
9.3 Currentmm‐waveStandardsforFutureCellularSystems
802.11ad is one of the latest amendments from the popular 802.11 WiFi technologies. It is a 60GHz
PHY/MAC specification driven primarily by WiGig, now absorbed in WFA. Other 60 GHz standards exist,
but 802.11ad is probably the most capable of them. Table 9‐1 gives a list 60 GHz standards.
The use cases collected by the 802.11ad community can be found in IEEE 802.11 ‐07/2988r3 and
updated in IEEE 802.11 ‐09/0583r0. A summary is provided in Table 9‐2. The use cases are primarily for
short range links with limited support for mobility. There are several use cases that call for longer
distance links (e.g., the backhaul cases), but use cases used to agree on performance were decidedly for
short range applications.
Receiver performance and simulation assumptions (IEEE 802.11‐10/0431r3) agreed upon by 120
members, measured performance in only short range indoor channels corresponding to an enterprise
conference room and home living room. The detailed channel models are described in IEEE 802.11‐
09/0334r8. It seems clear that participating companies intend to target short range indoor application
despite the list of use cases.
While the 802.11ad specification clearly supports directional antennas, the node discovery mechanisms
do not exploit the high gain antenna at both transmit side and receiver side. During the discovery
process, one antenna is configured in a so‐called quasi‐omni mode, which is the widest beam possible
from the antenna array. When high gain antennas are used, such as those that would be needed for a
small cell deployment, the sacrificed gain can be very large and limit long range discovery.
Due to directional nature of transmissions and limited diffraction, mm‐wave communication for
backhaul should target mostly LOS paths. Moreover, due to limited penetration at these frequencies,
link failures due to obstructions are highly likely. To overcome the link blockage problem, the mesh
architecture with redundant paths to the destination offers a promising solution. Moreover, replacing a
long link by a series of shorter hops also naturally minimizes path loss problem discussed above.
However, end‐to‐end latency could limit the number of allowed hops.
The one‐hop relaying function included in the 802.11ad standard with support for both amplify‐and‐
forward/full‐duplex as well as decode‐and‐forward/half‐duplex modes, falls short as a solution for a
multi‐hop mesh described above. This is because the standard only supports relaying for two nodes that
belong to the same cell to talk to each other via a third node, bypassing the access point (AP).
Therefore, this is not truly a range‐extension solution, which requires chaining together of multiple such
single hops over large distances.
As discussed above, the 802.11ad standard is mainly designed for high bandwidth applications involving
high‐definition video. However, mm‐wave technology deployed for 5G access networks is expected to
support an aggregation of sessions, together representing high data rate, but with relatively smaller
bandwidth per session. These sessions may be more delay‐sensitive such as video chat. Since even the
lowest 802.11ad data rate corresponds to several hundred Mbps, a large protocol overhead is involved
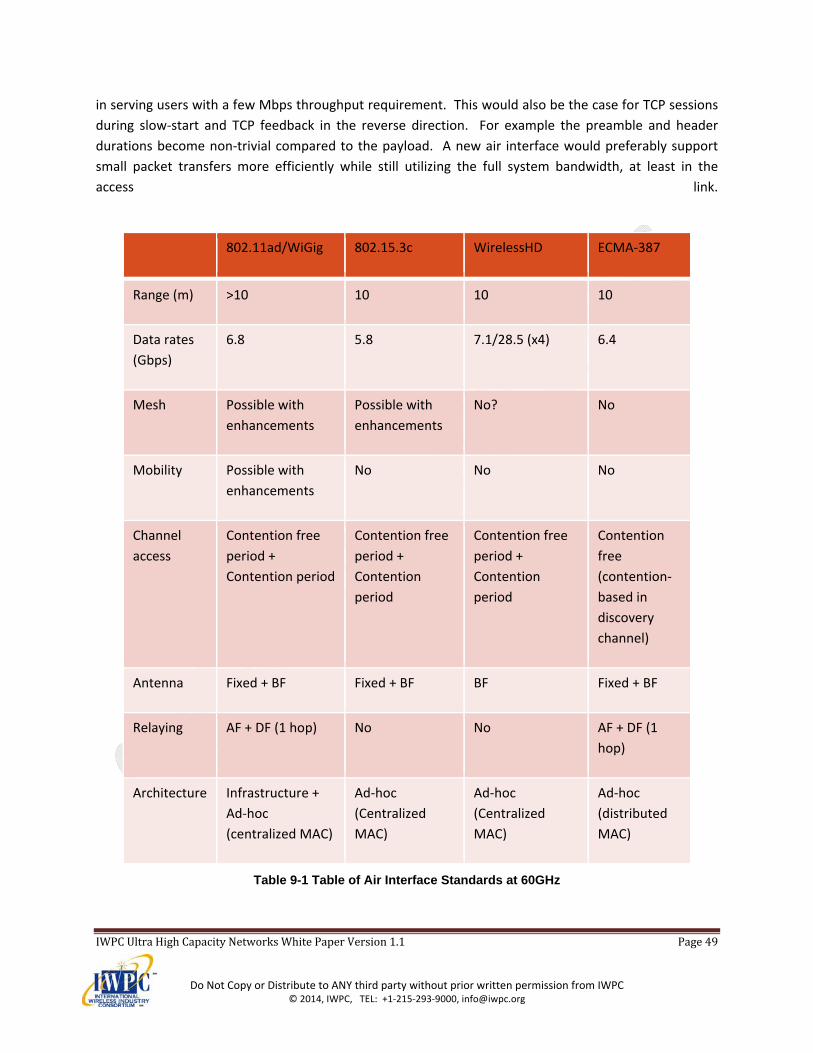
IWPCUltraHighCapacityNetworksWhitePaperVersion1.1 Page49
Do Not Copy or Distribute to ANY third party without prior written permission from IWPC © 2014, IWPC, TEL: +1‐215‐293‐9000, [email protected]
in serving users with a few Mbps throughput requirement. This would also be the case for TCP sessions
during slow‐start and TCP feedback in the reverse direction. For example the preamble and header
durations become non‐trivial compared to the payload. A new air interface would preferably support
small packet transfers more efficiently while still utilizing the full system bandwidth, at least in the
access link.
802.11ad/WiGig 802.15.3c WirelessHD ECMA‐387
Range (m) >10 10 10 10
Data rates
(Gbps)
6.8 5.8 7.1/28.5 (x4) 6.4
Mesh Possible with
enhancements
Possible with
enhancements
No? No
Mobility Possible with
enhancements
No No No
Channel
access
Contention free
period +
Contention period
Contention free
period +
Contention
period
Contention free
period +
Contention
period
Contention
free
(contention‐
based in
discovery
channel)
Antenna Fixed + BF Fixed + BF BF Fixed + BF
Relaying AF + DF (1 hop) No No AF + DF (1
hop)
Architecture Infrastructure +
Ad‐hoc
(centralized MAC)
Ad‐hoc
(Centralized
MAC)
Ad‐hoc
(Centralized
MAC)
Ad‐hoc
(distributed
MAC)
Table 9-1 Table of Air Interface Standards at 60GHz
IWPCUltraHighCapacityNetworksWhitePaperVersion1.1 Page50
Do Not Copy or Distribute to ANY third party without prior written permission from IWPC © 2014, IWPC, TEL: +1‐215‐293‐9000, [email protected]
Table 9-2 802.11AD use cases
9.3.1 802.11adforBackhaul
While the 802.11ad speciation clearly supports directional antennas, the node discovery mechanisms do
not exploit the high gain antenna at both transmit side and receiver side. During the discovery process,
one antenna is configured in a so‐called quasi‐omni mode, which is the widest beam possible from the
antenna array. When high gain antennas are used, such as those that would be needed for a small cell
deployment, the sacrificed gain can be very large and limit long range discovery.
Due to directional nature of transmissions and limited diffraction, mm‐wave communication for
backhaul should target mostly LOS paths. Moreover, due to limited penetration at these frequencies,
link failures due to obstructions are highly likely. To overcome the link blockage problem, the mesh
architecture with redundant paths to the destination offers a promising solution. Moreover, replacing a
long link by a series of shorter hops also naturally minimizes path loss problem discussed above.
However, end‐to‐end latency could limit the number of allowed hops.
The one‐hop relaying function included in the 802.11ad standard with support for both amplify‐and‐
forward/full‐duplex as well as decode‐and‐forward/half‐duplex modes, falls short as a solution for a
multi‐hop mesh described above. This is because the standard only supports relaying for two nodes that
belong to the same cell to talk to each other via a third node, bypassing the access point (AP).
Therefore, this is not truly a range‐extension solution, which requires chaining together of multiple such
single hops over large distances.
Category # Usage Model
1. Wireless Display 1a Desktop Storage & Display1b Projection to TV or Projector in Conf Rom1c In room Gaming1d Streaming from Camcorder to Display1e Broadcast TV Field Pick Up1f Medical Imaging Surgical Procedure Support
2. Distribution of HDTV 2a Lightly compressed video streaming around home2b Compr. video streaming in a room / t.o. home2c Intra Large Vehicle (e.g. airplane) Applications2d Wireless Networking for Small Office2e Remote medical assistance
3. Rapid Upload / Download 3a Rapid Sync-n-Go file transfer3b Picture by Picture viewing3c Airplane docking3d Movie Content Download to car3e Police / Surveillance Car Upload
4. Backhaul 4a Multi-Media Mesh backhaul4b Point to Point backhaul
5. Outdoor Campus / Auditorium 5a Video demos / telepresence in Auditorium5b Public Safety Mesh
6. Manufacturing Floor 6a Manufacturing floor automation
IWPCUltraHighCapacityNetworksWhitePaperVersion1.1 Page51
Do Not Copy or Distribute to ANY third party without prior written permission from IWPC © 2014, IWPC, TEL: +1‐215‐293‐9000, [email protected]
9.4 Overviewof5Gmm‐waveAccessTechnology
As discussed above, the 802.11ad standard is mainly designed for high bandwidth applications involving
high‐definition video. However, mm‐wave technology deployed for 5G access networks is expected to
support greater than 10 Gbps of peak rate and more than 100 Mbps of cell edge rate for new high date
rate applications with less than 1 ms latency. A new air interface needs to be designed to suit the
propagation conditions at mm‐wave bands and to satisfy the 5G requirements as shown in Table 5‐2.
This section describes key technology components for consideration for evolving mm‐wave access links
for 5G. Additionally a sample link budget is provided.
9.4.1 WaveformSelection
The mm‐wave access link waveform can be selected among single carrier solutions such as Cyclic
Prefixed Single Carrier (CP‐SC) and its variants or multi‐carrier solutions such as OFDM, SC‐OFDM and
MC‐CDMA. The Peak to Average Power Ratio (PAPR) performance, sensitivity to transmitter non‐
linearity and other RF impairments, performance with different receiver types, system overhead,
resource channelization, multiple access scheme and implementation complexity of each candidate
ought to be taken into account with the help of simulations based on accurate mm‐wave channel and
antenna modeling.
A single carrier solution can have similar performance, efficiency and low signal processing complexity as
an OFDM solution, yet has better PAPR performance and is less sensitive to RF impairments such as
phase noise and power amplifier nonlinearities. Because of the high directivity of the mm‐wave
transmission, the mm‐wave channel is relatively flat and the equalization of a single carrier solution may
be simpler than what is required for a highly frequency‐selective channel. The PAPR performance is very
desirable in mm‐wave frequency band because it enables reuse of low cost PAs.
A variant of CP‐SC modulation, called null CP‐SC (NCP‐SC) (71), offers some additional benefits over
regular CP‐SC. In NCP‐SC the regular CP is replaced by null symbols where null symbols are appended at
the end of a group of symbols. At the receiver an FFT is applied to the group of data symbols plus the
null symbols (a symbol block for NCP‐SC is the group of data symbols plus the null symbols) to enable
frequency‐domain equalization. Note that the null symbols in one block of symbols are the null prefix
for the block of symbols. The first additional advantage of NCP‐SC over a regular CP method (OFDM
included) is that the null portion enables a built‐in guard period for switching of RF beams without
destroying the CP property. The second advantage is that since the NCP‐SC symbol block includes the
group of data symbols plus the null symbols (i.e., the CP), the CP size can be dynamically changed (e.g.,
per‐user) without changing the over‐all numerology (e.g., the number of symbol blocks per frame).
Finally, the NCP gives a portion of signal without desired signal energy for easy estimation of noise
and/or interference. Another variant similar to NC‐SC is called zero tailed OFDM (ZT‐OFDM) described in
(72). ZT‐OFDM modulation allows the cyclic prefix (CP) adapt to the propagation environment of the
channel. Both NCP‐SC and ZT‐OFDM have low PAPR compared to OFDM and have the same BLER
performance as an OFDM signal.
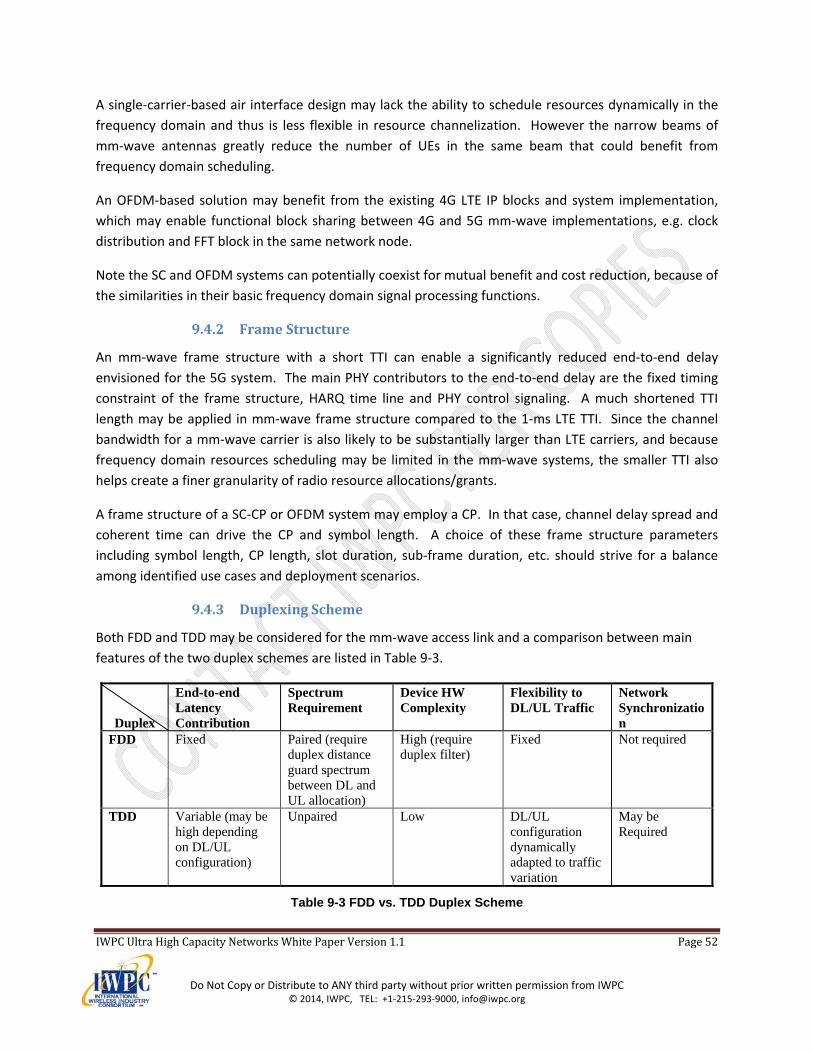
IWPCUltraHighCapacityNetworksWhitePaperVersion1.1 Page52
Do Not Copy or Distribute to ANY third party without prior written permission from IWPC © 2014, IWPC, TEL: +1‐215‐293‐9000, [email protected]
A single‐carrier‐based air interface design may lack the ability to schedule resources dynamically in the
frequency domain and thus is less flexible in resource channelization. However the narrow beams of
mm‐wave antennas greatly reduce the number of UEs in the same beam that could benefit from
frequency domain scheduling.
An OFDM‐based solution may benefit from the existing 4G LTE IP blocks and system implementation,
which may enable functional block sharing between 4G and 5G mm‐wave implementations, e.g. clock
distribution and FFT block in the same network node.
Note the SC and OFDM systems can potentially coexist for mutual benefit and cost reduction, because of
the similarities in their basic frequency domain signal processing functions.
9.4.2 FrameStructure
An mm‐wave frame structure with a short TTI can enable a significantly reduced end‐to‐end delay
envisioned for the 5G system. The main PHY contributors to the end‐to‐end delay are the fixed timing
constraint of the frame structure, HARQ time line and PHY control signaling. A much shortened TTI
length may be applied in mm‐wave frame structure compared to the 1‐ms LTE TTI. Since the channel
bandwidth for a mm‐wave carrier is also likely to be substantially larger than LTE carriers, and because
frequency domain resources scheduling may be limited in the mm‐wave systems, the smaller TTI also
helps create a finer granularity of radio resource allocations/grants.
A frame structure of a SC‐CP or OFDM system may employ a CP. In that case, channel delay spread and
coherent time can drive the CP and symbol length. A choice of these frame structure parameters
including symbol length, CP length, slot duration, sub‐frame duration, etc. should strive for a balance
among identified use cases and deployment scenarios.
9.4.3 DuplexingScheme
Both FDD and TDD may be considered for the mm‐wave access link and a comparison between main
features of the two duplex schemes are listed in Table 9‐3.
Duplex
End-to-end Latency Contribution
Spectrum Requirement
Device HW Complexity
Flexibility to DL/UL Traffic
Network Synchronization
FDD Fixed Paired (require duplex distance guard spectrum between DL and UL allocation)
High (require duplex filter)
Fixed Not required
TDD Variable (may be high depending on DL/UL configuration)
Unpaired Low DL/UL configuration dynamically adapted to traffic variation
May be Required
Table 9-3 FDD vs. TDD Duplex Scheme
IWPCUltraHighCapacityNetworksWhitePaperVersion1.1 Page53
Do Not Copy or Distribute to ANY third party without prior written permission from IWPC © 2014, IWPC, TEL: +1‐215‐293‐9000, [email protected]
The synchronization of 4G TDD network may not be critical to the mm‐wave TDD network due to the
narrow beam transmission. The directivity of the transmission may remove potential interferences due
to the timing offset between cells. This can be considered as a form of SDD that is realized by the mm‐
wave narrow beams. This SDD may be applied in combination with the FDD or TDD schemes. Also note
that the TDD DL/UL configuration may not need to be coordinated across the network when highly
directional beams are used.
9.4.4 MultipleAccess
The mm‐wave access link multiple access may depend on the antenna array capability. With the
assumption that each eNB antenna can form a single beam at a time, it can be further considered how
radio resources may be partitioned (or even reused) with a Transmission Time Interval (TTI). If a beam is
wide enough that a substantial number of UE may be covered by the beam, then it is possible to
consider FDMA within the TTI.
FDMA and TDMA may be applied for multiple UEs that are scheduled in one eNB downlink or uplink
antenna beam. In FDMA the devices can be assigned with different frequency resource allocation and
operate simultaneously – likely implying OFDMA. TDMA can also be considered wherein the devices can
be assigned with all frequency resource allocated in the eNB antenna beam, but operate only in a
fraction of the TTI (e.g., certain slots within a subframe). The beams could potentially also be refined for
the exact AoA/AoD used by the eNB and UE in each such slot. If there is only one UE operating the
beam at a time, the frequency domain scheduling capability of OFDM goes unused and reduces the
motivation for OFDM, thus making SC waveforms worth consideration.
If more advanced antenna are considered, SDMA is another option and can be combined with FDMA.
SDMA offers the advantage that multiple links from a single antenna may operate simultaneously and
on the same frequency given that spatially separated UEs can be paired. The ability to pair UEs can be
enhanced with interference mitigation receivers or MU‐MIMO techniques to remove interferences.
Combining SDMA and FDMA permits paring of UEs even in the case that there are not spatially
separable and do not employ interference mitigation techniques. When such UEs are not separable,
they simply given different frequency resources and each has an eNB beam adapted to it. The cost of
course is that the radio resources are not reused.
9.4.5 LinkBudget
An example link budget for a mm‐wave downlink is given in Table 9‐4.
The mm‐wave eNB is assumed to have a large antenna array, e.g. a ~100 element PAA could provide
~25dBi gain, with an area of about <10cm2 at 60GHz. If the same area constraint is kept, lower
frequency PAAs will have a smaller number of elements and thus lower gain. With this assumption, the
total antenna gain spans from 18 dBi at low mm‐wave frequencies (28 GHz) to 26 dB at high mm‐wave
frequencies (72 GHz). A reasonably large bandwidth of 500 MHz is selected for comparison purpose. An
additional loss of 20 dB is added to the NLOS case to account for the blocking of the LOS path. Actual
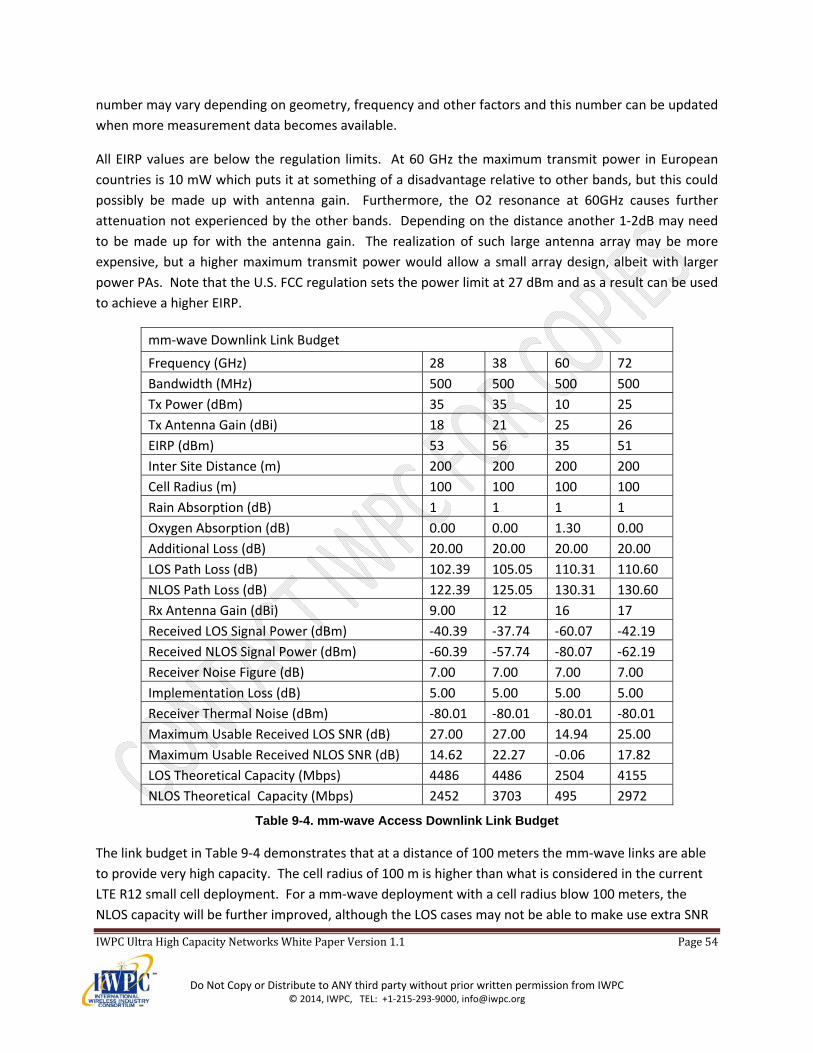
IWPCUltraHighCapacityNetworksWhitePaperVersion1.1 Page54
Do Not Copy or Distribute to ANY third party without prior written permission from IWPC © 2014, IWPC, TEL: +1‐215‐293‐9000, [email protected]
number may vary depending on geometry, frequency and other factors and this number can be updated
when more measurement data becomes available.
All EIRP values are below the regulation limits. At 60 GHz the maximum transmit power in European
countries is 10 mW which puts it at something of a disadvantage relative to other bands, but this could
possibly be made up with antenna gain. Furthermore, the O2 resonance at 60GHz causes further
attenuation not experienced by the other bands. Depending on the distance another 1‐2dB may need
to be made up for with the antenna gain. The realization of such large antenna array may be more
expensive, but a higher maximum transmit power would allow a small array design, albeit with larger
power PAs. Note that the U.S. FCC regulation sets the power limit at 27 dBm and as a result can be used
to achieve a higher EIRP.
mm‐wave Downlink Link Budget
Frequency (GHz) 28 38 60 72
Bandwidth (MHz) 500 500 500 500
Tx Power (dBm) 35 35 10 25
Tx Antenna Gain (dBi) 18 21 25 26
EIRP (dBm) 53 56 35 51
Inter Site Distance (m) 200 200 200 200
Cell Radius (m) 100 100 100 100
Rain Absorption (dB) 1 1 1 1
Oxygen Absorption (dB) 0.00 0.00 1.30 0.00
Additional Loss (dB) 20.00 20.00 20.00 20.00
LOS Path Loss (dB) 102.39 105.05 110.31 110.60
NLOS Path Loss (dB) 122.39 125.05 130.31 130.60
Rx Antenna Gain (dBi) 9.00 12 16 17
Received LOS Signal Power (dBm) ‐40.39 ‐37.74 ‐60.07 ‐42.19
Received NLOS Signal Power (dBm) ‐60.39 ‐57.74 ‐80.07 ‐62.19
Receiver Noise Figure (dB) 7.00 7.00 7.00 7.00
Implementation Loss (dB) 5.00 5.00 5.00 5.00
Receiver Thermal Noise (dBm) ‐80.01 ‐80.01 ‐80.01 ‐80.01
Maximum Usable Received LOS SNR (dB) 27.00 27.00 14.94 25.00
Maximum Usable Received NLOS SNR (dB) 14.62 22.27 ‐0.06 17.82
LOS Theoretical Capacity (Mbps) 4486 4486 2504 4155
NLOS Theoretical Capacity (Mbps) 2452 3703 495 2972
Table 9-4. mm-wave Access Downlink Link Budget
The link budget in Table 9‐4 demonstrates that at a distance of 100 meters the mm‐wave links are able
to provide very high capacity. The cell radius of 100 m is higher than what is considered in the current
LTE R12 small cell deployment. For a mm‐wave deployment with a cell radius blow 100 meters, the
NLOS capacity will be further improved, although the LOS cases may not be able to make use extra SNR
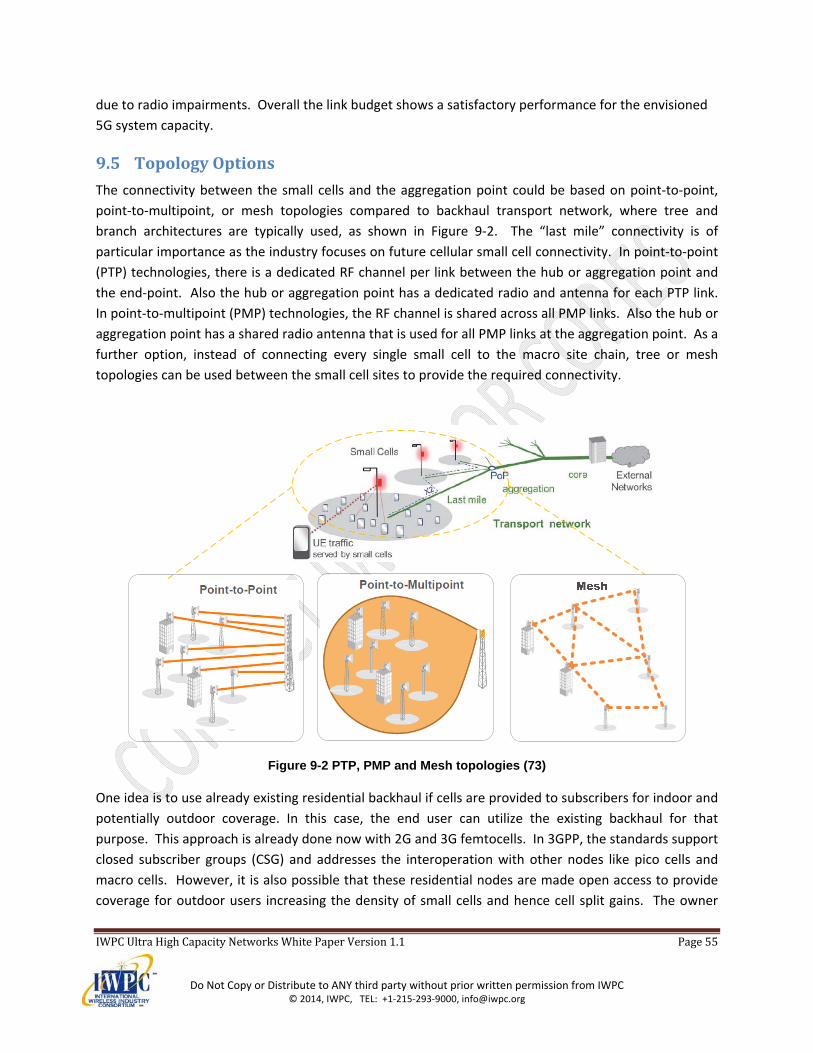
IWPCUltraHighCapacityNetworksWhitePaperVersion1.1 Page55
Do Not Copy or Distribute to ANY third party without prior written permission from IWPC © 2014, IWPC, TEL: +1‐215‐293‐9000, [email protected]
due to radio impairments. Overall the link budget shows a satisfactory performance for the envisioned
5G system capacity.
9.5 TopologyOptions
The connectivity between the small cells and the aggregation point could be based on point‐to‐point,
point‐to‐multipoint, or mesh topologies compared to backhaul transport network, where tree and
branch architectures are typically used, as shown in Figure 9‐2. The “last mile” connectivity is of
particular importance as the industry focuses on future cellular small cell connectivity. In point‐to‐point
(PTP) technologies, there is a dedicated RF channel per link between the hub or aggregation point and
the end‐point. Also the hub or aggregation point has a dedicated radio and antenna for each PTP link.
In point‐to‐multipoint (PMP) technologies, the RF channel is shared across all PMP links. Also the hub or
aggregation point has a shared radio antenna that is used for all PMP links at the aggregation point. As a
further option, instead of connecting every single small cell to the macro site chain, tree or mesh
topologies can be used between the small cell sites to provide the required connectivity.
Figure 9-2 PTP, PMP and Mesh topologies (73)
One idea is to use already existing residential backhaul if cells are provided to subscribers for indoor and
potentially outdoor coverage. In this case, the end user can utilize the existing backhaul for that
purpose. This approach is already done now with 2G and 3G femtocells. In 3GPP, the standards support
closed subscriber groups (CSG) and addresses the interoperation with other nodes like pico cells and
macro cells. However, it is also possible that these residential nodes are made open access to provide
coverage for outdoor users increasing the density of small cells and hence cell split gains. The owner
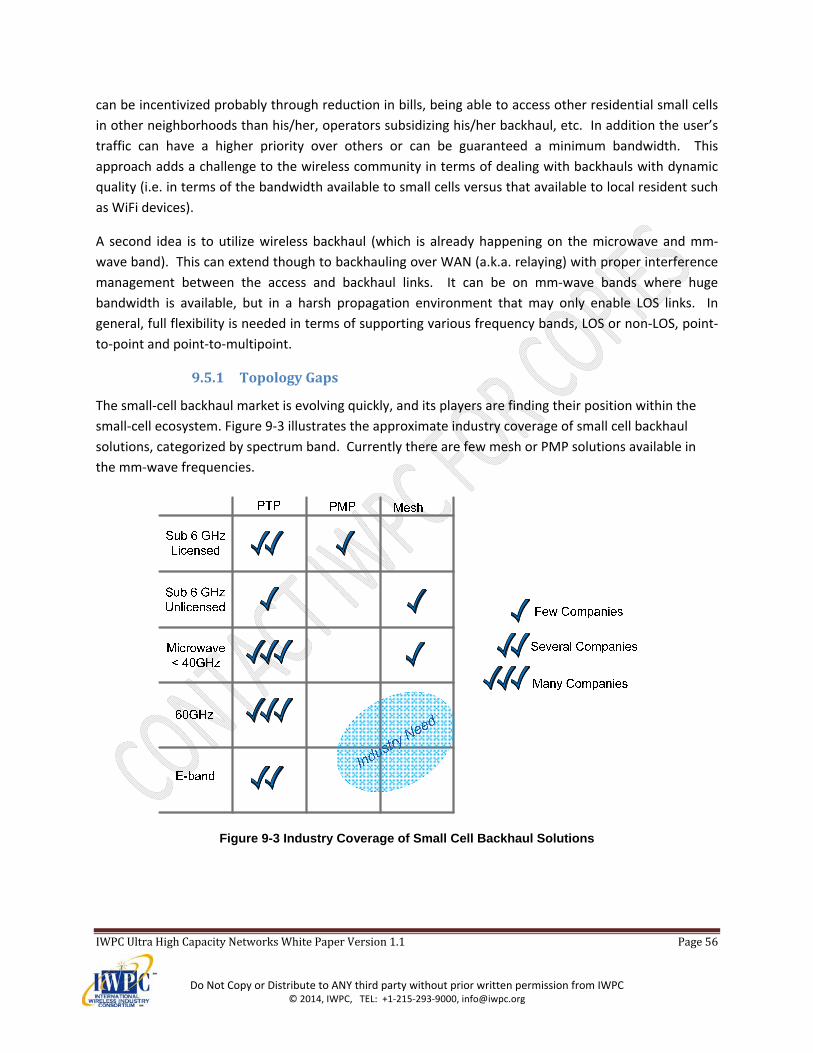
IWPCUltraHighCapacityNetworksWhitePaperVersion1.1 Page56
Do Not Copy or Distribute to ANY third party without prior written permission from IWPC © 2014, IWPC, TEL: +1‐215‐293‐9000, [email protected]
can be incentivized probably through reduction in bills, being able to access other residential small cells
in other neighborhoods than his/her, operators subsidizing his/her backhaul, etc. In addition the user’s
traffic can have a higher priority over others or can be guaranteed a minimum bandwidth. This
approach adds a challenge to the wireless community in terms of dealing with backhauls with dynamic
quality (i.e. in terms of the bandwidth available to small cells versus that available to local resident such
as WiFi devices).
A second idea is to utilize wireless backhaul (which is already happening on the microwave and mm‐
wave band). This can extend though to backhauling over WAN (a.k.a. relaying) with proper interference
management between the access and backhaul links. It can be on mm‐wave bands where huge
bandwidth is available, but in a harsh propagation environment that may only enable LOS links. In
general, full flexibility is needed in terms of supporting various frequency bands, LOS or non‐LOS, point‐
to‐point and point‐to‐multipoint.
9.5.1 TopologyGaps
The small‐cell backhaul market is evolving quickly, and its players are finding their position within the
small‐cell ecosystem. Figure 9‐3 illustrates the approximate industry coverage of small cell backhaul
solutions, categorized by spectrum band. Currently there are few mesh or PMP solutions available in
the mm‐wave frequencies.
Figure 9-3 Industry Coverage of Small Cell Backhaul Solutions
IWPCUltraHighCapacityNetworksWhitePaperVersion1.1 Page57
Do Not Copy or Distribute to ANY third party without prior written permission from IWPC © 2014, IWPC, TEL: +1‐215‐293‐9000, [email protected]
10 EnablingTechnologiesforBaseStationandUserEquipmentsfor5GSystems
In this section the base station and user equipment (UE) antenna technology required to support 5G
systems is described. Although the emphasis in this paper is primarily on millimeter wave (mm‐wave)
technology, the potential use of technology that operates in the 3‐6 GHz region is discussed, i.e. lower
microwave frequencies, since the latter could provide an intermediate step between 4G and 5G. This is
not to preclude operation between 6 and 10 GHz, but that the 3‐6 GHz region is a natural extension
beyond the operating frequencies of current cellular systems, which range from 700 MHz to 2.6 GHz.
The antenna envisioned for both the base station and UE at mm‐wave frequencies is a “large” 2D planar
phased array, where by virtue of the shorter wavelengths, practical implementations are realizable at
both ends of the links. The antenna envisioned for the base station at 3‐6 GHz is also a 2D planar
phased array, but the UE antenna is expected to be similar to what is used today for 4G, i.e. individual
antennas where the total number is typically limited to one, two, or four. The resultant system
configuration at mm‐wave frequencies will be capable of supporting lower order MIMO with beam
forming at both ends of the link, while operation at 3‐6 GHz region will be capable of supporting higher
order, Multi‐User (MU) MIMO on both the DL and UL, with the distinct possibility of just a single
antenna at the UE when operated in a Time Division Duplex (TDD) mode (74).
In what follows, the large 2D planar phased array is first discussed, where the number of antenna
elements that can be supported at various frequencies of interest for a given form factor is compared.
The signal processing associated with these 2D arrays is then discussed, which turns out to be different
for the two frequency ranges of interest. That is to say, that operation in the 3‐6 GHz region allows for
the use, in the limit, of a dedicated RF chain per antenna element, and thus, the ability to implement
fully digital (baseband) beam forming/precoding on the downlink. In contrast, the high cost and power
consumption of mixed signal and RF chains at mm‐wave frequencies requires a hybrid approach, where
processing is split between baseband and RF. Fortunately, this hybrid approach, which uses a
combination of baseband precoding/combining and analog/RF beam steering, has been shown to offer
performance approaching that of an unconstrained digital solution (75). A discussion on UE antennas
that support operation in the 3‐6 GHz region concludes this section.
10.1 2DPhasedArrayAntenna
The base station antenna envisioned for 5G for both frequency regions of interest is a “large” 2D planar
phased array, where large refers to the number of antenna elements, which will depend upon the
allowable form factor and specific frequency of operation. In addition, a 2D array is also envisioned as
the UE antenna for operation at mm‐wave frequencies, where the much shorter wavelengths support
implementations that are compatible with device form factors. Because of the limit on the number of
RF chains, the mm‐wave arrays will employ active analog phase control to support beam steering in
addition to baseband precoding. The arrays intended for 3‐6 GHz can also be operated in this hybrid
fashion, but have the additional flexibility to support a fully digital/baseband beamforming/precoding
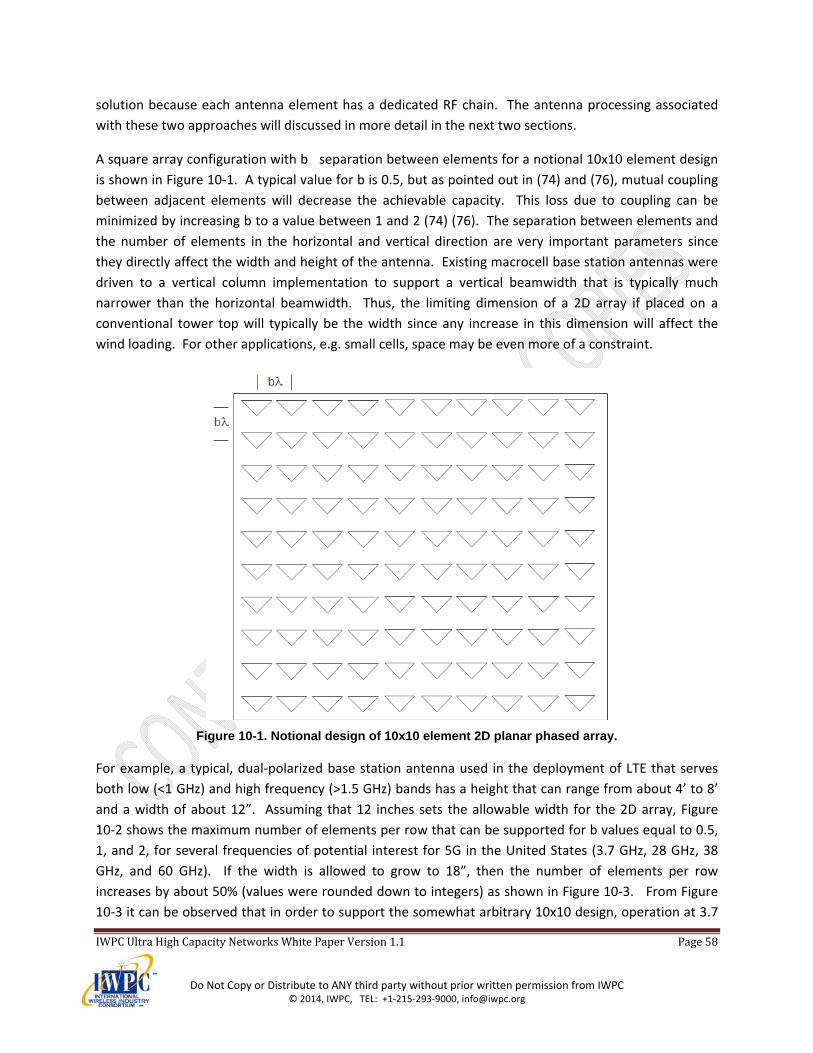
IWPCUltraHighCapacityNetworksWhitePaperVersion1.1 Page58
Do Not Copy or Distribute to ANY third party without prior written permission from IWPC © 2014, IWPC, TEL: +1‐215‐293‐9000, [email protected]
solution because each antenna element has a dedicated RF chain. The antenna processing associated
with these two approaches will discussed in more detail in the next two sections.
A square array configuration with b� separation between elements for a notional 10x10 element design
is shown in Figure 10‐1. A typical value for b is 0.5, but as pointed out in (74) and (76), mutual coupling
between adjacent elements will decrease the achievable capacity. This loss due to coupling can be
minimized by increasing b to a value between 1 and 2 (74) (76). The separation between elements and
the number of elements in the horizontal and vertical direction are very important parameters since
they directly affect the width and height of the antenna. Existing macrocell base station antennas were
driven to a vertical column implementation to support a vertical beamwidth that is typically much
narrower than the horizontal beamwidth. Thus, the limiting dimension of a 2D array if placed on a
conventional tower top will typically be the width since any increase in this dimension will affect the
wind loading. For other applications, e.g. small cells, space may be even more of a constraint.
Figure 10-1. Notional design of 10x10 element 2D planar phased array.
For example, a typical, dual‐polarized base station antenna used in the deployment of LTE that serves
both low (<1 GHz) and high frequency (>1.5 GHz) bands has a height that can range from about 4’ to 8’
and a width of about 12”. Assuming that 12 inches sets the allowable width for the 2D array, Figure
10‐2 shows the maximum number of elements per row that can be supported for b values equal to 0.5,
1, and 2, for several frequencies of potential interest for 5G in the United States (3.7 GHz, 28 GHz, 38
GHz, and 60 GHz). If the width is allowed to grow to 18”, then the number of elements per row
increases by about 50% (values were rounded down to integers) as shown in Figure 10‐3. From Figure
10‐3 it can be observed that in order to support the somewhat arbitrary 10x10 design, operation at 3.7
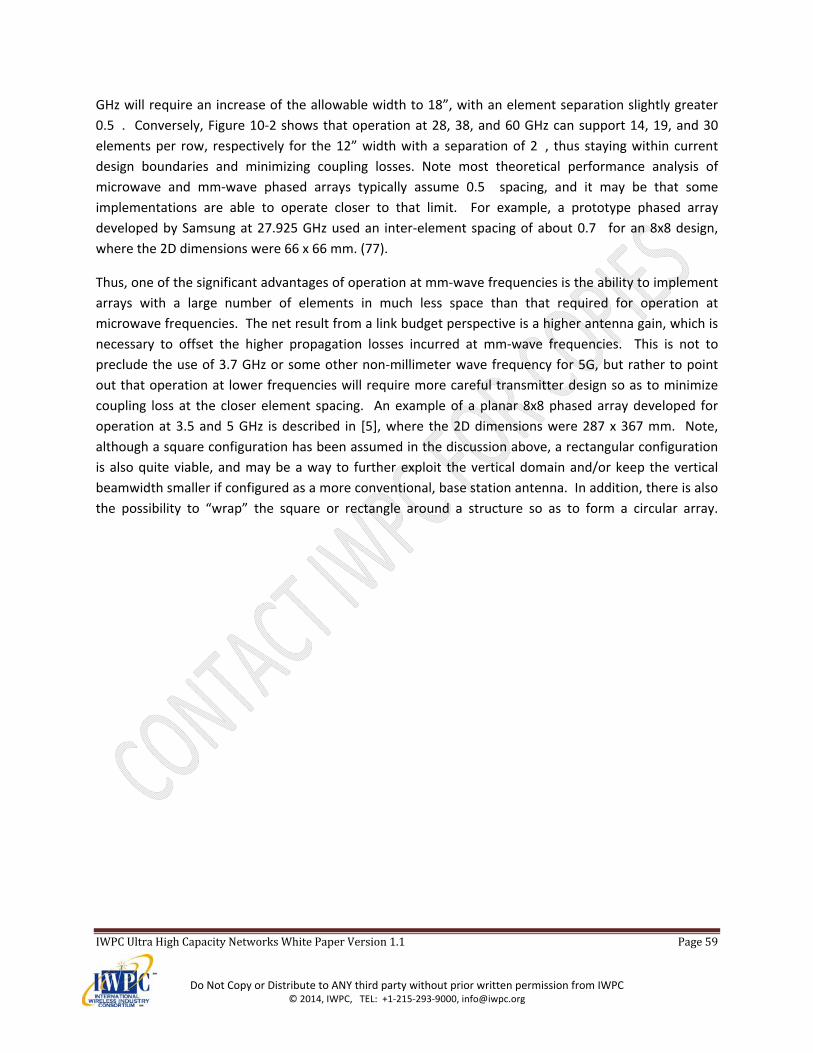
IWPCUltraHighCapacityNetworksWhitePaperVersion1.1 Page59
Do Not Copy or Distribute to ANY third party without prior written permission from IWPC © 2014, IWPC, TEL: +1‐215‐293‐9000, [email protected]
GHz will require an increase of the allowable width to 18”, with an element separation slightly greater
0.5�. Conversely, Figure 10‐2 shows that operation at 28, 38, and 60 GHz can support 14, 19, and 30
elements per row, respectively for the 12” width with a separation of 2�, thus staying within current
design boundaries and minimizing coupling losses. Note most theoretical performance analysis of
microwave and mm‐wave phased arrays typically assume 0.5� spacing, and it may be that some
implementations are able to operate closer to that limit. For example, a prototype phased array
developed by Samsung at 27.925 GHz used an inter‐element spacing of about 0.7� for an 8x8 design,
where the 2D dimensions were 66 x 66 mm. (77).
Thus, one of the significant advantages of operation at mm‐wave frequencies is the ability to implement
arrays with a large number of elements in much less space than that required for operation at
microwave frequencies. The net result from a link budget perspective is a higher antenna gain, which is
necessary to offset the higher propagation losses incurred at mm‐wave frequencies. This is not to
preclude the use of 3.7 GHz or some other non‐millimeter wave frequency for 5G, but rather to point
out that operation at lower frequencies will require more careful transmitter design so as to minimize
coupling loss at the closer element spacing. An example of a planar 8x8 phased array developed for
operation at 3.5 and 5 GHz is described in [5], where the 2D dimensions were 287 x 367 mm. Note,
although a square configuration has been assumed in the discussion above, a rectangular configuration
is also quite viable, and may be a way to further exploit the vertical domain and/or keep the vertical
beamwidth smaller if configured as a more conventional, base station antenna. In addition, there is also
the possibility to “wrap” the square or rectangle around a structure so as to form a circular array.
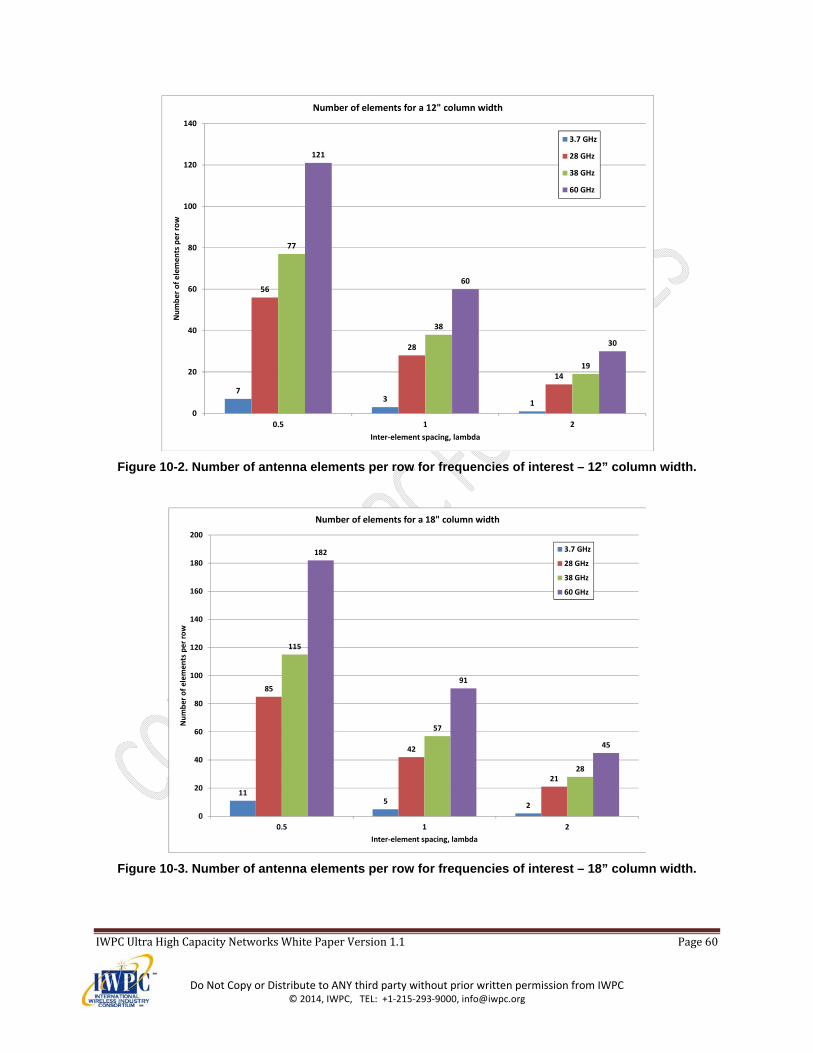
IWPCUltraHighCapacityNetworksWhitePaperVersion1.1 Page60
Do Not Copy or Distribute to ANY third party without prior written permission from IWPC © 2014, IWPC, TEL: +1‐215‐293‐9000, [email protected]
Figure 10-2. Number of antenna elements per row for frequencies of interest – 12” column width.
Figure 10-3. Number of antenna elements per row for frequencies of interest – 18” column width.
73 1
56
28
14
77
38
19
121
60
30
0
20
40
60
80
100
120
140
0.5 1 2
Number of elem
ents per row
Inter‐element spacing, lambda
Number of elements for a 12" column width
3.7 GHz
28 GHz
38 GHz
60 GHz
115
2
85
42
21
115
57
28
182
91
45
0
20
40
60
80
100
120
140
160
180
200
0.5 1 2
Number of elemen
ts per row
Inter‐element spacing, lambda
Number of elements for a 18" column width
3.7 GHz
28 GHz
38 GHz
60 GHz
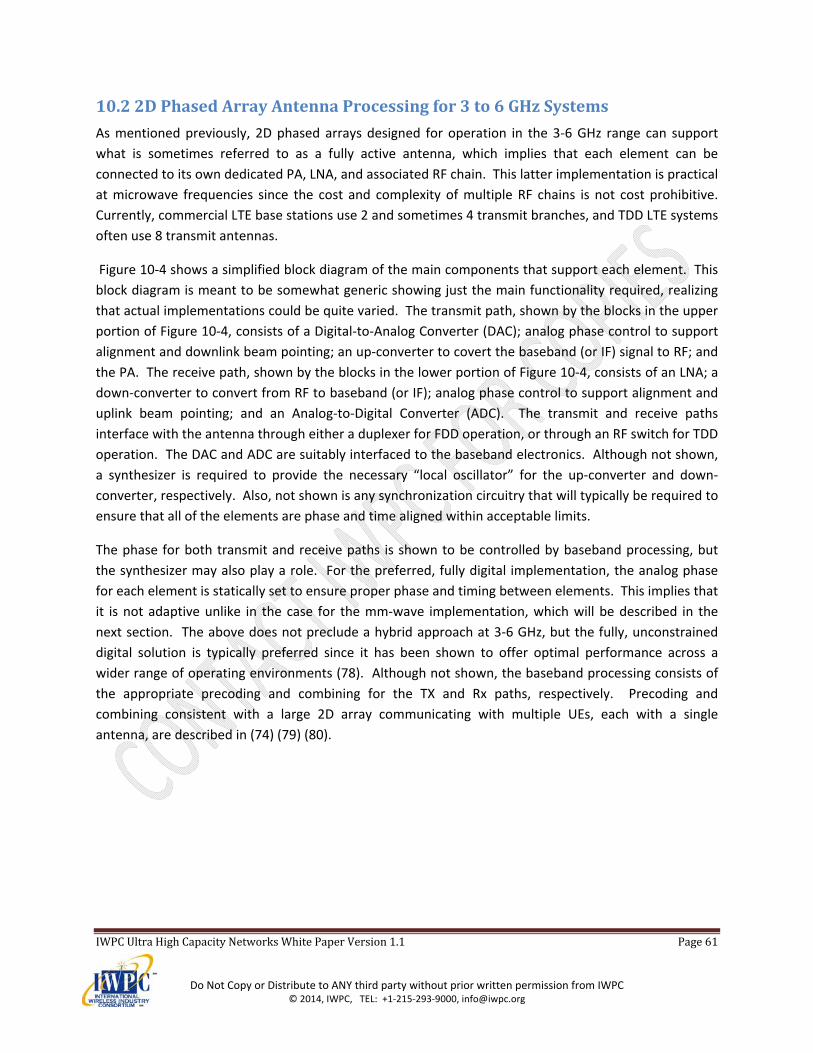
IWPCUltraHighCapacityNetworksWhitePaperVersion1.1 Page61
Do Not Copy or Distribute to ANY third party without prior written permission from IWPC © 2014, IWPC, TEL: +1‐215‐293‐9000, [email protected]
10.2 2DPhasedArrayAntennaProcessingfor3to6GHzSystems
As mentioned previously, 2D phased arrays designed for operation in the 3‐6 GHz range can support
what is sometimes referred to as a fully active antenna, which implies that each element can be
connected to its own dedicated PA, LNA, and associated RF chain. This latter implementation is practical
at microwave frequencies since the cost and complexity of multiple RF chains is not cost prohibitive.
Currently, commercial LTE base stations use 2 and sometimes 4 transmit branches, and TDD LTE systems
often use 8 transmit antennas.
Figure 10‐4 shows a simplified block diagram of the main components that support each element. This
block diagram is meant to be somewhat generic showing just the main functionality required, realizing
that actual implementations could be quite varied. The transmit path, shown by the blocks in the upper
portion of Figure 10‐4, consists of a Digital‐to‐Analog Converter (DAC); analog phase control to support
alignment and downlink beam pointing; an up‐converter to covert the baseband (or IF) signal to RF; and
the PA. The receive path, shown by the blocks in the lower portion of Figure 10‐4, consists of an LNA; a
down‐converter to convert from RF to baseband (or IF); analog phase control to support alignment and
uplink beam pointing; and an Analog‐to‐Digital Converter (ADC). The transmit and receive paths
interface with the antenna through either a duplexer for FDD operation, or through an RF switch for TDD
operation. The DAC and ADC are suitably interfaced to the baseband electronics. Although not shown,
a synthesizer is required to provide the necessary “local oscillator” for the up‐converter and down‐
converter, respectively. Also, not shown is any synchronization circuitry that will typically be required to
ensure that all of the elements are phase and time aligned within acceptable limits.
The phase for both transmit and receive paths is shown to be controlled by baseband processing, but
the synthesizer may also play a role. For the preferred, fully digital implementation, the analog phase
for each element is statically set to ensure proper phase and timing between elements. This implies that
it is not adaptive unlike in the case for the mm‐wave implementation, which will be described in the
next section. The above does not preclude a hybrid approach at 3‐6 GHz, but the fully, unconstrained
digital solution is typically preferred since it has been shown to offer optimal performance across a
wider range of operating environments (78). Although not shown, the baseband processing consists of
the appropriate precoding and combining for the TX and Rx paths, respectively. Precoding and
combining consistent with a large 2D array communicating with multiple UEs, each with a single
antenna, are described in (74) (79) (80).
IWPCUltraHighCapacityNetworksWhitePaperVersion1.1 Page62
Do Not Copy or Distribute to ANY third party without prior written permission from IWPC © 2014, IWPC, TEL: +1‐215‐293‐9000, [email protected]
Figure 10-4. Simplified block diagram of components supporting each antenna element.
10.3 2DPhasedArrayAntennaProcessingformm‐waveSystems
In this section the processing associated with 2D phase array antennas operating at mm‐wave
frequencies is described. As was mentioned earlier, the high cost and complexity of RF chains and mixed
signal circuitry at mm‐wave prohibits the use of a dedicated RF chain per antenna element as shown in
Figure 10‐4. Consequently, the signal processing for a typical mm‐wave system is split between
baseband and RF, which is shown generically in Figure 10‐5. As shown in Figure 10‐5, the transmitter
consists of a baseband precoder, NtRF RF chains, and a transmit RF beamformer, while the receiver
consists of a receiver RF beamformer, NrRF RF chains, and a baseband combiner.
The following describes the transmitter‐receiver signal flow per the derivation developed in [9]. The
baseband precoder accepts Ns data streams and develops outputs to each of the RF chains per the
conversion described by the matrix FBB, which is of dimension NtRF x Ns. The Tx RF Beamformer then
accepts the inputs from the RF chains and develop outputs to each of the Nt transmit paths (antenna
elements) per the matrix FRF, which is of dimension Nt x NtRF. The resultant transmit signal is described
by,
x = FRFFBBs (4) where s is the Ns x 1 input signal vector, and x is the Nt x1 transmit signal vector. The transmit signal is
input to the channel (not shown) which is described by an Nr x Nt channel response matrix, H, where Nr
is the number of input receive paths at the receiver. The resultant received signal vector r of dimension
Nr x1 is then given by
r = √ Hx + n = √ HFRFFBBs + n (5) where P is the average transmit power, and n is an Nr x 1 Gaussian noise vector with zero mean and
variance = �2. The Rx RF beam former develops signals which are input to each of the NrRF receive
chains via the transformation described by the matrix WRF, which is of dimension Nr x NrRF. Finally, the
baseband combiner develops an estimate of the transmitted data stream via the Ns x NrRF matrix, WBB.
The estimate of the data stream is given by
PAUp‐converterAnalogPhase Control
DAC
LNADown‐converterAnalogPhase Control
ADC
Input from synthesizer
Duplexer orSwitch
Input from basebandand/or synthesizer
To/fromBasebandProcessing
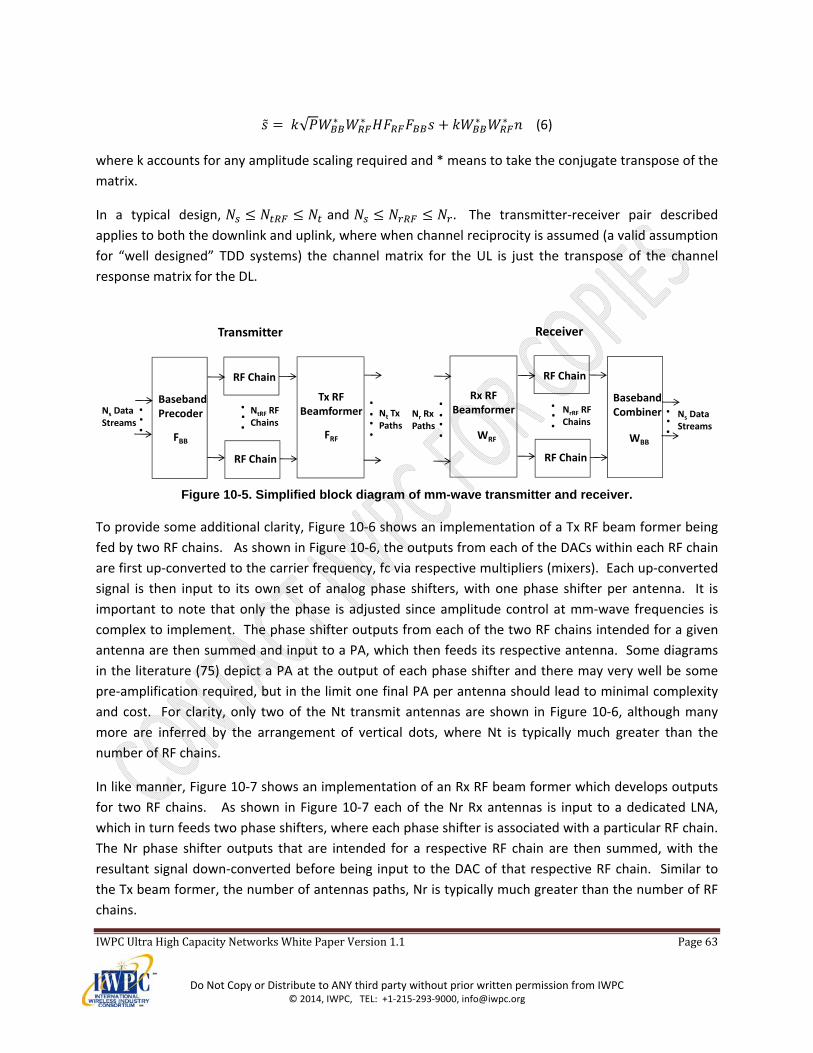
IWPCUltraHighCapacityNetworksWhitePaperVersion1.1 Page63
Do Not Copy or Distribute to ANY third party without prior written permission from IWPC © 2014, IWPC, TEL: +1‐215‐293‐9000, [email protected]
√ ∗ ∗ ∗ ∗ (6) where k accounts for any amplitude scaling required and * means to take the conjugate transpose of the
matrix.
In a typical design, and . The transmitter‐receiver pair described
applies to both the downlink and uplink, where when channel reciprocity is assumed (a valid assumption
for “well designed” TDD systems) the channel matrix for the UL is just the transpose of the channel
response matrix for the DL.
Figure 10-5. Simplified block diagram of mm-wave transmitter and receiver.
To provide some additional clarity, Figure 10‐6 shows an implementation of a Tx RF beam former being
fed by two RF chains. As shown in Figure 10‐6, the outputs from each of the DACs within each RF chain
are first up‐converted to the carrier frequency, fc via respective multipliers (mixers). Each up‐converted
signal is then input to its own set of analog phase shifters, with one phase shifter per antenna. It is
important to note that only the phase is adjusted since amplitude control at mm‐wave frequencies is
complex to implement. The phase shifter outputs from each of the two RF chains intended for a given
antenna are then summed and input to a PA, which then feeds its respective antenna. Some diagrams
in the literature (75) depict a PA at the output of each phase shifter and there may very well be some
pre‐amplification required, but in the limit one final PA per antenna should lead to minimal complexity
and cost. For clarity, only two of the Nt transmit antennas are shown in Figure 10‐6, although many
more are inferred by the arrangement of vertical dots, where Nt is typically much greater than the
number of RF chains.
In like manner, Figure 10‐7 shows an implementation of an Rx RF beam former which develops outputs
for two RF chains. As shown in Figure 10‐7 each of the Nr Rx antennas is input to a dedicated LNA,
which in turn feeds two phase shifters, where each phase shifter is associated with a particular RF chain.
The Nr phase shifter outputs that are intended for a respective RF chain are then summed, with the
resultant signal down‐converted before being input to the DAC of that respective RF chain. Similar to
the Tx beam former, the number of antennas paths, Nr is typically much greater than the number of RF
chains.
.
.
RF Chain
BasebandPrecoderNs Data
Streams
FBB
RF Chain
Tx RFBeamformer
FRF
Nt Tx Paths
NtRF RF Chains
.
.
.
.
....
.
.
RF Chain
BasebandCombiner Ns Data
StreamsWBB
RF Chain
Rx RFBeamformer
WRF
Nr Rx Paths
NrRF RF Chains
.
.
.
.
. ...
Transmitter Receiver
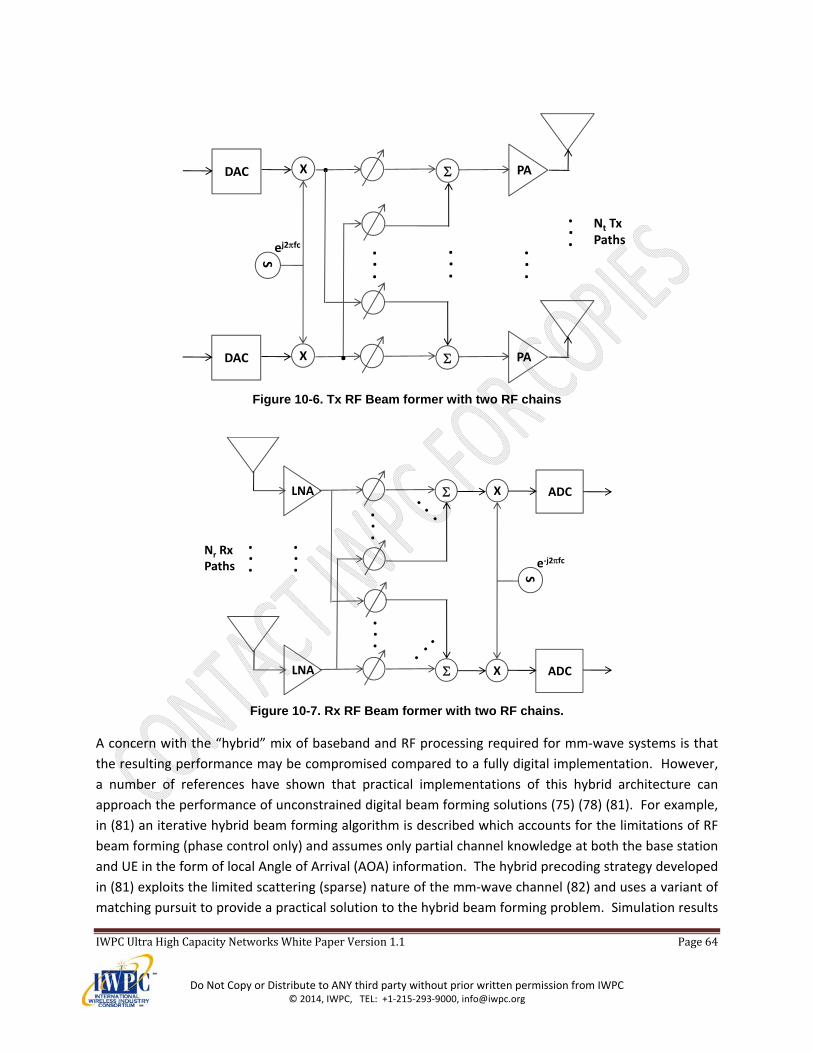
IWPCUltraHighCapacityNetworksWhitePaperVersion1.1 Page64
Do Not Copy or Distribute to ANY third party without prior written permission from IWPC © 2014, IWPC, TEL: +1‐215‐293‐9000, [email protected]
Figure 10-6. Tx RF Beam former with two RF chains
Figure 10-7. Rx RF Beam former with two RF chains.
A concern with the “hybrid” mix of baseband and RF processing required for mm‐wave systems is that
the resulting performance may be compromised compared to a fully digital implementation. However,
a number of references have shown that practical implementations of this hybrid architecture can
approach the performance of unconstrained digital beam forming solutions (75) (78) (81). For example,
in (81) an iterative hybrid beam forming algorithm is described which accounts for the limitations of RF
beam forming (phase control only) and assumes only partial channel knowledge at both the base station
and UE in the form of local Angle of Arrival (AOA) information. The hybrid precoding strategy developed
in (81) exploits the limited scattering (sparse) nature of the mm‐wave channel (82) and uses a variant of
matching pursuit to provide a practical solution to the hybrid beam forming problem. Simulation results
PA
.
.
.
X
.
.
.
PA
ej2fc
X
.
.
.
.
.
.
.
DAC
DAC
S
Nt Tx Paths
.
LNA X
.
.
.
e‐j2fc
X
.
.
....
S
Nr Rx Paths
LNA
ADC
ADC
.
.
.
IWPCUltraHighCapacityNetworksWhitePaperVersion1.1 Page65
Do Not Copy or Distribute to ANY third party without prior written permission from IWPC © 2014, IWPC, TEL: +1‐215‐293‐9000, [email protected]
show that the proposed algorithm can support data rates that approach an unconstrained digital beam
forming implementation. Further, analysis in (78) shows that for the sparse mm‐wave channel, that the
capacity achieved with unconstrained MIMO precoders based upon the channel’s singular value
decomposition (SVD), converges in the limit to what is achieved with large arrays using traditional beam
steering via RF beam forming. Simulation results are provided in (78) which verify the optimality of the
beam steering in large systems and for systems with realistic array sizes. Thus, the hybrid precoding
approach required for mm‐wave systems is shown to support system performance that closely
approaches that of a much more complex (at mm‐wave), fully digital solution.
10.4 UEAntennasfor3to6GHz
In this section the device antenna requirements for operation in the 3‐6 GHz range is described, where
the associated wavelength typically limits the number of antennas to the single digits, with two being a
typical value for feature and smart phones, while four is a possibility for tablets and laptops. Much
work has been done in recent years in the development of antennas for devices, or what is typically
referred to as User Equipments (UEs) in the 3GPP standards community, to accommodate MIMO and
multi‐band operation (83). In LTE, baseline performance as defined in Release 8 is based upon a
minimum of two receive antennas at the UE. Device antenna vendors have been able to implement
primary antennas with gains that approach ‐4 dBi at low frequency bands, e.g. lower 700 MHz, while the
gain of the secondary or diversity antenna is typically within 3 dB of that value. In addition, envelope
correlation values in the range of 0.5 to 0.6 have been achieved at these low frequencies to support
MIMO and diversity operation. Assuming 5G at higher frequencies the resulting UE antenna
performance characteristics should be significantly better with gains approaching 0 dBi and correlation
values below 0.2. The shorter wavelengths associated with higher frequency operation are a significant
advantage compared to the longer wavelengths at lower frequencies, when it comes to device antenna
design where available space for implementation is typically quite limited.
The number of antennas required at the UE/device in 5G networks that operate in the 3‐6 GHz range
may well depend on the duplex mode employed. Numerous studies have been conducted of very large
MIMO configurations employing Time Division Duplexing (TDD), which support Multi‐User (MU) MIMO
operation on both the DL and UL with just a single antenna at the UE for both receive and transmit (74)
(79) (80). One of the significant advantages of TDD operation with large antenna arrays at the base
station is that an estimate of the downlink channel can be inferred from the uplink channel. Thus, there
is no need for pilot overhead on the downlink, as there is with Frequency Division Duplexing (FDD). This
use of reciprocity in TDD systems is very helpful in beamforming to maximize the desired signal, but is
less effective in an interference limited environment where one also desires to reduce interference to
and from adjacent cells and users. The pilot overhead for TDD is limited to the uplink and increases
linearly with the number of users, K. Each user is assigned a mutually orthogonal pilot sequence used by
the base station to develop estimates of the uplink channel. In FDD, the pilot overhead increases with
the number of antennas at the base station, N and thus, will typically limit the size of the array to a value
less than what can be supported by TDD. To offset the resulting performance advantage afforded TDD
IWPCUltraHighCapacityNetworksWhitePaperVersion1.1 Page66
Do Not Copy or Distribute to ANY third party without prior written permission from IWPC © 2014, IWPC, TEL: +1‐215‐293‐9000, [email protected]
by virtue of a larger array may well require the UE to employ multiple antennas with all of the resulting
complexities. With just one UE antenna for transmit and receive there are no correlation or coupling
effects to consider, which are two of the main limiters in the performance achievable in MIMO
networks. This implies further that UE antenna vendors can focus on implementing one very good
antenna with high efficiency, and without any regard as to how it may interact with other antennas.
This is not to completely preclude the use of FDD in 5G; however the ability to support a larger value of
N with TDD has other benefits including:
1. Improved PA power reduction on both DL and UL, where on the DL the power of each PA is typically 1/N of the total transmit power, and on the UL it has been shown that for perfect channel state information (CSI) the transmit power is proportional to 1/N, while for imperfect CSI it is proportional to one over the square root of N (84); and
2. for N>>K, optimal transmission can be achieved with simple linear precoders, i.e. maximum ratio transmission (MRT), and detectors, i.e. maximum ratio combining (MRC), while at the same time the effects of thermal noise, interference, and channel estimation errors are greatly reduced since the limit on performance now becomes pilot contamination due to reuse of pilot sequences in adjacent cells (79) (80). In addition, the use of slightly more complex precoding based upon Regularized Zero Forcing (RZF) on the DL, and Minimum Mean Squared Error (MMSE) detection on the UL, can lead to a reduction in the number of antennas required at the base station by almost an order of magnitude compared to that required for MRT precoding and MRC detection (79).
In summary, if the requirement for 5G operation in the 3‐6 GHz frequency range is for just one antenna
at the UE for both transmit and receive, which appears to be the case for TDD, then the design task is
greatly simplified compared to what was required for LTE. However, if multiple antennas are required
at the UE to support FDD operation then design techniques used for LTE and other technologies as
described in (83) (85) are readily available, and should be easier to implement by virtue of the shorter
wavelengths associated with 5G operation. For example, (85) describes a dual‐antenna design at 930
MHz, where a folded monopole at one chassis edge excites the chassis’ fundamental electric dipole
mode and a coupled loop at the other chassis edge excites its own fundamental magnetic dipole mode.
Since the two radiation modes are nearly orthogonal an isolation of over 30 dB was achieved. Further,
by controlling the current on the folded monopole the two antennas can be co‐located on the same
chassis edge with over 20 dB of isolation.
10.5 ICTechnologyformm‐waveSystems
In this section the IC technology which might be best suited for mm‐wave circuits and systems is
discussed. There are three main IC technologies to consider:
1. Devices based upon III‐V semiconductor compounds and processes, e.g. gallium arsenide (GaAs), which has been the traditional choice in the past for mm‐wave RF circuits;
2. Standard complementary metal oxide semiconductor (CMOS) processes and
IWPCUltraHighCapacityNetworksWhitePaperVersion1.1 Page67
Do Not Copy or Distribute to ANY third party without prior written permission from IWPC © 2014, IWPC, TEL: +1‐215‐293‐9000, [email protected]
3. Silicon based CMOS processes.
Most of the early devices were based upon III‐V semiconductor compounds, which are expensive and do
not integrate well with digital circuitry. Thus, according to (86) “their design is not a viable solution for
extremely cheap, ubiquitous, and highly integrated consumer products”. In recent years, silicon based
CMOS has become a viable alternative as shrinking transistor gate sizes (<50 nm) allow for transit
frequencies greater than 100 GHz. Another key figure of merit is the maximum frequency of operation,
fmax where CMOS and BiCMOS processes have been shown to support a value near 300 GHz, while
silicon for high‐resistivity silicon‐on‐insulator (SOI) processes can support a value near 325 GHz (86).
Thus, lower cost standard CMOS and slightly more expensive, silicon based CMOS implementations are
now considered a viable alternative to the more expensive III‐V semiconductors. According to (87), “SOI
CMOS processes are also attractive for high end applications as they allow for higher quality factors due
to reduced values of parasitic capacitances and inductances for passive components.” However, as
mentioned above, silicon based CMOS is more expensive than standard CMOS since in the former
devices channels and substrates are engineered separately, while that is not the case for the latter.
Thus, if cost is the ultimate driver, then standard CMOS would be the preferred IC technology.
The end result, whether it is based upon standard CMOS or silicon based CMOS, is the realization of a
single chip mm‐wave system, complete with a digital baseband and mm‐wave analog front end.
10.6 On‐chipandIn‐PackageAntennasformm‐waveSystems
A possible implementation for antennas at mm‐wave frequencies is what is referred to as on‐chip
antennas. As the name implies the antenna is literally fabricated directly on the chip as opposed to an
in‐package implementation where the antenna elements are placed in the package surrounding the
chip. The on‐chip approach has the advantage of removing all external connections between the
antennas and the associated RF circuits thereby reducing cost and allowing for more flexibility in circuit
design. The primary disadvantage of on‐chip antennas is an extremely large radiation loss due to
substrate absorption and conductive currents (86). For example, typical on‐chip antennas on doped
silicon substrates only have an efficiency of about 10%.
To improve performance a dielectric lens can be placed above or below the antenna, which has the
effect of reducing the energy lost to the substrate modes. A dielectric lens above the antenna reduces
the difference in the dielectric constants above and below the antenna, thereby increasing the radiation
intensity away from the substrate. For proper operation this lens should have a dielectric constant
greater than or equal to that of the substrate. A dielectric lens below the chip increases performance by
releasing and radiating energy trapped as substrate modes in the silicon out the back of the chip. The
problem however is that the inclusion of a dielectric lens located above or below the antenna substrate
is nonstandard with regards to typical foundry production processes. Other possibilities for increasing
performance include the use of frequency selective screens and meta materials, and the use of
symmetric electromagnetic band gap structures (86).
IWPCUltraHighCapacityNetworksWhitePaperVersion1.1 Page68
Do Not Copy or Distribute to ANY third party without prior written permission from IWPC © 2014, IWPC, TEL: +1‐215‐293‐9000, [email protected]
A higher cost but better performing alternative to the on‐chip antenna is the in‐package antenna, which
has much higher efficiencies by virtue of the antenna being located further from the lossy chip
substrate. In general, the best gain‐bandwidth products will be obtained using materials with low
dielectric constants, �r. Representative package technologies include Teflon, low temperature co‐fired
ceramic (LTCC), fused silica, and liquid crystal polymer (LCP) with respective dielectric constants of 2.2,
5.9‐7.7, 3.8, and 3.1 (86). There are a number of challenges associated with in‐package antenna design
including: detuning of antennas due to the presence of packaging materials; mechanical and electrical
reliability; antenna interference from heat sinks; and the possible high cost of the packing process itself.
Of the candidate package technologies, LCP is currently viewed as a practical low‐cost method for
implementing in‐package antennas at mm‐wave frequencies.
Another challenge of mm‐wave antennas in portable devices is their highly directive properties which
can create difficulties in obtaining the necessary gain and polarization in the direction of the base
station, particularly if the antenna is compromised due to the proximity of obstructions such as a hand
or head. Practical solutions may involve the placement of several antennas at different locations on the
device.
Finally, advanced packaging technologies provide more flexibility in the integration of antennas and
other mm‐wave components than a single chip solution, and will most likely be required in the
implementation of a 2D phased array. A critical component of this integrated solution is the type of
interconnect used in the package. The two main interconnect technologies are flip chip connections,
which facilitate stacked structures, and coupling connections that can reach higher frequencies than
standard wire bonds (86). Coupling connections come in many forms, and are based upon capacitive
connections between components in a package, and may prove to be especially useful for integrating
multiple chips into a single package. For example, an antenna array could be fabricated in CMOS, which
could then be capacitively coupled to a more advanced process chip, which contains active mm‐wave
components, e.g. a PA or LNA. The antenna would benefit from the lower doping concentration and
higher resistivity of the CMOS process, which results in a less conductive, less lossy substrate compared
to a newer process technology. To support an antenna array, simple low‐speed active switches, i.e.
diodes could be integrated onto the antenna chip with phased passive feed lines to perform element
tuning, phase shifting, and beam steering. An illustration of such an integrated solution is provided in
Figure 10‐5 of (86).
10.7 UserEquipmentPowerConsumption
Variations in network deployment strategies are expected to become larger than today. Small cell
deployments are expected with an overall heterogeneous radio access technology combination handling
dense traffic situations, combined with more macro cell type of deployments in other areas. In such
heterogeneous network topology utilizing several combined network technologies in a multi‐layered
approach the user equipment power consumption can become an important traffic scheduling aspect.
This is mainly due to power amplifier consumption in the user equipment which is heavily dependent on
the output power levels while the increase in power consumption versus increased bandwidth
IWPCUltraHighCapacityNetworksWhitePaperVersion1.1 Page69
Do Not Copy or Distribute to ANY third party without prior written permission from IWPC © 2014, IWPC, TEL: +1‐215‐293‐9000, [email protected]
utilization is not as large. Several radio access technologies are also assumed to operate simultaneously
in the same terminal to a larger extent than today. Hence it is expected that variations in power
consumption per transferred bit will be large, and optimizing the user equipment battery life will be
crucial.
Another power consumption aspect is the utilization of mesh topologies and device to device
communication in general, where power consumption of involved terminals is relevant in the routing
decisions. This can be relevant to consider both in terms of defining most power efficient mesh links, but
also taking end user expectations of total terminal battery life into account.
10.8 MassiveMIMO
Massive MIMO is defined as a system where all antenna configuration is made in the digital domain and
hence, can simultaneously be configured for multi beams and array antenna is utilized at BS/AP side
only. For the 0.5‐6 GHz frequency band most of the literature assumes a single antenna on the UE side.
Two antennas for MIMO are, however, already implemented in LTE UEs and methods to generate a
dedicated beam for the second/diversity antenna have been proposed but needs to be evaluated from
system throughput and complexity point of view. This could either be achieved by two UL RF chains or
UL antenna selection. Additionally, SAR needs to be handled, either by power reduction or antenna
reselection. It has also been mentioned that there might be areas not covered by the BS, due to
shadowing or fading, and then a 2nd antenna might help, the size and frequency of such areas will
probably need more study.
10.9 DeviceIntegrationformm‐Wave
Highly integrated RFIC solutions providing complete transmitter and receiver chains are clearly desirable
to provide the size, cost and power consumption needed for future generations of mm‐wave radio
products. For >6GHz UE antennas are likely to be fully integrated modules with antenna arrays and RF
FEM in the same component. Hence, array to mitigate the small aperture and the module approach due
to high loss when routing the RF signals. Also here the user loading will be a problem and the module
might be treated as a single antenna where a second module needs to be introduced for diversity and to
overcome LOS blockage. Additionally, as discussed earlier, an array by nature has the potential of adding
antenna gain by beam forming, this adds to the transceiver complexity and current consumption. As the
coverage angle of an array might be more limited than that of a single antenna element and possibly
arrays on each side of the UE will be needed in order to achieve a proper user experience. Also the
network might need to (at least in LOS scenario) cover the same area from different angles, for the same
reason. Hence, limited coverage angle. SAR might be an issue and can be mitigated by antenna
reselection.
10.10 Mobilityconsiderationsformm‐waveantennas
Common for any system where an array is involved, mobility needs to be handled. The array
configuration exists in a rich NLOS environment and is only valid in a very small range (<λ/2) and needs
IWPCUltraHighCapacityNetworksWhitePaperVersion1.1 Page70
Do Not Copy or Distribute to ANY third party without prior written permission from IWPC © 2014, IWPC, TEL: +1‐215‐293‐9000, [email protected]
to be updated as soon as one of the antennas has been moved. Most proposed system involves frames
with a training sequence that needs to be sent in a rate which will define the limit of mobility; the
maximum UE speed. For a mm‐Wave system where both BS and UE utilize beam forming a significant
amount of signal processing will be needed and hence potentially increase the power consumption in
the UE.
11 ProposedNetworkFeaturesforFutureCellularSystems(maybetermedas5Gsystems)
Role of Self Organizing Network (SON)
Cell Identity Management
Load Balancing & Mobility Robustness
Power Saving features
The deployment challenges for unplanned (semi‐planned) small cells result primarily from the fact that
unlike a macro network, the small cells are installed with limited, if any, network planning and site‐
specific system configuration settings. These devices are required to be plug‐n‐play with self‐
configuration capabilities. Another important challenge is to offer seamless mobility within this
unplanned network to prevent any service interruption or degradation in user experience. Neighbor
discovery and frequent handover mitigations are important to optimize handover performance and
reduce signaling load. In addition, transmit power management of small cells is needed to optimize
capacity offload while minimizing pilot pollution (i.e. regions with high interference) under dense small
cell deployments. Furthermore, radio resource management techniques such as interference
coordination and load balancing are important to optimize capacity and user experience. As the small
cell backhaul may be shared by other devices, Tx power and radio resource management methods need
to take into account backhaul constraints. In this section the scope/requirements on some SON
techniques to address the challenges mentioned above is covered.
11.1 MobilityManagement
Effective mobility management is essential for the viability of dense small cell approach to reach the
massive capacity goal. The mobility management problem basically boils down to ensuring all mobiles,
including legacy, are supported in idle and connected modes in the small cell network. Figure 11‐1
shows all the various possible transitions a mobile has to traverse through in a small cell network in both
idle and connected modes: Macro‐to‐Small Cell, Small Cell‐to‐Small Cell, and Small Cell‐to‐Macro.
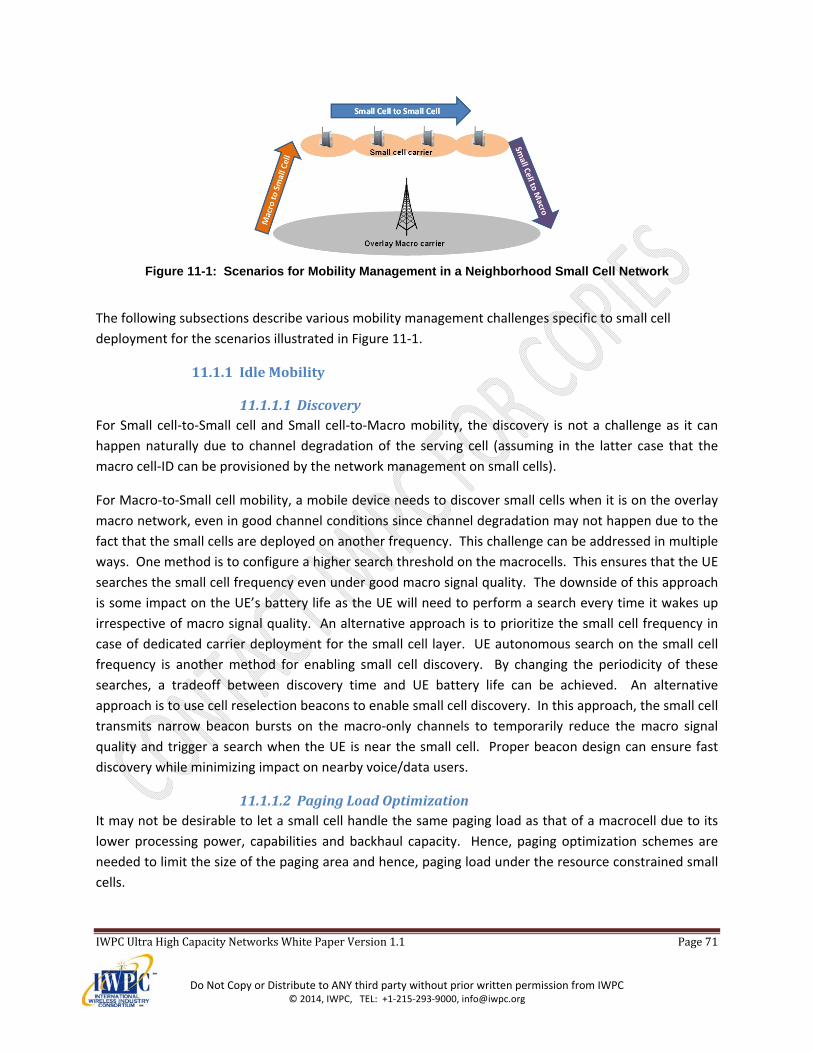
IWPCUltraHighCapacityNetworksWhitePaperVersion1.1 Page71
Do Not Copy or Distribute to ANY third party without prior written permission from IWPC © 2014, IWPC, TEL: +1‐215‐293‐9000, [email protected]
Figure 11-1: Scenarios for Mobility Management in a Neighborhood Small Cell Network
The following subsections describe various mobility management challenges specific to small cell
deployment for the scenarios illustrated in Figure 11‐1.
11.1.1 IdleMobility
11.1.1.1 DiscoveryFor Small cell‐to‐Small cell and Small cell‐to‐Macro mobility, the discovery is not a challenge as it can
happen naturally due to channel degradation of the serving cell (assuming in the latter case that the
macro cell‐ID can be provisioned by the network management on small cells).
For Macro‐to‐Small cell mobility, a mobile device needs to discover small cells when it is on the overlay
macro network, even in good channel conditions since channel degradation may not happen due to the
fact that the small cells are deployed on another frequency. This challenge can be addressed in multiple
ways. One method is to configure a higher search threshold on the macrocells. This ensures that the UE
searches the small cell frequency even under good macro signal quality. The downside of this approach
is some impact on the UE’s battery life as the UE will need to perform a search every time it wakes up
irrespective of macro signal quality. An alternative approach is to prioritize the small cell frequency in
case of dedicated carrier deployment for the small cell layer. UE autonomous search on the small cell
frequency is another method for enabling small cell discovery. By changing the periodicity of these
searches, a tradeoff between discovery time and UE battery life can be achieved. An alternative
approach is to use cell reselection beacons to enable small cell discovery. In this approach, the small cell
transmits narrow beacon bursts on the macro‐only channels to temporarily reduce the macro signal
quality and trigger a search when the UE is near the small cell. Proper beacon design can ensure fast
discovery while minimizing impact on nearby voice/data users.
11.1.1.2 PagingLoadOptimizationIt may not be desirable to let a small cell handle the same paging load as that of a macrocell due to its
lower processing power, capabilities and backhaul capacity. Hence, paging optimization schemes are
needed to limit the size of the paging area and hence, paging load under the resource constrained small
cells.
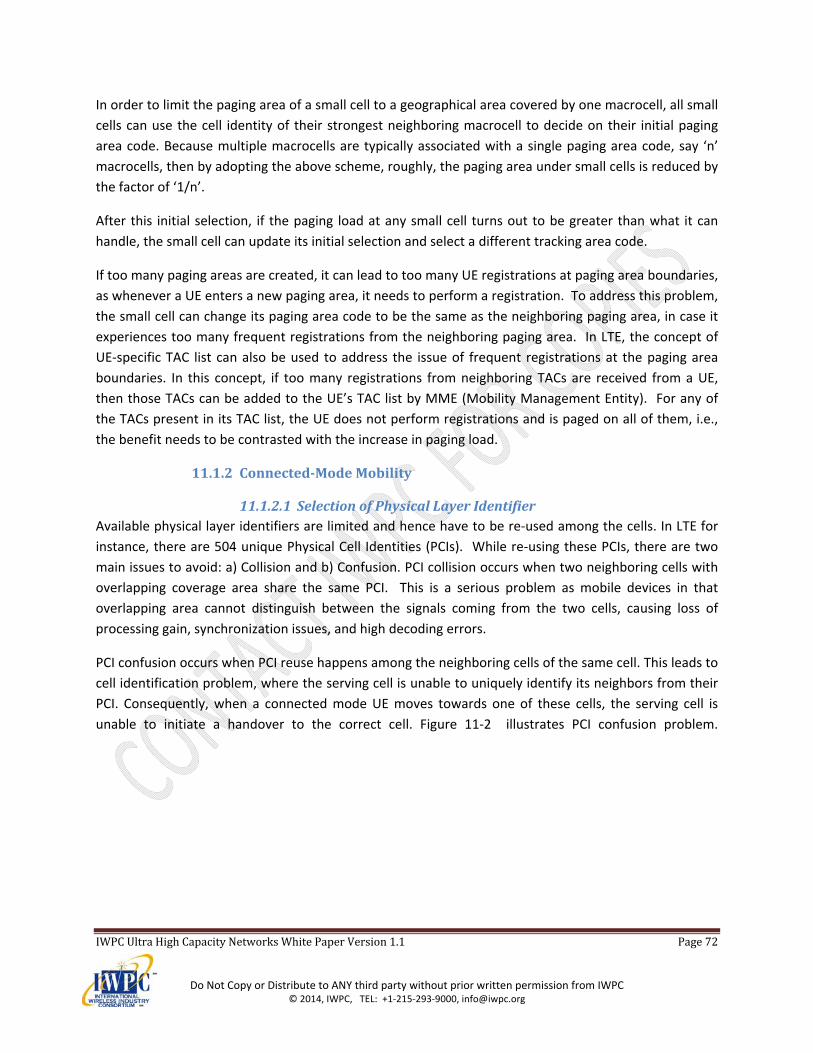
IWPCUltraHighCapacityNetworksWhitePaperVersion1.1 Page72
Do Not Copy or Distribute to ANY third party without prior written permission from IWPC © 2014, IWPC, TEL: +1‐215‐293‐9000, [email protected]
In order to limit the paging area of a small cell to a geographical area covered by one macrocell, all small
cells can use the cell identity of their strongest neighboring macrocell to decide on their initial paging
area code. Because multiple macrocells are typically associated with a single paging area code, say ‘n’
macrocells, then by adopting the above scheme, roughly, the paging area under small cells is reduced by
the factor of ‘1/n’.
After this initial selection, if the paging load at any small cell turns out to be greater than what it can
handle, the small cell can update its initial selection and select a different tracking area code.
If too many paging areas are created, it can lead to too many UE registrations at paging area boundaries,
as whenever a UE enters a new paging area, it needs to perform a registration. To address this problem,
the small cell can change its paging area code to be the same as the neighboring paging area, in case it
experiences too many frequent registrations from the neighboring paging area. In LTE, the concept of
UE‐specific TAC list can also be used to address the issue of frequent registrations at the paging area
boundaries. In this concept, if too many registrations from neighboring TACs are received from a UE,
then those TACs can be added to the UE’s TAC list by MME (Mobility Management Entity). For any of
the TACs present in its TAC list, the UE does not perform registrations and is paged on all of them, i.e.,
the benefit needs to be contrasted with the increase in paging load.
11.1.2 Connected‐ModeMobility
11.1.2.1 SelectionofPhysicalLayerIdentifierAvailable physical layer identifiers are limited and hence have to be re‐used among the cells. In LTE for
instance, there are 504 unique Physical Cell Identities (PCIs). While re‐using these PCIs, there are two
main issues to avoid: a) Collision and b) Confusion. PCI collision occurs when two neighboring cells with
overlapping coverage area share the same PCI. This is a serious problem as mobile devices in that
overlapping area cannot distinguish between the signals coming from the two cells, causing loss of
processing gain, synchronization issues, and high decoding errors.
PCI confusion occurs when PCI reuse happens among the neighboring cells of the same cell. This leads to
cell identification problem, where the serving cell is unable to uniquely identify its neighbors from their
PCI. Consequently, when a connected mode UE moves towards one of these cells, the serving cell is
unable to initiate a handover to the correct cell. Figure 11‐2 illustrates PCI confusion problem.
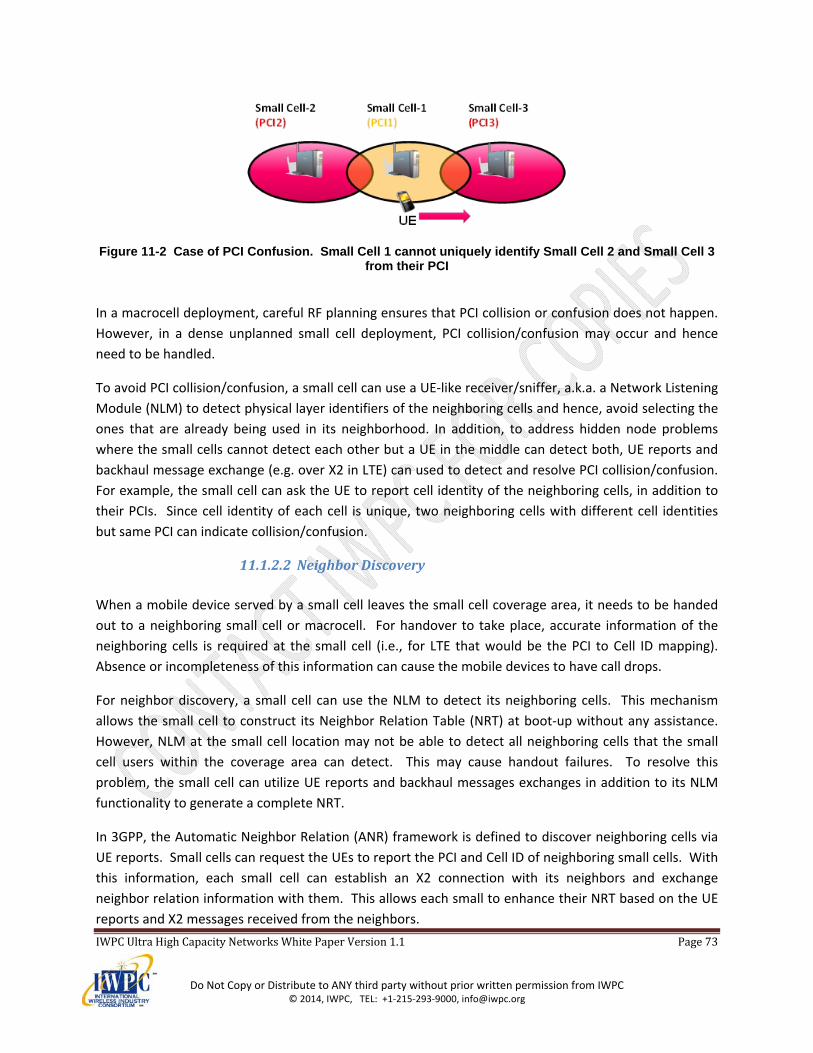
IWPCUltraHighCapacityNetworksWhitePaperVersion1.1 Page73
Do Not Copy or Distribute to ANY third party without prior written permission from IWPC © 2014, IWPC, TEL: +1‐215‐293‐9000, [email protected]
Figure 11-2 Case of PCI Confusion. Small Cell 1 cannot uniquely identify Small Cell 2 and Small Cell 3
from their PCI
In a macrocell deployment, careful RF planning ensures that PCI collision or confusion does not happen.
However, in a dense unplanned small cell deployment, PCI collision/confusion may occur and hence
need to be handled.
To avoid PCI collision/confusion, a small cell can use a UE‐like receiver/sniffer, a.k.a. a Network Listening
Module (NLM) to detect physical layer identifiers of the neighboring cells and hence, avoid selecting the
ones that are already being used in its neighborhood. In addition, to address hidden node problems
where the small cells cannot detect each other but a UE in the middle can detect both, UE reports and
backhaul message exchange (e.g. over X2 in LTE) can used to detect and resolve PCI collision/confusion.
For example, the small cell can ask the UE to report cell identity of the neighboring cells, in addition to
their PCIs. Since cell identity of each cell is unique, two neighboring cells with different cell identities
but same PCI can indicate collision/confusion.
11.1.2.2 NeighborDiscovery
When a mobile device served by a small cell leaves the small cell coverage area, it needs to be handed
out to a neighboring small cell or macrocell. For handover to take place, accurate information of the
neighboring cells is required at the small cell (i.e., for LTE that would be the PCI to Cell ID mapping).
Absence or incompleteness of this information can cause the mobile devices to have call drops.
For neighbor discovery, a small cell can use the NLM to detect its neighboring cells. This mechanism
allows the small cell to construct its Neighbor Relation Table (NRT) at boot‐up without any assistance.
However, NLM at the small cell location may not be able to detect all neighboring cells that the small
cell users within the coverage area can detect. This may cause handout failures. To resolve this
problem, the small cell can utilize UE reports and backhaul messages exchanges in addition to its NLM
functionality to generate a complete NRT.
In 3GPP, the Automatic Neighbor Relation (ANR) framework is defined to discover neighboring cells via
UE reports. Small cells can request the UEs to report the PCI and Cell ID of neighboring small cells. With
this information, each small cell can establish an X2 connection with its neighbors and exchange
neighbor relation information with them. This allows each small to enhance their NRT based on the UE
reports and X2 messages received from the neighbors.
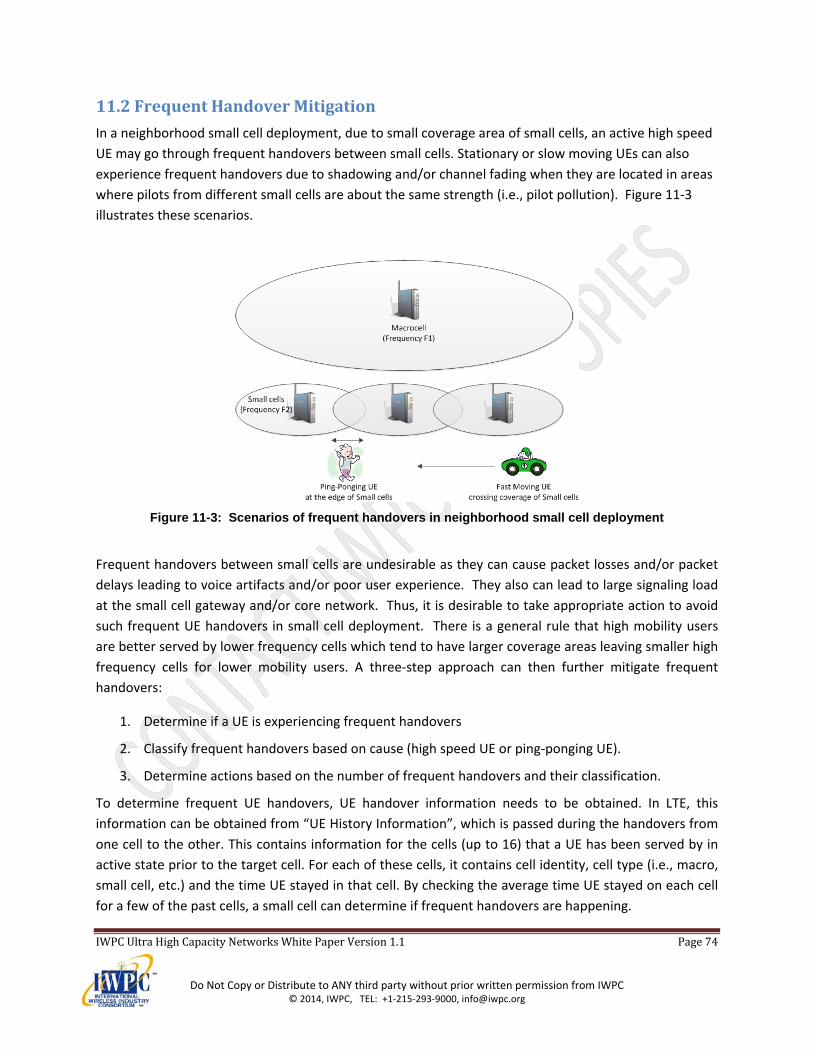
IWPCUltraHighCapacityNetworksWhitePaperVersion1.1 Page74
Do Not Copy or Distribute to ANY third party without prior written permission from IWPC © 2014, IWPC, TEL: +1‐215‐293‐9000, [email protected]
11.2 FrequentHandoverMitigation
In a neighborhood small cell deployment, due to small coverage area of small cells, an active high speed
UE may go through frequent handovers between small cells. Stationary or slow moving UEs can also
experience frequent handovers due to shadowing and/or channel fading when they are located in areas
where pilots from different small cells are about the same strength (i.e., pilot pollution). Figure 11‐3
illustrates these scenarios.
Figure 11-3: Scenarios of frequent handovers in neighborhood small cell deployment
Frequent handovers between small cells are undesirable as they can cause packet losses and/or packet
delays leading to voice artifacts and/or poor user experience. They also can lead to large signaling load
at the small cell gateway and/or core network. Thus, it is desirable to take appropriate action to avoid
such frequent UE handovers in small cell deployment. There is a general rule that high mobility users
are better served by lower frequency cells which tend to have larger coverage areas leaving smaller high
frequency cells for lower mobility users. A three‐step approach can then further mitigate frequent
handovers:
1. Determine if a UE is experiencing frequent handovers
2. Classify frequent handovers based on cause (high speed UE or ping‐ponging UE).
3. Determine actions based on the number of frequent handovers and their classification.
To determine frequent UE handovers, UE handover information needs to be obtained. In LTE, this
information can be obtained from “UE History Information”, which is passed during the handovers from
one cell to the other. This contains information for the cells (up to 16) that a UE has been served by in
active state prior to the target cell. For each of these cells, it contains cell identity, cell type (i.e., macro,
small cell, etc.) and the time UE stayed in that cell. By checking the average time UE stayed on each cell
for a few of the past cells, a small cell can determine if frequent handovers are happening.

IWPCUltraHighCapacityNetworksWhitePaperVersion1.1 Page75
Do Not Copy or Distribute to ANY third party without prior written permission from IWPC © 2014, IWPC, TEL: +1‐215‐293‐9000, [email protected]
To understand if frequent handovers are ‘Ping‐Pong’ handovers, the small cell can check the last few
handovers in UE history information to see if a cell identity is getting repeated. If that is the case, then it
can classify them as ‘Ping‐Pong handovers’, otherwise, they can be assumed to be ‘fast moving
handovers’.
If handovers are ‘frequent handovers’ and are classified as ‘fast moving handovers’, then the small cell
can initiate inter‐frequency handover to a macrocell on the other carrier. The idea here is to send the
fast moving UE to a clean macrocell carrier where the number of handovers would be reduced due to
large coverage of macrocells.
If handovers are ‘frequent handovers’ and are classified as ‘Ping‐Pong handovers’, then the small cell
can make it more difficult for this UE to handover to the ping‐ponging (or neighboring) cells through the
adjustment of UE specific handover parameters. If delaying handovers to the ping‐ponging cells does not
work (i.e., frequent handovers continue), inter‐frequency handover to the macrocell may be initiated by
the small cell, as a fallback option.
Additional improvements to handover performance can be obtained by monitoring handover failure
scenarios and adjusting handover policy to reduce handover failures. For instance, in LTE, the Mobility
Robustness Optimization (MRO) feature of the 3GPP standard defines several techniques for handover
failure monitoring, including message exchange between source and target cells to monitor failures that
the source cell would otherwise not be aware of. The standard leaves the handover policy adjustments
to implementation.
11.3 TransmitPowerManagement
A dense deployment of small cells in a neighborhood while providing improved capacity via spatial reuse
results in two main challenges which affect user mobility:
Islands where multiple small cells are at nearly equal strength resulting in users, stationary or mobile,
experiencing very frequent handovers between small cells. Smaller coverage footprints: Since the
density of small cells in a geographical area is very large, the coverage area per small cell ends up being
much smaller than the coverage area of a macrocell. As a result, pedestrian or vehicular users moving
within the network experience much more frequent handovers between small cells.
These mobility related challenges can be mitigated, in addition to the schemes described above, by
correctly calibrating the small cell downlink transmit power level. Each small cell can monitor the
surrounding RF using the NLM and UE measurements. Each small cell performs RF measurements of
other small cells’ pilot channel and determines its own transmit power level. NLM measurements can
be done at the power‐up and repeated periodically to monitor any changes in the neighborhood.
Furthermore, UE measurements can be used to enhance the NLM measurements and address RF
mismatch issues.
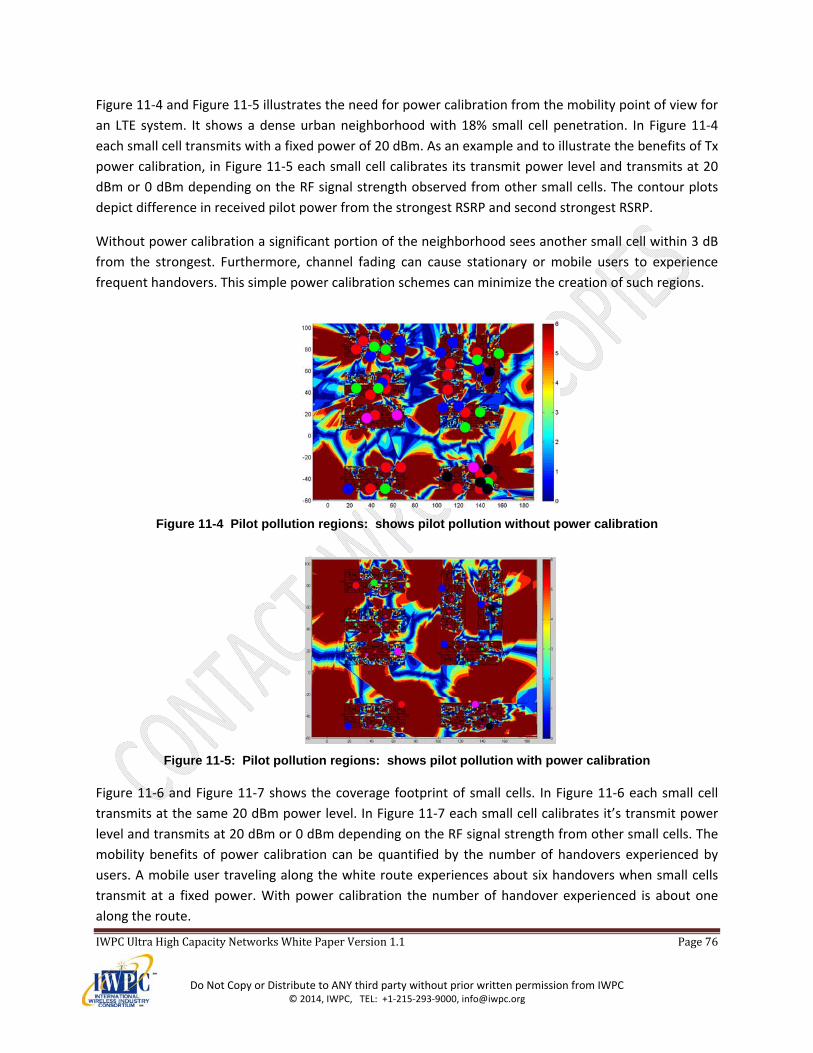
IWPCUltraHighCapacityNetworksWhitePaperVersion1.1 Page76
Do Not Copy or Distribute to ANY third party without prior written permission from IWPC © 2014, IWPC, TEL: +1‐215‐293‐9000, [email protected]
Figure 11‐4 and Figure 11‐5 illustrates the need for power calibration from the mobility point of view for
an LTE system. It shows a dense urban neighborhood with 18% small cell penetration. In Figure 11‐4
each small cell transmits with a fixed power of 20 dBm. As an example and to illustrate the benefits of Tx
power calibration, in Figure 11‐5 each small cell calibrates its transmit power level and transmits at 20
dBm or 0 dBm depending on the RF signal strength observed from other small cells. The contour plots
depict difference in received pilot power from the strongest RSRP and second strongest RSRP.
Without power calibration a significant portion of the neighborhood sees another small cell within 3 dB
from the strongest. Furthermore, channel fading can cause stationary or mobile users to experience
frequent handovers. This simple power calibration schemes can minimize the creation of such regions.
Figure 11-4 Pilot pollution regions: shows pilot pollution without power calibration
Figure 11-5: Pilot pollution regions: shows pilot pollution with power calibration
Figure 11‐6 and Figure 11‐7 shows the coverage footprint of small cells. In Figure 11‐6 each small cell
transmits at the same 20 dBm power level. In Figure 11‐7 each small cell calibrates it’s transmit power
level and transmits at 20 dBm or 0 dBm depending on the RF signal strength from other small cells. The
mobility benefits of power calibration can be quantified by the number of handovers experienced by
users. A mobile user traveling along the white route experiences about six handovers when small cells
transmit at a fixed power. With power calibration the number of handover experienced is about one
along the route.
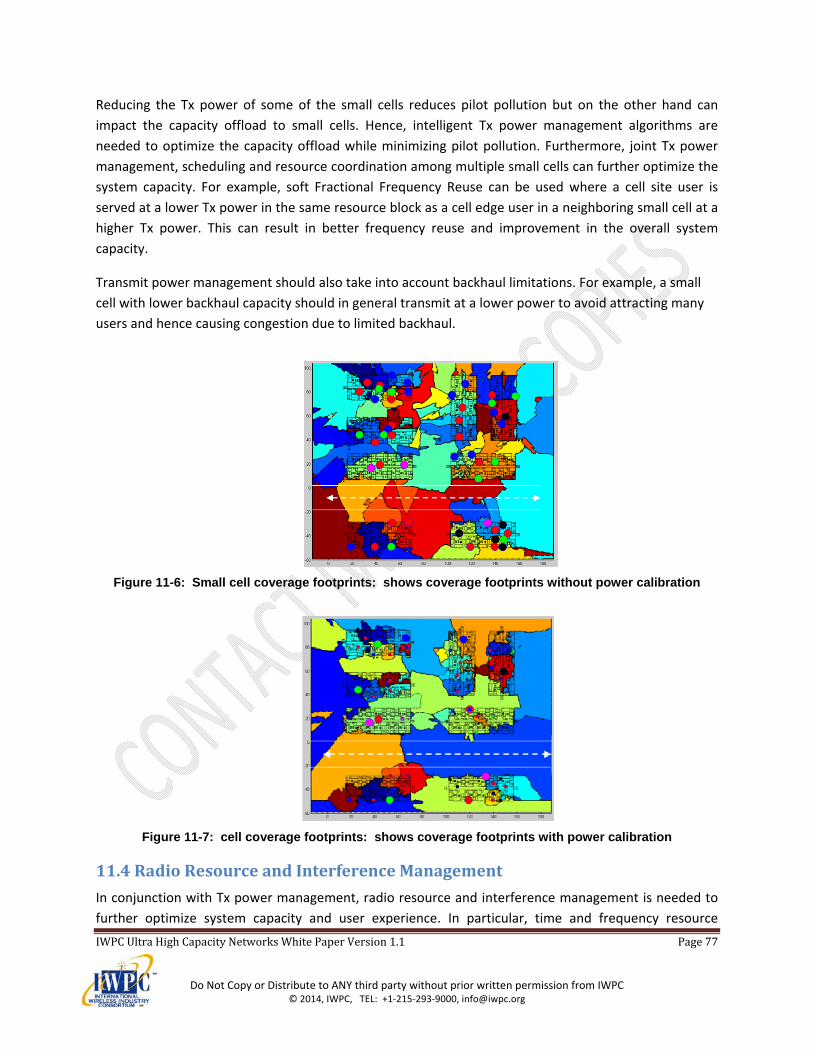
IWPCUltraHighCapacityNetworksWhitePaperVersion1.1 Page77
Do Not Copy or Distribute to ANY third party without prior written permission from IWPC © 2014, IWPC, TEL: +1‐215‐293‐9000, [email protected]
Reducing the Tx power of some of the small cells reduces pilot pollution but on the other hand can
impact the capacity offload to small cells. Hence, intelligent Tx power management algorithms are
needed to optimize the capacity offload while minimizing pilot pollution. Furthermore, joint Tx power
management, scheduling and resource coordination among multiple small cells can further optimize the
system capacity. For example, soft Fractional Frequency Reuse can be used where a cell site user is
served at a lower Tx power in the same resource block as a cell edge user in a neighboring small cell at a
higher Tx power. This can result in better frequency reuse and improvement in the overall system
capacity.
Transmit power management should also take into account backhaul limitations. For example, a small
cell with lower backhaul capacity should in general transmit at a lower power to avoid attracting many
users and hence causing congestion due to limited backhaul.
Figure 11-6: Small cell coverage footprints: shows coverage footprints without power calibration
Figure 11-7: cell coverage footprints: shows coverage footprints with power calibration
11.4 RadioResourceandInterferenceManagement
In conjunction with Tx power management, radio resource and interference management is needed to
further optimize system capacity and user experience. In particular, time and frequency resource
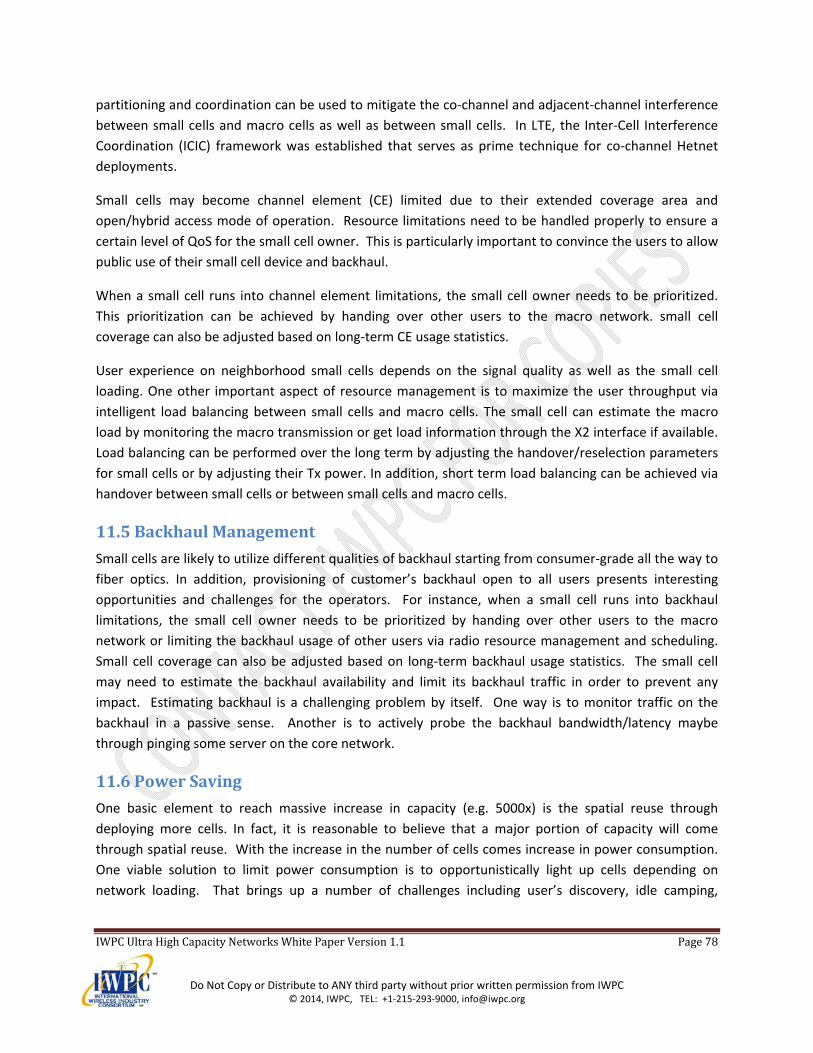
IWPCUltraHighCapacityNetworksWhitePaperVersion1.1 Page78
Do Not Copy or Distribute to ANY third party without prior written permission from IWPC © 2014, IWPC, TEL: +1‐215‐293‐9000, [email protected]
partitioning and coordination can be used to mitigate the co‐channel and adjacent‐channel interference
between small cells and macro cells as well as between small cells. In LTE, the Inter‐Cell Interference
Coordination (ICIC) framework was established that serves as prime technique for co‐channel Hetnet
deployments.
Small cells may become channel element (CE) limited due to their extended coverage area and
open/hybrid access mode of operation. Resource limitations need to be handled properly to ensure a
certain level of QoS for the small cell owner. This is particularly important to convince the users to allow
public use of their small cell device and backhaul.
When a small cell runs into channel element limitations, the small cell owner needs to be prioritized.
This prioritization can be achieved by handing over other users to the macro network. small cell
coverage can also be adjusted based on long‐term CE usage statistics.
User experience on neighborhood small cells depends on the signal quality as well as the small cell
loading. One other important aspect of resource management is to maximize the user throughput via
intelligent load balancing between small cells and macro cells. The small cell can estimate the macro
load by monitoring the macro transmission or get load information through the X2 interface if available.
Load balancing can be performed over the long term by adjusting the handover/reselection parameters
for small cells or by adjusting their Tx power. In addition, short term load balancing can be achieved via
handover between small cells or between small cells and macro cells.
11.5 BackhaulManagement
Small cells are likely to utilize different qualities of backhaul starting from consumer‐grade all the way to
fiber optics. In addition, provisioning of customer’s backhaul open to all users presents interesting
opportunities and challenges for the operators. For instance, when a small cell runs into backhaul
limitations, the small cell owner needs to be prioritized by handing over other users to the macro
network or limiting the backhaul usage of other users via radio resource management and scheduling.
Small cell coverage can also be adjusted based on long‐term backhaul usage statistics. The small cell
may need to estimate the backhaul availability and limit its backhaul traffic in order to prevent any
impact. Estimating backhaul is a challenging problem by itself. One way is to monitor traffic on the
backhaul in a passive sense. Another is to actively probe the backhaul bandwidth/latency maybe
through pinging some server on the core network.
11.6 PowerSaving
One basic element to reach massive increase in capacity (e.g. 5000x) is the spatial reuse through
deploying more cells. In fact, it is reasonable to believe that a major portion of capacity will come
through spatial reuse. With the increase in the number of cells comes increase in power consumption.
One viable solution to limit power consumption is to opportunistically light up cells depending on
network loading. That brings up a number of challenges including user’s discovery, idle camping,
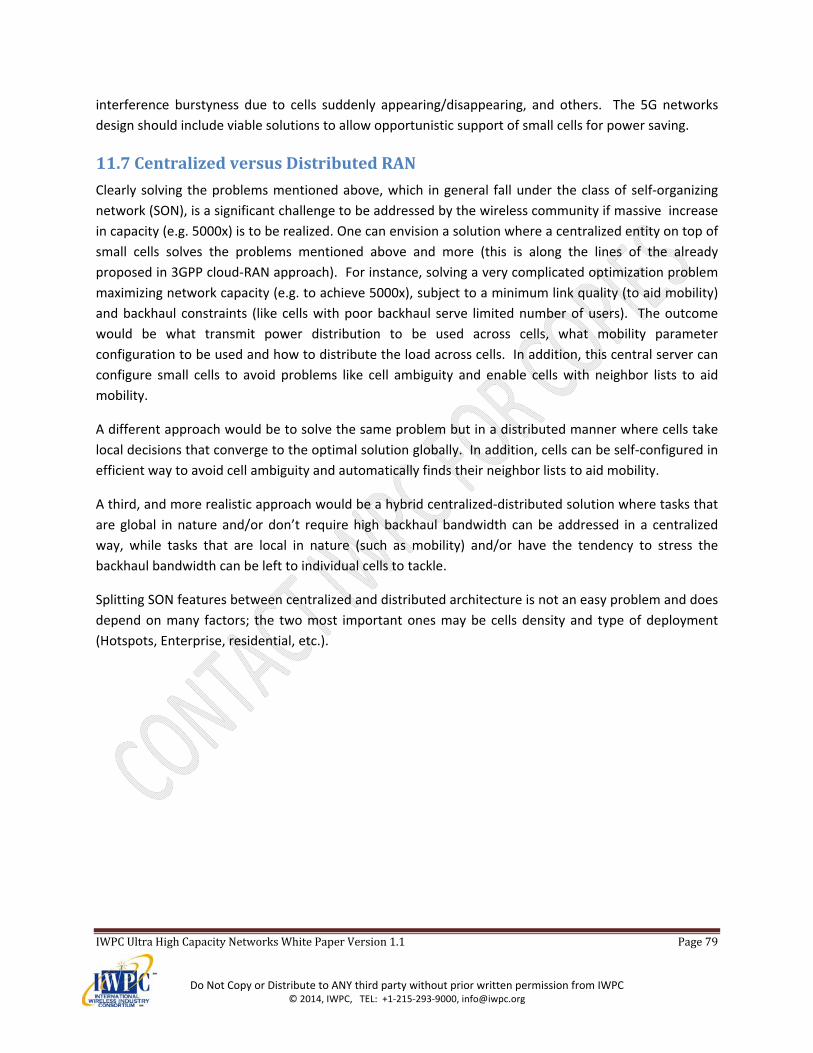
IWPCUltraHighCapacityNetworksWhitePaperVersion1.1 Page79
Do Not Copy or Distribute to ANY third party without prior written permission from IWPC © 2014, IWPC, TEL: +1‐215‐293‐9000, [email protected]
interference burstyness due to cells suddenly appearing/disappearing, and others. The 5G networks
design should include viable solutions to allow opportunistic support of small cells for power saving.
11.7 CentralizedversusDistributedRAN
Clearly solving the problems mentioned above, which in general fall under the class of self‐organizing
network (SON), is a significant challenge to be addressed by the wireless community if massive increase
in capacity (e.g. 5000x) is to be realized. One can envision a solution where a centralized entity on top of
small cells solves the problems mentioned above and more (this is along the lines of the already
proposed in 3GPP cloud‐RAN approach). For instance, solving a very complicated optimization problem
maximizing network capacity (e.g. to achieve 5000x), subject to a minimum link quality (to aid mobility)
and backhaul constraints (like cells with poor backhaul serve limited number of users). The outcome
would be what transmit power distribution to be used across cells, what mobility parameter
configuration to be used and how to distribute the load across cells. In addition, this central server can
configure small cells to avoid problems like cell ambiguity and enable cells with neighbor lists to aid
mobility.
A different approach would be to solve the same problem but in a distributed manner where cells take
local decisions that converge to the optimal solution globally. In addition, cells can be self‐configured in
efficient way to avoid cell ambiguity and automatically finds their neighbor lists to aid mobility.
A third, and more realistic approach would be a hybrid centralized‐distributed solution where tasks that
are global in nature and/or don’t require high backhaul bandwidth can be addressed in a centralized
way, while tasks that are local in nature (such as mobility) and/or have the tendency to stress the
backhaul bandwidth can be left to individual cells to tackle.
Splitting SON features between centralized and distributed architecture is not an easy problem and does
depend on many factors; the two most important ones may be cells density and type of deployment
(Hotspots, Enterprise, residential, etc.).

IWPCUltraHighCapacityNetworksWhitePaperVersion1.1 Page80
Do Not Copy or Distribute to ANY third party without prior written permission from IWPC © 2014, IWPC, TEL: +1‐215‐293‐9000, [email protected]
12 ListofContributors
Company Contact
Agilent Technologies Moray Rumney
Agilent Technologies Bob Cutler
Alcatel‐Lucent Stephen A. Wilkus
Blackberry Daniel Badiere
Blackberry Dr. Yan Xin
Blackberry Dongsheng Yu
Broadcom Nick Ilyadis
China Mobile Clark (Kuilin) Chen
CommScope, Inc. Ray Butler
CommScope, Inc. Phillip Sorrells
DragonWave, Inc. Erik Boch
Ericsson Erik Dahlman
Ericsson Hossam Hmimy, PhD
Fraunhofer Heinrich Hertz Institute Dr. Wilhelm Keusgen
Huawei Technologies Co., Ltd Chin Chiu
InterDigital Communications, LLC Douglas Castor
InterDigital Communications, LLC Philip Pietraski, PhD
InterDigital Communications, LLC Tao Deng
IWPC Graham Carter
IWPC – retired Don Brown
New York University Prof. Theodore S. Rappaport
Nokia Solutions and Networks Amitava Ghosh, PhD
Nokia Solutions and Networks Harri Holma
Northrop Grumman Stephen J. Sarkozy, PhD
Qualcomm, Inc. Jean Au
Qualcomm, Inc. Tamer Kadous
Samsung Telecommunications America Rakesh Taori
Siklu Communications Izik Kirshenbaum
Sony Mobile Dr. Peter Karlsson
TriQuint Semiconductor Brian P. Balut
TriQuint Semiconductor John Bellantoni
TriQuint Semiconductor Elias Reese
TriQuint Semiconductor Sumit Tomar
IWPCUltraHighCapacityNetworksWhitePaperVersion1.1 Page81
Do Not Copy or Distribute to ANY third party without prior written permission from IWPC © 2014, IWPC, TEL: +1‐215‐293‐9000, [email protected]
13 Listofacronyms
ADC Analog‐to‐Digital Converter ANR Automatic Neighbor Relation AOA Angle of Arrival AP Access Point AOD Angle of Departure CAGR Compound Annual Growth Rate CDN Content Delivery Network CE Channel Element CoMP Co‐Ordinated Multipoint CMOS Complementary Metal Oxide Semiconductor CP Cyclic Prefix CPE Customer Premises Equipment CP‐SC Cyclic Prefixed Single Carrier CRC Cyclic Redundancy Check CSI Channel State Information CSG Closed Subscriber Group DAC Digital‐to‐Analog Converter DL Downlink EIRP Effective Isotropic Radiated Power EPC Evolved Packet Core eNB Evolved Node B E‐UTRAN Evolved Universal Terrestrial Radio Access Network FDD Frequency Division Duplex HARQ Hybrid Automatic Request ICIC Inter‐Cell Interference Coordination IF Intermediate Frequency ISD Inter‐Site Distance ITU‐R International Telecommunications Union Radiocommunication Sector LCP Liquid Crystal Polymer LIPA Local IP Access LOS Line of Sight LPWA Low Power Wide Area LTCC Low Temperature Co‐fired Ceramic LTE Long Term Evolution (of UMTS) LSA Licensed Shared Access MAC Medium Access Control mB mm‐wave Basestation mBA mm‐wave Basestation Aggregation MC‐CDMA Multi‐carrier Code Division Multiple Access METIS Mobile and wireless communications Enablers for the Twenty‐twenty Information Society MME Mobility Management Entity MMSR Minimum Mean Squared Error MOU Minutes of Use MRO Mobility Robustness Optimization
IWPCUltraHighCapacityNetworksWhitePaperVersion1.1 Page82
Do Not Copy or Distribute to ANY third party without prior written permission from IWPC © 2014, IWPC, TEL: +1‐215‐293‐9000, [email protected]
MRT Maximum Ratio Transmission MU Multi User NCP‐SC Null CP‐SC NLM Network Listening Module NLOS Non‐Line‐of‐Sight NRT Neighbor Relation Table OFDM` Orthogonal Frequency Division Multiplexing OFDMA Orthogonal Frequency Division Multiple Access OLOS Obstructed Line‐of‐Sight OTT Over the Top PAPR Peak to Average Power Ratio PBCH Physical Broadcast Channel PCFICH Physical Control Format Indicator Channel PCI Physical Cell Identity PDCCH Physical Downlink Control Channel PDCP Packet Data Convergence Protocol PDP Power Delay Profile PDSCH Physical Downlink Shared Channel P‐GW Packet Data Network Gateway PHICH Physical Hybrid ARQ Indicator Channel PHY Physical Layer PMCH Physical Multicast Channel PN Pseudorandom Number PRACH Physical Random Access Channel PSC Primary Scrambling Code PMP Point to Multipoint PTP Point to Point PUCCH Physical Uplink Control Channel PUSCH Physical Uplink Shared Channel RAN Radio Access Network RZF Regularized Zero Forcing SAS Spectrum Authorization Systems SC‐FDMA Single‐Carrier Frequency Division Multiple Access SCM Spatial Channel Model SC‐OFDM Single Carrier OFDM S‐GW Serving Gateway SIPTO Selective IP Traffic Offload SON Self Organizing Network SVD Singular Value Decomposition TDD Time Division Duplex TTI Transmission Time Interval UE User Equipment UL Uplink ZT‐OFDM Zero Tailed OFDM
IWPCUltraHighCapacityNetworksWhitePaperVersion1.1 Page83
Do Not Copy or Distribute to ANY third party without prior written permission from IWPC © 2014, IWPC, TEL: +1‐215‐293‐9000, [email protected]
14 References
1. METIS. Deliverable D1.1: ICT‐317669 METIS project, “Scenarios, requirements and KPIs for 5G mobile
and wireless system”. METIS Project. [Online] May 29, 2013. [Cited: 10 29, 2013.] amazingly fast, great
service in a crowd, ubiquitous things communicating, best experience follows you, super real time and
reliable connections . https://www.metis2020.com/wp‐content/uploads/2013/05/METIS_D1.1_v1.pdf.
Deliverable D1.1.
2. Gordon Mansfield. Mobile data traffic on AT&T’s network has increased more than 30,000% (2007 –
2012). . AT&T Connecting your World, AT&T Small Cells. [Online] AT&T, May 8, 2013. [Cited: Oct 1,
2013.] http://www.att.com/gen/press‐room?pid=23971.
3. Traffic types and growth in backbone networks. A. Gerber, R. Doverspike. Los Angeles, CA : NFOEC,
2011. Optical Fiber Communication Conference and Exposition (OFC/NFOEC) 2011 and the National
Fiber Optic Engineers Conference. Vols. March 6‐10, 2011, pp. 1,3. ISBN: 978‐1‐4577‐0213‐6.
4. CISCO VNI. Cisco VNI Mobile Forecast, 2013. CISCO VNI Mobile Forecast. [Online] August 2013, CISCO,
August 2013. [Cited: October 1, 2013.]
http://www.cisco.com/en/US/solutions/collateral/ns341/ns525/ns537/ns705/ns827/white_paper_c11‐
520862.html.
5. Ericsson. Ericsson Mobility Report, On the pulse of the networked society, August 2013, last accessed
Sept. 2013:. Ericsson Mobility Report. [Online] August 2013. [Cited: September 18, 2013.]
www.ericsson.com/ericsson‐mobility‐report .
6. Ericsson Traffic Explorer. Traffic Exploration. [Online] Ericsson, August 2013.
http://www.ericsson.com/TET/trafficView/loadBasicEditor.ericsson.
7. Moore, Geoffrey A. Crossing the Chasm: Marketing and Selling High‐Tech Products to Mainstream
Customers. s.l. : Harper Business Essentials., 1998. ISBN: 0‐06‐051712‐3.
8. Future Wireless Opportunities for Millimeter Wave Systems. Castor, Doug. Guilford : s.n., 2013.
9. 3GPP. Scenarios and requirements for small cell enhancements. March 2013. TR 36.932.
10. 3GPP. Small cell enhancements for E‐UTRA and E‐UTRAN. Dec 2013. TS 36.872.
11. 3GPP. Study on Small Cell enhancements for E‐UTRA and E‐UTRAN;. Dec 2013. TR 36.842.
12. Millimeter Wave Mobile Communications for 5G Cellular: It Will Work! Rappaport, T.S., et al., et al.
1, s.l. : IEEE Access Journal, May 2013, Vol. 1.
13. Opportunistic Third‐Party Backhaul for Cellular Wireless Networks. Ford, R., Kim, C. and Rangan, S.
s.l. : arXiv preprint arXiv:1305.0958, May 4, 2013.
IWPCUltraHighCapacityNetworksWhitePaperVersion1.1 Page84
Do Not Copy or Distribute to ANY third party without prior written permission from IWPC © 2014, IWPC, TEL: +1‐215‐293‐9000, [email protected]
14. ITU‐R. WORKING DOCUMENT TOWARDS A PRELIMINARY DRAFT NEW REPORT ITU‐R M.[IMT.ABOVE
6 GHz]. Feb 2014.
15. Millimeter Wave Picocellular System Evaluation for Urban Deployments. Akdeniz, M.R., et al., et al.
s.l. : arXiv preprint arXiv:1304.3963, April 15, 2013.
16. Rappaport, T.S. Wireless Communications: Principles and Practice (2nd Edition). Upper Saddle Rver,
NJ : Prentice Hall, 2002.
17. State of the art in 60 GHz Integrated Circuits and Systems for Wireless Communications. Rappaport,
T.S., Murdock, J. and Gutierrez, F. s.l. : Proceedings of the IEEE, August 2011. Vol. 99, pp. 1390‐1436. 8.
18. Rappaport, T.S. Wireless Communications: Principles and Practice. Prentice Hall, NJ : Pearson, 2002.
19. IST‐WINNER II. WINNER II Channel Models. WINNER II ‐ Public Deliverables. [Online] 9 30, 2007.
[Cited: 10 8, 2013.] http://www.ist‐winner.org/deliverables.html. D1.1.2.
20. WINNER+. WINNER+ Final Channel Models . CELTIC‐Initiative. [Online] 6 30, 2010. [Cited: 10 8,
2013.] http://projects.celtic‐initiative.org/winner+/WINNER+%20Deliverables/D5.3_v1.0.pdf. D5.3.
21. Crosscorrelation between the envelopes of 900 MHz signals received at a mobile radio base station
site. F. Adachi, M.T. Feeney, A.G. Williamson and J.D. Parsons. s.l. : IEE, October, 1986. Vol. 133, p. F(6).
IEE Proceedings.
22. Further advancements for E‐UTRA physical layer aspects,. 3rd Generation Partnership Project. s.l. :
3GPP, 2010. TR 36.814 V9.0.0 (2010‐03).
23. 28 GHz Propagation Measurements for Outdoor Cellular Communications Using Steerable Beam
Antennas in New York City. Azar, Y., et al., et al. s.l. : IEEE International Conference on Communications
(ICC), June 9‐13, 2013.
24. Rain Attenuation in Millimeter Wave Ranges. Li, Q. Zhao and J. Guilin, China : International
Symposium on Antennas, Propagation and EM Theory, 2006.
25. State of the Art in 60‐GHz Integrated Circuits and Systems for Wireless Communications. T. S.
Rappaport, J. N. Murdock, and F. Gutierrez. No. 8, pp. 1390–1436, s.l. : Proceedings of the IEEE, August
2011, Vol. 99.
26. On‐chip integrated antenna structures in CMOS for 60 GHz WPAN systems. Gutierrez, F., et al., et al.
8, s.l. : IEEE J. Sel. Areas Communications, October 2009, Vol. 27, pp. 1367‐1378.
27. Consumption Factor and Power‐Efficiency Factor: A Theory for Evaluating the Energy Efficiency of
Cascaded Communication Systems. Murdock, J. and Rappaport, T. 12, s.l. : Selected Areas in
Communications, IEEE Journal, December 2014, Vol. 32.
IWPCUltraHighCapacityNetworksWhitePaperVersion1.1 Page85
Do Not Copy or Distribute to ANY third party without prior written permission from IWPC © 2014, IWPC, TEL: +1‐215‐293‐9000, [email protected]
28. A note on a simple transmission formula. Friis, H. s.l. : Proceedings of the IRE, 1946. Vol. 5, pp. 254‐
256.
29. The indoor radio propagation channel. Hashemi, H. s.l. : Proceedings of the IEEE, 1993. Vol. 7, pp.
943‐968.
30. MPM – an atmospheric millimeter wave propagation model. Liebe, H. J. s.l. : Infrared and Millimeter
Waves, International Journal on, 1989, Vol. 10, pp. 631‐650.
31. Measurements and models for 38‐GHz point‐to‐multipoint radiowave propagation. Xu, H., et al., et
al. s.l. : IEEE J. Sel. Areas Comm., 2000, Vol. 18, pp. 310‐321.
32. Transmission and isolation of signals in buildings at 60 GHz. Correia, L. M. and Frances, P.O. s.l. :
Sixth IEEE International Symposium, 1995. Vol. 3, pp. 1031‐1034.
33. Measurement of the complex refractive index of concrete at 57.5 GHz. Sato, K., et al., et al. s.l. :
Antennas and Propagation, IEEE Transactions on, 1996. Vol. 44, pp. 35‐40.
34. Millimeter Wave Cellular Communication Measurements for Reflection and Penetration Loss in and
Around Buildings in New York City. Zhao, Hang et al. Budapest : IEEE International Conference on
Communications, June 2013.
35. Measurements and models for radio path loss and penetration loss in and around homes and trees at
5.85 GHz. Durgin, G., Rappaport, T. and Xu, H. s.l. : Communications, IEEE Transcations on, 1998. Vol.
11, pp. 1484‐1496.
36. Radio‐wave propagation for emerging wireless personal‐communication systems. Sandhu, S. and
Rappaport, T.S. s.l. : IEEE Antennas and Propagation Magazine, 1994, Vol. 36, pp. 14‐24.
37. Review of constitutive parameters of building materials. Stavrou, S. and Saunders, S. s.l. : Antennas
and Propagation, 12th International Conference on (Conf. Publ. No. 491), 2003. Vol. 1, pp. 211‐215.
38. Reflection and transmission behaviour of building materials at 60 GHz. Langen, B., Lober, G. and
Herzig, W. s.l. : Personal, Indoor and Mobile Radio Communications ‐ Wireless Networks, Catching the
Mobile Future, 1994, Vol. 2, pp. 505‐509.
39. Propagation Measurements and Models for Wireless Communication CHannels. Andersen, J.,
Rappaport, T. and Yoshida, S. s.l. : Communications Magazine, 1995, Vol. 33, pp. 42‐49.
40. Nie, S., et al., et al. London : 24th Annual IEEE International Symposium on Personal, Indoor and
Mobile Radio Communications (PIMRC), 2013.
41. Propagation prediction models for wireless communication systems. Iskander, M.F. and Yun, Z. s.l. :
Microwave Theory and Techniques, IEEE Transactions on, 2002. Vol. 3, pp. 662‐673.
IWPCUltraHighCapacityNetworksWhitePaperVersion1.1 Page86
Do Not Copy or Distribute to ANY third party without prior written permission from IWPC © 2014, IWPC, TEL: +1‐215‐293‐9000, [email protected]
42. Parsons, J.D. [ed.] John Wiley & Sons Ltd. 2. s.l. : The Mobile Radio Propagation Channel, 2000.
43. A comparison of theoretical and empirical reflection coefficients for typical exterior wall surfaces in a
mobile radio environment. Landron, O., Feuerstein, M. and Rappaport, T. s.l. : Antennas and
Propagation, IEEE Transactions on, 1996, Vol. 44, pp. 341‐351.
44. Broadband Millimeter‐Wave Propagation Measurements and Models Using Adaptive‐Beam
Antennas for Outdoor Urban Cellular Communications. Rappaport, T.S., et al., et al. s.l. : IEEE Trans.
Antennas and Propagation, 2013. Vol. 61, pp. 1850, 1859.
45. Millimeterwave 60 GHz Outdoor and Vehicle AOA Propagation Measurements Using a Broadband
Channel Sounder. Ben‐Dor, E., et al., et al. s.l. : Global Telecommunications Conference (GLOBECOM
2011), 2011. pp. 1‐6.
46. Cellular and Peer‐to‐Peer Broadband Millimeter Wave Outdoor propagation measurements and
Angle of Arrival characteristics using adaptive beam steering. Rappaport, T.S., et al., et al. Santa Clara,
CA : IEEE Radio and Wireless Symposium (RWS), 2012.
47. Al‐Nuaimi, M. and Hammoudeh, A. Measurements and Predictions of Attenuation and Scatter of
Microwave Signals by Trees. 1994. pp. 70‐76. Vol. 141.
48. Millimeter‐wave propagation in vegetation: experiments and theory. Schwering, F., Violette, E. and
Espeland, R. s.l. : Geoscience and Remote Sensing, IEEE Transactions on, 1988. Vol. 26, pp. 355‐367.
49. Fading characteristics of RF signals due to foliage in frequency bands from 2 to 60 GHz. Perras, S. and
Bouchard, L. s.l. : Wireless Personal Multimedia Communications, The 5th International Symposium on,
2002. pp. 267‐271.
50. Vegetation attenuation: modelling and measurements at millimetric frequencies. Seville, A. s.l. :
Antennas and Propagation, Tenth International Conference on (Conf. Publ. No. 436), 1997. Vol. 2, pp. 5‐
8.
51. 28 GHz Angle of Arrival and Angle of Departure Analysis for Outdoor Cellular Communications using
Steerable Beam Antennas in New York City. Samimi, M., et al., et al. s.l. : IEEE Vehicular Technology
Conference (VTC), 2013.
52. 72 GHz millimeter wave indoor measurements for wireless and backhaul communications. S. Nie, et
al. s.l. : Personal Indoor and Mobile Radio Communications (PIMRC) IEEE 24th International Symposium ,
September 2013.
53. 38 GHz and 60 GHz angle‐dependent propagation for cellular & peer‐to‐peer wireless
communications. Rappaport, T., et al., et al. s.l. : Communications (ICC), IEEE International Conference
on, 2012. pp. 4568‐4573.
IWPCUltraHighCapacityNetworksWhitePaperVersion1.1 Page87
Do Not Copy or Distribute to ANY third party without prior written permission from IWPC © 2014, IWPC, TEL: +1‐215‐293‐9000, [email protected]
54. Multi‐beam Antenna Combining for 28 GHz Cellular Link Improvement in Urban Environments. Sun,
S. and Rappaport, T.S. Atlanta, GA : IEEE Global Communications Conference (GLOBECOM), 2013.
55. Path loss, delay spread, and outage models as functions of antenna height for microcellular system
design. Feuerstein, M., et al., et al. s.l. : Vehicular Technology, IEEE Transactions on, 1994. Vol. 3, pp.
497‐498.
56. Path loss and multipath delay statistics in four European cities for 900 MHz cellular and microcellular
communications. Seidel, S., Rappaport, T. and Singh, R,. s.l. : Electronics Letters, 1990, Vol. 26, pp.
1713‐1715.
57. Characterisation of propagation in 60 GHz radio channels. Smulders, P.F.M. and Correia, L.M. s.l. :
Electronics & Communication Engineering Journal, 1997, Vol. 9, pp. 73‐80.
58. Wideband characterisation of the propagation channel for outdoors at 60 GHz. Correia, L. and Reis,
J. s.l. : Personal, Indoor and Mobile Radio Communications, Seventh IEEE International Symposium,
1996. Vol. 2, pp. 752‐755.
59. Bischl, H. and Schafer, W. The 60 GHz mobile‐to‐mobile radio channel fading statistics and estimated
packet error rates. s.l. : Vehicular Technology Conference, IEEE 44th, 1994. pp. 910‐913. Vol. 2.
60. Indoor and outdoor frequency measurements for mm‐waves in the range of 60 GHz. Matic, D.,
Harada, H. and Prasad, R. s.l. : Vehicular Technology Conference ‐ VTC98, 48th IEEE, 1998. Vol. 1, pp.
567‐571.
61. Channel feasibility for outdoor non‐line‐of‐sight mmwave mobile communication. Rajagopal, S., Abu‐
Surra, S. and MalmirChegini, M. s.l. : Vehicular Technology Conference, VTC Fall, 2012. pp. 1‐6.
62. Cellular broadband millimeter wave propagation and angle of arrival for adaptive beam steering
systems (invited paper). Rappaport, T., et al., et al. s.l. : Radio and Wireless Symposium (RWS), IEEE,
2012. pp. 151‐154.
63. Propagation characteristics at 60 GHz for ITS inter‐vehicle communications. Kato, A., Sato, K. and
Fujise, M. s.l. : IEICE transactions on communications, 2000. Vols. E84‐B.
64. Indoor and outdoor propagation measurements at 5 and 60 GHz for radio LAN application. Plattner,
A., Prediger, N. and Herzig, W. s.l. : Microwave Symposium Digest, IEEE MTT‐S International, 1993, Vol.
2, pp. 853‐856.
65. Experimental propagation channel characterization of mm‐wave radio links in urban scenarios. Kyro,
M., Kolmonen, V. and Vainikainen, P. s.l. : Antennas and Wireless Propagation Letters, IEEE, 2012, Vol.
11, pp. 865‐868.
IWPCUltraHighCapacityNetworksWhitePaperVersion1.1 Page88
Do Not Copy or Distribute to ANY third party without prior written permission from IWPC © 2014, IWPC, TEL: +1‐215‐293‐9000, [email protected]
66. Impact of antenna configuration and shadowing on the characteristics of the 60 GHz indoor
wideband radio channel. Peter, M and Keusgen, W. s.l. : XXIXth General Assembly of the International
Union of Radio Science, URSI GA, 2008.
67. Measurement and analysis of the 60 GHz in‐vehicular broadband radio channel. Peter, M., Keusgen,
W. and Schirrmacher, M. s.l. : Vehicular Technology Conference, VTC 2007 ‐ Fall, 2007.
68. IST‐4‐027756 WINNER II D1.1.2, WINNER II channel models, ver. 1.1. Kyösti, P., et al., et al. s.l. : Tech.
Rep., 2007.
69. A street canyon approximation model for the 60 ghz propagation channel in an urban environment
with rough surfaces. Rasekh, M., Farzaneh, F. and Shishegar, A. s.l. : Telecommunications (IST), 5th
International Symposium on, 2010. pp. 132‐137.
70. Parker, T. OFDM non‐line of sight to dominate small cell backhaul in 2017. FierceBroadbandWireless.
[Online] September 12, 2012. http://www.fiercebroadbandwireless.com/story/abi‐ofdm‐non‐line‐sight‐
dominate‐small‐cell‐backhaul‐2017/2012‐09‐12?utm_medium=nl&utm_source=internal.
71. Air‐Interface Design and Ray‐Tracing Study for 5G Millimeter Wave Communications. S. Larew, T.
Thomas, M. Cudak and A. Ghosh. s.l. : Proc. IEEE Globecomm, December 2013.
72. Zero‐tail DFT‐spread‐OFDM signals. Gilberto Berardinell, Fernando M. L. Tavares, Troels B.
Sørensen, Preben Mogensen, and Kari Pajukoski,. s.l. : Proc. IEEE Globecomm, December 2013.
73. NGMN Alliance. Small Cell Backhaul Requirements. [Online]
http://www.ngmn.org/fileadmin/user_upload/Downloads/Technical/NGMN_Whitepaper_Small_Cell_B
ackhaul_Requirements.pdf.
74. Scaling Up MIMO. Rusek, F., et al. s.l. : IEEE Signal Processing Magazine, 2013.
75. Low Complexity Precoding for Large Millimeter Wave MIMO Systems. Ayach, O.E., Heath, R., et al.
s.l. : Proc. of IEEE International Conference on Communications, 2012.
76. MIMO Systems with Mutual Coupling: How Many Antennas to Pack into Fixed‐Length Arrays? Shen,
S., et al. Taichung, Taiwan : ISITA2010, 2010.
77. Performance and Feasibility of mmWave Beamforming Prototype for 5G Cellular Communications.
Samsung. s.l. : IEEE ICC, 2013.
78. The Capacity Optimality of Beam Steering in Large Millimeter Wave MIMO Systems. Ayach, O.E.,
Heath, R., et al. s.l. : IEEE 12th International Workshop on Signal Processing Advances in Wireless
Communications, 2012.
79. Massive MIMO in the UL/DL of Cellular Networks: How Many Antennas Do We Need? Hoydis, J., et
al. s.l. : IEEE Journal on Selected Areas in Communications, 2013, Vol. 31.
IWPCUltraHighCapacityNetworksWhitePaperVersion1.1 Page89
Do Not Copy or Distribute to ANY third party without prior written permission from IWPC © 2014, IWPC, TEL: +1‐215‐293‐9000, [email protected]
80. Pilot Contamination and Precoding in Multi‐Cell TDD Systems. Jose, J., et al. s.l. : IEEE Transactions on
Wireless Communications, 2011. Vol. 8.
81. Hybrid Precoding for Millimeter Wave Cellular Systems with Partial Channel Knowledge. Alkahateeb,
A., et al. s.l. : Information Theory and Application Workshop, 2013.
82. Xu, H., Kukshya, V., Rappaport, T. Spatial and temporal characteristics of 60 GHz indoor channels.
s.l. : IEEE Journal on Selected Areas in Communications, 2002. pp. 620‐630. Vol. 3.
83. Antennas in Cellular Phones for Mobile Communications. Ying, Z. s.l. : Proceedings of the IEEE, 2012.
Vol. 100.
84. The Multicell Multiuser MIMO Uplink with Very Large Antenna Arrays and a Finite‐Dimensional
Channel. Ngo, H.Q., et al. s.l. : IEEE Transactions on Communications, 2013.
85. Decoupling of Multiple Antennas in Terminals with Chassis Excitation Using Polarization Diversity,
Angle Diversity and Current Control. Li, H., et al. s.l. : IEEE Transactions on Antennas and Propagation,
2012, Vol. 60.
86. Rappaport, T., et al. State of the Art in 60‐GHz Integrated Circuits and Systems for Wireless
Communications. s.l. : Proceedings of the IEEE, 2011. Vol. 99.
87. 60 GHz Wireless: Up Close and Personal. Daniels, R.C., et al. s.l. : IEEE Microwave Magazine, 2010.