Embed Size (px)
Citation preview

Evolutionary development of the plant
spore and pollen wall
A thesis submitted by
Simon Wallace
for the degree of Doctor of Philosophy
Department of Animal and Plant Sciences
August 2013

i
Acknowledgements
I am very grateful to my supervisors, Prof. Andrew Fleming, Prof. David Beerling and
Prof. Charles Wellman, for their support and encouragement throughout this project.
I would like to express my gratitude to Bob Keen, Heather Walker and Marion Bauch
for their invaluable assistance and advice in D59 lab; my postgraduate colleagues, Dr
Hoe Han Goh, Dr Xiaojia Yin, Dr Adam Hayes, Dr Chloé Steels, Supatthra
Narawatthana, Rachel George, Amin Adik, Dr Jen Sloan, Bobby Caine, Thomas
Harcourt, Julia Van Campen, Sam Amsbury, Jenn Dick, Dr Phakpoom Phraprasert,
Ross Carter, Dr Kate Allinson, Dr Janine Pendleton, Dr Brian Pedder, Faisal
Abuhmida, Doreen Mkuu, Sam Slater, Dr Joe Quirk, Dr Lyla Taylor and Dr Claire
Humphreys for their support and banter during my time in Sheffield; and to all my
other friends in the Department of Animal and Plant Sciences.
Many thanks also go to Dr Steve Rolfe for offering his expertise and time with regards
to microarray analysis; James Mason for his generous help with Raman
microspectroscopy; Prof. Mike Burrell for his general laboratory advice and guidance;
Dr Steve Ellin for his assistance in preparing palynological samples; Chris Hill and
Svet Tzokov for sharing their electron microscopy expertise; and Dr Katie Field and
Dr Timmy O’Donoghue and other members of the Beerling lab for their jollity and
support.
Special thanks go to Dr Caspar Chater for his unstinting and generous support, advice
and friendship. Enormous thanks also go to various collaborators and correspondents;
Dr Andrew Cuming, Dr Yasuko Kamisugi, Scott Schuette, Prof. Roy Brown and Prof.
Ralf Reski.
I gratefully acknowledge the Natural Environment Research Council (NERC) for
funding my PhD studentship. I also would like to acknowledge my undergraduate
tutors, Dr Richard Lindsay and Dr John Rostron whose love of the natural world
assured me that quitting a career in insurance to enrol at university was a good
decision.

ii
Finally, I would like to dedicate this thesis to my parents who I am very lucky to have
in my life.

iii
Abstract
The origin of land plants required aquatic green algal ancestors to evolve a number of
key adaptations that enabled them to overcome physiological difficulties associated
with survival in the harsh subaerial environment. One of these key adaptations was
the development of a durable spore wall structure, containing a sporopolleninous
exine layer, to withstand attrition, desiccation and exposure to UV-B radiation. All
land plants (embryophytes) possess such walled spores (or their homologue pollen).
However, the spore/pollen wall became more complicated over time, via a series of
additional developmental steps, as it began to serve an increasing number of functions.
A significant amount of study has been conducted with regards to the molecular
genetics of pollen wall development in the angiosperm, Arabidopsis thaliana (L.),
particularly with respect to the exine layer and sporopollenin biosynthesis. However,
research into the molecular genetics of spore wall development in basal plants has
thus far been extremely limited. In this thesis, the results of a fully replicated
microarray analysis at early and mid stages of sporogenesis in the free-sporing model
moss Physcomitrella patens, have allowed up and down regulated genes to be
compared with those known to be involved in pollen wall development, therefore
facilitating the identification of candidate genes likely to be involved in the
development of the spore wall. Additionally, by way of a gene knock-out experiment
with P. patens, this study demonstrates that the MALE STERILITY 2 (MS2) gene,
which is involved in wall development in the pollen of A. thaliana, is highly
conserved and has a similar function in P. patens. However, the moss homologue of
MS2 is shown to be unable to recover functionality in A. thaliana indicating that the
MS2 gene, although conserved, has evolved in angiosperms as their pollen walls have
increased in complexity.
Portions of this thesis have been published in peer-reviewed journals. The references for these
publications are as follows:
Wallace S, Fleming A, Wellman CH, Beerling DJ. 2011. Evolutionary development of the plant
spore and pollen wall. AoB Plants, plr027 doi:10.1093/aobpla/plr027.
O’Donoghue M, Chater C, Wallace S, Gray JE, Beerling DJ, Fleming AJ. 2013. Genome-wide
transcriptomic analysis of the sporophyte of the moss Physcomitrella patens. Journal of
Experimental Botany, 64(12): 3567-3581.

iv
Contents Page
Acknowledgements i
Abstract iii
Contents iv
List of figures viii
List of tables x
List of appendices xi
List of abbreviations/acronyms xii
CHAPTER 1 General Introduction 1-25
1.1 Introduction 1
1.2 Spore/pollen wall structure and development 2
1.2.1 Sporogenesis 3
1.2.2 Modes of sporopollenin deposition in spore and pollen walls 3
1.2.3 Spore wall development in bryophytes 5
1.2.4 Spore wall development in pteridophytes 6
1.2.5 Pollen wall development in gymnosperms 9
1.2.6 Pollen wall development in angiosperms 9
1.3 Molecular genetics of pollen wall development 11
1.3.1 Arabidopsis thaliana genes implicated in sporopollenin biosynthesis
and exine formation 11
1.3.2 Arabidopsis thaliana transcription factors involved in
sporopollenin and exine formation 16
1.3.3 Arabidopsis thaliana genes associated with probaculae formation 18
1.3.4 Arabidopsis thaliana genes connected to intine formation 19
1.3.5 Arabidopsis thaliana genes implicated in callose wall formation 20
1.3.6 Arabidopsis thaliana genes involved in tetrad separation 21
1.4 The utility of Physcomitrella patens 22
1.5 Research outline 23
1.5.1 Aims 24
1.5.2 Objectives 24
1.5.3 Hypotheses 25
1.6 Thesis outline 25
CHAPTER 2 Materials and Methods 26-58
2.1 Materials 26
2.1.1 General laboratory materials 26
2.1.2 Plasmids 27
2.1.3 Bacterial strains 27
2.1.4 Plant Materials 28
2.2 Plant growth conditions and tissue culture 28
2.2.1 Arabidopsis thaliana 28

v
2.2.2 Physcomitrella patens 28
2.2.3 Protonemal culture and maintenance 28
2.2.4 Gametangia and sporophyte induction 29
2.2.5 Spore germination 29
2.3 Bioinformatics 30
2.3.1 Genome searches 30
2.3.2 Transcriptomic microarray preparation, design and analysis 30
2.3.3 Sequence alignment and phylogenetic analyses 32
2.4 Nucleic acid techniques 33
2.4.1 Plant genomic DNA extraction 33
2.4.2 Plant total RNA extraction 35
2.4.3 DNA and RNA quantification 36
2.4.4 Reverse transcription/cDNA synthesis 36
2.4.5 Polymerase chain reaction (PCR) 37
2.4.6 Semi-quantitative reverse transcription PCR (sq-RT-PCR) 39
2.4.7 Agarose gel electrophoresis 39
2.4.8 DNA gel extraction 40
2.4.9 Ethanol precipitation of DNA 41
2.4.10 Southern blot 41
2.5 Cloning techniques 45
2.5.1 Generation of ATMS2pro::PPMS2-1 and
ATUBQ14pro::PPMS2-1 constructs 45
2.5.2 Generation of Physcomitrella patens MS2-1 knock-out construct 46
2.5.3 Generation of PPMS2-1pro::GUS construct 47
2.5.4 DNA ligation 49
2.5.5 pENTRTM/D-TOPO® topoisomerase reaction 50
2.5.6 LR clonase reaction 51
2.5.7 Transformation of competent Escherichia coli 51
2.5.8 Plasmid DNA preparation 52
2.6 Transformation of Arabidopsis thaliana with Agrobacterium tumefaciens 53
2.6.1 Transformation of Agrobacterium tumefaciens with plasmid DNA 53
2.6.2 Preparation of Agrobacterium tumefaciens for floral dipping 53
2.6.3 Agrobacterium tumefaciens-mediated transformation of
Arabidopsis thaliana by floral dipping 54
2.6.4 Polyethylene glycol (PEG)-mediated transformation of Physcomitrella
patens 54
2.7 Phenotypic analyses 56
2.7.1 Scanning electron microscopy (SEM) 56
2.7.2 Transmission electron microscopy (TEM) 57
2.7.3 Spore germination test 57
2.7.4 Acetolysis 57
2.7.5 Raman microspectroscopy 58

vi
CHAPTER 3 The development of the Physcomitrella patens sporophyte 59-74
3.1 Introduction 59
3.2 Results 63
3.2.1 The life cycle of Physcomitrella patens 63
3.2.2 Sporogenesis and spore wall development in
Physcomitrella patens 65
3.3 Discussion 68
3.3.1 Life cycle variation among Physcomitrella patens ecotypes 68
3.3.2 Revision of developmental staging of sporogenesis 68
3.3.3 Development of the Physcomitrella patens spore wall 70
3.4 Summary 73
CHAPTER 4 Identification of candidate spore wall genes in Physcomitrella
patens 75-101
4.1 Introduction 75
4.2 Results 79
4.2.1 Physcomitrella patens and Selaginella moellendorffii genome search
results 79
4.2.2 Microarray analysis: expression profiles of spore wall candidate
genes during sporophyte development 79
4.2.3 Phylogenetic analyses 86
4.2.4 Electron microscope analysis of Arabidopsis thaliana ms2
and rpg1 pollen wall phenotypes 86
4.2.5 Sequence alignment and transcript analysis of MS2 homologues 92
4.3 Discussion 93
4.3.1 Flowering plant homologue genes for spore wall development are
present in Physcomitrella patens and Selaginella
moellendorffii 93
4.3.2 Identification of lead genes for further investigation 93
4.3.2.1 Putative Physcomitrella patens tetrad separation genes 95
4.3.2.2 Putative Physcomitrella patens sporopollenin
biosynthesis/exine genes 96
4.4 Summary 101
CHAPTER 5 Functional analysis of the MS2-like gene in spore wall
morphogenesis in Physcomitrella patens 102-120
5.1 Introduction 102
5.2 Results 104
5.2.1 Generation and molecular analysis of Physcomitrella patens
PPMS2-1 knock-out lines and Arabidopsis thaliana PPMS2-1
gain-of-function lines 104
5.2.2 Phenotypic analysis of ppms2-1 spores 106

vii
5.2.3 Phenotypic analysis of Arabidopsis thaliana ms2 mutants
transformed with PPMS2-1 114
5.3 Discussion 114
5.3.1 Role of PPMS2-1 in spore wall development in
Physcomitrella patens 114
5.3.2 Lack of complementation of Arabidopsis thaliana ms2 mutants by
PPMS2-1 117
5.4 Summary 119
CHAPTER 6 General discussion 121-127
6.1 Principle conclusions 121
6.2 Spore wall development in Physcomitrella patens 122
6.3 Identification of candidate spore wall genes in Physcomitrella patens 123
6.4 A core component of the pollen wall developmental pathway appears to
be ancient and highly conserved 124
6.5 Future work 125
6.5.1 Physcomitrella patens spore wall development 125
6.5.2 The fatty acid synthesis component of the sporopollenin biosynthesis
framework 126
6.5.3 The utilisation of emerging model systems and wider implications 127
References 128-142

viii
List of figures Page
Chapter 1
Figure 1.1. Phylogenetic tree for land plant evolution derived from analysis by
Qui et al. (2006) 2
Figure 1.2. Proposed model of spore wall development in Selaginella
microspores 8
Figure 1.3. Diagram of A. thaliana pollen wall structure 10
Figure 1.4. Proposed functions of genes implicated in A. thaliana pollen wall
exine development 14
Chapter 2
Figure 2.1. Density plots showing green (Cy-3) and red (Cy-5) signals distributions
across the microarray chip 32
Figure 2.2. Southern blot assembly for capillary transfer of DNA from an agarose
gel to a nylon membrane as recommended by Roche 43
Figure 2.3. Map of the p$POHA vector used for complementation experiments
involving homologous genes in P. patens (Belin 2006) 46
Figure 2.4. Map of the pMBL8a vector used for generating P. patens knock-out
constructs 47
Figure 2.5. Schematic of the linearised PPMS2-1 knock-out construct used for
PEG-mediated transformation of P. patens 47
Figure 2.6. Map of the pGUSGW, ESfill C1 vector used for generating the
PPMS2-1::GUS construct and subsequently examining the timing and locality of
PPMS2-1 expression 48
Figure 2.7. Detection of seed-expressed GFP in transformed A. thaliana plants 54
Chapter 3
Figure 3.1. The life cycle of P.patens 60
Figure 3.2. Proposed model by Huang et al. (2009) of sporophyte development with
respect to sporogenesis in P. patens. 62
Figure 3.3. Spore germination for two ecotypes of P. patens (Gransden 2004 and
Villersexel K3) under controlled axenic conditions (n=3) 63
Figure 3.4. Sporophyte development in P. patens 66

ix
Figure 3.5. TEM image of mature P. patens sporophyte section. 67
Figure 3.6. Proposed model of spore wall development in P. patens 71
Chapter 4
Figure 4.1. Schematic of metabolic pathways and associated enzymes involved
in pollen wall development 76
Figure 4.2. Developmental stages featured in the microarray experiment 78
Figure 4.3. MA plots for P. patens microarray replicates 82
Figure 4.4. Sq-RT-PCR validation of microarray data 85
Figure 4.5. Phylogenetic analysis of MS2 and homologous proteins 87
Figure 4.6. Maximum parsimony phylogenetic analysis of RPG1 and homologous
proteins 88
Figure 4.7. Electron microscope analysis of ms2 and rpg1 pollen wall phenotypes
in A. thaliana 89
Figure 4.8. Alignment of A. thaliana (At) MS2 protein sequence (AT3G11980)
with putative homologues identified in the ‘lower’ land plant species, P. patens (Pp)
and S. moellendorffii (Sm) 90
Figure 4.9. Schematic of A. thaliana MS2 (AT3G11980) and location of
SAIL_75_E01 and SAIL_92_C07 T-DNA insertion sites 91
Figure 4.10. Exon-intron structure of A. thaliana (At) MS2 and selected
predicted land plant homologues (Os = Oryza sativa; Sm = S. moellendorffii;
Pp = P. patens) 92
Figure 4.11. Model of sporopollenin monomer biosynthesis in A. thaliana tapetal
cells 98
Chapter 5
Figure 5.1. Generation and SEM analysis of P. patens PPMS2-1 knock-out lines
obtained with Villersexel K3 105
Figure 5.2. Generation and SEM analysis of P. patens PPMS2-1 knock-out lines
obtained with Gransden GrD12 107
Figure 5.3. TEM analysis of wildtype (A, C and E) and ppms2-1 (B, D and F)
spore ultrastructure 108
Figure 5.4. Acetolysis of wildtype and ppms2-1 spores 109

x
Figure 5.5. Raman spectra of one representative replicate each of wildtype (A),
ppms2-1 KO1 (B) and KO3 (C) spores 110
Figure 5.6. PCA analysis (baseline corrected and normalised) of Raman spectra
obtained from wildtype, ppms2-1 KO1 and KO3 spores 111
Figure 5.7. Spore germination for P. patens Villersexel K3 wildtype and ppms2-1
KO1, KO2 and KO3 knock-out lines under controlled axenic conditions (n=3) 112
Figure 5.8. Electron microscope analysis of the ATMS2pro::PPMS2-1 pollen
phenotype 113
Figure 5.9. Schematic of ATMS2pro::PPMS2-1 and a ATMS2pro::PPMS2-1
splice variant constructs used for the attempted complementation of A. thaliana
ms2 mutants 118
List of tables Page
Chapter 1
Table 1.1. Arabidopsis thaliana genes implicated in pollen wall development 13
Chapter 2
Table 2.1. Sequences of oligonucleotide pairs used in sq-RT-PCR P. patens
microarray validation 39
Table 2.2. Sequences of oligonucleotide pairs used in cloning experiments
involving A. thaliana and P. patens 48
Chapter 3
Table 3.1. Summary of life cycle stages duration in three P. patens
ecotypes/lines 64
Chapter 4
Table 4.1. TBLASTN results of searches of the genomes of P. patens and S.
moellendorffii with A. thaliana pollen wall genes 80
Table 4.2. Expression profiles of P. patens genes implicated in spore wall
development derived from microarray analysis (gametophyte vs early sporophyte
(GvsES) and gametophyte vs mid sporophyte (GvsMS)) 84

xi
Chapter 5
Table 5.1. Average diameter of P. patens wildtype and ppms2-1 spores (n=12) 107
List of appendices Page
Appendix I. Expression profiles of P. patens genes, homologous to pollen 143
wall associated genes in A. thaliana, derived from microarray analysis
(gametophyte vs early sporophyte).
Appendix II. Expression profiles of P. patens genes, homologous to pollen 150
wall associated genes in A. thaliana, derived from microarray analysis
(gametophyte vs mid sporophyte).

xii
List of abbreviations/acronyms
ATP Adenosine-5'-triphosphate
BDMA Benzyldimethylamine
BSA Bovine serum albumin
CaMV Cauliflower mosaic virus
cDNA Complementary deoxyribonucleic acid
CDS Coding DNA sequence
CIAP Calf intestinal alkaline phosphatase
cm Centimetre
Col-3 Columbia-3
CTAB Cetyltrimethyl ammonium bromide
DIG Digoxigenin
DNA Deoxyribonucleic acid
dNTP Deoxynucleotide Triphosphate
EDTA Ethylenediaminetetraacetic acid
EST Expressed sequence tag
FP Forward primer
FT-IR Fourier transform infrared spectroscopy
g Gram
GFP Green fluorescent protein
GUS Beta-Glucuronidase
HEPES 4-(2-hydroxyethyl)-1-piperazineethanesulfonic acid
JTT Jones-Taylor-Thornton
KOD Thermococcus kodakaraensis
Kv Kilovolt
LB Luria-Bertani
LOESS Locally weighted polynomial regression
M Molar
mg Milligram
mJ Millijoules
ml millilitre
mm millimetre

xiii
mM Millimolar
M-MLV RT Moloney murine leukemia virus reverse transcriptase
mRNA Messenger ribonucleic acid
msec Millisecond
MUSCLE Multiple sequence comparison by log-expectation
NJ Neighbour joining
nM Nanomolar
PCA Principle component analysis
PCR Polymerase chain reaction
PEG Polyethylene glycol
PHD Plant homeo domain
PRM-B Protoplast regeneration medium-bottom layer
PRM-L Liquid protoplast regeneration medium
PRM-T protoplast regeneration medium-top layer
RNA Ribonucleic acid
RNAi RNA interference
RNase Ribonuclease
RO Reverse osmosis
RP Reverse primer
rpm Revolutions per minute
RT-PCR Reverse transcription polymerase chain reaction
SAIL Syngenta arabidopsis insertion library
SD Standard deviation
SDS Sodium dodecyl sulfate
SEM Scanning electron microscope
SNP Single nucleotide polymorphism
SOC Super Optimal broth with Catabolite repression
Sq-RT-PCR Semi-quantitative reverse transcription polymerase chain reaction
SSC Saline-sodium citrate
TAE Tris acetate/EDTA
TAIR The arabidopsis information resource
TBLASTN Protein-nucleotide 6-frame translation basic local alignment
search tool
T-DNA Transferred DNA

xiv
TE Tris/EDTA
TEM Transmission electron microscope
TF Transcription factor
TGR Targeted gene replacement
U Unit
UDP Uridine diphosphate
UV Ultraviolet
V Volt
v/v Volume to volume
WLCL White-line-centred-lamellae
w/v Weight to volume
µF Microfaraday
µg Microgram
µl Microlitre
µM Micromolar

Chapter 1. Introduction
1
CHAPTER 1. General introduction
1.1 Introduction
The colonisation of land by plants in the Palaeozoic was a highly significant event in
Earth’s history, both from an evolutionary point of view and because it fundamentally
changed the ecology and environment of the planet (Beerling 2007). Land plants
evolved to form crucial components of all modern terrestrial ecosystems through
evolutionary adaptations involving changes in anatomy, physiology and life cycle
(Waters 2003; Menand et al. 2007; Cronk 2009). Key adaptations include rooting
structures, conducting tissues, cuticle, stomata, and sex organs such as gametangia and
spores/pollen.
Development of a durable spore wall is essential for terrestrialisation as it enables the
spore to withstand physical abrasion, desiccation and UV-B radiation (Wellman
2004). As part of their life cycle, sexually reproducing embryophytes manufacture
either spores, or their more derived homologues pollen. The major component of the
spore/pollen wall proposed to be of primary importance in enabling resistance to the
conditions described above is the highly resistant biopolymer sporopollenin (Ito et al.
2007; Cronk 2009).
It seems reasonable to hypothesize that colonisation of the land by plants was not
possible prior to the evolution of the sporopollenin spore wall, and this adaptation is
considered to be a synapomorphy of the embryophytes. Additionally, spore walls are
not present in the hypothesised embryophyte antecedents, the green algae (Wellman
2004). However, the production of sporopollenin is highly likely to be preadaptive as
it is present in a number of different algal groups such as the charophyceans which
have been proposed as the sister group to the embryophytes. In certain
charophyceans, sporopollenin occurs, but is located in an inner layer of the zygote
wall (Graham 1993). Phylogenetic studies and fossil evidence have shown that the
most basal living land plants are the paraphyletic ‘bryophytes’ (Kenrick and Crane
1997; Qiu et al. 2006) (Fig. 1.1). They comprise the liverworts, mosses and
hornworts, and their phylogenetic position should allow us to further elaborate the
evolutionary changes which facilitated the conquest of the land by plants (Rensing et
al. 2008). The moss Physcomitrella patens is the first ‘bryophyte’ genome to be

Chapter 1. Introduction
2
sequenced. This genome, through comparisons with angiosperm genomes, is proving
to be a valuable tool in experimental studies which attempt to reconstruct genome
evolution during the colonisation of land (Reski and Cove 2004; Quatrano et al. 2007;
Rensing et al. 2008).
Figure 1.1. Phylogenetic tree for land plant evolution derived from analysis by
Qui et al. (2006). The bryophytes are a paraphyletic group comprising three separate
lineages. Together with the vascular plants (which include the angiosperms),
bryophytes form the embryophytes which have a sister group relationship to the green
algae.
1.2 Spore/pollen wall structure and development
The spore/pollen walls of embryophytes have multiple layers and components which
are laid down in a regulated manner during spore/pollen development. Layers
containing the macromolecule sporopollenin, collectively known as the exospore, are
the component enabling the resistance of the spore/pollen wall to numerous
environmental factors which make life on land challenging. Sporopollenin is highly
resistant to physical, chemical and biological degradation procedures. Consequently
its precise chemical composition, structure and biosynthetic route has not yet been
ascertained (Meuter-Gerhards et al. 1999). Traditional convention asserts that
sporopollenin is a polymer of carotenoid esters (Cronk 2009). However, modern
Tracheophytes (Vascular Plants)
Hornworts
Mosses
Liverworts
Charophyceae
Chlorophyceae
Bryophytes
Green Algae
Embryophytes (Land Plants)

Chapter 1. Introduction
3
purification, degradation and analytical techniques have shown that it is comprised of
polyhydroxylated unbranched aliphatic units with small quantities of oxygenated
aromatic rings and phenylpropanoids (Ahlers et al. 1999; Domínguez et al. 1999).
The inner intine layer, or endospore, constitutes the non-sporopolleninous component
of spore/pollen walls and is associated with polysaccharide metabolism, primarily
consisting of cellulose and pectin (Hess 1993; Suárez-Cervera et al. 2002). The intine
can be subdivided into two commonly inconspicuous layers, the exintine and the
endintine.
1.2.1 Sporogenesis
Sporogenesis is the process in which haploid spores are formed from the diploid
sporophyte and facilitates the transition from the sporophyte generation to the
gametophyte generation (Cronk 2009). The process takes place in sporangia, or
microsporangia, where initially central cells develop an archesporial cell identity
which is different to that of the cells of the sporangium wall. The archesporial cells
give rise to sporogenous cells (spore mother cells or sporocytes) which undergo
mitosis. The number of mitotic cell divisions determines the eventual number of
sporogenous cells and therefore ultimately the number of spores/pollen grains. After
mitosis the sporogenous cells undergo meiotic cell division which produces four
distinct haploid cells or microspores, joined together in a tetrad. It is at this tetrad
stage where the sporopolleninous layers of the microspore wall begin to develop. The
microspores eventually separate and mature to form free spores/pollen grains (Cronk
2009; Hill 1996).
1.2.2 Modes of sporopollenin deposition in spore and pollen walls
The basic mechanisms involved in the formation of the spore wall, and the deposition
of sporopollenin in the exospore/exine, have been illuminated by numerous
ultrastructural studies performed on extant and fossil species across the plant kingdom
(Paxson-Sowders et al. 2001). Blackmore and Barnes (1987) proposed a number of
sporopollenin deposition processes apparent in the spore wall. Firstly, they
recognised the role of white-line-centred-lamellae (WLCL) in this process. The
accumulation of sporopollenin on an array of WLCL is regarded as being the most
primitive method of sporopollenin deposition and has been identified in a number of
algal groups and most, if not all, embryophytes (Wellman 2004). These lamellae

Chapter 1. Introduction
4
materialise at the plasma membrane with sporopollenin polymerising out onto either
side of the white line. They accumulate in a variety of ways to form the spore/pollen
wall (Blackmore and Barnes 1987; Blackmore et al. 2000; Wellman 2004).
Another mode of exospore/exine formation involves the deposition of sporopollenin
from the surrounding cells of the tapetum. Transmission electron microscopy (TEM)
has shown that the tapetal cells in many embryophytes possess a highly active
secretory system containing lipophilic globules which are thought to contain the
precursors of sporopollenin and are deposited onto the surface either directly
contributing to the exospore/exine or forming extra-exosporal layers commonly
referred to as the perispore, or perine (Piffanelli et al. 1998). Blackmore et al. (2000)
suggested that a tapetal contribution to the spore wall can take place in a variety of
ways including the addition to the layers formed by the WLCL or directly onto
WLCL. Studies of pollen wall formation in angiosperms highlight the role that the
tapetal cells play in supplying nutrients and lipid components to developing
microsporocytes and microspores (Scott et al. 1991; Ariizumi et al. 2004; de Azevedo
Souza et al. 2009). Interestingly, the most basal extant land plants (liverworts) lack a
tapetum, which is acquired in mosses and vascular plants, where it appears to function
much like the anther tapetum in angiosperms, and is primarily associated with perine
formation. Therefore, basal land plants which do not possess a tapetum consequently
do not develop a perine layer (Blackmore and Barnes 1987; Polevola 2012). Ubisch
bodies (or orbicules), small granules of sporopollenin mostly occuring on the
innermost walls of secretory tapeta in various land plant groups, have been observed
in some bryophytes and lycophytes, and given this, Pacini et al. (1985) have proposed
that the secretory tapetum is the earliest type.
An alternative deposition process involves centripetal accumulation of sporopollenin
onto previously formed layers. Blackmore et al. (2000) noted that exospore formation
may be achieved by sporopollenin accumulation below a pre-existing layer, either by
WLCL accumulation, or by the deposition of granular or unstructured sporopollenin.
A further mode of deposition is observed in seed plants where sporopollenin
accumulates within a pre-patterned cell surface glycocalyx referred to as the
primexine (Blackmore and Barnes 1987; Blackmore et al. 2000; Wellman 2004)
which is essentially an exine precursor.

Chapter 1. Introduction
5
1.2.3 Spore wall development in bryophytes
Spore wall development has been studied in all three of the traditional bryophyte
groups (reviewed in Brown and Lemmon 1988, 1990). In the majority of liverworts,
immediately after meiosis, a polysaccharide wall (the spore special wall) is laid down
outside of the plasma membrane (Brown and Lemmon 1985). In many liverworts this
spore special wall seems to function as a primexine in which the pattern of exospore
ornamentation is established (Brown and Lemmon 1993). However, in some
liverworts exospore ornamentation appears to be determined by exospore precursors
produced by the diploid sporocyte prior to meiosis and formation of the haploid spores
(Brown et al. 1986). The exospore develops centripetally (Brown and Lemmon 1993)
based on WLCL formed outside of the spore cytoplasm. At completion the entire
exospore comprises of sporopollenin deposited on WLCL. At maturity the lamellate
structure thus formed is clearly discernible and is highly characteristic of the liverwort
exospore. Liverworts lack a tapetum and there is therefore no input from this source.
The innermost layer of fibrillar intine is the final wall layer to be formed (Brown and
Lemmon 1993).
Studies of spore wall development in hornworts are limited. As with liverworts, a
spore special wall is formed after meiosis and functions as a primexine in which the
exospore is set down. It was initially thought that the exospore formed in the absence
of WLCL, but Taylor and Renzaglia (unpublished) have recently demonstrated their
presence (W. A. Taylor, University of Wisconsin-Eau Claire, USA, pers. comm.
2011). Recent analyses of Phaeomegaceros fimbriatus has shown that the mature
spore wall has a thin perine-like outer layer, but this represents the remnants of the
spore mother cell wall rather than extra-exosporal material derived from a tapetum
(Villarreal and Renzaglia 2006).
Three types of spore wall have been recognised in mosses: Bryopsida-type;
Andreaeidae-type and Sphagnidae-type (Brown and Lemmon 1990). All three of
these types appear to form in the absence of a spore special wall (Brown and Lemmon
1980). Bryopsida-type spore walls are homogeneous except for an inconspicuous
foundation layer. This foundation layer forms first via sporopollenin accumulation on
WLCL. Subsequently the predominantly homogeneous exospore layer is laid down
outside of the foundation layer in a centrifugal manner. This layer is thought to be

Chapter 1. Introduction
6
mostly extrasporal in origin. Sometimes additional homogeneous material is also
deposited inside of the foundation layer. This layer is almost certainly derived from
the spore. Following the accumulation of the homogeneous material the spores are
coated by an additional extra-exosporal layer, the perine, that is derived from the
tapetum. Finally the intine forms.
Spore wall development in the Andreaeidae-type is unique amongst mosses in that
they have a spongy exospore which appears to forms in the absence of WLCL (Brown
and Lemmon 1984). By studying Andreaea rothii, Brown and Lemmon (1984)
demonstrated that the exospore is instead initiated as discrete homogeneous globules
within the coarsely fibrillar network of the spore mother cell. These globules
accumulate and form an irregular layer with numerous interstitial spaces. The
sequence of spore wall layer development is essentially the same as that of other
mosses and the mature wall consists of an inner intine, a spongy exospore and an outer
perine (Brown and Lemmon 1984).
Sphagnidae-type moss spore walls are more complex than those of the other mosses
and consist of five layers (Brown et al. 1982). Unlike other mosses, the exospore of
Sphagnidae-type comprises two layers: an inner lamellate layer (A-layer), and a thick
homogenous outer layer (B-layer). In addition to the exospore there is an intine, a
unique translucent layer and the outermost perine. The A-layer is the first to form and
does so by sporopollenin accumulation on WLCL, and develops evenly around the
young spore immediately after meiosis. The homogeneous B-layer is deposited
outside the A-layer. Overlying the exospore is a translucent layer which consists of
unconsolidated exospore lamellae in a medium of unknown composition. The
tapetally-derived perine is deposited on top of this unique layer. The study of spore
wall development in Sphagnum lescurii by Brown et al. (1982) suggests that the
ontogeny of the wall layers is not strictly centripetal.
1.2.4 Spore wall development in pteridophytes
Spore walls have been investigated in a number of pteridophyte species representing
all of the major pteridophyte groups (reviewed in Lugardon 1990 and Tryon and
Lugardon 1991).

Chapter 1. Introduction
7
Spore wall development is well understood in the homosporous lycopsid Lycopodium
clavatum (Uehara and Kurita 1991). Shortly after meiosis the plasma membrane of
the sporogenous cell folds into a pattern that later becomes the reticulate spore
sculpture. Small WLCL form on the plasma membrane and accumulate in a
centripetal fashion forming the greater part of the exospore. After the main lamellate
part of the exospores is formed an inner granular layer, possibly derived from the
spore cytoplasm, is deposited. In some Lycopodium there are no extra-exosporal
layers (Uehara and Kurita 1991) whereas in others a thin extra-exosporal layer is
deposited after the completion of the exospore (Tryon and Lugardon 1991).
Spore structure and development in heterosporous lycopsids differs between
microspores and megaspores. In the clubmoss Selaginella, microspores possess an
exospore consisting of two layers (Fig. 1.2). The thin inner layer is the first to
develop and comprises imbricate lamellae which are formed on WLCL in a centripetal
direction (Tryon and Lugardon 1991). The outer layer starts to form only once the
inner layer is complete. Some Selaginella species may also develop a thin perispore
or a paraexospore. In the microspores of the heterosporous lycopsid Isoetes japonica
a large gap is developed between the two exospore layers (Uehara et al. 1991). The
outer exospore layer is regarded as a paraexospore as it begins to form before the
inner exospore, consists of similar sporopollenin, and is completed at the same time as
the inner exospore.
Selaginella megaspore walls contain two layers of similar thickness (Morbelli, 1995).
The inner and outer layers consist of lamellae and poorly segregated components
respectively. The inner layer does not thicken during exospore development and a
dense basal layer is formed by the lamellae. In contrast, the outer layer increases
significantly in thickness due to self assembly (Hemsley et al. 1994, 2000;
Gabarayeva 2000). During the final stages of sporogenesis the endospore forms
between the plasma membrane and the exospore. In Isoetes the megaspore wall is
similar to that of Selaginella in terms of development and structure, consisting of two
layers with the formation of the outer layer commencing prior to the inner layer.
Substantial quantities of silica are deposited within and on top of the outer layer
before the exospore is completed. Finally, the intine is lain down between the plasma
membrane and the exospore.

Chapter 1. Introduction
8
Figure 1.2. Proposed model of spore wall development in Selaginella
microspores. The thin inner exine layer forms first and comprises lamellae formed
centripetally on WLCL. The outer exine starts to form once the inner layer is
complete. Note the presence of callose at early developmental stages around the spore
mother cell.
The exospore in homosporous ferns develops centrifugally and is once again
bilayered. The inner layer acts as a substructure and consists of varying numbers of
fused sheets (extensive interconnected laminae) which form by sporopollenin
accumulation on WLCL. The homogeneous outer layer is considerably thicker and
contains thin radial fissures and small cavities. An extra-exosporal layer (perine)
forms once the exospore is complete and is deposited from the decaying tapetum.
Spore wall development in heterosporous ferns is similar to that observed in
homosporous ferns, and is also similar in both microspores and megaspores.
In Sphenopsids the spore walls appear to be highly derived (Lugardon 1990) and
observations of Equisetum arvense have shown that four layers are present in the form
of an exospore, endospore, middle layer and pseudoelators (Uehara and Kurita 1989).
The exospores comprise inner and outer exospores. The broad and homogenous inner
exospore forms first by way of plate-like structures accumulating on the plasma
membrane. The outer exospore is then formed by the deposition of granular material
Spore mother cell stage Tetrad stage Unicellular microspore stage
Callose wall formation around spore mother cell

Chapter 1. Introduction
9
on the inner exospore and is similarly wide and homogeneous. Once exospore
formation is complete the middle layer forms in the gap between the exospore and the
plasma membrane. The pseudoelators are the next structure to form and consist of
two layers. The inner of these comprises longitudinal microfibrils during the early
stages of development but eventually becomes homogeneous. The outer layer is also
homogeneous and is formed by granules which are released from vesicles in the
plasmodial cytoplasm. The pseudoelators are connected to the spore, by way of the
middle layer, at the aperture. The intine is the final component of the wall to form on
the inside of the exospores (Uehara and Kurita 1989; Taylor 1986).
1.2.5 Pollen wall development in gymnosperms
Although differences in pollen wall structure and development are evident in different
extant and extinct gymnosperm groups, the main ontogenetic elements appear to be
homologous (summarized in Lugardon 1994 and Wellman 2009). The pollen mother
cell undergoes meiosis to form four haploid microspores. Subsequent development of
the exine consists of a number of stages. Firstly, a callose wall forms around the
pollen mother cell and subsequently extends around each of the microspores. Next a
matrix develops around each microspore upon which the fibrillar microspore surface
coat and later the sexine (the outer pollen exine wall consisting of tectum and
infratectum components) pattern is established (Zavada and Gabareyeva 1991). The
microspore surface coat is deposited between the surface of the microspore and the
surrounding tetrad wall prior to the formation of the wall components. This layer is
regarded as being equivalent to the primexine in angiosperms. The sexine then begins
to form on and within the microspore surface coat. The nexine (inner pollen exine
wall) laminae is then formed below this coat, therefore the sexine is partly developed
when the nexine begins to develop. The exine as a whole appears to form in a
centripetal direction from the outside inwards (Lugardon 1994). Finally, an intine is
deposited on the inside of the pollen exine.
1.2.6 Pollen wall development in angiosperms
Pollen walls in angiosperms typically consist of an outer exine formed of
sporopollenin and an inner intine composed of cellulose and pectin (Fig. 1.3) (Paxson-
Sowders et al., 1997; Morant et al. 2007). Models of development have been
proposed based on observations on numerous species including Lilium and

Chapter 1. Introduction
10
Arabidopsis thaliana (e.g. Suzuki et al. 2008). Similar processes have been described
in both of these species.
Once again, prior to meiosis, the pollen mother cell is surrounded by a callose special
cell wall (Blackmore et al. 2007). Immediately after meiosis four microspores derived
from the pollen mother cell form a tetrad. A callose special wall surrounds the
microspores (Blackmore et al. 2007). A cellulose primexine then forms between the
plasma membrane and callose wall of each microspore. Both the callose wall and
primexine are deposited at the surface of the microspore through processes mediated
by the plasma membrane (Blackmore et al. 2007). A section of the primexine is then
adapted to form column-like structures called the probaculae upon which
sporopollenin, secreted by the microspore, will eventually accumulate and polymerise.
Sporopollenin deposition and accumulation extends the probaculae which form the
columellae, baculae and tecta (Heslop-Harrison 1963, 1968a). The callose wall then
degrades and the developing columellae, baculae and tecta are exposed to the fluid of
the locule and receive sporopollenin secreted by the tapetum. Wall formation is
complete when the nexine and intine layers are formed and the primexine recedes and
disappears (Suzuki et al. 2008). The mature pollen grain is then coated by tryphine
and pollenkitt which are synthesised by the tapetum (Dickinson and Lewis 1973;
Blackmore et al. 2007).
Figure 1.3. Diagram of A. thaliana pollen wall structure. The inner intine and the
various components of the outer exine are indicated as is the pollen coat (tryphine and
pollenkitt) which fills the cavities of the exine sculpture. Taken from Suzuki et al.
(2008).
Chapter 1. Introduction
11
1.3 Molecular genetics of pollen wall development
In recent years there has been a surge in papers describing genes involved in pollen
wall development. However, our understanding of the molecular genetics of
spore/pollen development remains poor due to the complexity of the developmental
process and problems in pinpointing the actual function of the genes involved.
Furthermore, research has been confined to particular model angiosperms (Table 1.1
and Fig. 1.4), most notably A. thaliana, with little or no information on gymnosperm
pollen or the spores of ‘lower’ land plants.
However, this research is now beginning to incorporate model plant species from
more primitive groups, such as the bryophytes. This extended research will enable the
comparison of the molecular genetics of spore/pollen wall development in
angiosperms and more primitive plants. The results from this may allow us to assess
how conserved the genes and genetic networks involved in spore/pollen wall
development are. The following sections (1.3.1 - 1.3.6) review the current knowledge
of the molecular genetics of pollen wall development in A. thaliana.
1.3.1 Arabidopsis thaliana genes implicated in sporopollenin biosynthesis and
exine formation
A number of A. thaliana genes associated with the biosynthesis of exine encode
proteins with sequence homology to enzymes involved in fatty acid metabolism
(Dobritsa et al., 2009). Aarts et al. (1997) observed expression of the MALE
STERILITY 2 (MS2) gene in the tapetum of wildtype plants at, and shortly after, the
release of microspores from tetrads and noted that MS2 mutants produced pollen
grains which lacked an exine layer. The exine layer had been replaced by a thin layer
of unknown composition. MS2 encodes a protein with sequence similarity to long
chain fatty acyl reductases and expression of the MS2 protein in bacteria leads to the
increased synthesis of fatty alcohols (Doan et al., 2009). Taken together, these data
suggest that an MS2-linked enzymatic pathway is required for the synthesis of
sporopollenin (Aarts et al. 1997; Ariizumi et al. 2008; Dobritsa et al. 2009).
Another gene implicated in exine formation is YORE-YORE (YRE)/WAX2/FACELESS
POLLEN1 (FLP1). Ariizumi et al. (2003) suggested that this gene encodes a
transporter or catalytic enzyme that is involved in wax synthesis in stems and siliques,

Chapter 1. Introduction
12
in the tryphine, and in sporopollenin synthesis. As with MS2, the pollen exine in
YRE/FLP1 mutants is poorly constructed and easily damaged, suggestive of defective
sporopollenin. Expression analyses in the same study suggest that FLP1 is expressed
in the tapetum, which is supported by the fact that the FLP1 mutant phenotype is
sporophytically controlled (Ariizumi et al. 2003). In addition, Rowland et al. (2007)
demonstrated that the ECERIFIUM 3 (CER3) gene encodes a protein of unknown
function identical to YRE/WAX2/FLP1 and is therefore allelic to YRE/WAX2/FLP1.
Morant et al. (2007) showed that the A. thaliana cytochrome P450 enzyme CYP703A2
is also necessary for the synthesis of sporopollenin. The CYP703 cytochrome P450
family is specific to embryophytes and each plant species contains a single CYP703
(Morant et al. 2007). The exine layer in CYP703A2 knock-out mutants is significantly
underdeveloped. Sporopollenin also appeared to be absent as the fluorescent layer
around the pollen associated with the presence of phenylpropanoid units in
sporopollenin was absent in CYP703A2 mutant plants (Morant et al. 2007). Morant et
al. (2007) demonstrated that lauric acid and in-chain hydroxy lauric acids are present
in the plant substrate and product for this enzyme. These are important building blocks
in the synthesis of sporopollenin and facilitate the formation of ester and ether
linkages with phenypropanoid units. Furthermore, the same study showed that
CYP703A2 is expressed in the anthers of developing A. thaliana flowers with initial
expression detectable at the tetrad stage in the microspores and the tapetum (Morant et
al., 2007), consistent with a role in exine formation.
Dobritsa et al. (2009) described another cytochrome P450, CYP704B1, and
demonstrated that this gene is essential for exine development. CYP704B1 mutants
produce pollen walls which lack a normal exine layer. The exine layer was replaced
with a thin layer of material and irregular distribution of aggregates which may have
been sporopollenin. The pollen walls also exhibited a characteristic striped surface,
unlike the reticulate pattern displayed by the wildtype, to which Dobritsa et al. (2009)
designated the name, zebra phenotype. It has also been shown that heterologous
expression of CYP704B1 in yeast catalyses ω-hydroxylation of long-chain fatty acids,
consistent with a role in sporopollenin synthesis (Dobritsa et al. 2009). Dobritsa et al.
(2009) have suggested that these ω-hydroxylated fatty acids, in concert with the
formation of in-chain hydroxylated lauric acids catalysed by CYP703A2, may serve as

Chapter 1. Introduction
13
vital monomeric aliphatic building blocks in the formation of sporopollenin. Analyses
of the genetic relationships between CYP704B1, CYP703A2 and MS2 (which as
described above encodes a fatty acyl reductase) along with expression analyses and
observation of similar zebra phenotypes in all three mutants, indicate that these genes
are involved in the same pathway within the sporopollenin synthesis framework and
are co-expressed (Dobritsa et al. 2009). In addition, an orthologue of CYP704B1
(BnCYP704B1) has recently been identified in Brassica napus, and mutants in this
gene exhibit defective exine layers (Yi et al. 2010).
Table 1.1. Arabidopsis thaliana genes implicated in pollen wall development.
Role
Gene
Proposed Expression
Sporopollenin biosynthesis and
exine formation
MS2
YRE/WAX2/FLP1
CYP703A2
CYP704B1
ACOS5
RPG1
NEF1
KNS5-10
KNS4
ABCG26
LAP5/PKSB
LAP6/PKSA
TKPR1/DRL1
TKPR2/CCRL6
AtMYB103/MS188 (TF)
MS1 (TF)
AtbZIP34 (TF)
Sporophyte
Sporophyte
Sporophyte and microspores
Sporophyte
Sporophyte
Sporophyte and microspores
Sporophyte
Sporophyte
Sporophyte
Sporophyte and microspores
Sporophyte
Sporophyte
Sporophyte
Sporophyte
Sporophyte
Sporophyte
Sporophyte and gametophyte
Exine formation (probaculae)
DEX1
TDE1/DET2
KNS2, 3, 12
Unknown
Unknown
Sporophyte
Intine formation
FLA3
MS33
RGP1
RGP2
Sporophyte and microspores
Unknown
Sporophyte and microspores
Sporophyte and microspores
Callose wall formation
CALS5/LAP1
KNS1, 11
Sporophyte and gametophyte?
Sporophyte
Tetrad Separation
QRT1-3
A6
Sporophyte
Sporophyte
Note: TF denotes transcription factor.

Chapter 1. Introduction
14
Figure 1.4. Proposed functions of genes implicated in A. thaliana pollen wall
exine development. Expected time and location of gene expression is indicated. Not
all A. thaliana genes described in this section are included due to a lack of information
regarding the time and locality of their expression. Modified from Suzuki et al.
(2008).
Another gene reported to participate in exine formation, ACOS5, has recently been
described (de Azevedo Souza et al. 2009). This encodes a fatty acyl-CoA synthetase
with broad in vitro preference for the medium chain fatty acids required in tapetal
cells for sporopollenin monomer synthesis. Mutations in ACOS5 significantly
compromise the development of the pollen wall which appears to lack sporopollenin
and exine. The defect in pollen formation in ACOS5 mutants coincides with the
deposition of exine at the unicellular microspore stage (de Azevedo Souza et al.
2009). Additionally, after analyses of ACOS5 expression in developing anthers, de
Azevedo et al. (2009) proposed that it is also involved in the same biochemical
pathway as the CYP703A2, CYP704B1 and MS2 genes.
The RUPTURED POLLEN GRAIN1 (RPG1) gene encoding a plasma membrane
protein and NO EXINE FORMATION1 (NEF1) gene, which encodes a plastid integral

Chapter 1. Introduction
15
membrane protein, are both required for primexine development (Ariizumi et al.
2004; Guan et al. 2008). Guan et al. (2008) revealed that exine pattern formation in
RPG1 mutants is defective as sporopollenin is randomly distributed over the surface
of the pollen grain. Primexine formation of microspores in RPG1 mutants is abnormal
at the tetrad stage, which results in imperfect deposition of sporopollenin on the
microspores (Guan et al. 2008). RPG1 plants experience microspore rupture and
cytoplasmic leakage suggesting that cell integrity had been impaired in the
microspores. The same study demonstrated that RPG1 is strongly expressed in the
tapetum and the microspores during male meiosis (Guan et al. 2008). Ariizumi et al.
(2004) showed that NEF1 mutants exhibited similarly defective primexine and that
although sporopollenin was present it was not deposited onto the plasma membrane of
the microspore because of the lack of normal primexine. Ariizumi et al. (2004)
tentatively suggest that NEF1 is expressed in the tapetum and is sporophytically
controlled. Additionally, it was proposed that NEF1 is likely to be involved in exine
formation at earlier developmental stages than other exine formation genes, such as
MS2 and FLP1, since the exine is more poorly developed in NEF1 plants (Ariizumi et
al. 2004).
Suzuki et al. (2008) also identified a number of genes involved in the construction of
exine and pollen development in general. They managed to successfully isolate 12
KOANASHI mutants (KNS1-KNS12), which were found to be recessive and thus likely
to affect pollen development sporophytically. The 12 mutants were categorised into
four types. The type 3 (KNS5-KNS10) mutants displayed abnormal tectum formation
on the pollen surface and these genes therefore appear to be required for either
creating primordial tectum (onto which sporopollenin is deposited) in the space
between the primexine and the callose wall, or for depositing sporopollenin itself
(Suzuki et al. 2008). Additionally, the type 2 mutant (KNS4) exhibits a thin exine
layer mostly due to shortened baculae. It is proposed that baculae extension is closely
linked to the thickening of the primexine, therefore, KNS4 is likely to be a novel gene
which regulates the thickening of the primexine layer (Suzuki et al. 2008).
Recently, Quilichini et al. (2010) proposed that the ATP-BINDING CASSETTE G26
(ABCG26) plays a crucial role in exine formation. Abcg26-1 mutants lack an exine
layer and expression studies showed that ABCG26 is transiently and locally expressed
Chapter 1. Introduction
16
in the tapetum post meiosis. Quilichini et al. (2010) suggest that ABCG26 transports
sporopollenin precursors across the tapetum plasma membrane to the anther locule for
polymerisation on the surface of the developing microspores.
Other genes which have recently been associated with a defective exine include LESS
ADHESIVE POLLEN 5/POLYKETIDE SYNTHASE B (LAP5/PKSB) and LESS
ADHESIVE SYNTHASE 6/POLYKETIDE SYNTHASE A (LAP6/PKSA) which are also
specifically and transiently expressed in the tapetum during microspore development
(Kim et al. 2010). Mutant plants compromised in the expression of LAP5/PKSB and
LAP6/PKSA exhibited significantly defective exine layers and a double LAP5/PKSB
LAP6/PKSA mutant appeared to completely lack an exine layer. These two genes are
co-expressed with ACOS5, and recombinant LAP5/PKSB and LAP6/PKSA proteins
were able to generate tri- and tetraketide alpha-pyrone compounds in vitro from a
wide range of potential ACOS5-generated fatty acyl-CoA starter substrates via
condensation with malonyl-CoA. These compounds would therefore appear to be
required for sporopollenin biosynthesis (Kim et al. 2010). Additionally, two closely
related genes, TETRAKETIDE alpha-PYRONE REDUCTASE1 (TKPR1/DRL1) and 2
(TKPR2/CCRL6), encode oxidoreductases which have been found to be active on the
tetraketide products produced by LAP5/PKSB and LAP6/PKSA. TKPR activity
reduces the carbonyl function of the tetraketide alpha-pyrone compounds synthesized
by LAP5/PKSB and LAP6/PKSA, and together with the activities associated with
LAP5/PKSB, LAP6/PKSA and ACOS5, form a biosynthetic pathway which ultimately
produces hydroxylated alpha-pyrone compounds, potential precursors for
sporopollenin (Grienenberger et al. 2010).
1.3.2 Arabidopsis thaliana transcription factors involved in sporopollenin and
exine formation
A number of transcription factors participating in the development of exine have been
described. AtMYB103/MS188 is a MYB transcription factor that is specifically
expressed in the anthers and trichomes of A. thaliana (Li et al. 1999; Higginson et al.
2003). Zhang et al. (2007) have shown that AtMYB103/MS188 directly regulates the
expression of the previously described exine formation gene MS2 and the callase-
related A6 gene. Knock-out mutants of AtMYB103/MS188 resulted in early tapetal
degeneration and abnormal microspores. Additionally, expression of the MS2 gene

Chapter 1. Introduction
17
was not detected in the anthers of the AtMYB103/MS188 mutants (Zhang et al. 2007).
The MALE STERILITY1 (MS1)/HACKLY MICROSPORE (HKM) gene, encoding a
leucine zipper-like, PHD-finger motif transcription factor, is also involved in tapetum
function (Ariizumi et al. 2005; Vizcay-Barrena and Wilson 2006; Ito et al. 2007;
Yang et al. 2007). Phenotypic analysis of MS1 mutants by Ito et al. (2007) indicated
that MS1 is required for transcriptional regulation of genes involved in primexine
formation, sporopollenin synthesis and tapetum development. Lack of MS1
expression results in changes in tapetal secretion and exine structure with the
appearance of autophagic vacuoles and mitochondrial swelling, suggesting that the
tapetum is broken down by necrosis rather than by apoptosis as observed in the
wildtype (Vizcay-Barrena and Wilson 2006; Yang et al. 2007). Yang et al. (2007)
further demonstrated that MS1 is expressed in the tapetal cells in a developmentally
regulated manner between the late tetrad stage and microspore release.
Another transcription factor involved in exine formation has been identified by
Gibalova et al. (2009) who demonstrated that AtbZIP34 mutants exhibit defects in
exine structure. The exine layer is wrinkled and the baculae and tecta are deformed.
Additionally, 50% of mutant pollen exhibited a wrinkled intine layer. Despite these
abnormalities, high levels of pollen abortion or male sterility were not observed
(Gibalova et al. 2009). Transcriptomic analyses revealed that expression of the
proposed primexine development gene, RPG1, is significantly down-regulated in
AtbZIP34 mutant pollen. Given the expression profiles of both genes, it is possible
that RPG1 expression is regulated by AtbZIP34 (Gibalova et al. 2009). Analyses also
suggested sporophytic and gametophytic roles for AtbZIP34 in exine and intine
formation.
The observation that many of the genes described in the previous sections are
predominately expressed sporophytically is a little at odds with the fact that exine
development mostly occurs at the surface of individual microspores after meiosis.
Suzuki et al. (2008) propose that this apparent contradiction may possibly be partly
explained by many of these genes being expressed in pollen mother cells so that the
relevant mRNA or proteins are inherited by the derived microspores. Furthermore it
would appear that the interaction of gametophytic and sporophytic genes is important
for the development of viable pollen (Wilson and Zhang 2009). A recent study

Chapter 1. Introduction
18
focusing on a rice fasciclin glycoprotein, MICROSPORE AND TAPETUM
REGULATOR1 (MTR1), demonstrates the cooperation between microspores and the
tapetum. MTR1 is specifically expressed in microspores yet its mutant has defects in
the development of the tapetum as well as microspores (Tan et al. 2012). Tan et al.
(2012) propose that MTR1 is a vital signalling molecule that coordinates microspore
and tapetum development.
1.3.3 Arabidopsis thaliana genes associated with probaculae formation
At present five A. thaliana genes have been specifically associated with the formation
of probaculae, which is an important component in the exine development process.
The DEFECTIVE IN EXINE1 (DEX1) gene encodes a novel membrane protein which
is required for anchoring sporopollenin to the surface of the microspores and is
implicated in probacula formation (Paxson-Sowders et al. 1997; Paxson-Sowders et
al. 2001). Sporopollenin synthesis still takes place in DEX1 mutants but primexine
development is delayed and ultimately reduced, which alters membrane formation and
therefore the deposition of sporopollenin. Spacers do not form in the primexine which
results in sporopollenin being randomly deposited on the plasma membrane (Paxson-
Sowders et al. 2001). Additionally, sporopollenin does not appear to be anchored to
the microspore and forms bulky aggregates on the developing microspore and locule
walls, and the pollen wall does not form, which results in pollen degradation (Paxson-
Sowders et al. 2001).
Ariizumi et al. (2008) suggested that the TRANSIENT DEFECTIVE EXINE1
(TDE1)/DE-ETIOLATED2 (DET2) gene is also involved in probacula development.
Specifically, they proposed that TDE1/DET2 is involved in brassinosteroid synthesis,
a hormone purported to control the rate or efficiency of the initial process of exine
formation. Primexine synthesis is defective in TDE1/DET2 mutant plants which
ultimately fail to produce probacula at the tetrad stage (Ariizumi et al. 2008).
Additionally, globular sporopollenin is haphazardly deposited onto the microspore at
the early uninucleate microspore stage (Ariizumi et al. 2008). As with DEX1 mutants,
sporopollenin apparently failed to anchor to the plasma membrane of the microspore
and instead aggregated on the locule wall and in the locule at the uninucleate
microspore stage (Paxson-Sowders et al. 2001; Ariizumi et al. 2008). However,
despite these defects reticulate exine was clearly formed at the later stage in

Chapter 1. Introduction
19
TDE1/DET2 mutants which is in contrast to other mutants displaying primexine
defects, such as DEX1, which always fail to produce normal exine at the later stages.
This suggests that mutations in TDE1/DET2 do not result in defects at critical stages
of exine development (Ariizumi et al. 2008). Expression analysis also demonstrated
that brassinosteroids may be synthesised in developing microspores. The same
analysis also showed that TDE1/DET2 mutations did not affect the expression of
genes implicated in exine development. This suggests that brassinosteroids support
exine development in a distinct pathway (Ariizumi et al. 2008).
The KNS2, 3 and 12 genes, designated type 4 genes by Suzuki et al. (2008), have also
been associated with probacula formation. Type 4 mutants were shown to exhibit
abnormal positioning of baculae which were densely distributed. This suggests that
the type 4 genes govern the position of probacula formation by either forming
undulations on the microspore plasma membrane at the tetrad stage, or by forming
spacers (Suzuki et al. 2008). Additionally, Suzuki et al. (2008), using map-based
cloning, were able to reveal that one of the type 4 genes, KNS2, encodes sucrose
phosphate synthase which is proposed to be potentially involved in primexine
synthesis or callose wall formation, which are known to be important for the
positioning of probaculae. Further studies are required to specifically determine the
time and location of expression of KNS type 4 genes.
1.3.4 Arabidopsis thaliana genes connected to intine formation
Recently, Li et al. (2010) have proposed that the fasciclin-like arabinogalactan protein
gene FLA3 is involved in the development of the intine layer by playing a role in the
deposition of cellulose. The down-regulation of FLA3 via RNAi results in the
appearance of a thinning intine layer and the production of approximately 50% non-
viable pollen grains, many of which display a wrinkled or shrunken phenotype.
Expression studies showed that FLA3 is specifically expressed in pollen tubes and
pollen grains, and is localised to the cell membrane (Li et al., 2010). Other A.
thaliana genes have also been implicated in intine formation, including the reversibly
glycosylated peptide genes, RGP1 and RGP2. Pollen in double knockout plants of
RGP1 and RGP2 exhibit unusually enlarged vacuoles and a poorly defined intine layer
(Drakakaki et al. 2006). Additionally, in MALE STERILITY33 (MS33) mutants the

Chapter 1. Introduction
20
intine forms prematurely and exhibits a thinner exintine and a much thicker endintine
than in wildtype pollen (Fei et al. 2004).
1.3.5 Arabidopsis thaliana genes implicated in callose wall formation
To date, three A. thaliana genes have been associated with callose wall formation.
Dong et al. (2005) and Nishikawa et al. (2005) have demonstrated that the CALLOSE
SYNTHASES (CALS5)/LESS ADHERENT POLLEN (LAP1) gene encodes a callose
synthase essential for callose wall formation. CALS5/LAP1 mutants lack callose on
the cell wall of pollen mother cells, tetrads and microspores which ultimately results
in the development of sterile pollen due to the degeneration of microspores (Dong et
al. 2005). Additionally, exine structure in the mutant plants was severely deformed,
affecting the baculae and tecta structure, and tryphine was haphazardly deposited as
globular structures (Dong et al. 2005). This implies that the callose wall is vitally
important for the formation of a properly sculpted exine (Dong et al. 2005).
Expression analyses have produced varied results with regards to CALS5/LAP1 and
suggest the gene is expressed in either pollen mother cells or pollen tetrads, or
possibly both cell types (Nishikawa et al. 2005). Abercrombie et al. (2011) propose
that sporophytic expression of CALS5/LAP1 accounts for its role in the formation of
the callose wall in pollen mother cells and pollen tetrads, and secondary expression in
the gametophyte is linked to pollen germination.
The KNS1 and KNS11 genes constitute the type 1 genes as described and classified by
Suzuki et al. (2008). Type 1 mutant plants exhibit pollen grains which display a
highly collapsed exine structure in which the tecta disappear and the baculae deform
into globular protrusions. Additionally, mature pollen grains of both genes were
reduced in size and in number, and were distorted in shape (Suzuki et al. 2008). This
phenotype closely resembled the pollen phenotype of CALS5/LAP1 mutants described
above (Dong et al. 2005; Nishikawa et al. 2005; Suzuki et al. 2008). This
resemblance, along with the recessive nature of the type 1 genes, suggests that KNS1
and KNS11 are expressed in pollen mother cells and are important in synthesising or
secreting callose (Suzuki et al. 2008).

Chapter 1. Introduction
21
1.3.6 Arabidopsis thaliana genes involved in tetrad separation
The QUARTET (QRT) genes have been identified as being required for pollen
separation during normal pollen development (Preuss et al. 1994; Rhee and
Somerville 1998; Francis et al. 2006). In wildtype A. thaliana pollen, degradation of
the pollen mother cell walls takes place which releases the individual microspores as
single pollen grains (Francis et al. 2006). Mutations in any of the QRT1, QRT2 or
QRT3 genes cause the outer walls of the microspores to become fused following
meiosis, resulting in pollen grains being released as tetrads (Preuss et al. 1994; Rhee
and Somerville 1998; Francis et al. 2006). Rhee and Somerville (1998) have
demonstrated that the enzymatic removal of callose at the tetrad stage is not sufficient
to release the microspores. In QRT1 and QRT2 mutants pectic components were
detectable at the time of tetrad separation which was not the case in the wildtype.
This suggests that the persistence of pectin in the pollen mother cell wall is associated
with tetrad separation failure (Rhee and Somerville 1998).
Pollen mother cell primary cell walls have been proposed to play a significant part in
cell-cell adhesion mechanisms (Rhee and Somerville 1998). The pectins of the
primary cell wall have been shown to consist mostly of homogalacturan, a polymer of
b-1, 4-galacturonic acid (GalUA), rhamnogalacturonan I and rhamnogalacturonan II
(branching polymers of GalUA, Ara and Rha) (Brett and Waldron 1996; Tucker and
Seymour 2002). As pectin is synthesised the backbone of GalUA is in a
methylesterified state which can then be demethylesterified by pectin methylesterases
and cleaved by endo-polygalacturonases, which results in loosening of the cell wall
(Schols and Voragen 2002; Francis et al. 2006). QRT1 has been proposed to encode a
pectin methylesterase (Francis et al. 2006), whereas the gene product of QRT2 has not
yet been determined. Expression analysis has shown that QRT1 is expressed shortly
after meiosis is complete (Francis et al. 2006). Additionally, Rhee et al. (2003) have
identified QRT3 as being an endopolygalacturonase which degrades the pectic
polysaccharides of the pollen mother cells. It has been demonstrated that the QRT3
gene is specifically and transiently expressed in tapetal cells during microspore release
from the tetrad (Rhee et al. 2003). Immunohistochemical localisation of QRT3
suggests that the protein it encodes is secreted from the tapetum during the early
stages of microspore development (Rhee et al. 2003).

Chapter 1. Introduction
22
Genes associated with callose wall degradation have, to date, not been definitively
identified. Frankel et al. (1969) and Stieglitz and Stern (1973) demonstrated that the
tetrad callose wall is degraded by β-1,3-glucanases activity secreted from the tapetal
cells. Whilst a number of candidate β-1,3-glucanase encoding genes have been
identified, none have been confirmed as a callase (Hird et al. 1993). However, Hird et
al. (1993) have proposed that the A6 gene may encode a component of the callase
enzyme complex due to the fact that it is tapetum-specific, has a strong sequence
similarity to other β-1,3-glucanases, and is temporally expressed at peak levels when
the plant normally expresses callase. Future identification of A6 mutant plants is
needed to confirm the gene as a callase. Additionally, real-time RT-PCR analysis
conducted by Zhang et al. (2007) has suggested that A6 is regulated by the
AtMYB103/MS188 gene.
1.4 The utility of Physcomitrella patens
The bryopsid moss P. patens is now a commonly used model species primarily
because of the high levels of gene targeting associated with it, and is proving to be a
powerful tool for the comparative analyses of embryophyte genomes (Quatrano et al.
2007). For example, transcriptomic analyses can demonstrate shared characteristics
among plant divisions in gene structure, content, and regulation. Two large scale
transcriptome analyses of approximately 100,000 expressed sequence tags have shown
that there is a significant amount of sequence similarity (circa 65%) between P.
patens and angiosperms. Additionally, around 66% of genes identified from
expressed sequence tag analyses of gene expression in P. patens gametophytes have
homologues in the A. thaliana genome which supports the hypothesis that genes
expressed in angiosperm diploid plant bodies were expressed in the gametophyte
bodies of early embryophytes and were recruited for sporogenesis in later plants
(Nishiyama et al. 2003). Splice sites and codon usage are also conserved among
similar genes found in P. patens and A. thaliana.
Gene targeting involves the generation of specific mutations in a genome through the
integration of foreign DNA at targeted locations by homologous recombination
(Schaefer, 2002). Transformation constructs which contain genomic sequence are
targeted at high frequency to the equivalent genomic locus allowing the inactivation of

Chapter 1. Introduction
23
genes by targeted gene replacement (TGR). With TGR a selection cassette is inserted
into a cloned gene, ideally replacing the coding sequence. Gene transformation is
conducted using linear DNA which consists of the selection cassette flanked by two
stretches of genomic sequence (Quatrano et al. 2007). When homologous
recombination takes place in both of the flanking sequences, targeting facilitates the
substitution of the genomic locus with the targeting construct (Quatrano et al. 2007).
Physcomitrella patens has the highest ratio of homologous recombination to
nonhomologous recombination of all land plants (Nishiyama et al. 2003; Quatrano et
al. 2007), and transformational experiments conducted by Schaefer and Zryd (1997)
have indicated that its level of gene targeting efficiency is above 90% which is
comparable to that of yeast, i.e. five orders of magnitude greater than in any other
plant species (Reski and Cove 2004). This efficiency enables reverse genetics
approaches in P. patens to be carried out at high throughput levels as several
independent knock-out plants can be produced for one single construct, facilitating
rapid and reliable gene function annotations (Kamisugi et al. 2005; Reski and Frank
2005). Physcomitrella patens is also straightforward to propagate vegetatively
allowing mutant strains to be maintained indefinitely and the haploidy of the dominant
gametophyte generation in mosses allows mutant phenotypes to be immediately
identified as a loss-of-function mutation cannot be counteracted by a functional allele
in a homologous chromosome (Cove 2000; Reski and Cove 2004; Prigge and
Bezanilla 2010).
1.5 Research outline
Whilst a substantial amount of research has been conducted with regards to pollen
wall development in angiosperms, particularly A. thaliana, research into spore wall
development in basal plants has thus far been extremely limited particularly in terms
of the molecular genetics of sporogenesis. Schuette et al. (2009), using immuno-light
and immuno-electron microscopy, have identified the presence of callose in the spores
of P. patens where it was deposited in the inner exospore layer near the expanded
aperture region (local expansion of the intine layer) at the proximal pole, suggesting
that callose is involved in aperture expansion during wall development. It is
proposed that a CALS5 homologue is present in the P. patens genome and is involved

Chapter 1. Introduction
24
in spore wall development (Schuette et al. 2009). Additionally, Aya et al. (2011)
generated knockouts of GAMYB homologues in P. patens which produced abnormal
spores with defective perine and outer exine layers. In rice, the GAMYB gene has
been identified as a transcription factor, controlled by the hormone gibberellin, which
positively regulates CYP703A3 which encodes an enzyme essential in sporopollenin
biosynthesis (Aya et al, 2009). Further research has not yet been forthcoming in this
area therefore this thesis will contribute to filling this void. By comparing P. patens
genes which are upregulated during sporogenesis with those known to be involved in
pollen wall development in A. thaliana it will be possible to identify candidate genes
likely to be involved in the development of the spore wall and consequently the ability
of the moss to survive in the terrestrial environment. Additionally, by conducting
gene knock-out and gene swap experiments between P. patens and A. thaliana it will
be possible to test hypotheses regarding the conservation of gene function in the spore
wall, as has already been achieved in the area of leaf, root and stomata EvoDevo
studies (Harrison et al. 2005; Menand et al. 2007; Chater et al. 2011; Ruszala et al.
2011).
1.5.1 Aims
1. To utilise the genomic resources and tools afforded by A. thaliana and P.
patens to test the overarching hypothesis that the biochemical and
developmental pathway required for pollen wall development in higher plants
is ancient and highly conserved.
1.5.2 Objectives
1. Characterise the structure and ultrastructure of the spore wall in P. patens at
various developmental stages of sporogenesis using electron microscopy.
2. To use a bioinformatic approach in conjunction with literature/data mining to
determine genes which are involved in pollen wall development in A. thaliana.
3. To use the gene list generated in (2) to interrogate a fully replicated
unpublished microarray database derived from early and mid stages of
sporophyte development in P. patens to identify candidate genes likely to be
involved in P. patens spore wall development.

Chapter 1. Introduction
25
4. To generate knock-out mutants and perform complementation experiments in
P. patens and A. thaliana respectively, to test the function of selected candidate
gene(s).
5. To apply and develop appropriate morphological and physiological techniques
for phenotyping mutated spore and pollen walls.
1.5.3 Hypotheses
1. The biochemical and developmental pathway required for pollen wall
development in higher plants is ancient and highly conserved.
2. Spore wall development is controlled by both the diploid sporophyte and the
haploid spore.
1.6 Thesis outline
This chapter has introduced and summarised the research carried out to date with
regards to spore and pollen wall development and the associated molecular genetics,
and outlines the motivation for the work reported in the following chapters.
In Chapter 2 the materials and methods used for this study are described. The work in
Chapter 3 characterises spore wall development, using electron microscopy, to analyse
wall structure and ultrastructure at various developmental stages of sporogenesis in P.
patens. Chapter 4 describes the process of identifying genes in P. patens, likely to be
involved in spore wall development using expression analyses and bioinformatics.
Justification for the selection of a lead gene for the work outlined in later chapters is
also provided. In Chapter 5 the results from gene swap experiments, involving the
transformation of a P. patens spore wall candidate gene (selected in Chapter 4) into an
appropriate A. thaliana loss-of-function mutant, are reported along with a description
of the morphological and physiological phenotyping of P. patens lead gene knockout
mutants generated by homologous recombination. Chapter 6 gives a summation of
the overall findings presented in this thesis and discusses how they progress our
knowledge with regard to the evolutionary development of the spore and pollen wall.
Future research directions are also discussed.

Chapter 2. Materials and methods
26
CHAPTER 2. Materials and methods
2.1 Materials
2.1.1 General laboratory materials
General laboratory chemicals of analytical grade, or comparable grade, were
purchased from Melford, Duchefa Biochemie, Sigma-Aldrich UK, BDH or Fisher
Scientific.
Modification enzymes were obtained from a variety of sources. BIOTAQTM DNA
Polymerase was purchased from Bioline (www.bioline.com), M-MLV Reverse
Transcriptase was ordered from either Promega (www.promega.com) or Fisher
Scientific (www.fisher.co.uk) and KOD Hot Start DNA Polymerase was purchased
from Toyobo (www.toyobo.co.jp), via Merck Millipore (www.merckmillipore.com).
T4 DNA Ligase, T4 Polynucleotide Kinase and Calf Intestinal Alkaline Phosphatase
(CIAP) were obtained from Promega. DNA Polymerase I (Klenow) was purchased
from New England Biolabs (UK) (www.neb.uk.com).
The pENTRTM/D-TOPO® Cloning Kit and Gateway
® LR ClonaseTM II Enzyme mix
were acquired from Invitrogen (www.invitrogen.com). Restriction Enzymes were
obtained from New England Biolabs (UK) and Promega. Hyperladder I was
purchased from Bioline.
The Qiagen (www.qiagen.com) DNeasy®
Plant Mini Kit was used for extracting total
plant genomic DNA, and the Qiagen QIAquick Gel Extraction Kit was used for the
extraction and purification of DNA fragments from agarose gels. The Qiagen
QIAprep Spin Miniprep Kit facilitated plasmid DNA isolation and purification. Total
plant RNA was extracted using the SpectrumTM Plant Total RNA Kit from Sigma-
Aldrich (www.sigmaaldrich.com) or TRIzol® Reagent supplied by Invitrogen. The
Extract-N-Amp Plant PCR Kit (Sigma-Aldrich) was used for quick low quality DNA
extractions for the purposes of genotyping numerous putative arabidopsis
transformants at once.
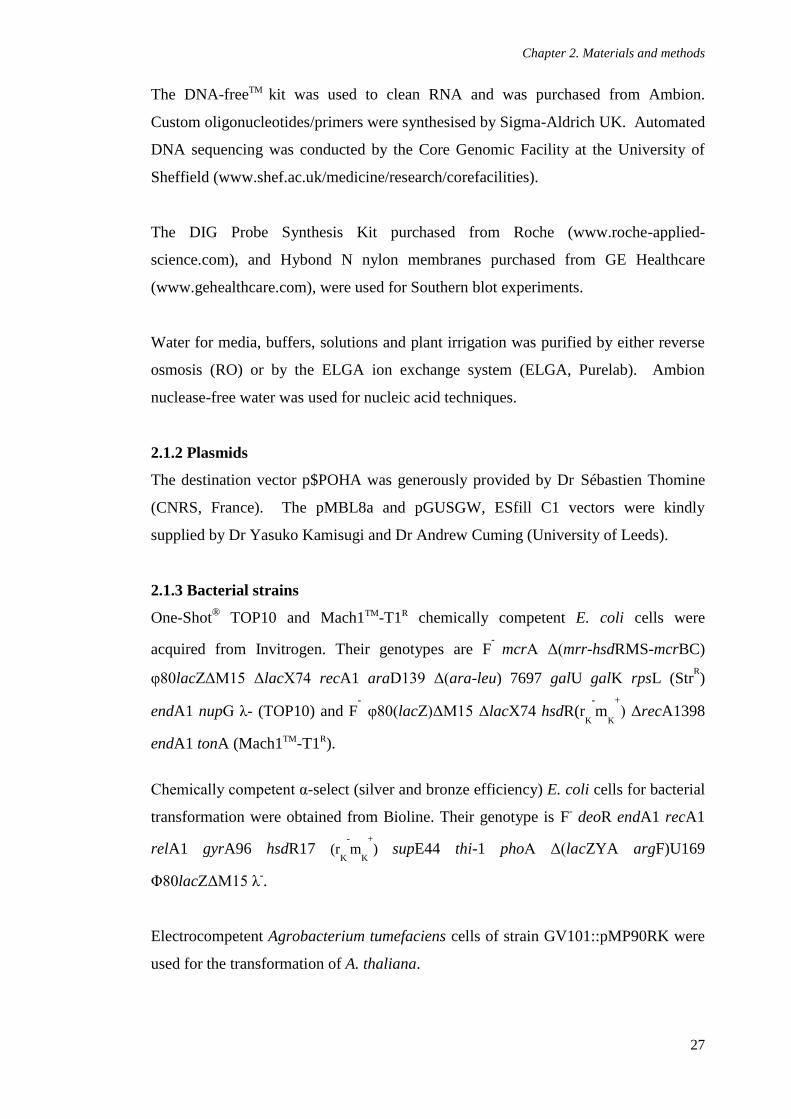
Chapter 2. Materials and methods
27
The DNA-freeTM kit was used to clean RNA and was purchased from Ambion.
Custom oligonucleotides/primers were synthesised by Sigma-Aldrich UK. Automated
DNA sequencing was conducted by the Core Genomic Facility at the University of
Sheffield (www.shef.ac.uk/medicine/research/corefacilities).
The DIG Probe Synthesis Kit purchased from Roche (www.roche-applied-
science.com), and Hybond N nylon membranes purchased from GE Healthcare
(www.gehealthcare.com), were used for Southern blot experiments.
Water for media, buffers, solutions and plant irrigation was purified by either reverse
osmosis (RO) or by the ELGA ion exchange system (ELGA, Purelab). Ambion
nuclease-free water was used for nucleic acid techniques.
2.1.2 Plasmids
The destination vector p$POHA was generously provided by Dr Sébastien Thomine
(CNRS, France). The pMBL8a and pGUSGW, ESfill C1 vectors were kindly
supplied by Dr Yasuko Kamisugi and Dr Andrew Cuming (University of Leeds).
2.1.3 Bacterial strains
One-Shot® TOP10 and Mach1TM-T1R chemically competent E. coli cells were
acquired from Invitrogen. Their genotypes are F-
mcrA Δ(mrr-hsdRMS-mcrBC)
φ80lacZΔM15 ΔlacΧ74 recA1 araD139 Δ(ara-leu) 7697 galU galK rpsL (StrR)
endA1 nupG λ- (TOP10) and F-
φ80(lacZ)ΔM15 ΔlacX74 hsdR(rK
-
mK
+
) ΔrecA1398
endA1 tonA (Mach1TM-T1R).
Chemically competent α-select (silver and bronze efficiency) E. coli cells for bacterial
transformation were obtained from Bioline. Their genotype is F- deoR endA1 recA1
relA1 gyrA96 hsdR17 (rK
-
mK
+
) supE44 thi-1 phoA Δ(lacZYA argF)U169
Φ80lacZΔM15 λ-.
Electrocompetent Agrobacterium tumefaciens cells of strain GV101::pMP90RK were
used for the transformation of A. thaliana.

Chapter 2. Materials and methods
28
2.1.4 Plant Materials
Five ecotypes and mutants of A. thaliana were used during this study. Seeds of
Columbia 3 (Col-3) wildtype were purchased from the European Arabidopsis Stock
Centre (http://arabidopsis.org.uk) as were two mutant lines with T-DNA insertions in
the MS2 gene (SAIL_75_E01 and SAIL_92_C07) and two mutant lines with T-DNA
insertions in the RPG1 gene (SALK_142803 and SALK_092239). All four of these
T-DNA insertion lines were advertised as being homozygous for their insertions and
this was verifed by PCR genotyping and by checking their phenotypes.
Physcomitrella patens subspecies patens (Hedwig) wildtype strains 'Villersexel',
'Gransden 2004' and ‘GrD12’ were kindly supplied by Dr Andrew Cuming
(University of Leeds).
2.2 Plant growth conditions and tissue culture
2.2.1 Arabidopsis thaliana
Seeds were stratified in the dark at 4°C for 4-5 days in 300 μl sterile water and were
then sown onto M3 compost (Levingtons), containing 5 % perlite, in 4 cm pots. The
seeds were germinated, and subsequent developing plants propagated, in growth
chambers with a 16-hour photoperiod (irradiance of 100 μmol m-2
s-1
) at 20°C. The
plants were irrigated every 2-3 days with RO water.
2.2.2 Physcomitrella patens
Physcomitrella patens was grown axenically in Sanyo MLR incubators under
continuous light (irradiance of 140 μmol m-2
s-1
) at 25°C. Wildtype and mutant lines
were grown on BCDA routine basal medium (Cove 2000) supplemented with sterile 1
mM calcium chloride and overlaid with sterile cellophane discs (AA Packaging, UK),
in sterile 9 cm Petri dishes sealed with micropore tape (3M).
2.2.3 Protonemal culture and maintenance
Wildtype and mutant P. patens lines were maintained indefinitely by sub-culturing bi-
weekly in a sterile laminar flow hood. Protonemal tissue was disrupted and blended
in sterile autoclaved water using a Polytron® homogeniser (Kinematica, Switzerland).

Chapter 2. Materials and methods
29
The homogenate was then plated onto BCDA medium or into 7.7 cm MagentaTM
tissue culture vessels (Sigma-Aldrich) filled with BCDA medium. For sub-cultures
carried out for the purpose of eventually harvesting protonemal tissue the homegenate
was plated onto BCDA medium overlaid with sterile cellophane discs. Gametophore
development was initiated by allowing the protonemal homogenate to grow for longer
than 14 days.
2.2.4 Gametangia and sporophyte induction
For P. patens lines designated for sporophyte induction sterile ~30 mm diameter peat
pellets (Jiffy-7; Jiffy Products International) were inoculated with ~2-3 ml of
protonemal and/or gametophore homogenate. The inoculated pellets were cultured at
25°C under continuous light in a growth chamber. After 4-6 weeks, when dense
gametophore tissue can be observed, the cultures were transferred to a 15°C growth
cabinet with an 8 hour photoperiod to initiate gametogenesis. Shortly after
transference to these conditions the cultures were flooded for ~4-5 hours with sterile
RO water to promote the fertilisation of archegonia. Three weeks after flooding the
cultures were transferred to room temperature (variable photoperiod) at which point
early stage sporophytes could be observed. The sporophytes took a further 2-3 weeks
to reach maturity. Sporophytes at various developmental stages could then be
harvested for either DNA/RNA extraction (in liquid nitrogen and stored at -80°C), or
for microscope observation or spore germination (dried and then stored in 1.5 ml
Eppendorf tubes at room temperature in the dark).
2.2.5 Spore germination
New P. patens lines were generated by germinating spores. Sporangia were surface-
sterilised with 4 % bleach solution for five minutes and washed four times (five
minutes each time) with sterile RO water. The sporangia were then crushed with a
sterile pipette tip in 1ml of sterile RO water to create a spore solution which was then
plated onto BCDA routine basal medium supplemented with sterile 10 mM calcium
chloride. Spores germinated after two days.

Chapter 2. Materials and methods
30
2.3 Bioinformatics
2.3.1 Genome searches
Arabidopsis thaliana genes implicated in the development of the pollen wall were
identified from literature searches. The majority of these genes have been annotated
and their sequences were retrieved from The Arabidopsis Information Resource
(TAIR) website (www.arabidopsis.org). The protein sequences were used to search
for homologous genes in the P. patens genome (www.cosmoss.org) and the
Selaginella moellendorffii genome (selaginella.genomics.purdue.edu/ and
www.ncbi.nlm.nih.gov) using TBLASTN with default parameters employed (E-value
cut-off of 1E-4).
2.3.2 Transcriptomic microarray preparation, design and analysis
The triplicated P. patens two colour microarray was designed and prepared by C.
Chater (University of Sheffield, UK) to maximise genome coverage and compare
gametophyte gene expression with that of early and mid stage sporophytes.
Gametophyte and sporophyte RNA samples were isolated and purified using
extraction protocols described in section 2.4.2. Gametophyte RNA was isolated from
seven day old protonemal tissue grown on BCDA medium. RNA was also isolated
from early stage sporophytes (pre-expanded columnar capsules with calyptras
removed) and mid stage stage sporophytes (ovoid to near spherical translucent lime
green capsules with calyptras removed). In order to minimise the condensation of
water into samples, ~50 sporophytes from both developmental stages were harvested
in a single sitting with fine-tip forceps into Eppendorf tubes sitting in liquid nitrogen.
To satisfy the quality requirements for the microarray experiment a minimum of 400
sporophytes were used for each isolation. Three or four RNA extracts were then
consolidated for further precipitation to increase sample concentration and purity.
Tissue harvested from the Villersexel K3 ecotype was used for the microarray
analysis, and subsequent validation, due to its propensity to sporulate abundantly,
unlike Gransden 2004, the strain used to construct the microarray probes. However,
there is very little polymorphic difference between the two ecotypes with 829 base
pairs/SNP and therefore there is minimal effect on hybridisation to the microarray
(Kasahara 2011).

Chapter 2. Materials and methods
31
One of three independent replicate RNA samples of each sporophyte stage was co-
hybridised with one of six independent gametophyte sample replicates. The samples
were co-hybridised as total RNA with Cyanine (Cy-3 (green)/Cy-5 (red)) fluorescent
Universal Linkage System labels onto an Agilent custom array with antisense probes
(synthesised as 60 mer length oligonucleotide probes on glass slides using Agilent
Technologies’ ‘SurePrint’ inkjet technology (Reski and Frank 2005) in collaboration
with MOgene LC, an Agilent certified facility based in St Louis, MO, USA
(www.mogene.com)).
35, 939 filtered transcripts (derived from combining predicted models and EST
evidence) were identified from the genome assembly. The transcripts from the Joint
Genome Institute (JGI) assembly version 1.1 were used as input (http://genome.jgi-
psf.org/physcomitrella/physcomitrella.download.ftp.html). Only 31,000 of the 35,939
transcripts were designed. The remaining five thousand transcripts are either
redundant (>99 % identical) or consist of low-complexity sequences unsuitable for
high quality probe design. The format of the array was 4 x 44,000, and the number of
user defined probes was 41,384. The additional probes were used for quality control
purposes by MOgene. A number of the 31,000 designed transcripts were randomly
selected and duplicated to fill out the 41,384 probe real estate and therefore could be
utilised as spot replicates.
Basic quality control and data and image analysis of the microarray was conducted by
MOgene. Normalisation was performed using the R (http://www.r-project.org)
package LimmaGUI (Linear Modelling of Microarrays Graphical User Interface
(bioinf.wehi.edu.au/limmaGUI/)) (Smyth 2004; Smyth 2005). The data was
normalized within arrays using Global LOESS (LOcally wEighted polynomial
regreSSion) and between arrays using Aquantile (Fig. 2.1). Normalisation was
required to eliminate systematic biases in the microarray data. Background correction
of 'half' was selected.
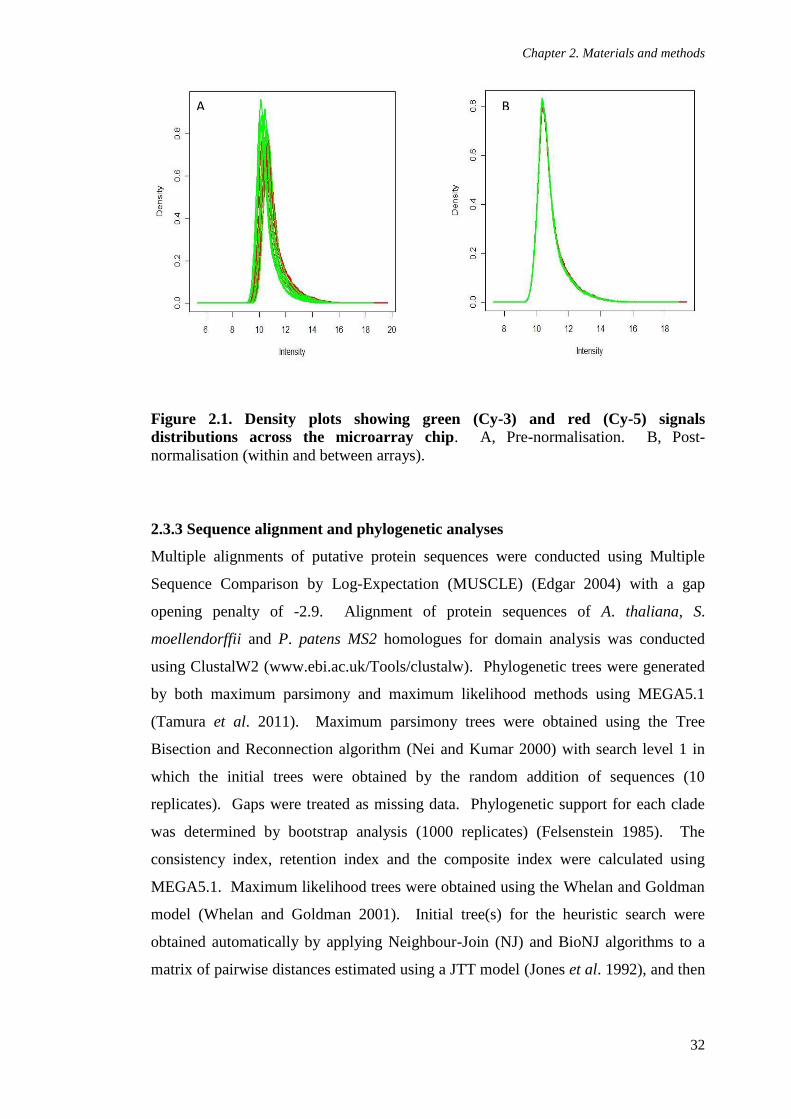
Chapter 2. Materials and methods
32
Figure 2.1. Density plots showing green (Cy-3) and red (Cy-5) signals
distributions across the microarray chip. A, Pre-normalisation. B, Post-
normalisation (within and between arrays).
2.3.3 Sequence alignment and phylogenetic analyses
Multiple alignments of putative protein sequences were conducted using Multiple
Sequence Comparison by Log-Expectation (MUSCLE) (Edgar 2004) with a gap
opening penalty of -2.9. Alignment of protein sequences of A. thaliana, S.
moellendorffii and P. patens MS2 homologues for domain analysis was conducted
using ClustalW2 (www.ebi.ac.uk/Tools/clustalw). Phylogenetic trees were generated
by both maximum parsimony and maximum likelihood methods using MEGA5.1
(Tamura et al. 2011). Maximum parsimony trees were obtained using the Tree
Bisection and Reconnection algorithm (Nei and Kumar 2000) with search level 1 in
which the initial trees were obtained by the random addition of sequences (10
replicates). Gaps were treated as missing data. Phylogenetic support for each clade
was determined by bootstrap analysis (1000 replicates) (Felsenstein 1985). The
consistency index, retention index and the composite index were calculated using
MEGA5.1. Maximum likelihood trees were obtained using the Whelan and Goldman
model (Whelan and Goldman 2001). Initial tree(s) for the heuristic search were
obtained automatically by applying Neighbour-Join (NJ) and BioNJ algorithms to a
matrix of pairwise distances estimated using a JTT model (Jones et al. 1992), and then
A B

Chapter 2. Materials and methods
33
selecting the topology with superior log likelihood. Phylogenetic support for each
clade was once again assessed by bootstrap analysis of 1000 replicates.
2.4 Nucleic acid techniques
2.4.1 Plant genomic DNA extraction
For small-scale DNA extractions (for PCR) in all plant tissues the Qiagen DNeasy®
Plant Mini Kit was used. Plant tissue (~100 mg wet weight) was ground in liquid
nitrogen to a fine powder using a mortar and pestle. For extractions involving P.
patens protonema the plant tissue was pressed between two sheets of filter paper
(Whatman) to remove as much extraneous liquid as possible prior to flash freezing in
liquid nitrogen and eventual DNA extraction. Additionally, in order to reduce the co-
extraction of enzyme-inhibiting compounds only six to seven day old protonemal
tissue was used. The liquid nitrogen was allowed to evaporate and before the sample
could thaw 400 μl of Lysis Buffer AP1 (kit reagent) and 4 μl of RNase A were added.
The sample was then mixed vigorously, in a 1.5 ml Eppendorf tube, using a vortex,
and incubated for ten minutes at 65°C with occasional mixing. This step lyses the
cells. 130 μl of Precipitation Buffer AP2 (kit reagent) was then added to the lysate
which was mixed by tube inversion and then incubated on ice for five minutes. This
step precipitates detergent, proteins and polysaccharides. The lysate was then
centrifuged for five minutes at 13,200 rpm (maximum speed) to pellet precipitates and
the resultant supernatant was added to a QIAshredderTM spin column sitting in a 2 ml
collection tube and centrifuged for two minutes at maximum speed. The flow-through
fraction was transferred to a new tube to which 1.5 volumes of Precipitation Buffer
AP3/E (kit reagent) was added, and mixed by pipetting, to the cleared lysate. The
sample mixture was then added to a DNeasy mini spin column, sitting in a 2 ml
collection tube, and centrifuged for one minute at 8,000 rpm. The flow-through was
discarded and the centrifugation step repeated after which the column was transferred
to a clean 2 ml collection tube. 500 μl of Wash Buffer AW (kit reagent) was added to
the column which was then centrifuged for 1 minute at 8,000 rpm. The flow through
was one again discarded and a further 500 μl of buffer AW was added to the column
which was then centrifuged for two minutes at maximum speed in order to dry the
column membrane. The column was finally transferred to a 1.5 ml Eppendorf tube.

Chapter 2. Materials and methods
34
30-50 μl of Elution Buffer AE (kit reagent) was then added directly onto the column
membrane which was then incubated at room temperature for 5-10 minutes. The
column was then centrifuged at 8,000 rpm for one minute and the DNA was in the
resultant eluate which was stored at -20ºC.
A modified version of the CTAB extraction protocol described by Knight et al. (2002)
was used for large-scale extractions (for Southern blotting experiments involving P.
patens). Immediately prior to use, 7 μl of 2-mercaptoethanol and 10 mg ascorbic acid
were added to 10 ml stock of extraction buffer (0.1 M Tris-Cl, pH 8.0, 1.42 M NaCl,
2.0 % CTAB, 20 mM Na2EDTA, 2 % PVP-40 autoclaved) which was then warmed to
65ºC. Once again protonemal tissue (200-300 mg wet weight) was ground in liquid
nitrogen using a mortar and pestle. 1 ml of extraction buffer was then added to the
sample and was gently mixed to form a smooth paste. A further 1 ml extraction buffer
was then added and stirred to obtain a uniform homogenate. The homogenate was
then transferred to a 50 ml Falcon tube and 30 μl of 10 mg/ml pre-boiled RNase A
was added. This mix was then incubated at 65ºC for 5 minutes. After incubation 3 ml
of chloroform/iso-amyl alcohol (24:1) was added and the sample was mixed further
using a vortex to emulsify. Phases were then separated by centrifuging at 10,000 rpm
for 10 minutes. The upper aqueous phase was transferred to a fresh tube and DNA
was precipitated by adding and mixing in 2.1 ml of iso-propanol followed by
centrifugation at 10,000 rpm for 5 minutes. The resultant supernatant was discarded
and the pellet was washed with 70 % ethanol and then air dried. The pellet was then
dissolved in 200 μl of TE buffer (10m M Tris-Cl, pH8, 1 mM Na2 EDTA) and the
solution was transferred to a 1.5 ml Eppendorf tube. The solution was then
centrifuged at maximum speed for two minutes in a microcentrifuge and the
supernatant was recovered and transferred to a clean tube for storage at -20ºC.
For initial genotyping of putative A. thaliana transformants DNA was extracted using
The Extract-N-Amp Plant PCR Kit. The DNA was extracted from a small volume of
plant tissue (~25 mg wet weight) by incubation in 100 μl Extraction Solution (kit
reagent) at 95ºC for ten minutes. 100 μl of Dilution Solution (kit reagent) was then
added and mixed to neutralise inhibitory substances. The resultant extract was then
ready for polymerase chain reaction (PCR) as described in section 2.4.5.

Chapter 2. Materials and methods
35
2.4.2 Plant total RNA extraction
For P. patens sporophyte and protonemal tissue, and A. thaliana leaf tissue, total RNA
was extracted using the SpectrumTM Plant Total RNA Kit (Sigma-Aldrich).
Approximately 100 mg of tissue was ground to a fine powder in liquid nitrogen with a
mortar and pestle. 500 μl of Lysis Solution (kit reagent) supplemented with 5 μl 2-
mercaptoethanol was added to each sample. This mixture was then transferred to a
1.5 ml Eppendorf tube, vortexed and incubated at 56ºC for 3-5 minutes. The sample
mixture was then centrifuged for three minutes at maximum speed to pellet cellular
debris. The resultant lysate supernatant was added to a filtration column sitting in 2
ml collection tube and centrifuged at maximum speed for one minute. 750 μl of
Binding Solution (kit reagent) was thoroughly mixed with the clarified lysate. This
mixture was then applied (maximum of 700 μl at a time) to a binding column sitting in
a 2 ml collection tube and centrifuged at maximum speed for one minute. The flow-
through liquid was discarded and 500 μl of Wash Solution 1 (kit reagent) was added to
the column followed by centrifugation at maximum speed for one minute. The flow-
through liquid was decanted and 500 μl of Wash Solution 2 (kit reagent) was added to
the column which was then centrifuged at maximum speed for 30 seconds. The flow
through-liquid was decanted and this step was then repeated. The empty column was
then centrifuged at maximum speed for one minute in order to dry the column. Any
further residual flow-through liquid was then discarded. The column was then
transferred to a clean 1.5 ml Eppendorf tube. 30-50 μl of Elution Solution (kit
reagent) was then pipetted directly onto the centre of the binding matrix in the column
and incubated at room temperature for one minute followed by centrifugation at
maximum speed for one minute to elute. The purified RNA was in the resultant flow-
through eluate which was stored at -80ºC.
For mature A. thaliana anthers, thought to be high in enzyme-inhibiting compounds
such as carbohydrates and phenolics, RNA was extracted using TRIzol® Reagent with
an appropriate protocol. Once again approximately 100 mg of tissue (A. thaliana
flowers) was ground in liquid nitrogen using a mortar and pestle. 1 ml of TRIzol®
was
added to the sample during grinding. After grinding, the sample was incubated at
37ºC for two minutes and then left at room temperature for a further 5 minutes after
which it was centrifuged at 12,000 rpm for 10 minutes at 4ºC. The resultant
supernatant was then collected into 1.5 ml Eppendorf tubes and placed on ice. 100 μl

Chapter 2. Materials and methods
36
of chloroform was mixed with the sample which was then incubated for three minutes
at room temperature and centrifuged at 12,000 rpm for 20 minutes at 4ºC. The
supernatant was collected into fresh tubes, mixed with 300 μl of isopropanol, and
incubated for 10 minutes at room temperature and a further 60 minutes at -20ºC. The
sample was then centrifuged at 12,000 rpm for 15 minutes after which the isopropanol
was discarded and the resultant pellet washed with 70 % ethanol. The sample was
then centrifuged at 7,500 rpm for five minutes. The ethanol was decanted and the
pellet was air dried for approximately 20 minutes. Once dry, the pellet was dissolved
in 40 μl of nuclease-free water.
2.4.3 DNA and RNA quantification
Quality analysis and quantification of DNA and RNA was conducted with 1.5 μl of
sample using a NanoDrop ND-8000 UV-Vis spectrophotometer (ThermoScientific).
Plasmid DNA quality and quantity was obtained using the same method. RNA
integrity was also initially analysed with agarose gel electrophoresis. Samples
exhibiting significantly degraded ribosomal RNA smears were discarded.
2.4.4 Reverse transcription/cDNA synthesis
0.1-10 μg of total RNA (in 12.5 μl nuclease-free water) was cleaned using a DNA-
freeTM kit in a 0.2 ml tube. 1.5 μl 10x DNase buffer and 1 μl of the enzyme rDNase I
were added to the RNA solution which was then incubated for 30 minutes at 37ºC in a
Techne Touch Gene Gradient PCR Thermal Cycler (Krackeler Scientific). 1 μl of
inactivation buffer was then mixed with the RNA solution and incubated at room
temperature for two minutes to inactivate the enzyme. The mixture was then
centrifuged at 13,200 rpm for 90 seconds in a microcentrifuge. The resultant
supernatant was collected into new tubes. 10 μl of DNase-free RNA solution was then
used as a template for synthesising the first strand of complementary DNA (cDNA). 2
μl of oligodT(18) (0.5 μg/μl) and 3 μl of nuclease-free water were added to the RNA
solution which was then incubated at 70ºC for five minutes. 5 μl of 5x RT Buffer and
5 μl of dNTP mix (10 mM) were then added to the solution which was incubated at
42ºC for two minutes. 1 μl (200 units) of M-MLV Reverse Transcriptase was then
added to the solution which was then incubated for a further 60 minutes at 42ºC in a
thermocycler.

Chapter 2. Materials and methods
37
2.4.5 Polymerase chain reaction (PCR)
BIOTAQTM DNA polymerase was used for PCR amplifications carried out for the
purposes of expression studies and general genotyping. For the production of high
fidelity DNA amplicons for use in cloning, and for genotyping involving the
amplification of fragments in excess of 5,000 base pairs, the proofreading DNA
polymerase, KOD was used. Oligonucleotides were designed using Primer3
(frodo.wi.mit.edu).
PCR amplifications using BIOTAQTM
DNA polymerase were generally conducted
using the following reaction conditions:
Template DNA/cDNA (50-1000 ng) X μl
10 μM forward primer 2.5 μl
10 μM reverse primer 2.5 μl
10 mM dNTP mix 0.5 μl
10 x NH4 buffer 2.5 μl
50 mM MgCl2 1 μl
BIOTAQTM
DNA polymerase 0.2 μl
Sterile H2O up to 25 μl
Once mixed the reagents were cycled using a Techne Touch Gene Gradient PCR
Thermal Cycler with the following protocol:
Initial
denaturation Denaturation Annealing Extension Final
extension Hold
35 cycles
94 ºC
4 mins
94 ºC
1 min
59-60 ºC
72 ºC 72
ºC
4 ºC
50 secs
X* 5 mins
*1 min/kb of
expected size

Chapter 2. Materials and methods
38
Amplifications using KOD Hot Start DNA Polymerase were generally carried out
using the following reaction conditions:
Template DNA/cDNA (50-1000 ng) X μl
10 μM forward primer 1.5 μl
10 μM reverse primer 1.5 μl
8 mM dNTP mix 3 μl
10 x PCR buffer 5 μl
25 mM MgSO4 4 μl
KOD Hot Start DNA Polymerase 1 μl
Sterile H2O up to 50 μl
Once mixed the reagents were once again cycled using a Techne Touch Gene
Gradient PCR Thermal Cycler with the following protocol:
Initial
denaturation Denaturation Annealing Extension Final
extension Hold
35 cycles
95 ºC
2 mins
95 ºC
20 secs
57-63 ºC
70 ºC 70
ºC
4 ºC
10 secs
25secs-3
mins*
6-8
mins
*dependent on
fragment size

Chapter 2. Materials and methods
39
Table 2.1. Sequences of oligonucleotide pairs used in sq-RT-PCR P. patens
microarray validation.
Oligo/Primer
ID
Forward Primer (Sequence 5’→3’)
Reverse Primer (Sequence 5’→3’)
11916
TGGACATGCGACCTACTCTGG
CGCCAAACCCGTAGCAAATA
120173 GCTATGGGTGAAATGCTGGT CCAAAAGGGCATTGACAACT
146196 TGCTCAATTGCCTACTGTGG AACCGTCACCGCAATAAAAG
149962 CACTGCCATCTGCCTGTTTA CGCTGCATTGATGGAGATTA
163268 ATGGGTCACGTCGACTTCAAA CATGACTGTGAGGGGAGAAACA
100530 ACTGACCTCCAGGCAGTTGT TACACAAATCCCCAATGCAC
184189 AGCTGTTCAGCTGGGAGAAA TGCATTTCAGCCTTCACTTG
PpActin2* GCGAAGAGCGAGTATGACGAG AGCCACGAATCTAACTTGTGATG
Rubisco* TTGTGGCTCCTGTCTCTGTG CGAGAAGGTCTCGAACTTGG
* Housekeeping genes.
2.4.6 Semi-quantitative reverse transcription PCR (sq-RT-PCR)
Sq-RT-PCR, using cDNA obtained with the protocol described in section 2.4.4, was
used for microarray validation. PCR reactions were set up in the same way as
described in section 2.4.5. However, the reaction was paused at the beginning of the
annealing stage (59-60ºC) of cycles 20, 24, 28 and 32. At these intervals individual
aliquots of 4 μl were taken and immediately placed on ice to stop the reaction. On
completion of the program the aliquots were loaded in order into wells on an agarose
gel (for protocol see section 2.4.7) followed by electrophoresis. The difference in
rates of amplicon synthesis and associated band intensities provided a semi-
quantitative approach for ascertaining relative gene expression levels.
Oligonucleotides used for the sq-RT-PCR microarray validation are outlined in Table
2.1.
2.4.7 Agarose gel electrophoresis
DNA and RNA samples were separated on 1 % w/v agarose gels. Electrophoresis
grade agarose was dissolved in 1x TAE buffer (0.04 M tris-acetate, 0.001M EDTA;
50x stock/litre, 2 M tris base, 57.1 ml glacial acetic acid, 0.05 M EDTA pH 8.0) by
heating in a microwave. In a fume hood ethidium bromide was added to, and mixed
with, the agarose solution (to a final concentration of approximately 0.5 μg/ml). The
agarose solution was then poured into a gel rig with an appropriate tooth comb and

Chapter 2. Materials and methods
40
allowed to set. The comb was then removed and 1x TAE buffer was added to the gel
rig so that the gel was submerged. Each DNA/RNA sample was mixed with 6x
loading buffer (0.2 % w/v bromophenol blue, 50 % v/v glycerol) and loaded into
separate wells. 5 μl of a size standard, Hyperladder I, which enabled the size and
concentration of DNA/RNA fragments to be determined, was also loaded into a gel
well. The gel was then electrophoresed at 90 V for 45-60 minutes. On completion of
electrophoresis the DNA/RNA was either gel purified (section 2.4.8) or visualised
with a BXT-20.M UV-transilluminator (Progen Scientific) and an UVItech Digital
camera.
2.4.8 DNA gel extraction
DNA fragments were recovered from agarose gels using the QIAquick Gel Extraction
Kit following a modified version of the manufacturer’s protocol.
After electrophoresis, the DNA fragment was visualised with a UV-transilluminator
and quickly excised from the gel using a clean scalpel blade and transferred to a pre-
weighed 1.5 ml Eppendorf tube. The weight of the gel slice was then determined and
three volumes of Buffer QG (kit reagent) were added. The sample was then incubated
for 20-25 minutes at 50ºC with regular mixing with a vortex to dissolve the gel slice.
One gel volume of isopropanol was then mixed with the sample. The dissolved
sample was then transferred to a QIAquick spin column seated in a 2 ml collection
tube and centrifuged at 13,000 rpm for one minute to bind the DNA to the column
membrane. The resultant flow-through was then decanted and 500 μl of Buffer QG
was added followed by centrifugation at 13,000 rpm for one minute. This step
removes all remaining traces of agarose. The flow-through was discarded and the
column membrane was then washed with 750 μl of Buffer PE (kit reagent) for 20-25
minutes followed by centrifugation at 13,000 rpm for one minute. The flow-through
was decanted and the column was centrifuged at 13,000 rpm for a further minute to
dry the column. The column was then transferred to a clean 1.5 ml Eppendorf tube
and 30 μl of nuclease-free water was added followed by incubation at room
temperature for 20-25 minutes. The column was then centrifuged for one minute at
maximum speed to elute the DNA which was in the resultant flow-through liquid and
stored at -20ºC.

Chapter 2. Materials and methods
41
2.4.9 Ethanol precipitation of DNA
Ethanol precipitation of DNA samples extracted using the CTAB protocol described
in section 2.4.1 was undertaken to purify the samples prior to Southern blot
experiments involving P. patens. 1/10 volume of 3 M sodium acetate (pH 5.2) and
three volumes of 100 % ethanol were thoroughly mixed with each sample. Samples
were then placed at -80ºC for one hour. The DNA was then pelleted by centrifugation
at maximum speed for 30 minutes at 4ºC. The resultant supernatant was then decanted
and the pellet was washed with 300 μl of 70 % ethanol and centrifuged at maximum
speed for five minutes at 4ºC. The supernatant was discarded and the pellet air dried
for 15-20 minutes at room temperature. The DNA was then dissolved in 200 μl of TE
buffer.
2.4.10 Southern blot
In order to determine whether P. patens knockout lines were single-copy replacement
transformants a DNA probe was hybridised to a Southern Blot. The PCR DIG Probe
Synthesis Kit was used to make and label the DNA probe using the following PCR
reaction mix:
Template DNA (1-50 ng) X μl
10 μM forward primer 2.5 μl
10 μM reverse primer 2.5 μl
PCR DIG Probe Synthesis Mix 2.5 μl
10 x PCR buffer with MgCl2 2.5 μl
Enzyme mix 0.38 ul
Sterile H2O up to 25 ul
The labelled DNA probe consisted of a fragment (783 base pairs in size – FP, 5’-
CGCACAATCCCACTATCCTT-3’; RP, 5’-AATATCACGGGTAGCCAACG-3’)
amplified from the CaMV35S-nptII-CaMV terminator selection cassette which had
been excised from the pMBL8a vector. Once mixed the reagents were cycled using a
Techne Touch Gene Gradient PCR Thermal Cycler with the following protocol:

Chapter 2. Materials and methods
42
Genomic DNA from five putative P. patens knock-out lines were then cut by
restriction digest with HindIII using the following reaction mix:
DNA (~10 ug) X μl
10x restriction digest buffer 2 15 μl
10x Bovine Serum Albumin (BSA) 1.5 μl
HindIII restriction enzyme (1 U/μl) 14 μl
Sterile H2O up to 150 μl
The reaction mix was incubated overnight at 37ºC and ‘spiked’ with 2 μl of additional
HindIII followed by incubation for two further hours at 37ºC. The digested DNA was
ethanol precipitated and the pellet was resuspended in 30 μl of TE buffer and loaded
onto an agarose gel (ethidium bromide replaced with SYBR®
safe) and
electrophoresed at 15-20 V overnight to separate the DNA fragments. A UV image of
the gel was then taken with a ruler beside it for subsequent measurement. The gel
containing the separated DNA was then depurinated by submerging and gently
shaking the gel in 250 mM of hydrochloric acid for 10-20 minutes. The gel was then
Initial
denaturation Denaturation Annealing Extension Final
extension Hold
95 ºC
2 mins
95 ºC
30 secs
60 ºC
72 ºC 72
ºC
4 ºC
30 secs
1 min 7 mins
30 cycles

Chapter 2. Materials and methods
43
rinsed with sterile water. The DNA was then denatured by submerging and gently
shaking the gel in denaturation solution (0.5 M NaOH, 1.5 M NaCl) for 2 x 15
minutes followed by rinsing. The gel was then submerged in neutralisation solution
(0.5 M Tris-HCl, pH 7.5; 1.5 M NaCl) for 2 x 15 minutes followed by equilibration
for 10-20 minutes in 20x SSC. In order to transfer the DNA to a nylon membrane by
capillary action a blot was set up (Fig. 2.2). A piece of Whatman 3MM paper, soaked
Figure 2.2. Southern blot assembly for capillary transfer of DNA from an
agarose gel to a nylon membrane as recommended by Roche.
with 20x SSC, was placed atop a ‘bridge’ which rested in a shallow reservoir of 20x
SSC. The gel was then placed atop the soaked sheet of Whatman 3MM paper
(avoiding air bubbles). The positively charged nylon membrane, cut to the size of the
gel, was then placed on top of the gel (any air bubbles were eliminated with a pipette
tip). The blot assembly was completed by adding a dry sheet of Whatman 3MM
paper, a stack of paper towels (~10 cm thick), a Perspex plate and a 400-500 g weight.
The blot was allowed to transfer overnight in 20x SSC.
The following morning, while the blot was still damp, the DNA was covalently bound
to the nylon membrane by UV crosslinking with a UV Stratalinker (at 120 mJ). The
membrane was then allowed to dry and then placed into a clean hybridisation bag
Weight 400-500 g
Perspex plate
Stack of paper towels
Dry Whatman 3MM paper
Hybond N nylon membrane
Agarose gel
Soaked Whatman 3MM paper
Bridge resting in a reservoir of
20x SSC

Chapter 2. Materials and methods
44
which was heat sealed closely around the membrane. 15 ml of prewarmed (~46ºC)
DIG Easy Hyb was added to the bag which was then securely laid flat on the bottom
of a rotating water bath and incubated at approximately 46ºC for 30 minutes to
prehybridise the membrane with the DIG Easy Hyb. 2 μl of the DIG labelled DNA
probe was then mixed with 50 μl of nuclease-free water in a 1.5 ml Eppendorf tube
and placed in a boiling water bath for five minutes to denature the probe. The probe
was then quickly chilled in an ice bath. The denatured probe was then immediately
added to a tube containing 5.25 ml of prewarmed DIG Easy Hyb and mixed by
inversion to form the hybridisation solution. The hybridisation bag was cut open and
the 15 ml of DIG Easy Hyb was removed by pouring. The hybridisation solution was
quickly added to the bag which was then resealed (whilst minimising air bubbles) and
securely placed back in the rotating water bath and incubated at approximately 46ºC
for 16 hours. At the end of the incubation the bag was opened and the hybridisation
solution was poured off the membrane. The membrane was then quickly placed in a
plastic tray containing 200 ml of low stringency buffer (2x SSC containing 0.1 %
SDS) and incubated for five minutes at room temperature with gentle shaking. The
used buffer was then poured off and 200 ml of fresh buffer was added to the
membrane followed by incubation for a further five minutes. The low stringency
buffer was poured off once more and 200 ml of high stringency buffer (0.1x SSC
containing 0.1 % SDS), prewarmed to 68ºC, was immediately added to the tray
containing the membrane followed by incubation for 2 x 15 minutes with gentle
shaking. The membrane was then rinsed in 200 ml of washing buffer (0.1 M maleic
acid, 0.15 M NaCl; pH 7.5; 0.3 % (v/v) tween 20) for five minutes. The membrane
was then incubated for 30 minutes in 100 ml of blocking solution (10 % (w/v) in
maleic acid buffer) at room temperature followed by incubation in 20 ml of antibody
solution for 30 minutes. Prior to incubation the antibody solution was centrifuged for
five minutes at 10,000 rpm and the appropriate amount was carefully pipetted from
the surface. Unbound antibody was then removed by way of incubation for 2 x 15
minutes in washing buffer (0.1 M maleic acid, 0.15 M NaCl; pH 7.5; 0.3 % (v/v)
tween 20). After washing the membrane was equilibrated in 20 ml of detection buffer
(0.1 M tris-HCl, 0.1 M NaCl, pH 9.5) for five minutes. The membrane was then
placed in a clean hybridisation bag and 1 ml of CSPD (chemiluminescent substrate for
alkaline phosphatase) was applied evenly over the membrane which was then
incubated for five minutes at room temperature. Excess liquid was then squeezed out

Chapter 2. Materials and methods
45
of the bag and the damp membrane was incubated for 10 minutes at 37ºC to enhance
the luminescent reaction. The membrane, whilst in the sealed bag, was then exposed
to X-ray film inside a cassette for 1-10 minutes. The film was then developed,
visualised and imaged.
2.5 Cloning techniques
Oligonucleotides used in the techniques described in the following section are
outlined in Table 2.2.
2.5.1 Generation of ATMS2pro::PPMS2-1 and ATUBQ14pro::PPMS2-1
constructs
For the attempted complementation of A. thaliana ms2 mutants with the homologous
P. patens gene, the Coding DNA Sequence (CDS) of the PPMS2-1 gene (2202 base
pairs) was amplified by PCR from P. patens sporophyte cDNA using the PpMS2-1
CDSF and PpMS2-1 CDSR primers. The destination vector p$POHA (Fig. 2.3) was
then digested with EcoRV to excise the ‘suicide cassette’ and PPMS2-1 CDS was then
blunt-end ligated (section 2.5.4) into the vector. The resultant p$POHA::PPMS2-1
vector was then digested with PmeI and SpeI to remove the ATOST1 promoter. The
A. thaliana HindIII MS2 promoter fragment (1,077 base pairs), identified by Aarts et
al. (1997), was then amplified by PCR (AtMS2proF and AtMS2proR primers) with a
3’ SpeI overhang (sticky-end created by restriction digest with SpeI with the reaction
mix outlined in section 2.5.4) and ligated into the cut p$POHA::PPMS2-1 vector to
create ATMS2pro::PPMS2-1. Sequencing showed that a histidine-tag located in the
backbone in the linker region at the 5’ end of PPMS2-1 was not in reading frame with
the moss gene and was therefore removed by digestion with AatII and SpeI followed
by self-ligation of the vector.
During PCR amplification of the CDS of PPMS2-1 a splice variant of the gene (2,951
base pairs - CDS with introns 3,4 and 6) was also amplified and this was cloned into
p$POHA using Gateway®
cloning (sections 2.5.5 and 2.5.6) and then put under the
control of the ATMS2 promoter using the previously described method.

Chapter 2. Materials and methods
46
The ATMS2pro::PPMS2-1 vector was also used to create a construct where PPMS2-1
was placed under the control of the constitutive A. thaliana UBIQUITIN (UB14)
promoter. ATMS2pro::PPMS2-1 was digested with HindIII and XbaI in order to
remove the ATMS2 promoter. The UB14 promoter (1,061 base pair fragment 12 base
pairs upstream from the start codon) was amplified by PCR from A. thaliana genomic
DNA (UBQ14F and UBQ14R primers) and blunt-end ligated into the cut vector to
create ATUBQ14pro::PPMS2-1.
2.5.2 Generation of Physcomitrella patens MS2-1 knock-out construct
To create the PPMS2-1 construct, used to generate P. patens knock-out lines, the 5’
and 3’ flanking sequences (933 and 974 base pairs respectively) of the PPMS2-1 CDS
were amplified by PCR from genomic DNA (MS2upstF, MS2upstR, MS2downF and
MS2downR primers). The 5’ fragment was then blunt-end ligated into a HindIII site
in a linker region of the pMBL8a (Fig. 2.4) vector immediately upstream of a
CaMV35S-nptII-CaMV terminator selection cassette. The 3’ fragment was
introduced, again by blunt-end ligation into a SacI site in the linker region on
pMBL8a immediately downstream of the CaMV35S-nptII-CaMV terminator selection
cassette. The knock-out construct was then linearised by PCR (3,711 base pair
fragment amplified with MS2-1intF and MS2-1intR primers) in preparation for PEG-
mediated protoplast transformation of P. patens (Fig. 2.5).
Figure 2.3. Map of the p$POHA vector used for complementation experiments
involving homologous genes in P. patens (Belin 2006).
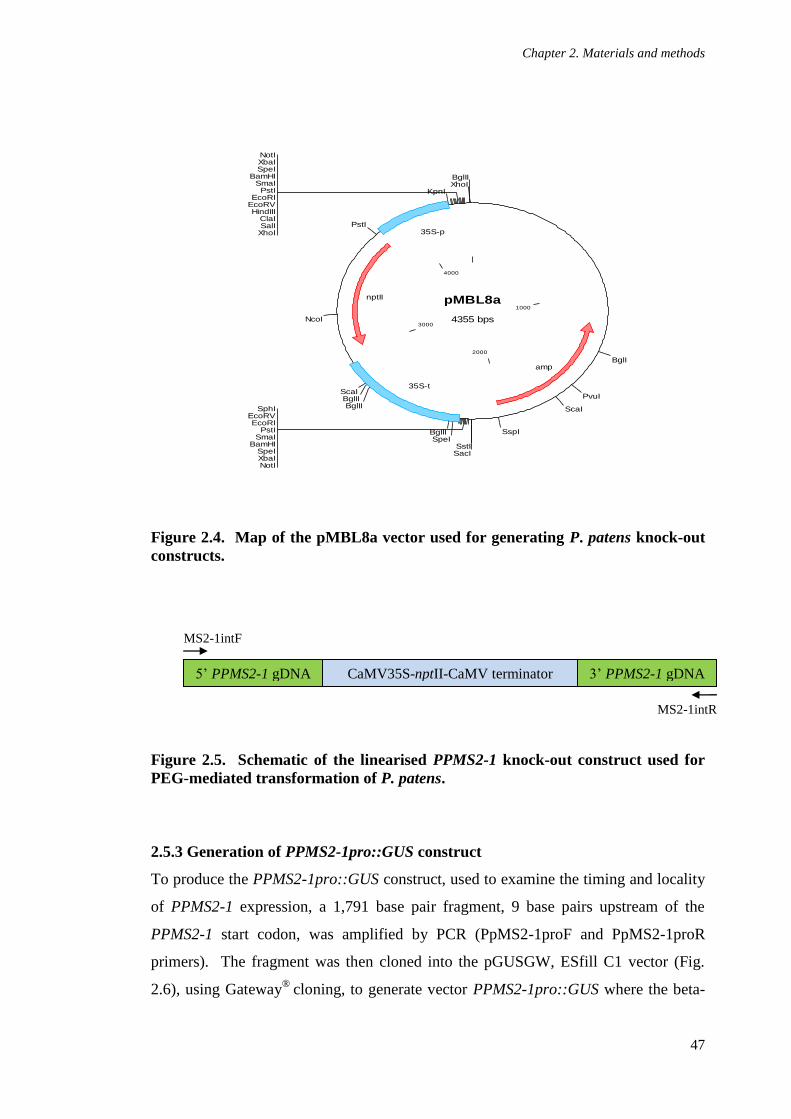
Chapter 2. Materials and methods
47
Figure 2.4. Map of the pMBL8a vector used for generating P. patens knock-out
constructs.
Figure 2.5. Schematic of the linearised PPMS2-1 knock-out construct used for
PEG-mediated transformation of P. patens.
2.5.3 Generation of PPMS2-1pro::GUS construct
To produce the PPMS2-1pro::GUS construct, used to examine the timing and locality
of PPMS2-1 expression, a 1,791 base pair fragment, 9 base pairs upstream of the
PPMS2-1 start codon, was amplified by PCR (PpMS2-1proF and PpMS2-1proR
primers). The fragment was then cloned into the pGUSGW, ESfill C1 vector (Fig.
2.6), using Gateway®
cloning, to generate vector PPMS2-1pro::GUS where the beta-
pMBL8a
4355 bps
1000
2000
3000
4000
BglI
PvuI
ScaI
SspI
SacISstI
NotIXbaISpeI
BamHISmaI
PstIEcoRI
EcoRVSphI
SpeIBglII
BglIIBglIIScaI
NcoI
PstI
KpnI
XhoISalIClaI
HindIIIEcoRVEcoRI
PstISmaI
BamHISpeIXbaINotI
XhoIBglII
amp
35S-t
nptII
35S-p
5’ PPMS2-1 gDNA CaMV35S-nptII-CaMV terminator 3’ PPMS2-1 gDNA
MS2- MS2-1intF
MS2- MS2-1intR

Chapter 2. Materials and methods
48
glucuronidase reporter gene was under the control of a putative PPMS2-1 promoter
fragment.
Table 2.2. Sequences of oligonucleotide pairs used in cloning experiments
involving A. thaliana and P. patens.
Oligo/Primer name
Sequence (5’→3’)
PpMS2-1 CDSF
CACCATGGAGGCAGTGTACAAGAC
PpMS2-1 CDSR TCAAATTATGTGTGGAAAAGAACG
AtMS2proF GCATTCTAGAGATCTAAGACAAAAACGTGGCCATT
AtMS2proR CGCGACTAGTAAGCTTGTTGGTTAAGAAATTGG
UBQ14F ATCCGAACAGAGTTAAACCGG
UBQ14R AAAAACTGAGATTAATCGCTTGG
MS2upstF CAAGGCGATTTGGTGAGTTA
MS2upstR TCAGAGGAAGCTGCTTAGTTTCT
MS2downF
MS2downR
MS2-1intF
MS2-1intR
PpMS2-1proF
PpMS2-1proR
CTGACGGGGTAAGCGTTTTA
TTGGTTTCATAGCAGCAAGC
GCTGCATGTGTGAGGAGAGA
CAACGCTCAACCAATTAGCA
CGGTTCTCAATCTTGATACGA
AGAACCGCTTCTTCACTAGATA
Figure 2.6. Map of the pGUSGW, ESfill C1 vector used for generating the
PPMS2-1::GUS construct and subsequently examining the timing and locality of
PPMS2-1 expression.

Chapter 2. Materials and methods
49
2.5.4 DNA ligation
For blunt-end cloning the plasmid vector was digested with the appropriate enzyme(s).
Typical reaction conditions were as follows:
Plasmid DNA (~2 ug) X μl
10x restriction digest buffer 2 μl
10x BSA 2 μl
restriction enzyme(s) (1 U/μl) 1 μl (for each enzyme)
Sterile H2O up to 20 μl
The above mix was incubated for 2-3 hours at the appropriate restriction enzyme
temperature (typically 37ºC). The restriction enzyme(s) was heat inactivated at 65-
80ºC (depending on enzyme). 1 μl of DNA Polymerase I (Klenow) and 0.75 μl of
dNTP mix (10 mM) were then added to the mix which was then incubated for 25
minutes at 37ºC to fill-in 5’-sticky ends and/or trim 3’-sticky ends in order to create
blunt-ends. DNA Polymerase I (Klenow) was then inactivated by incubating the mix
at 75ºC for 20 minutes. The blunt-ends of the plasmid were then dephosphorylated by
the addition of 1 μl CIAP followed by incubation at 37ºC for 60 minutes. The mix
was then run on an agarose gel so that the digested blunt-ended DNA could be gel
purified and quantified ready for ligation with an insert. If a restriction enzyme(s)
which creates a ‘natural’ blunt-end was used then the fill-in/trimming step was not
necessary.
Prior to ligation the insert was phosphorylated using T4 Polynucleotide Kinase in a
reaction mix set up as follows:
Insert DNA 19 μl
5x DNA ligase buffer 5 μl
T4 Polynucleotide Kinase 1 μl
The mix was then incubated for one hour at 37ºC and then for 15 minutes at 65
ºC to
inactive the T4 Polynucleotide Kinase. The following 20 μl ligation mix could then
be assembled:

Chapter 2. Materials and methods
50
Phosphorylated insert DNA X μl
Digested plasmid vector X μl
10 mM ATP 1 μl
5x DNA ligase buffer 4 μl
Sterile H2O up to 10 μl
T4 DNA Ligase 1 μl
This mix was incubated overnight at 16ºC in a thermocycler. The following morning
the ligation mix was either stored at -20ºC or immediately transformed into competent
α-select (silver and bronze efficiency) E. coli cells (section 2.5.7). Putative
transformed colonies were then cultured overnight in Luria-Bertani (LB) broth and the
resultant plasmids were isolated (section 2.5.8), quantified and definitively verified.
For sticky-end ligation the fill-in/trimming, dephosphorylation and phosphorylation
steps were not required and the molar ratio of insert:vector was less critical than with
blunt-end ligation so a ratio of 1:1 to 3:1 was applied.
2.5.5 pENTRTM/D-TOPO® topoisomerase reaction
Gel purified blunt-end inserts, generated by PCR with pENTRTM/D-TOPO®
compatible olignucleotides (CACC motif on 5’ end of the forward primer), were
initially cloned into the pENTRTM/D-TOPO® entry vector and then recombined, using
LR ClonaseTM II, into an appropriate Gateway®
-compatible destination vector. The
TOPO® cloning reaction was assembled according to the manufacturer’s protocol as
follows:
Fresh PCR product 0.5 to 4 μl*
Salt solution 1 μl
Sterile H2O up to a final volume of 5 μl
TOPO® vector 1 μl
6 μl
*0.5:1 to 2:1 molar ratio of PCR product: TOPO® vector.
A molar ratio (insert:vector)
of 3:1 was used

Chapter 2. Materials and methods
51
The reaction mix was gently stirred and incubated for 5-30 minutes at room
temperature. The mix was then placed on ice and 2μl of the reaction was used to
transform either One-Shot® TOP10 or Mach1
TM-T1
R chemically competent E. coli
cells. Putative transformed colonies were cultured overnight in LB broth and the
resultant plasmids were isolated, purified, and quantified followed by definitive
verification.
2.5.6 LR clonase reaction
Inserts from pENTRTM/D-TOPO® were cloned into Gateway
®-compatible destination
vectors using LR ClonaseTM II with an entry vector and destination vector reaction
ratio of 1:1 in a reaction mix assembled in the following way:
Entry clone (50-150 ng) 1-7 μl
Destination vector (150 ng/μl) 1 μl
TE buffer, pH 8.0 up to 8 μl
The LR ClonaseTM II enzyme mix was thawed on ice for two minutes and briefly
mixed with a vortex. 2 μl of the enzyme mix was then added to the reaction which
was then mixed briefly with a vortex and centrifuged for 5-6 seconds. The mix was
incubated for 60 seconds at 25ºC after which the reaction was terminated by the
addition of 1 μl of Proteinase K solution, brief mixing by vortex and incubation for ten
minutes at 37ºC. 1 μl of the reaction mix was then transformed into either One-Shot
®
TOP10 or Mach1TM
-T1R chemically competent E. coli cells. Putative transformed
colonies were then cultured overnight in LB broth and the resultant plasmids were
isolated, quantified and definitively verified.
2.5.7 Transformation of competent Escherichia coli
A 50-100 μl aliquot of competent E. coli cells was thawed on ice. 1-2 μl of a DNA
ligation reaction mix or LR Clonase reaction mix was added and gently mixed with a
pipette tip. The DNA and cell mix was then incubated on ice for 5-30 minutes. The
mix was then heat-shocked for 30 seconds at 42ºC and immediately transferred to ice.
250 μl of room temperature SOC medium (Super Optimal broth with Catabolite
repression – 2 % w/v tryptone, 0.5 % w/v yeast extract, 0.4 % w/v glucose, 10 mM
NaCl, 2.5 mM KCl, 10 mM MgCl2, 10 mM MgSO4) was then added to the mix which

Chapter 2. Materials and methods
52
was then shaken at 200 rpm for 60 minutes at 37ºC. 50-200 μl of the transformation
mix was then plated on LB plates (1 % w/v tryptone, 0.5 % w/v yeast extract, 1 % w/v
NaCl, 0.5 % w/v agar, adjusted to pH 7.5) supplemented with the appropriate
antibiotic (pENTRTM/D-TOPO®: 50 μg/ml kanamycin, p$POHA derived vectors: 100
μg/ml spectinomycin, pMBL8a and pGUSGW, ESfill C1 derived vectors: 100 μg/ml
ampicillin) for selection. Plates were then incubated overnight at 37ºC. Verification
of successful insertions was initially conducted with colony PCR (as per section 2.4.5
with a small amount of appropriate bacterial colony, transferred from an LB plate, as
the DNA template). Putative positive colonies were then transferred and bulked up in
LB broth (1 % w/v tryptone, 0.5 % w/v yeast extract, 1 % w/v NaCl, adjusted to pH
7.5) supplemented with the appropriate antibiotic and incubated for 16 hours at 37ºC
with shaking at 200 rpm.
2.5.8 Plasmid DNA preparation
Plasmid DNA preparation was conducted at room temperature using the QIAprep
Spin Miniprep Kit following the manufacturer’s protocol with minor modifications. 2
ml of an antibiotic supplemented LB broth culture was pelleted in a 2 ml
microcentrifuge tube by centrifugation at 13,000 rpm for three minutes. The
supernatant broth was then discarded. This step was repeated two more times using
the same tube. The pelleted bacterial cells were resuspended in 250 μl of resuspension
buffer P1 (kit reagent) using a vortex. 250 μl of lysis buffer P2 (kit reagent) was then
added and mixed by gently inverting the tube 4-6 times. 350 μl of neutralisation
buffer N3 (kit reagent) was then quickly added and the tube was gently inverted 4-6
times until the solution became cloudy. The solution was then centrifuged at 13,000
rpm for 10 minutes. The resultant supernatant was then applied to a QIAprep Spin
Column seated in a 2 ml microcentrifuge tube and centrifuged at 13,000 rpm for one
minute. The flow-through was discarded and the column was initially washed by
adding 500 μl of buffer PB (kit reagent) and centrifuging the column for one minute at
13,000 rpm. The flow-through was decanted and further washing was carried out by
adding 750 μl of wash buffer PE (kit reagent) to the column followed by incubation at
room temperature for 5-10 minutes and centrifugation for one minute at 13,000 rpm.
The flow-through was once again discarded and the column was centrifuged for a
further minute at 13,000 rpm to remove residual wash buffer. The column was then
placed in a clean 1.5 ml Eppendorf tube. 40-50 μl of nuclease-free water was then

Chapter 2. Materials and methods
53
applied to the centre of the column which was the left to stand for 10-15 minutes. The
column was then centrifuged for one minute at 13,000 rpm. The isolated plasmid
DNA was then in the resultant eluate which was stored at -20ºC until further use in
additional cloning procedures, plant/agrobacterium transformations and/or further
verification with restriction digest or sequencing.
2.6 Transformation of Arabidopsis thaliana with Agrobacterium tumefaciens
2.6.1 Transformation of Agrobacterium tumefaciens with plasmid DNA
50 μl of A. tumefaciens (GV101::pMP90RK) electrocompetent cells were thawed on
ice. 1 μl of plasmid DNA was added and mixed with the cells on ice and transferred to
a pre-chilled sterile Eppendorf electroporation cuvette which was then subjected to 5
msec pulse of capacitance 25 μF, resistance 200 Ω and field strength 2.5 kVcm-1
on a
Bio-Rad Gene Pulser. 1ml of low salt LB broth (1 % w/v tryptone, 0.5 % w/v yeast
extract, 0.5 % w/v NaCl, adjusted to pH 7.0) was then immediately added to the
cuvette and the bacterial suspension was transferred to 10 ml of low salt LB broth and
incubated for four hours at 28ºC with shaking at 150 rpm. 50-200 μl of the bacterial
broth was then plated on low salt LB agar plates containing 50 μg/ml gentamicin, 100
μg/ml rifampicin, 50 μg/ml kanamycin and 100 μg/ml spectinomycin. The plates
were then incubated for 2-3 days at 28ºC and then stored at 4
ºC.
2.6.2 Preparation of Agrobacterium tumefaciens for floral dipping
A modified version of the floral dipping method described by Clough and Bent (1998)
was used for the transformation of A. thaliana. 5 ml of low salt LB broth containing
the antibiotics described in section 2.6.1 was inoculated with an antibiotic-resistant A.
tumefaciens colony from an LB plate which was then cultured overnight at 28ºC in a
sterile 50 ml Falcon tube with shaking at 150 rpm. 500 μl of the culture was added to
50 ml of antibiotic-free low salt LB broth in a sterile conical flask and cultured further
overnight at 28ºC with shaking at 150 rpm. Cells were then pelleted by centrifugation
for 10 minutes at 5,000 rpm in a Heraeus centrifuge. The resultant supernatant was
discarded and the A. tumefaciens pellet was resuspended, by way of gentle mixing, in
200 μl of 5 % sucrose solution to which 100 μl of silwet L-77 was added.

Chapter 2. Materials and methods
54
2.6.3 Agrobacterium tumefaciens-mediated transformation of Arabidopsis thaliana
by floral dipping
Arabidopsis thaliana plants were grown until they flowered. The initial floral bolt
was cut to promote the growth of multiple secondary stems. After 5-7 days, the plants
were transformed by submerging flower buds in the A. tumefaciens sucrose/silwet
solution (prepared as described in section 2.6.4) for 10-15 seconds. The plants were
then placed in the dark and kept in high humidity for one hour. Dipping was repeated
2-3 more times, with 3-4 day intervals, on freshly bolted inflorescences. The plants
were maintained until they set seed. Once the seed had been collected transformants
were determined by the detection of seed-expressed green fluorescent protein (GFP)
(Fig 2.7) with a Leica MZFLIII stereo microscope with GFP3 and B filters.
Transformed plants (T1 lines) were grown and PCR verification of the insertion was
conducted using genomic DNA. Transgene expression was confirmed by RT-PCR
using RNA extracted from flowers.
Figure 2.7. Detection of seed-expressed GFP in transformed A. thaliana plants.
A, Brightfield seed. B, GFP seed.
2.6.4 Polyethylene glycol(PEG)-mediated transformation of Physcomitrella patens
Six day old wildtype P. patens protonemal tissue cultured on a BCDA agar plate
covered by cellophane was scraped off the plate and transferred into 5 ml 1 %
Driselase/8 % mannitol solution and gently stirred at room temperature for 30-40
minutes until the filamentous tissue was no longer visible and a protoplast suspension
A B

Chapter 2. Materials and methods
55
had therefore formed. The protoplast suspension was then carefully applied to a 100
μm filter. The filtered protoplast suspension was transferred to a 25 ml plastic bottle
and centrifuged at 700 rpm for four minutes. The resultant supernatant was removed
leaving only a small volume (~0.2 ml) of the supernatant. The protoplasts were then
initially resuspended in the remaining supernatant to loosen the pellet and then with
the addition of 10 ml of sterile 8 % mannitol. At this point a 0.2 ml aliquot of the
protoplast suspension was taken to ascertain protoplast density using a
haemocytometer (mean number per 1 mm2, n = 8). The centrifugation and
resuspension steps were then repeated. The protoplasts were resuspended in sterile 8
% mannitol at 2x the required density for transformation (optimal density for
transformation is 1.6x10⁶/ml). 150 μl of the protoplast suspension was then pipetted
with wide-bored tips into 2 ml tubes with sterile 2xMaMg (for 100 ml - 6.1 g
MgCl2·6H2O, 8 g mannitol, 0.2 g MES) and gently mixed well with the pipette tip.
12-15 μg of DNA (in 30 μl of sterile water) was quickly added to the mix with further
gentle mixing. The 2xMaMg/protoplast/DNA mix was then transferred to a 10 ml
tube containing sterile PEGcms (for 10 ml – 0.236 g Ca(NO3)2·4H2O, 0.0476 g
HEPES, 0.728 g mannitol, 4 g PEG6000) using a Pasteur pipette. The whole mix was
pipetted gently once, returned to the tube, and heat-shocked for five minutes at 45ºC.
The PEG/protoplast mix was then diluted with sterile 8 % mannitol over a period of
30-60 minutes to allow the protoplasts a chance to recover from a high concentration
PEG condition to a lower one, eg. 300 μl x 1, 600 μl x 2, 1 ml x 2, then volume
brought up to 9 ml. In each dilution step the protoplasts were thoroughly, but gently,
mixed by tilting and rolling the tubes. The diluted protoplasts were then centrifuged
for four minutes at 700 rpm. Whilst centrifugation was taking place 50 μl of CaCl2
was added to 5 ml of liquid protoplast regeneration medium-top layer (PRM-L)
(BCDA + 6 % mannitol + 10 mM CaCl2). The supernatant from the centrifuged
diluted protoplast mix was then removed and the 5.05 ml of PRM-L was added and
mixed gently with the protoplasts. The suspension was then incubated in the dark at
25ºC overnight.
The following morning the protoplasts had sunk to the bottom of the tube and the
supernatant was removed. Warm ≥45ºC protoplast regeneration medium-top layer
(PRM-T) (PRM-L + 0.4 % agar) was then quickly added and gently mixed and
pipetted onto protoplast regeneration medium-bottom layer (PRM-B) (PRM-L + 0.55

Chapter 2. Materials and methods
56
% agar) plates overlaid with cellophane. The plates were then incubated under
continuous light at 25ºC. After 3-4 days the cellophane(s) attached to the PRM-T and
cultures were transferred using sterile forceps to BCDA plates supplemented with
adequate appropriate antibiotics. These plates were then incubated under continuous
light at 25ºC. Two weeks later, the same cellophane(s) were transferred to antibiotic-
free BCDA plates and incubated under continuous light at 25ºC. Two further weeks
later the cellophane(s) were transferred to fresh antibiotic-supplemented BCDA plates
for a second round of selection to eliminate transient transformants. After one week
of incubation surviving colonies were deemed to be stable putative positive
transformants and grown on antibiotic-free media for tissue collection, nucleic acid
extraction, genotyping and phenotyping.
2.7 Phenotypic analyses
2.7.1 Scanning electron microscopy (SEM)
For SEM examination without fixation fresh spore capsules (punctured) and dehisced
anthers were mounted on 12.5 mm diameter specimen stubs using adhesive carbon
tape. Samples were then coated with 25 nm of gold in an Edwards S150B sputter
coater and then viewed and imaged with a Phillips XL-20 microscope at an
accelerating voltage of 10 Kv.
For SEM examination with fixation the specimens were primarily fixed in 3 %
glutaraldehyde in 0.1 M phosphate buffer for four hours at 4ºC. The specimens were
then washed in 0.1 M phosphate buffer twice (15 minutes each time) at 4ºC.
Secondary fixation was carried out in 2 % aqueous osmium tetroxide for 60 minutes at
room temperature. The wash step was then repeated. Specimens were then
dehydrated in a graded series of ethanol at room temperature (75 % ethanol for 15
minutes, 95 % ethanol for 15 minutes, 100 % ethanol for 15 minutes x 2, 100 %
ethanol dried over anyhydrous copper sulphate for 15 minutes). The specimens were
then critical point dried and mounted, coated and viewed as previously described.

Chapter 2. Materials and methods
57
2.7.2 Transmission electron microscopy (TEM)
Spore capsules and anthers were fixed and dehydrated using the method described in
section 2.7.1 although samples were incubated in primary fixative overnight. After
dehydration the samples were transferred to glass vials to which 2-3 ml of the solvent,
propylene oxide, was added. The sample was incubated for 15 minutes at room
temperature after which the propylene oxide was decanted. This solvent step was then
repeated. Samples were then infiltrated with a 50:50 Araldite/propylene oxide resin
overnight at room temperature. The following morning samples were transferred to
100 % Araldite resin and incubated for 6-8 hours at room temperature. The samples
were then embedded in fresh 100 % araldite resin, supplemented with BDMA (benzyl
dimethylamine) accelerator, in an appropriate mould. The embedded samples were
baked in an oven at 60ºC for 48-72 hours. Once the resin blocks had set 85-90 nm
sections were cut with a diamond knife, using a Reichert-Jung Ultracut E
ultramicrotome, and mounted on copper TEM grids. Sections were then stained for
10 minutes with uranyl acetate in the dark and then with Reynold’s lead citrate for a
further 10 minutes. The sections were then viewed and imaged using a FEI Tecnai G2
Spirit TEM.
2.7.3 Spore germination test
Spore capsules were harvested and air dried for 3-5 days. Spores were germinated
using the method described in section 2.2.5. Using a Leica dissection microscope the
number of germinated spores were counted each day (for five days) after the spores
were plated. The percentage of spores which germinated was calculated for each day
(three replicates per P. patens line). A minimum of 200 spores per replicate were
included in the analysis.
2.7.4 Acetolysis
A minimum of 200 spores per P. patens line were harvested in a small quantity of
water in 1.5 ml Eppendorf tubes. Approximately 1 ml of glacial acetic acid was added
to each sample which were then centrifuged for one minute at 13,000 rpm. The
supernatant was decanted and ~1 ml a 9:1 (v/v) mixture of acetic anhydride and
sulphuric acid was added to each sample tube. The samples were then incubated at
~70ºC for 20-25 minutes. After incubation the samples were centrifuged for three
minutes at 13,000 rpm. The acetic anhydride/sulphuric acid mix was then diluted with

Chapter 2. Materials and methods
58
water and decanted. The spores were then mounted on a glass slide and observed and
counted using an Olympus compound light microscope.
2.7.5 Raman microspectroscopy
Spores of wildtype and mutant P. patens lines were placed on calcium fluoride slides
with a drop of water. For each measurement a single spore was selected and spectra
were acquired with a confocal Raman microscope (100 μm aperture pinhole). The
linear polarised laser beam (λ = 532.25 nm) was targeted on spores using a charge-
coupled device camera monitor and a motorised XY stage (0.1 - μm step). The
acquisition time for one spectrum was 8-10 seconds. Spectra were processed for
baseline correction and normalisation by LabSpec 5 software (Horiba Jobin Yvon
Ltd., UK). Principle components analysis (PCA) was performed using SIMCA (v.
8.0, Umetri AB, Sweden).

Chapter 3. Physcomitrella patens sporophyte development
59
CHAPTER 3. The development of the Physcomitrella patens
sporophyte
3.1 Introduction
The ephemeral bryopsid moss P. patens, a member of the Funariaceae, is distributed
widely throughout temperate zones, particularly in the northern hemisphere, where
development is initiated in late summer by the germination of overwintered spores. It
typically grows on the banks of rivers, lakes and ponds exposed by falling water levels
(Prigge and Bezanilla 2010). Sporophytes develop in the autumn or early winter
prompted by decreasing temperatures and shortening days (Hohe et al. 2002).
In common with vascular plants P. patens exhibits alternation of generations where it
undergoes two distinct stages in its life cycle: a haploid stage (gametophyte) capable
of producing gametes by way of mitosis, and a diploid stage (sporophyte)
characterised by the ability of the moss to generate haploid spores via meiosis (Fig.
3.1). As with other bryophytes, the gametophyte in P. patens is the larger, longer-
lived and nutritionally independent generation and is therefore dominant. The
sporophyte does not become free-living and is nutritionally dependent on the
gametophyte and is permanently attached to it (Haig and Wilczek 2006; Prigge and
Bezanilla 2010).
Physcomitrella patens germinates from a haploid spore giving rise to protonemal
filaments, the first component of the dimorphic gametophyte, which develop by
growth of stem cells at the apex of each filament (Menand et al. 2007). Chloronemal
cells with large and abundant chloroplasts (50-100 in number) are the first to emerge.
As development continues the apical cells transition to caulonemal cells which are
associated with fast growth. Side branching in chloronemal filaments eventually
becomes modified to enable the emergence of gametophores, the second gametophyte
component, which at their apex give rise to both antheridia and archegonia (P. patens
is monoicious). The antheridia generate motile flagellate sperm (spermatozoids)
which, when conditions are moist, swim to fertilise egg cells within archegonia
(Prigge and Bezanilla 2010). Following gamete fusion, the zygote develops into the
diploid generation, the sporophyte, which materialises as a proto-shoot structure

Chapter 3. Physcomitrella patens sporophyte development
60
which remains relatively small and connected to the gametophore (Glime 2007). The
sporophyte consists of a short seta and a spore capsule (sporangium) within which
cells undergo meiosis to form haploid, unicellular spores which are ultimately
dispersed into the environment.
Figure 3.1. The life cycle of P.patens. In common with all embryophytes the life
cycle of P. patens alternates between two morphologically and physiologically
distinct generations, the haploid gametophyte and the diploid sporophyte.
Whilst there has been a significant increase in our understanding of many of the
developmental processes associated with P. patens in recent years, only minimal
progress has been achieved with regard to the development of its spore wall.
Therefore the primary focus of this chapter is on spore wall formation in P. patens and
how closely the wall construction processes in this moss conform to that of other
embryophytes, particularly bryophytes, as described in section 1.2.3 of chapter 1. In
order to illuminate these processes, such as layer deposition, timing and origin, wall
ultrastructure is examined with the use of TEM. TEM analysis also allows the
determination of wall development with respect to sporogenesis and the morphology

Chapter 3. Physcomitrella patens sporophyte development
61
of the spore capsule. The following sporogenesis/spore capsule developmental stages
in P. patens have been speculatively proposed (S. Schuette, University of Southern
Illinois, USA, pers. comm. 2009):
1. Archesporial – Early sporophyte; spore capsules likely to be torpedo-shaped.
2. Pre-meiotic free spore mother cells – Spore capsules ellipsoid and translucent.
3. Free spore mother cells undergoing meiosis; spore capsules ovoid and
translucent.
4. Post-meiotic microspores – Early spores within spore mother cells; spore
capsules spherical and slightly yellow.
5. Free spores – Spore capsules spherical and dark yellow to brown.
The same source suggests that spore wall formation takes place in stages four and five
based on TEM analysis of ultrastructural features. Huang et al. (2009) have offered
the only other attempt to characterise sporogenesis/spore capsule maturation and have
subdivided the process into four stages which can be described as follows based on
their TEM analysis (Fig. 3.2):
1. Archesporial/spore mother cells – Spore capsules ovoid, lime green and
slightly translucent.
2. Pre-meiotic free spore mother cells – Spore capsules spherical and dark green.
3. Post-meiotic microspores in tetrad – Spore capsules spherical and brown.
4. Free spores - Dehisced brown capsules.
This chapter therefore also aims to test and refine these proposed characterisations of
spore wall development with respect to sporogenesis and spore capsule morphology.
The basic general development of selected P. patens ecotypes is also compared with
the current knowledge regarding its life cycle. Three ecotypes/lines were used in this
study. The Gransden ecotype, collected in a field near Gransden Wood in
Cambridgeshire, UK by H. Whitehouse in 1962 (Ashton and Cove 1977), is regarded
as the standard laboratory strain and two Gransden lines, Gransden 2004 and GrD12,
are included in this study. The Villersexel K3 ecotype, collected from Villersexel,
Villers la Ville, France is also included. Both Gransden lines are derived from the
original single isolate collected near Gransden Wood. Gransden 2004 is a direct self-

Chapter 3. Physcomitrella patens sporophyte development
62
Figure 3.2. Proposed model by Huang et al. (2009) of sporophyte development
with respect to sporogenesis in P. patens. Images in the left column show the entire
sporophyte, and the right column consists of TEM images which show sporogenesis.
Key: smc = spore mother cell. Modified from Huang et al. (2009).
Archesporial/
Spore mother
cells
Pre-meiotic
free spore
mother cells
Post-meiotic
microspores in
tetrad
Free spores

Chapter 3. Physcomitrella patens sporophyte development
63
fertilised descendant of the original isolate (derived from a single spore) and was the
line used to sequence the P. patens genome. GrD12 was regenerated from a single
spore of Gransden 2004 and is therefore a direct self-fertilised descendant of Gransden
2004. Given this history, there are likely to be very few genetic differences between
these two Gransden lines although it is possible that there are epigenetic differences
(A. Cuming, University of Leeds, UK, pers. comm. 2013).
3.2 Results
3.2.1 The life cycle of Physcomitrella patens
Spores from Gransden 2004, GrD12 and Villersexel K3 ecotypes/lines germinated 36-
48 hours after being plated. Gransden 2004 and Villersexel K3 germinated spores
were observed for five days after plating. In each ecotype 74-75 % of spores had
germinated after five days (Fig. 3.3). In all three ecotypes/lines densely branched
Figure 3.3. Spore germination for two ecotypes of P. patens (Gransden 2004 and
Villersexel K3) under controlled axenic conditions (n=3).
0
10
20
30
40
50
60
70
80
90
0 1 2 3 4 5
% G
erm
inati
on
Days
Gransden 2004
Villersexel K3

Chapter 3. Physcomitrella patens sporophyte development
64
protonemal tissue subsequently developed, followed by the formation of
gametophores after approximately 14 days. Gametophore growth in Gransden 2004
was less vigorous than observed in the other two ecotypes/lines and took longer to
reach full maturity whereby it could be possible for gametangia development to be
induced. With GrD12 and Villersexel K3, cultures could be transferred to
sporophyte induction conditions (see chapter 2, section 2.2 for full details of P. patens
culturing conditions) approximately 14 days after initial gametophore development
with abundant fully formed gametangia observed after approximately 7-14 days
exposure to inductive conditions. Sporophyte development was initiated 7-14 days
after gametangia maturation and abundant mature spore capsules (~0.6ml in diameter)
could be observed after a further 21 days above and below water. Sporophytes which
developed below the water surface were reduced in size and were approximately two-
thirds of the size of those which developed above water. In total, the life cycles of
GrD12 and Villersexel K3 take around 3-4 months to complete.
With Gransden 2004 gametophores took 2-3 weeks longer to reach full maturity and
even after subsequent prolonged exposure to inductive conditions (more than one
month), few gametangia were observed and very few sporophytes (typically less than
ten) developed. The life cycle of Gransden 2004 therefore took 4-5 months to
complete and exhibited greatly reduced fertility. The approximate durations of each
life cycle stage for all three ecotypes/lines are summarised in Table 3.1.
Table 3.1. Summary of life cycle stages duration in three P. patens ecotypes/lines.
Spore
Germination
(days)
Gametophore
Initiation
(days)
Gametophore
Maturation
Period (days)
Gametangia
Initiation
(days)*
Sporophyte
Initiation
(days)†
Sporophyte
Maturation
Period
(days)
Total
(months)
Gransden 2004
2
14
21-28
21-28
14-21**
21
4
GrD12
2
14
14-21
14
7-14
21
3
Villersexel K3
2
14
14
7-14
7-10
21
3
* No. of days after transfer to inductive conditions (15˚C, 8 hour photoperiod).
† No. of days after gametangia maturation; **low frequency of sporophyte intiation (typically <10).

Chapter 3. Physcomitrella patens sporophyte development
65
3.2.2 Sporogenesis and spore wall development in Physcomitrella patens
TEM images of spore wall ultrastructure were collated with TEM data acquired from
analysis of early developmental stages of sporogenesis conducted by Huang et al.
(2009) (Fig. 3.4). Attempts were made to acquire early stage images in-house.
However, these attempts were unsuccessful as samples did not appear to fix and/or
infiltrate well with Araldite or Spurr’s resin (Electron Microscopy Supplies, USA) and
as a result, post sectioning, they were severely misshapen and no cell detail could be
discerned.
The TEM data allowed for the increased clarification of sporogenesis with respect to
spore capsule morphology and the process could be characterised by six
developmental stages (Fig. 3.4A). The first stage is termed, archesporial, at which
point the spore capsules are torpedo-shaped, translucent and shrouded by calyptrae,
and archesporial cells are in the process of giving rise to spore mother cells. The
second stage is described as meiotic where the spore mother cells begin to undergo
meiotic cell division which eventually produces four haploid microspores. On
completion of meiosis the four microspores are joined together in a tetrad and TEM
observation suggests that at this stage tetrads are still surrounded by the primary cell
wall of the spore mother cell. The microspores also appear to have a distinct wall
consisting of one layer, the exine, which is reasonably advanced in terms of
development suggesting that the wall construction process may have begun as early as
the meiotic stage. These early stages of sporogenesis occur over a period of 10-14
days. Very shortly after the completion of meiosis the microspores separate from their
tetrad states and spore capsules at this stage are almost fully expanded, ovoid to
spherical in shape, and lime green in colour. Approximately one week after this the
spore capsules are fully expanded and yellow. At this point spore wall construction is
nearing completion. After a further 4-5 days the capsules turn dark brown and spores
are fully mature and ready for dispersal when the spore capsule eventually dehisces.
TEM analysis of the spore wall of P. patens suggests that wall formation most likely
commences immediately after meiosis. The sporopolleninous exine is the first wall
layer to form and seems to ultimately comprise two layers, an initial homogenous
inner layer which when complete is approximately 0.2 µm thick, and a much thinner
electron-dense outer layer which is around 25 nm thick. Both exine layers are

Chapter 3. Physcomitrella patens sporophyte development
66
Figure 3.4. Sporophyte development in P. patens. A, Left column shows the entire
sporophyte, and the middle and right columns consist of TEM images which show
sporogenesis and spore wall development. The top four TEM images (archesporial –
tetrad stage) were obtained by Huang et al. (2009). The remaining TEM images
(post-tetrad (n=2), free spores (n=3) and mature spores (n=3)) were obtained in this
study. The top three spore capsule images are included courtesy of C. Chater
(University of Sheffield, UK). Key: smc = spore mother cell; pm = plasma
membrane; p = perine; ex1 = inner exine; ex
2 = outer exine; in = intine; tp = tapetum;
smc = spore mother cell. B, SEM image of a mature spore.

Chapter 3. Physcomitrella patens sporophyte development
67
uniform in thickness. The inner exine is the first layer to develop and is well
advanced whilst the spores are in tetrads and is fully formed shortly after the
microspores are released from the tetrad state. At the same stage, following tetrad
release, the perine layer is rapidly deposited on the exine and consists of electron-
dense sporopolleninous material most likely discharged from a degenerating tapetum
layer, although the tapetum could not be definitively identified due to the previously
described fixation and/or infiltration problems associated with this type of tissue.
These problems meant that the sporophyte wall layers could only be clearly observed
in a fully developed sporophyte (Fig. 3.5), at which point the tapetum would be
expected to have completely degenerated.
The outer exine layer is only discernable shortly afterwards, at which point the final
wall layer to develop, the fibrillar intine, has begun to form and is already near
completion although not yet uniform in thickness. The perine then reaches
completion forming the spore ornamentation consisting of dense pointed projections
which can be up to 1µm in length (Fig. 3.4B). The completed perine conceals the
outer exine layer which is presumably still present. The intine layer then becomes
fully formed (~0.25 µm thick) and this concludes the process of spore wall formation.
Mature spores range in size from 25-30 µm in diameter.
Figure 3.5. TEM image of a mature P. patens sporophyte section. Sporophyte
wall structure can be clearly observed. The tapetum would appear to be completely,
or mostly, degenerated at this stage.

Chapter 3. Physcomitrella patens sporophyte development
68
3.3 Discussion
3.3.1 Life cycle variation among Physcomitrella patens ecotypes
The optimisation of the controlled conditions, using BCDA medium, for culturing the
Gransden and Villersexel K3 ecotypes of P. patens enabled their life cycles to be
completed in 3-4 months after subculture. The time periods associated with each
developmental stage were also mostly consistent with previous studies (Nakosteen and
Hughes 1978; Collier and Hughes 1982; Schaefer and Zryd 2001). However, these
previous studies demonstrated that the life cycle duration of the Gransden strain could
be reduced to around two months provided cultures were transferred to sporophyte
induction conditions when only a very limited number of gametophores had matured
(~15 days after spore germination). This modification to culture conditions meant
that, whilst sporulation initiation was quicker, sporophyte abundance was greatly
reduced which was not a practical approach for the studies conducted in this thesis.
One of the Gransden lines included in the study, Gransden 2004, did not consistently
complete its life cycle as the sporophyte generation could not be easily induced. It is
likely that further attempts to optimise culturing conditions would not improve
sporophyte induction consistency in this line as years of culture in the laboratory
appear to have considerably reduced its fertility, particularly as the limited amount of
study conducted with regard to the sporophyte generation of P. patens suggests that
Gransden 2004 has mostly been maintained vegetatively. It is possible that allowing
cultures to regularly undergo sexual reproduction, and therefore regularly complete
their life cycles, helps to maintain the reproductive vigour of a line. (A. Cuming,
University of Leeds, UK, pers. comm. 2013). The levels of fertility exhibited by these
lines should influence the choice of strain when embarking upon physiological and
reverse genetic approaches involving the sporophyte generation.
3.3.2 Revision of developmental staging of sporogenesis
The TEM analysis conducted for this study suggests that previous propositions
regarding developmental staging of sporogenesis with regards to spore capsule
morphology require revision. In particular, this new data greatly contradicts the
staging advocated by Huang et al. (2009). The TEM images presented here (Fig. 3.4)
conclusively demonstrate that the intimation by Huang et al. (2009), that the spore

Chapter 3. Physcomitrella patens sporophyte development
69
capsule has reached an advanced stage in its development (close to full expansion,
ovoid and lime green) before the spore mother cells have undergone meiosis, is
inaccurate. The results are somewhat more consistent with the staging proposed by S.
Schuette (University of Southern Illinois, USA, pers. comm. 2009) although once
again the speed of spore capsule development is overestimated with respect to spore
development. When all data and proposals are considered the following model of
sporogenesis with respect to spore capsule morphology can now be put forward:
1. Archesporial/spore mother cells – Early sporophyte; spore capsule at intial
stage of expansion; formation of spore mother cells.
2. Free spore mother cells undergoing meiosis – spore capsules likely to be
torpedo-shaped and mostly translucent/lime green. Spore wall construction
initiated.
3. Early microspores/tetrad stage – spore capsules ellipsoid, mostly
translucent/lime green.
4. Immediately post-tetrad/free spores - spore capsules ovoid to spherical and
lime green.
5. Maturing free spores – spore capsules spherical and yellow.
6. Mature spores – spore capsules spherical and brown.
Additional TEM analysis is required to confirm or clarify the early stages of
sporogenesis and therefore the first three stages of the above model can only be
regarded as a revised hypothesis of sporogenesis in P. patens. Given the problems
encountered in this study with regards to the fixation and infiltration of early stage
spores, TEM preparation protocols need to be optimised further or different
techniques need to be explored. Araldite resin was replaced with Spurr’s resin, used
successfully by Huang et al. (2009), in later attempts at obtaining TEM sections.
Spurr’s resin is considerably less viscous than Araldite resin and may therefore
improve tissue infiltration. However, in this instance the use of Spurr’s resin did not
improve the quality of the sections which perhaps suggests that fixation is the primary
problem. If further optimisation with resin and various fixatives does not yield
improved results then the application of cryo-TEM could be investigated whereby the
freezing of hydrated samples replaces traditional fixing and infiltration.

Chapter 3. Physcomitrella patens sporophyte development
70
Despite the potential for further clarification, the updated characterisation and staging
of sporophyte/spore development presented here increases our understanding of the
maturation of the diploid stage in the life cycle of P. patens. This revision can also
aid functional genomic approaches by assisting the pinpointing of which component
or aspect of sporogenesis sporophyte-upregulated genes, or sporogenesis candidate
genes, may be involved in based upon the morphology of the spore capsule.
3.3.3 Development of the Physcomitrella patens spore wall
The process of spore wall morphogenesis in P. patens is summarised in Fig. 3.6. Wall
construction most likely begins immediately after meiosis at the early tetrad stage with
the formation of the inner exine layer. However, TEM analysis shows that this layer
already exhibits considerable thickness at this stage which suggests that it is not
inconceivable that wall building commences even earlier during meiosis. The inner
exine appears to lack the conspicuous lamellae seen in other early land plant groups
and is of medium electron density and homogenous throughout its development, and
at no point does it appear to be stratiform in character, although TEM images at early
stages of wall development, particularly the tetrad stage, are required to confirm this
as observations in other species have noted that lamellae are only briefly visible
during wall development. The thinner outer exine is also homogenous and, in
agreement with Schuette et al. (2009), forms a very minor part of the eventual
ornamentation of the spore. Schuette et al. (2009), by way of their own TEM
analysis, suggest that the inner exine is fibrillar. However, the TEM images presented
in this thesis do not concur with this observation and conform to the observations of a
non-fibrillar exine presented in the pioneering study on moss wall ultrastructure by
McClymont and Larson (1964). Brown and Lemmon (1990) have previously noted
the occurrence of an initial exine foundation layer in bryopsid moss spore walls which
forms by the accumulation of sporopollenin on WLCL. This foundation layer was not
observed in this study although, given that this layer is described as inconspicuous, it
is likely that it is not easily detectable and, once again, further TEM images obtained
at additional developmental stages may be required to confirm the presence or absence
of this layer.
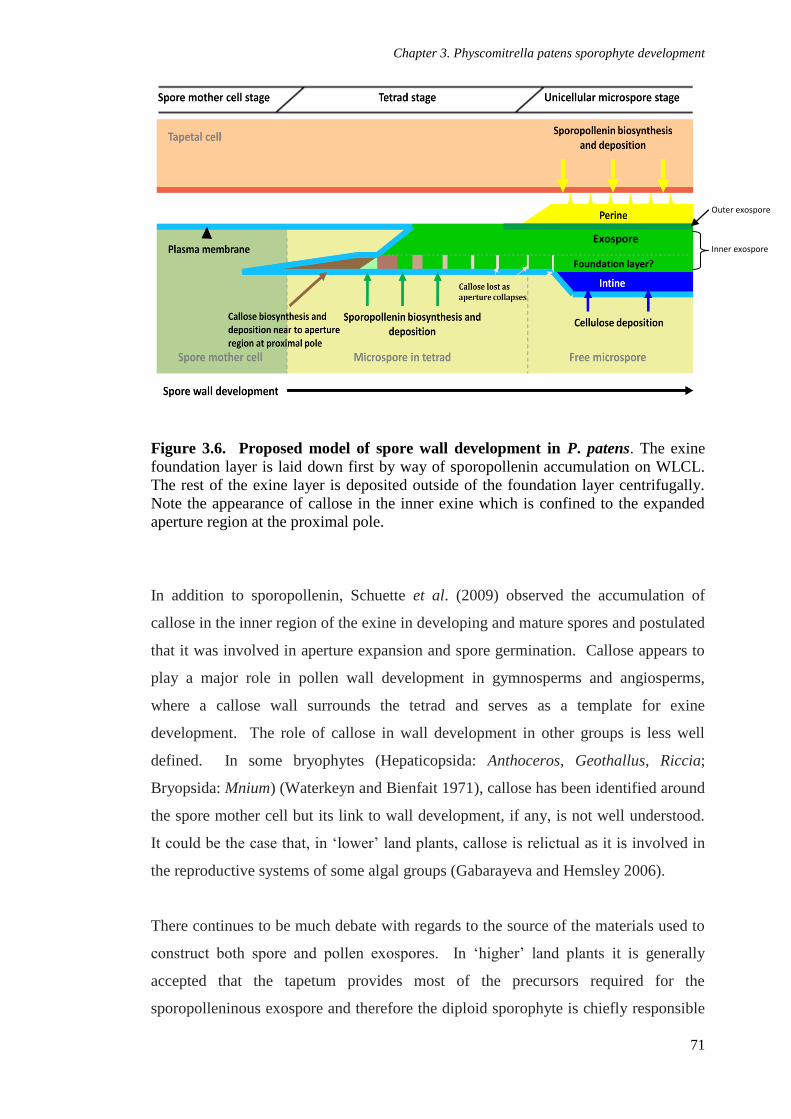
Chapter 3. Physcomitrella patens sporophyte development
71
Figure 3.6. Proposed model of spore wall development in P. patens. The exine
foundation layer is laid down first by way of sporopollenin accumulation on WLCL.
The rest of the exine layer is deposited outside of the foundation layer centrifugally.
Note the appearance of callose in the inner exine which is confined to the expanded
aperture region at the proximal pole.
In addition to sporopollenin, Schuette et al. (2009) observed the accumulation of
callose in the inner region of the exine in developing and mature spores and postulated
that it was involved in aperture expansion and spore germination. Callose appears to
play a major role in pollen wall development in gymnosperms and angiosperms,
where a callose wall surrounds the tetrad and serves as a template for exine
development. The role of callose in wall development in other groups is less well
defined. In some bryophytes (Hepaticopsida: Anthoceros, Geothallus, Riccia;
Bryopsida: Mnium) (Waterkeyn and Bienfait 1971), callose has been identified around
the spore mother cell but its link to wall development, if any, is not well understood.
It could be the case that, in ‘lower’ land plants, callose is relictual as it is involved in
the reproductive systems of some algal groups (Gabarayeva and Hemsley 2006).
There continues to be much debate with regards to the source of the materials used to
construct both spore and pollen exospores. In ‘higher’ land plants it is generally
accepted that the tapetum provides most of the precursors required for the
sporopolleninous exospore and therefore the diploid sporophyte is chiefly responsible
Exospore
Foundation layer?
Inner exospore
Outer exospore

Chapter 3. Physcomitrella patens sporophyte development
72
for the sporopollenin component of the pollen wall (Crang and May 1974; Piffanelli et
al. 1998; Suzuki et al. 2008), and recent studies have demonstrated that several
enzymes associated with sporopollenin synthesis are mostly localised to the
endoplasmic reticulum of tapetal cells (Lallemand et al. 2013). Similar assertions
have also been made with respect to ‘lower’ land plants (Uehara et al. 1991). The
TEM analysis presented here suggests that much of the exine layer has already formed
prior to the degeneration of the tapetum. This implies that the exine layer is most
likely derived from the haploid spore and that the tapetum is probably solely
responsible for providing sporopolleninous material for perine formation. It has been
observed in gymnosperms and angiosperms that spherical vesicles, possibly consisting
of fatty acids and synthesised by the endoplasmic reticulum in the cytosol
(Gabarayeva and Hemsley 2006), can pass through the plasma membrane and secrete
and add a sporopolleninous contribution to the exine (Dickinson and Bell 1970;
Dickinson 1971; Zavada 1983; Gabarayeva 1996). These vesicles, or multimembrane
inclusions, are involved in the processing, synthesis and/or transport of sporopollenin
precursors (Pérez-Muñoz et al. 1993). Spherical vesicles are present and adjacent to
the P. patens spore wall during the entirety of its development although further
analysis is required to determine whether they pass and/or secrete material through the
plasma membrane and therefore whether this mode and origin of sporopollenin
synthesis is conserved in embryophytes. Chromatography has shown that many of
these vesicles are lipidic oil bodies whose primary role is to store food for
gluconeogenesis and subsequent germination (Huang et al. 2009), and affords spores
remarkable longevity in ephemeral environments (Schuette et al. 2006).
Obvious sporopollenin precursor transport/secretory structures were not observed on
the inner surface of the tapetum and this may suggest that the P. patens tapetum is
probably not secretory and therefore it is likely that there is only a single and fairly
rapid tapetal contribution to the spore wall where the electron-dense perine designated
material is shed onto the near complete exine. The density and form of the resultant
spinose perine projections are then possibly determined by a combination of a
genetically controlled template system and self-assembly processes. The projections
are very closely packed together, particularly when compared with the perines of other
members of the Funariaceae such as Physcomitrium pyriforme and Funaria
hygrometrica (Nakosteen and Hughes 1978). The non-secretory status of the tapetum

Chapter 3. Physcomitrella patens sporophyte development
73
needs further confirmation and secretory tapeta have been observed in some mosses
(Krystyna 1995). Once again, TEM artifacts associated with fixation/infiltration
issues may have masked secretory structures and/or morphologies associated with
secretory tapeta such as Ubisch bodies.
Finally, in common with many previously examined moss spores (McClymont and
Larson 1964; Stetler and DeMaggio 1976) the intine layer of P. patens is fibrillar,
lacking stratification and is the last wall layer to develop. A single-layered intine is
not a constant feature of bryopsid mosses as stratification (up to three layers) has been
reported in some species (Carrión et al. 1995; Estébanez et al. 1997). The fibrillar
content of the P. patens intine is not obviously organised or specifically oriented and,
in common with other embrypohytes, most likely consists of cellulose and pectin
inclusions (Hess 1993; Suárez-Cervera et al. 2002). The intine is derived from the
spore and in many land plants has been associated with the increased activity of
dictyosomes in the cytoplasm (Heslop-Harrison 1968b; Echlin and Godwin 1969;
Roland 1971).
The ultrastructural analysis presented here progresses understanding of spore wall
development in this increasingly valuable model plant system. The results confirm
that the formation of the spore wall is a relatively straightforward process, and given
the greater complexity observed in the walls of ‘higher’ plants, is underpinned by
flexible developmental processes which allow for swift evolution and specialisation in
response to evolving lifestyles and changing environments.
3.4 Summary
The life cycles of three ecotypes/lines of P. patens were observed which enabled the
determination of a tractable line(s) for use in research regarding sporophyte
development. Essentially an ecotype/line in which abundant sporophytes could be
consistently induced was sought and identified and used for the reverse genetics and
gene expression analyses conducted in this study. TEM analysis of P. patens spore
wall ultrastructure enabled wall development and sporogenesis, with respect to
sporangium morphology, to be characterised, and previous propositions with regard to
this to be substantially revised. The revised characterisation will better inform

Chapter 3. Physcomitrella patens sporophyte development
74
experimental approaches, such as transcriptomic analyses, in future EvoDevo studies
involving the P. patens sporophyte.
The wall ultrastructure data presented in this chapter further elucidates the processes
which underpin wall formation. When this data is pooled with previous studies
regarding wall development in mosses, updated hypotheses can be formed. It would
appear that the sporopolleninous exine layer in P. patens is most likely predominately
derived from the spore and the perine layer is entirely constructed from
sporopolleninous material derived from a degenerating tapetum soon after tetrad
release. A single-layered pectocellulosic intine derived from the spore is the final
layer to develop. Increased understanding of wall construction processes will allow
for improved understanding of phenotypic analyses conducted on spores of P. patens
knock-out lines, as presented in later chapters in this thesis, and associated gene
function.

Chapter 4. Identification of candidate spore wall genes
75
CHAPTER 4. Identification of candidate spore wall genes in
Physcomitrella patens
4.1 Introduction
The data presented in chapter 3 add to the previous evidence gathered with regards to
the spore walls of ‘lower’ land plants which suggest that, whilst their structure is
considerably simpler than the walls of pollen grains, many of the developmental
processes responsible for the formation of both spore and pollen walls are remarkably
similar. This implies that the molecular mechanisms which underpin wall
development in ‘higher’ plants may also be present, and function, in ‘lower’ land
plants and therefore are conserved in embryophytes.
The developmental processes associated with pollen wall formation are controlled by
intricate regulatory gene networks involving a number of structural proteins,
metabolites and transcription factors. Additionally, in recent years a number of genes
implicated in pollen wall development (genes identified in A. thaliana are described in
chapter 1) have been linked to lipid metabolism (particularly fatty acids) and to
polysaccharide metabolism (specifically callose, cellulose and pectin). Lipid
metabolic pathways play a significant role in the synthesis of sporopollenin and most
of the substances utilised for lipid metabolism are derived from acetyl-CoA of the
tricarboxylic acid cycle (Ariizumi et al. 2011; Jiang et al. 2013). Whilst the
biosynthetic route and genetics of sporopollenin are still not well understood a model
of tapetum derived sporopollenin has been proposed. Fatty acids are synthesised in
the plastids of the tapetal cells and transferred to the endoplasmic reticulum to be
hydroxylated. The resultant hydroxylated fatty acids are then reduced to fatty alcohol
groups and then covalently linked with phenylpropanoids to form sporopollenin
precursors. These precursors are then translocated to the surface of the microspores
via vesicular transport or an adenosine triphosphate binding cassette transporter, with
the aid of lipid transfer proteins (Huang et al. 2011; Grienenberger et al. 2010;
Ariizumi and Toriyame 2011; Jiang et al. 2013).
Polysaccharide metabolic pathways are strongly associated with intine formation,
primexine formation, and the synthesis and degradation of the primary cell wall of the

Chapter 4. Identification of candidate spore wall genes
76
pollen mother cell and the callose wall (Jiang et al. 2013). The synthesis of callose, a
β-1,3-linked glucan (Dong et al. 2005; Jiang et al. 2013), involves the utilisation of
UDP-glucose as a substrate, as does the synthesis of cellulose which consists of many
β-1,4-linked D-glucose units (Updegraff 1969). The deposition of cellulose is
catalysed by cellulose synthase complexes situated in the plasma membrane (Jiang et
al. 2013). Pectin is mostly comprised of homogalacturan, rhamnogalacturan I and
rhamnogalacturan II, and is synthesised in the Golgi apparatus. During the synthesis
of pectin, which once again starts from UDP-glucose, the backbone of
homogalacturan is in a methylesterified state and therefore consequently the pectins
are fully methylesterified (Brett and Waldron 1996; Tucker and Seymour 2002).
Figure 4.1. Schematic of metabolic pathways and associated enzymes involved in
pollen wall development. The various pollen wall layers are shown in boxes.
Putative genes which contribute in the metabolic pathways are displayed and the
arrows indicate metabolic directions. The dashed box signifies a microspore origin
for the intine. Other layers are proposed to be mostly synthesised in the tapetum.
Key: CHS = chalcone synthase; CHI = chalcone isomerase; FAE = fatty acid
elongation complex; KAS = 3-ketoacyl-ACP; PME = pectin methylesterase; PG =
polygalacturonases. Taken from Jiang et al. (2013).

Chapter 4. Identification of candidate spore wall genes
77
Jiang et al. (2013) recently proposed a model of pollen wall development in
angiosperms which integrates the current knowledge regarding molecular genetic and
metabolic pathway data (Fig. 4.1), much of which was introduced in chapter 1 and is
described in greater detail later in this chapter. This model emphasises that the
substrates involved and their associated products take part in metabolic pathways by
way of a number of catalytic enzyme reactions. By considering this model alongside
whole genome and transcriptome data of P. patens this chapter attempts to accumulate
evidence to test the hypothesis that components of the pollen wall biochemical and
developmental pathways are present in ‘lower’ land plants and have therefore been
conserved across 400 million years of land plant evolution.
A bioinformatic strategy was taken to ascertain whether homologues of the A.
thaliana pollen wall genes described in chapter 1 are potentially present in the
genomes of P. patens and the emerging model lycophyte, Selaginella moellendorffii.
A transcriptomic approach was then employed in order to obtain and compare gene
expression profiles of the early gametophyte and two stages of the sporophyte
generation of P. patens by way of microarray analysis, a sensitive technique for
analysing gene expression across whole genomes, using RNA extracted from
protonemal and dissected sporophyte tissue. Pre-expanded columnar spore capsules
were used to represent the early developmental phase of sporophyte development
(equivalent to the meiotic stage described in chapter 3), and ovoid to near spherical
translucent lime green spore capsules were chosen to represent the mid developmental
stage of the sporophyte (equivalent to the post-tetrad stage described in chapter 3)
(Fig. 4.2). From this it was possible to identify whether potential homologues of A.
thaliana pollen wall genes had significantly upregulated expression in the sporophyte
and were therefore candidate genes likely to be involved in spore wall development of
P. patens. The bioinformatic data associated with these candidate genes was then
used to inform the selection of a single gene for further investigation by way of a
reverse genetics approach (chapter 5).
The methods applied to conduct the experiments and analyses in this chapter,
including BLAST parameters, microarray preparation and analysis, phylogenetic
analyses and sq-RT-PCR, are outlined in detail in chapter 2.
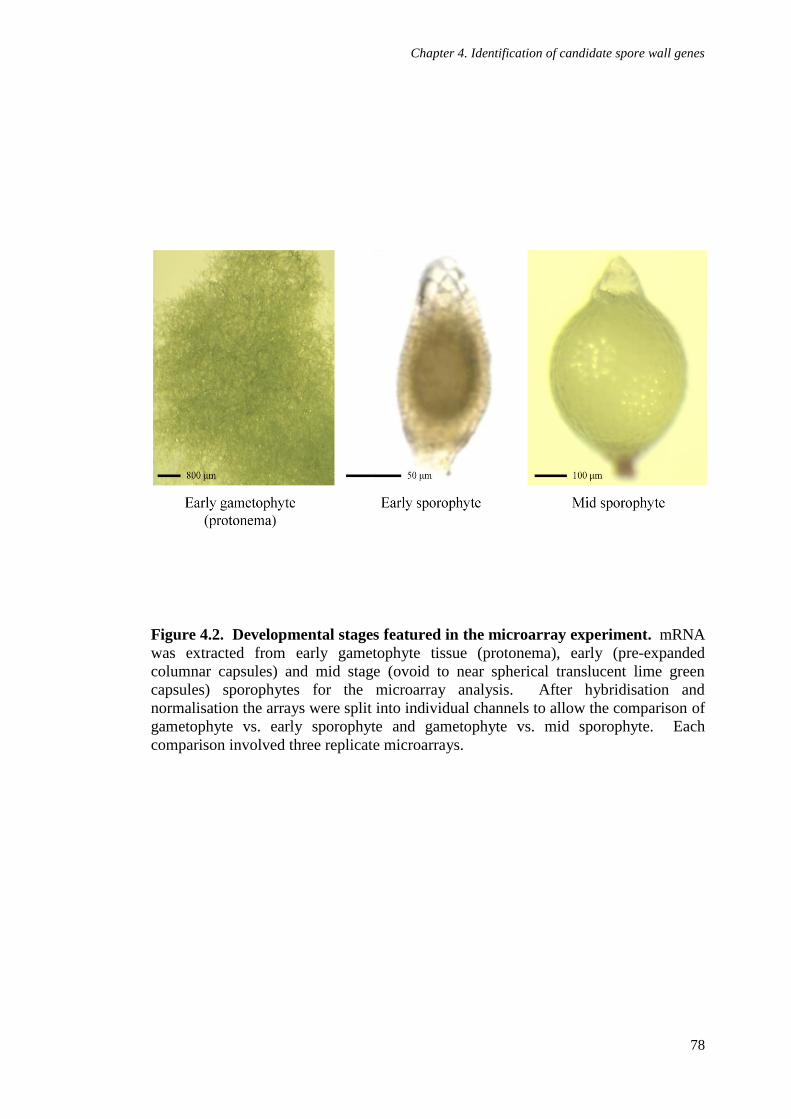
Chapter 4. Identification of candidate spore wall genes
78
Figure 4.2. Developmental stages featured in the microarray experiment. mRNA
was extracted from early gametophyte tissue (protonema), early (pre-expanded
columnar capsules) and mid stage (ovoid to near spherical translucent lime green
capsules) sporophytes for the microarray analysis. After hybridisation and
normalisation the arrays were split into individual channels to allow the comparison of
gametophyte vs. early sporophyte and gametophyte vs. mid sporophyte. Each
comparison involved three replicate microarrays.

Chapter 4. Identification of candidate spore wall genes
79
4.2 Results
4.2.1 Physcomitrella patens and Selaginella moellendorffii genome search results
Literature searches resulted in the identification of 37 A. thaliana genes implicated in
the development of the pollen wall. At the time of writing of this thesis 26 of these
genes had been annotated and their sequences were retrieved from the TAIR website.
The protein sequences were used to search for homologous genes in the P. patens and
S. moellendorffii genomes using TBLASTN. TBLASTN results suggest that
homologues of all but one (FLA3) of the A. thaliana pollen wall associated genes are
present in the P. patens genome with numbers of proposed homologues ranging from
one for NEF1, DEX1 and TDE1/DET2 to in excess of 50 with AtMYB103/MS188.
Similar results were observed in S. moellendorffii with homologues of almost all of
the A. thaliana pollen wall associated genes present in its genome (with the exception
of QRT3) ranging from two homologues in DEX1, MS1 and NEF1 to more than 50
once again for CYP703A2, AtMYB103/MS188 and the callase related A6 gene (Table
4.1).
4.2.2 Microarray analysis: expression profiles of spore wall candidate genes
during sporophyte development
Microarray analysis indicated that a number of the P. patens pollen wall gene
homologues are significantly upregulated at both early and mid sporophyte
developmental stages. MA plots of each of the microarray replicates were used to
determine a cut off value to initially guide the selection of genes for further
investigation (Fig. 4.3). This cut off point was placed at the point at which outliers
begin to appear on the MA plots (~1.25 – 1.4 log fold change in terms of
upregulation). Corrected P-values were also considered although the Benjamini-
Hochberg corrected p-value of p≤0.05 for significantly upregulated genes, the
standard level of significance, is highly conservative and therefore results marginally
in excess of this were not discounted.
Homologues of seven of the pollen wall associated genes, QRT1, CYP703A2,
CYP704B1, RPG1, MS2, ACOS5 and QRT2, have log fold change values in excess of
the cut off boundary (Table 4.2). TBLASTN analysis suggested that
homologues of QRT1 comprise a large multigene family of 45 genes in P. patens.

Chapter 4. Identification of candidate spore wall genes
80
Table 4.1. TBLASTN results of searches of the genomes of P. patens and S. moellendorffii with A. thaliana pollen wall genes. An e-value
threshold of 1e-4 was used as an initial filter to determine number of homologues. Identity percentages (≥30%) and BLAST scores were then used
to filter numbers further. Best match is defined as BLAST hit with the highest BLAST score.
General
function in
A. thaliana
A. thaliana gene
Gene
reference
Proposed Gene class
No of proposed
homologues in
P. patens (no.
significantly
upregulated in
the sporophyte)
% identity of
best match in
P. patens
BLAST score
(bits) of best
match in P. patens
No of proposed
homologues in
S. moellendorffii
% identity of
best match in
S. moellendorffii
BLAST score
(bits) of best
match in
S.
moellendorffii
Sporopollenin
biosynthesis
and exine
formation
MS2
AT3G11980
Fatty acyl reductase
2(1)
48
1293
4
48
1221
YRE/WAX2/FLP1/
CER3
AT5G57800
Aldehyde decarbonylase
4(0)
47
1528
9
49
1642
CYP703A2
AT1G01280
Cytochrome P450
31(2)
46
1106
>50
46
1218
CYP704B1
AT1G69500
Cytochrome P450
8(1)
57
1612
27
60
1514
ACOS5
AT1G62940
Fatty acyl-CoA synthetase
11(2)
50
1378
26
51
1401
RPG1
AT5G40260
Unknown Plasma membrane
protein
6(3)
37
392
26
43
439
NEF1
AT5G13390
Unknown plastid integral
membrane protein
1(0)
44
2487
2
41
2168
KNS5-10 (type 3)
-
Unknown
-
-
-
-
-
-
KNS4 (type 2)
- Unknown - - - - -
-
ABCG26 AT3G13220 ATP-binding cassette
transporter
3(0) 46 1420 6 52 1593
LAP5/PKSB AT4G34850 Polyketide synthase 21(0) 57 1194 9 59 1149
LAP6/PKSA AT1G02050 Polyketide synthase 16(0) 50 944 9 47 932
TKPR1/DRL1
AT4G35420
Oxidoreductase
7(0)
51
868
32
52
850
Continued

Chapter 4. Identification of candidate spore wall genes
81
Table 4.1. Continued.
General
function in
A. thaliana
A. thaliana gene
Gene
reference
Proposed Gene class
No of proposed
homologues in
P. patens (no.
significantly
upregulated in
the sporophyte)
% identity of
best match in
P. patens
BLAST score
(bits) of best
match in P. patens
No of proposed
homologues in
S. moellendorffii
% identity of
best match in
S. moellendorffii
BLAST score
(bits) of best
match in
S.
moellendorffii
Sporopollenin biosynthesis
and exine
formation
(cont.)
TKPR2/CCRL6
AT1G68540
Oxidoreductase
7(0)
52
881
31
52
879
AtMYB103/MS188
AT5G56110
R2R3 MYB transcription factor
>50(0)
75
587
>50
66
482
MS1
AT5G22260
PHD-type transcription
factor
2(0)
37
1109
2
38
1124
AtbZIP34
AT2G42380
bZIP transcription factor
13(0)
60
315
9
67
319
Exine
formation
DEX1
AT3G09090 Unknown membrane protein 1(0) 70 1663 2 50 2210
(probaculae) TDE1/DET2
AT2G38050 Unknown 1(0) 40 455 4
43 495
KNS2, 3, 12 (type 4) AT5G11110
(KNS2)
Sucrose phosphate synthase
(KNS2)
2(0)
(KNS2)
52
(KNS2)
2839
(KNS2)
4 53 2809
Intine
formation
FLA3
AT2G24450
Fasciclin-like
arabinogalactan
0(0)
n/a
n/a
5
33
221
MS33
-
Unknown
-
-
-
-
-
-
RGP1 AT3G02230 Reversibly glycosylated polypeptide
7(0) 83 1609 8 89 1656
RGP2
AT5G15650
Reversibly glycosylated
polypeptide
7(0)
84
1627
8
88
1657
Callose wall
formation
CALS5/LAP1
AT2G13680
Callose synthase
12(0)
64
6575
13
64
6597
KNS1,11 (type 1) - Unknown - - - - - -
Tetrad
Separation
QRT1
AT5G55590 Pectin methylesterase 45(4) 47 804 45 54 821
QRT2
AT3G07970 Pectin methylesterase 3(1) 41 733 20 44 823
QRT3
AT4G20050 Endopolygalcturonase 2(0) 50 996 0 n/a n/a
A6
CAA49853 Callase 31(0) 43 982 >50 45 980

Chapter 4. Identification of candidate spore wall genes
82
Figure 4.3. MA plots for P. patens microarray replicates. A, One replicate of
gametophyte stage expression vs early sporophyte stage expression. B, One replicate
of gametophyte stage expression vs mid sporophyte stage expression. Microarray data
normalised within and between arrays. Plot shows level of up and down regulation of
genes at early sporophyte stage compared to gametophyte stage. M represents log
ratios (log (Cy3/Cy5) and A (logCy3+logCy5)/2 represents average log expression of
each gene across the two developmental stages. Each spot represents a gene or
control.
A
B
M
A
M
A

Chapter 4. Identification of candidate spore wall genes
83
Four genes of this family (Pp_121276, Pp_135225, Pp_14944 and Pp_31639) are
significantly upregulated during both early (1.66 – 2.57 log fold change from
gametophyte stage) and mid (1.90 – 2.95) stages of sporophyte development.
CYP703A2 has 31 homologues in P. patens. Two members (Pp_201018 and
Pp_186336) of this multigene family are significantly upregulated during early (1.44 –
1.58) and mid (1.58 – 1.74) sporophyte stages. CYP704B1 has eight homologues in P.
patens. One of these homologues (Pp_183927) has a log fold change value above the
cut off boundary in both early (1.60) and mid (1.67) sporophyte stages. Six RPG1
homologues are present in P. patens. One of these homologues (Pp_146196) is
significantly upregulated at early and mid sporophyte stages (2.40 and 3.31) and two
more (Pp_149962 and Pp_163268) are highly expressed (1.34 – 1.76) at the mid
sporophyte stage. One of the two homologues of MS2 in P. patens (Pp_11916) is
significantly upregulated at early (1.70) and mid (1.41) sporophyte stages. 11
homologues of ACOS5 are present in P. patens and two of these genes (Pp_81614 and
Pp_104959) are highly expressed in early (1.40 – 1.47) and mid (1.50 – 1.52)
sporophyte stages. QRT2 has three homologues in P. patens. One of these
homologues (Pp_116593) is significantly upregulated at early (1.42) and mid (1.67)
sporophyte stages. Microarray data for all P. patens homologues of A. thaliana pollen
wall associated genes is presented in Appendices I and II.
The microarray data was validated by way of sq-RT-PCR experiments with a selection
of genes using cDNA derived from RNA extracted from protonemal and mid
sporophyte stage tissue (Figure 4.4). These genes consisted of four putative spore
wall genes (Pp_11916, Pp_146196, Pp_163268 and Pp_149962), which the
microarray data suggested were significantly upregulated at the mid sporophyte stage,
and two genes (Pp_100530 (unannotated) and Pp_184189 (a leghemoglobin)), which
exhibited the highest levels of downregulation in the mid sporophyte compared to the
gametophyte in the whole of the microarray dataset. Additionally, one pollen wall
homologue (Pp_120173), which was seemingly reasonably evenly expressed in both
gametophyte and sporophyte tissue, and two control genes (rubisco and actin2) were
included. The sq-RT-PCR experiments showed that all but one of these genes
exhibited expression patterns which were strongly consistent with those suggested by
the microarray analysis. This one exception was Pp_120173 which sq-RT_PCR
showed was less evenly expressed than the microarray data predicted.

Chapter 4. Identification of candidate spore wall genes
84
Table 4.2. Expression profiles of P. patens genes implicated in spore wall
development derived from microarray analysis (gametophyte vs early sporophyte
(GvsES) and gametophyte vs mid sporophyte (GvsMS)). Only genes with log fold
change values in excess of the cut off boundary (1.25 (GvsES); 1.4 (GvsMS) log fold
change) are included. Genes ranked by average expression log fold change (GvsMS).
Average p-value for each gene in brackets.
Gene Name in A.
Thaliana
Homologous Gene
Transcript ID
Average Expression Log Fold Change
GvsES GvsMS
RPG1 Pp_146196
2.40 (5.82E-05) 3.31 (2.67E-05)
QRT1 Pp_121276 2.57 (0.0051) 2.95 (0.0016)
QRT1 Pp_14944 2.18 (0.0045) 2.50 (0.0016)
QRT1 Pp_135225 2.21 (0.0084) 2.45 (0.0017)
QRT1 Pp_31639 1.66 (0.0102) 1.90 (0.0030)
RPG1 Pp_163268 0.83 (0.0387) 1.76 (0.0017)
CYP703A2 Pp_201018 1.58 (0.0023) 1.74 (0.0004)
QRT2 Pp_116593 1.42 (0.0476) 1.67 (0.0178)
CYP704B1 Pp_183927 1.60 (0.0624) 1.67 (0.0409)
CYP703A2 Pp_186336 1.44 (0.0173) 1.58 (0.0043)
ACOS5 Pp_104959 1.40 (0.0211) 1.52 (0.0062)
ACOS5 Pp_81614 1.47 (0.0990) 1.50 (0.0830)
MS2 Pp_11916 1.70 (0.0321) 1.41 (0.0662)
RPG1 Pp_149962 0.92 (0.0031) 1.34 (0.0012)

Chapter 4. Identification of candidate spore wall genes
85
Figure 4.4. Sq-RT-PCR validation of microarray data. RNA was extracted from
P. patens gametophyte (G) and sporophyte (S) tissue, reverse transcribed, then PCR
was performed on spore wall candidate genes (Pp_11916, Pp_146196, 149962 and
Pp_163268), and two genes (Pp_100530 and Pp_184189) which exhibited the highest
levels of downregulation in the sporophyte. Additionally, one evenly expressed
pollen wall homologue (Pp_120173) and two control genes (rubisco and actin2) were
included. Amplified DNA was removed at different cycle numbers (20, 24, 28, 32 -
as indicated) and run on an agarose gel.
G S G S G S G S G S G S G S G S
Pp_100530 Pp_184189
cycle 20 24 28 32 20 24 28 32
2 Kb
2 Kb
Pp_120173 PpActin2
G S G S G S G S G S G S G S G S
cycle 20 24 28 32 20 24 28 32
G S G S G S G S G S G S G S G S
Pp_163268 Rubisco
cycle 20 24 28 32 20 24 28 32
G S G S G S G S G S G S G S G S G S G S G S G S
cycle 20 24 28 32 20 24 28 32 20 24 28 32
2 Kb
2 Kb
Pp_11916 Pp_146196 Pp_149962

Chapter 4. Identification of candidate spore wall genes
86
4.2.3 Phylogenetic analyses
Maximum parsimony analysis was conducted using multiple alignments of protein
sequences from putative land plant homologues of two A. thaliana pollen wall
associated genes, MS2 and RPG1, which in P. patens were deemed to be the strongest
candidates for further investigation given the bioinformatic data presented in this
chapter. With the MS2 alignment, involving 24 protein sequences and a total of 709
positions, the most parsimonious tree recovered had a length of 3094 steps (Fig.
4.5A). This tree had a consistency index of 0.7116, a retention index of 0.7000,
and a composite index of 0.4981 for parsimony informative sites. Putative P.
patens homologues (Pp_11916 and Pp_120173) of MS2 were resolved as
monophyletic with very high bootstrap support (100%). The RPG1 alignment
involved 83 protein sequences and a total of 777 positions. The most parsimonious
tree recovered was 5794 steps in length (Fig. 4.6) and had a consistency index of
0.3997, a retention index of 0.5752, and a composite index of 0.2299 for parsimony
informative sites. The six putative P. patens homologues of RPG1 were not resolved
as monophyletic. Pp_146196, Pp_163268, Pp_149962 and Pp_136254 form a clade
with strong bootstrap support (97%) and have a sister group relationship with four
putative S. moellendorffii RPG1 homologues. However, Pp_146546 is nested in a
clade with four other putative S. moellendorffii RPG1 homologues, and Pp_122188 is
grouped with one putative Populus trichocarpa RPG1 homologue albeit with very
weak statistical support.
The tree with the highest log likelihood (-16441.4776) generated by maximum
likelihood analysis of the MS2 alignment is shown in Figure 4.5B. The tree exhibits a
very similar topology to the tree generated by maximum parsimony analysis of the
same dataset and once again the two putative P. patens homologues were resolved as
monophyletic with very strong statistical support (bootstrap = 100%).
4.2.4 Electron microscope analysis of Arabidopsis thaliana ms2 and rpg1 pollen
wall phenotypes
TEM analysis, in agreement with previous studies (Aarts et al. 1997; Dobritsa et al.
2009), shows that A. thaliana ms2 mutants lack a normal exine layer which is
replaced by arbitrarily deposited electron dense material (Fig. 4.7). A thin dark layer

Chapter 4. Identification of candidate spore wall genes
87
Figure 4.5. Phylogenetic analysis of MS2 and homologous proteins. A, Maximum
parsimony tree. Most parsimonious tree (length = 3094 steps) is shown. The
consistency index is 0.7116, the retention index is 0.7000 and the composite index is
0.5102 for all sites and 0.4981 for parsimony informative sites. Bootstrap support
values, based on 1000 replications, are shown above branches. B, Maximum
likelihood tree based on the Whelan and Goldman model. The tree with the highest
log likelihood (-16441.4776) is shown. The tree is drawn to scale, with branch
lengths measured in the number of amino acid substitutions per site, with a scale
provided at the bottom of the tree. Bootstrap support values, based on 1000
replications, are once again shown above branches. The arrow indicates MS2
(AT3G11980).
B
A

Chapter 4. Identification of candidate spore wall genes
88
Figure 4.6. Maximum parsimony phylogenetic analysis of RPG1 and homologous
proteins. Most parsimonious tree (length = 5794 steps) is shown. The consistency
index is 0.3997, the retention index is 0.5752 and the composite index is 0.2431 for all
sites and 0.2299 for parsimony informative sites. Bootstrap support values, based on
1000 replications, are shown above branches. The arrow indicates RPG1
(AT5G40260).
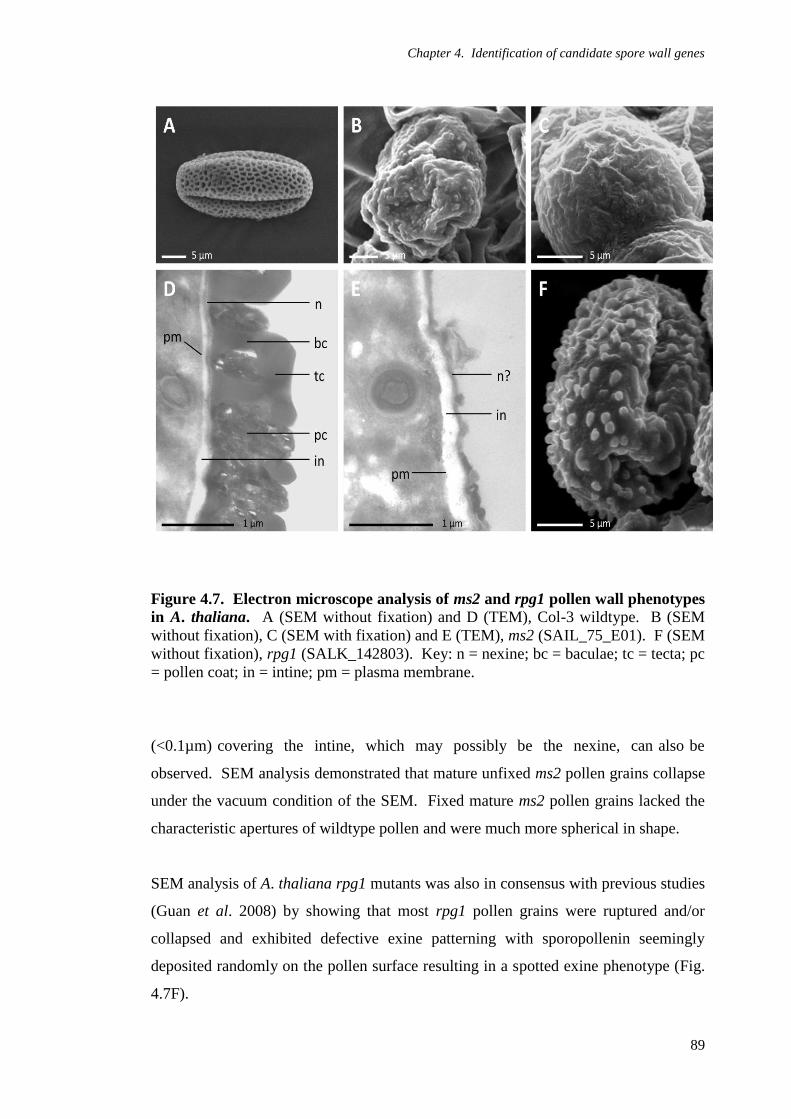
Chapter 4. Identification of candidate spore wall genes
89
Figure 4.7. Electron microscope analysis of ms2 and rpg1 pollen wall phenotypes
in A. thaliana. A (SEM without fixation) and D (TEM), Col-3 wildtype. B (SEM
without fixation), C (SEM with fixation) and E (TEM), ms2 (SAIL_75_E01). F (SEM
without fixation), rpg1 (SALK_142803). Key: n = nexine; bc = baculae; tc = tecta; pc
= pollen coat; in = intine; pm = plasma membrane.
(<0.1µm) covering the intine, which may possibly be the nexine, can also be
observed. SEM analysis demonstrated that mature unfixed ms2 pollen grains collapse
under the vacuum condition of the SEM. Fixed mature ms2 pollen grains lacked the
characteristic apertures of wildtype pollen and were much more spherical in shape.
SEM analysis of A. thaliana rpg1 mutants was also in consensus with previous studies
(Guan et al. 2008) by showing that most rpg1 pollen grains were ruptured and/or
collapsed and exhibited defective exine patterning with sporopollenin seemingly
deposited randomly on the pollen surface resulting in a spotted exine phenotype (Fig.
4.7F).

Chapter 4. Identification of candidate spore wall genes
90
At ------------------------------------------------------------
Sm ------------------------------------------------------------
Pp MEAVYKTPLPVVNCSSAVSRYLNLLHKTSLECSLGRGFVRQHLAHKPRTLLSKRLNRTKP
At ------------------------------------------------------------
Sm ------------------------------------------------------------
Pp GGQIWGLDFRSEATAGVEDSIPEKGNADIVRNTVEVVASGGHCSNLNGYPIVGDAANGEI
At --------MEALFLSSSSSSIVASNKLTRLHNHCVWSTVIRDKKRFGP------------
Sm ------------------------------------------------------------
Pp ANGDVANEVRHALTGDASCAVVTNSVNGGSHNGSVNGSTVKRTSRNGSANGHATYSGIPP
At ---------------------------------------TWCRVGG--------GGDGGR
Sm ------------------------------------------------------------
Pp LNGSSNGAVVNGASIYAGQGNTVNIHSVNGILANSRAANAMSKNGALHEYSKAPTADGSV
At NS------NAERPIRVSSLLKDRGQVLIREQSSPAMDAETLVL----SPNGNGRTIEING
Sm ------------------------------------------------------------
Pp TMVPELERLVQAPLNVPSKQAENDGMMER---MPHFED-PLVFATGLAPLQTKSTATVED
At -VKTLM---PFSGASMVGMKEGLGIISFLQGKKFLITGSTGFLAKVLIEKVLRMAPDVSK
Sm -----------------MDREGLGIKHFLKDKNILITGATGFLAKVLVEKILRTQPDVGH
Pp EISLIMGDAARQKSSDADTSGGLGILKFLKGKNLLVTGATGFLAKVMVEKILRVQPDVGQ
**** **: *::*:**:*******::**:** ***.:
At IYLLIKAKSKEAAIERLKNEVLDAELFNTLKETHGASYMSFMLTKLIPVTGNICDSNIGL
Sm LFLLINAKSSQSASERLRKEVQCSRLFQVLQDKHGDEYEDFIQAKLTAVAGNVAKEDVGI
Pp LYLLIQPQKNVTAEERLKNNVISSPLFSVLKDSFGDAYEEFMNNKLTAVSGTISADGLGI
::***: :.. :* ***:::* : **..*::..* * .*: ** *:*.:. . :*:
At QADSAEEIAKEVDVIINSAANTTFNERYDVALDINTRGPGNLMGFAKKCKKLKLFLQVST
Sm DKDVAQALASEIDVIVNSAATTNFIERYDTALDINTKGPFHLLEFAKRCHRLKLFLHVST
Pp ANDKAEEISKTVHIIVNSAATTTFDERYDIALNVNTQGPRRIIEFARGCPNLQLFLHVST
* *: ::. :.:*:****.*.* **** **::**:** .:: **: * .*:***:***
At AYVNGQRQGRIMEKPFSMGDCIATENFLEGNRKALDVDREMKL----ALE-A-------A
Sm AYVNGKRVGRALEKPFRMDESIARESLGNESAPPLSVAQEIESVCKLSLLAP-------A
Pp AFVNGQRRGDTPEKPFRMGDSIAKEM-SEDCIPDLHVASELALCAKTLQEVVAEVSRTSV
*:***:* * **** * :.** * : * * *: .
At RKGTQNQDEAQKMKDLGLERARSYGWQDTYVFTKAMGEMMINSTRGDVPVVIIRPSVIES
Sm HDKDEVAQQTAFMKELGLKRAALHGWQDTYVFTKAMGEMLVCENRQDVPVVIVRPTVVEG
Pp SASEQQLIVDKKMKELGMTRAKLFGWQDTYVFSKAMGEMLVESLRGEIPVVVLRPSVVES
: **:**: ** .********:******:: . * ::***::**:*:*.
At TYKDPFPGWMEGNRMMDPIVLCYGKGQLTGFLVDPKGVLDVVPADMVVNATLAAIAKHGM
Sm TFNQPFSGWMEGIRMMDPILLTYGKGQTSSFYVDPNGVLDVVPADMVVNTILASMAKHAG
Pp TLAQPFPGWMEGIRMMDPIVLAYAKGQMTGFLADPRGVLDVIPADLVVNALLAAMTKHAQ
* :** ***** ******:* *.*** :.* .**.*****:***:***: **:::**.
At AMSDPEPEINVYQIASSAINPLVFEDLAELLYNHYKTSPCMDSKGDPIMVRLMKLFNSVD
Sm ----KKGCLNVYQVGSSVVNPLTFDKLAKYTYEHFRSQPFVDQKGNPVMIPKMTFITNKY
Pp -----NPGLQVYQVASSVVNPMTFELLADVALELFTKDPMIDRAGQPVKLQRMRFVQSMT
: ::***:.**.:**:.*: **. : : ..* :* *:*: : * :. .
At DFSDHLWRDAQE---RSGLMSGMSSVDSKMMQKLKFICKKSVEQAKHLATIYEPYTFYGG
Sm T--LFLYNYLQFNLPISRLFPWFQRE--DTQRRLKYLSY-ASQRVNQLIDTYAAYTFYKG
Pp AFNLYLWFVYQLPLKAR-SFPHII------------------------------------
.*: * : :
At RFDNSNTQRLMENMSEDEKREFGFDVGSINWTDYITNVHIPGLRRHVLKGRA----
Sm RFDISNLERLYKELSAEERDEFGFAVWSIDWDKYIKDVHLPGLRKYTLDGNTAFRL
Pp --------------------------------------------------------
NAD(P)H binding motif
Active site motif
Figure 4.8. Alignment of A. thaliana (At) MS2 protein sequence (AT3G11980) with
putative homologues identified in the ‘lower’ land plant species, P. patens (Pp) and S.
moellendorffii (Sm). Proposed NAD(P)H binding and active site motifs are indicated
with square boxes. Key: “*” = residues identical in all sequences; “:” = conserved
substitutions; “.” = semi-conserved substitutions.

Chapter 4. Identification of candidate spore wall genes
91
The A. thaliana ms2 (SAIL_75_E01 and SAIL_92_C07) and rpg1 (SALK_142803)
mutants were generated by way of T-DNA insertions (Fig 4.9). The positions of the
ms2 T-DNA insertions were confirmed by PCR genotyping (primers: SAIL_75_E01 -
FP, 5'-GTTTTATGTTACGGGAAGGGG-3'; RP, 5'-
GCATTACTATGAGAAGAGACTTTGCC-3'; LB2, 5'-
GCTTCCTATTATATCTTCCCAAATTACCAATACA-3': SAIL_92_C07 - FP, 5'-
GGACAATCACTAAATGACATTTAATTG-3'; RP, 5'-
GTTTTATGTTACGGGAAGGGG-3'; LB2 (as above)). The genotyping also
identified plants which were homozygous for each of these insertions.
Figure 4.9. Schematic of A. thaliana MS2 (AT3G11980) and location of
SAIL_75_E01 and SAIL_92_C07 T-DNA insertion sites. With SAIL_75_E01 the
T-DNA insertion is in exon 8 and with SAIL_92_C07 the T-DNA insertion site is
located in exon 5.

Chapter 4. Identification of candidate spore wall genes
92
4.2.5 Sequence alignment and transcript analysis of MS2 homologues
A final ClustalW2 alignment of A. thaliana, S. moellendorffii and P. patens MS2
homologues was 836 residues long (Fig. 4.8). 13 gaps, ranging from 1-51 residues in
length were required to align the homologues.
Analysis of the transcripts of A. thaliana MS2 and selected predicted MS2 homologues
(Fig. 4.10) revealed that the CDS of A. thaliana MS2 and the P. patens MS2-like gene,
Pp_11916, both consist of eight exons and seven introns. The CDS of the Oryza
sativa MS2-like gene, LOC_Os03g07140, has nine exons and eight introns, and the
CDS of the S. moellendorffii MS2-like gene, Selmo1_80322, is predicted to have ten
exons and nine introns. In each of these homologues the length of exons two, three,
four and six are conserved. Pp_11916 is predicted to have considerably longer introns
than the other MS2 homologues.
Figure 4.10. Exon-intron structure of A. thaliana (At) MS2 and selected
predicted land plant homologues (Os = O. sativa; Sm = S. moellendorffii; Pp = P.
patens). Values above each exon represent exon length in base pairs.

Chapter 4. Identification of candidate spore wall genes
93
4.3 Discussion
4.3.1 Flowering plant homologue genes for spore wall development are present in
Physcomitrella patens and Selaginella moellendorffii
With genome search results suggesting that the vast majority of genes implicated in A.
thaliana pollen development are also easily identifiable in the genomes of basal
embryophytes, an initial group of spore wall target genes has been identified for
potential further investigation by way of functional analyses. These results also
indicate that the vast majority of these spore wall candidate genes belong to multigene
families, and therefore, as with almost every developmental, signalling and metabolic
context (Kafri et al. 2009), there is a high potential for genetic redundancy. Analyses
of large collections of EST sequences have suggested that P. patens is a
palaeopolyploid with a whole genome duplication having occured between 30 and 60
million years ago (Rensing et al., 2007), which may account for the presence of some
of these gene duplications. Whilst the S. moellendorffii sequence data do not indicate
any ancient whole genome duplication (Banks et al. 2011), the results here show that
for most of the spore wall candidate genes numerous copies (greater in number than in
the P. patens genome) are also present in the S. moellendorffii genome. This suggests
the occurrence of many small-scale duplication events and a greater level of gene
redundancy and/or number of pseudogenes in S. moellendorffii compared to P. patens.
4.3.2 Identification of lead genes for further investigation
Whilst the finding that homologues of angiosperm pollen wall associated genes are
present in P. patens and S. moellendorffii opens the door to functional analyses of
these genes, the potentially high levels of redundancy observed in these extant basal
embryophytes present challenges to a functional approach. The P. patens sporophyte
transcriptomic data presented in this chapter, by way of microarray analysis, helps
circumvent some of these difficulties by allowing certain members of multigene
families to be identified as the most likely to be involved in spore wall biogenesis.
These genes can then be considered for gene knock-out and gene swap experiments.
The transcriptome profiles of spore wall candidate genes presented here imply that 16
homologues of seven of the A. thaliana pollen wall associated genes are significantly
upregulated in the P. patens sporophyte. These candidate genes are homologous to A.

Chapter 4. Identification of candidate spore wall genes
94
thaliana genes which can be divided into two discrete groups based upon their
proposed general function (described in chapter 1 and summarised in Table 4.1). Five
of these candidate genes are homologous to two A. thaliana genes which have been
implicated in tetrad separation, specifically pectin degradation. The remaining eleven
candidate genes are homologous to five pollen wall genes directly associated with
sporopollenin biosynthesis and subsequent formation of the exine layer. None of the
P. patens genes homologous to pollen wall genes associated with probaculae
formation, intine construction and callose wall development were significantly
upregulated at either sporophyte stage according to the microarray analysis and could
therefore be promptly eliminated from the selection process for further investigation.
Of course, the lack of significant upregulation exhibited by these genes does not
necessarily mean that they do not play a role in spore wall development but the
microarray experiment, backed up by sq-RT-PCR, represents an effective method of
targeting spore wall candidate genes and therefore allows the selection of genes, for
which functional analyses could potentially be conducted on, to be refined.
In addition to the transcriptomic data a number of other practical criteria were applied
when selecting a gene or genes for functional analyses. Firstly, only candidate genes
putatively identified as belonging to relatively small gene families in P. patens were
considered in order to simplify knock-out experiments and maximise the likelihood of
obtaining informative data from these experiments. Genetic redundancy is likely to be
an issue with candidates which belong to sizeable gene families in P. patens,
potentially masking the function of individual gene members and, therefore,
increasing the likelihood that a number of family members may need to be knocked-
out in order for an altered spore phenotype to be observed and/or easily measured.
Secondly, P. patens spore wall candidate genes which are homologues to genes which
have been identified as being involved in numerous functions and/or developmental
processes in higher plants would not be considered due to the strong potential for
many secondary phenotypes arising in knock-out mutants which could interfere with
the primary study, and perhaps even be lethal to the study plant. Thirdly, preference
would be given to candidate genes which, when knocked-out in P. patens, are likely to
present distinct phenotypes, based upon observations and analysis of the
corresponding mutants in A. thaliana.

Chapter 4. Identification of candidate spore wall genes
95
4.3.2.1 Putative Physcomitrella patens tetrad separation genes
The A. thaliana QUARTET genes, QRT1, QRT2 and QRT3, have significant numbers
of homologues in P. patens and, as described in chapter 1, are associated with the
timely degradation of pectic components of the pollen mother cell primary wall. The
model proposed by Jiang et al. (2013) suggests that QRT3 encodes an
endopolygalacturonase (Rhee et al. 2003) which degrades polygalacturonan, an
important carbohydrate component of the pectin network, by hydrolising the
glycosidic bonds that covalently link galacturonic acid residues (Jones et al. 1972). In
plants, this enzyme is employed in processes such as fruit softening, growth, organ
abscission, root development and, of course, pollen development (Federici et al.
2001). Two putative QRT3 homologues (Pp_227125 and Pp_198113 – both 50%
amino acid homology) were identified in P. patens but neither of these genes are
significantly upregulated in the sporophyte and therefore they were not selected for
further investigation. However, four homologues of QRT1 (33-42% homology), and
one homologue of QRT2 (39% homology) have significantly upregulated expression
(p<0.05) at the sporophyte stage. The product of the QRT2 gene has yet to be
elucidated, although Jiang et al. (2013) have speculated that is also likely to be an
endopolygalacturonase, but QRT1 is proposed to encode a pectin methylesterase in A.
thaliana (Francis et al. 2006). The changes in pectin structure brought about by pectin
methylesterases are associated with alterations in the plasticity, pH, ionic contents and
cellular adhesion of the cell wall and play a role in vegetative and reproductive
processes (Pelloux et al. 2007). Therefore, the various complexities related to these
genes, such as their roles in numerous developmental and physiological processes and
associated potential secondary phenotypes, and the presence of large numbers of
homologues of QRT1 in P. patens, mean that they are not obviously suitable for the
functional analyses proposed in this study. However, the high levels of expression of
QRT1 and QRT2 homologues in the P. patens sporophyte does suggest that the
degradation of the pectic components of the spore mother cell primary wall at the
tetrad stage of sporogenesis may be necessary for microspore separation in early land
plants, and aspects of the mechanism which underpin this process may therefore be
conserved in embryophytes.

Chapter 4. Identification of candidate spore wall genes
96
4.3.2.2 Putative Physcomitrella patens sporopollenin biosynthesis/exine genes
The majority of the genes identified and implicated in pollen wall development in A.
thaliana to date, are directly associated with the biosynthesis of sporopollenin and/or
exine formation, and all of these genes have homologues in the P. patens genome.
Expression of homologues of five of these sporopollenin genes, ACOS5, CYP703A2,
CYP704B1, MS2 and RPG1 are significantly upregulated in the P. patens sporophyte.
The monomeric building blocks of sporopollenin are thought to be phenolics and
derivatives of fatty acids. Functional analyses using A. thaliana have suggested that
ACOS5, CYP703A2, CYP704B1 and MS2 and their associated enzymes may operate
within a common fatty acid branch of the sporopollenin biosynthesis framework in
tapetal cells (de Avezedo Souza et al. 2009; Dobritsa et al. 2009; Ariizumi and
Toriyame 2011; Jiang et al. 2013). The precise composition of this pathway has yet to
be confirmed, and further biochemical analyses are required, but a working model has
been proposed (Fig. 4.11) based on the consensus of recent studies (de Avezedo Souza
et al. 2009; Grienenberger et al. 2010; Ariizumi and Toriyame 2011), and has been
summarised and incorporated into the larger Jiang et al. (2013) model of pollen wall
formation. In this model ACOS5 functions as a plastid localised acyl-CoA synthetase
which is needed to produce a fatty acyl-CoA ester, from plastid generated lauric acids,
which is then transferred to the endoplasmic reticulum (de Avezedo Souza et al.
2009). Hydrolysis by the specific thioesterase then occurs and once more lauric acids
are generated in the endoplasmic reticulum (Ariizumi and Toriyame 2011). These
lauric acids are then monohydroxylated by CYP703A2 to create a 7-hydroxylauric
acid which acts as a substrate for ACOS5 resulting in the generation of 7-
hydroxylaurel-CoA (Morant et al. 2007). Recent studies have shown that CYP704B1
metabolises longer fatty acids, again synthesised in plastids, which suggests that two
types of hydroxylated fatty acids, both CoA-esterified by ACOS5, serve as monomeric
sporopollenin building blocks (Dobritsa et al. 2009), and that CYP704B1 may operate
along a separate branch of the sporopollenin fatty acid pathway. The liberated
hydroxylated fatty acids are then reduced by MS2 to fatty alcohol monomeric
components which can then link with phenylpropanoids to form sporopollenin
precursors (Morant et al. 2007; Ariizumi and Toriyame 2011). The phenotypes in A.
thaliana CYP703A2, CYP704B1 and MS2 mutants are extremely similar and this,
along with biochemical analysis, provided the main basis for the hypothesis that they
are members of the same fatty acid branch, with the knock-out of any of them

Chapter 4. Identification of candidate spore wall genes
97
resulting in the breakdown of this branch (or these branches) of sporopollenin
biosynthesis. However, the phenotype of ACOS5 mutants is distinct in that, whilst the
exine layer would appear to be similarly defective, the pollen grains subsequently
collapse and the mutants are completely male sterile, unlike the low levels of fertility
exhibited by the other mutants (de Azevedo Souza et al. 2009). This may indicate that
ACOS5 plays a more central role in the sporopollenin biosynthetic pathway compared
to CYP703A2, CYP704B1 and MS2, and recent hypotheses have suggested that it may
also operate within the phenylpropanoid branch as it shares its more severe phenotype
with LAP5/PKSB and LAP6/PKSA mutants which have recently been implicated in the
synthesis of phenylpropanoid constituents of sporopollenin (Dobritsa et al. 2010).
The finding that homologues of ACOS5, CYP703A2, CYP704B1 and MS2 are
significantly upregulated in the P. patens sporophyte suggests that they may be
involved in synthesising the sporopollenin element of the P. patens spore wall and
therefore participate in an ancient and conserved component of the sporopollenin
biosynthesis pathway in embryophytes. The remainder of this section includes an
assessment of the suitability of these homologues for functional analyses.
ACOS5 has 11 putative homologues in P. patens and two of these genes (36-50%
homology) are significantly upregulated in the sporophyte. However, the potential
for functional redundancy meant that genes with fewer homologues would be
preferred for further investigation. Similar issues can be ascribed to the two
cytochrome P450 genes, CYP703A2 and CYP704B1, which again have relatively
numerous homologues (31 and eight respectively) and belong to subfamilies of the
large and diverse cytochrome P450 superfamily which in plants are involved in a wide
range of biosynthetic pathways in primary and secondary metabolism (Morant et al.
2003; Duan and Schuler 2005). CYP703A2 has two significantly upregulated
homologues (both 33% homology) and CYP704B1 has one (57% homology). Given
the potential complications associated with these characteristics, and the likely
difficulties in creating loss-of-function phenotypes, neither of these genes were
considered for further functional analysis.

Chapter 4. Identification of candidate spore wall genes
98
Figure 4.11. Model of sporopollenin monomer biosynthesis in A. thaliana tapetal
cells. Genes which have homologues in P. patens that exhibit significantly
upregulated expression in the sporophyte generation are in bold red text. Key: ER =
endoplasmic reticulum. Modified from de Azevedo et al. 2007, Huang et al. 2011,
Ariizumi and Toriyame 2011 and Jiang et al. 2013.

Chapter 4. Identification of candidate spore wall genes
99
Only two homologues of MS2, which has been predicted to encode a plastid-localised
fatty acyl carrier protein reductase (Chen et al. 2011), were identified in P. patens
(both 48% homology). Electron microscope analysis has shown that A. thaliana MS2
mutants possess a highly defective, and mostly absent, exine layer. As previously
discussed in the introductory chapter, in A. thaliana, MS2 converts fatty acids to the
corresponding fatty alcohols and the apparent inability of MS2 mutants to carry out
this conversion indicates that this reaction is an essential stage in the biosynthesis of
sporopollenin (Aarts et al. 1997; Ariizumi et al. 2008; Dobritsa et al. 2009).
Biochemical analysis has demonstrated that recombinant MS2 enzyme can convert
palmitoyl-Acyl Carrier Protein to the corresponding C16:0 alcohol with NAD(P)H as
the favoured electron donor, and the NAD(P)H-binding domain was shown, by way of
genetic complementation experiments, to be essential for the function of MS2 in
pollen exine formation (Chen et al. 2011). The conserved NAD(P)H-binding and
active site motifs (Doan et al. 2009) are also present in P. patens and S. moellendorfii
MS2 homologues (Fig. 4.8). Additionally, as a whole, the exon structure of MS2 and
its homologues, particularly in terms of number and length, appears to be quite
conserved (Fig. 4.10) with no obvious suggestion of a pattern of intron gains and
increasing length in more recently evolved embryophytes as has been often noted in
various plant lineages (Babenko et al. 2004).
Fatty alcohols are important cellular components and have also been identified as key
components of the lipidic anther cuticle (Jung et al. 2006; Li and Zhang 2010), and it
is possible that pollen exine and cutin share a common lipidic biosynthetic pathway
(Li and Zhang 2010; Zhang et al. 2010; Chen et al. 2011). Despite this, fatty alcohols
are not associated with as many developmental and physiological processes as some
of the other gene candidates described in this section. When this is considered
alongside the fact that MS2 is linked with a distinct wall phenotype in A. thaliana, and
has just two homologues in P. patens, lower than any of the other gene candidates
with transcriptomic analysis providing strong evidence as to which member of this
gene family is functional (Pp_11916), it would seem that the putative P. patens MS2-
like gene(s) represents a practical and intriguing option for further investigation.
Six putative homologues of RPG1, an unknown plasma membrane protein, were
identified in P. patens (35-37% homology). RPG1 has been shown to be a member of

Chapter 4. Identification of candidate spore wall genes
100
the MtN3/saliva gene family which, in plants, is generally related to reproductive
development. The putative intracellular region of the MtN3/saliva domain is
conserved in RPG1 and exhibits phosphorylation motifs which suggests RPG1 may be
involved in protein regulatory networks (Guan et al. 2008). TEM (Guan et al. 2008)
and SEM analysis has demonstrated that primexine deposition was irregular in A.
thaliana RPG1 mutants. Phylogenetic analysis of RPG1 and homologous proteins,
identified in selected embryophyte model species, implies that the P. patens RPG1
homologues form a complex family, but does not provide any strong indications as to
which of these homologues are likely to be functional in the sporophyte. However,
microarray analysis suggests that Pp_146196, Pp_149962 and Pp_163268 are the only
homologues that are significantly upregulated (p<0.05) at the sporophyte stage. These
three putative P. patens RPG1-like genes should therefore be considered the prime
candidates for any proposed knock-out experiments investigating the conservation and
function of RPG1 which overall represents a realistic choice for further investigation
given the relatively low number of homologues present in P. patens, and its easily
defined phenotype in A. thaliana.
Of all the pollen wall associated genes with significantly upregulated homologues in
the P. patens sporophyte, RPG1 and MS2 come closest to satisfying the criteria set out
earlier in this discussion section. The potential role of the P. patens RPG1-like genes
in the development of the spore wall poses intriguing questions given the absence of a
primexine in ‘lower’ land plants. Was this gene recruited from another wall
component and therefore a key element in driving the increase in complexity observed
in pollen walls? Or is it simply the case that RPG1 and other genes associated with
more specialist wall elements, such as the primexine, are less well conserved than
other pollen wall genes? However, given the time constraints associated with this
study, the MS2-like genes are more likely to deliver easily measurable and informative
data in a shorter period of time and were therefore selected for initial gene knock-out
and gene swap experiments described in chapter 5. The MS2-like genes also have
higher amino acid homology to MS2 than RPG1-like genes have to RPG1.
Additionally, the direct connection between MS2 and sporopollenin biosynthesis, the
key component of spore and pollen walls in terms of affording plants the ability to
survive in terrestrial environments, makes it an attractive option for testing

Chapter 4. Identification of candidate spore wall genes
101
conservation of gene function in the spore/pollen wall and its relevance to the
colonisation of the land by plants.
4.4 Summary
In this chapter, genome searches have revealed that the vast majority of genes strongly
associated with pollen wall development in A. thaliana have homologues in P. patens
and S. moellendorffii. This finding raises the prospect that the molecular mechanisms
responsible for pollen wall formation are ancient and conserved, and justifies further
investigation by way of functional analyses of these genes. Transcriptomic data
derived from microarray analysis showed that homologues of seven pollen wall
associated genes exhibit significant upregulated expression in early and mid
developmental stages of the P. patens sporophyte. From this refined pool of spore
wall candidate genes certain practical criteria were applied to select genes which were
likely to be highly suitable for gene knock-out and gene swap experiments in P.
patens. MS2-like and RPG1-like genes in P. patens were the only two genes which
sufficiently satisfied the selection criteria. The MS2-like genes were chosen for
further investigation by way of functional analysis (described in chapter 5) primarily
due to the presence of just two homologues in P. patens, strong transcriptomic
evidence as to which homologue is functional, and the direct association of MS2 with
sporopollenin biosynthesis in A. thaliana.

Chapter 5. Functional analysis of PPMS2-1
102
CHAPTER 5. Functional analysis of the MS2-like gene in
spore wall morphogenesis in Physcomitrella patens
5.1 Introduction
Whilst expression analysis of putative spore wall genes in P. patens has proven to be
illuminating, it essentially only provides a platform for generating new hypotheses and
directing future experimental approaches. In order for a selected hypothesis regarding
a candidate gene’s involvement in spore wall development to be verified, a much
more targeted approach is required whereby the candidate gene is disrupted, knocked-
out or knocked-down, or is exchanged with a proposed homologous gene in another
species, followed by analysis of the resultant phenotypes. This chapter describes the
results obtained from a gene knock-out experiment, where the MS2-like gene
identified in the previous chapter was deleted from P. patens, and a gene swap
experiment where the same gene was transformed into A. thaliana ms2 mutants to
determine whether the moss gene could restore the wildtype pollen wall phenotype.
A model of the P. patens MS2-like gene, which from here onwards will be referred to
as PPMS2-1, has been proposed and presented on the Cosmoss database. However,
this model has been produced by way of gene prediction algorithms and as of yet there
is no complete EST evidence to support it. The model suggests PPMS2-1 consists of
eight exons and seven introns with a long 5’ untranslated region consisting of 1351
base pairs and a 3’ UTR of 472 base pairs in length. The CDS is predicted to be 2202
base pairs in length (encoding a 733 residue protein). This CDS region was deleted
from P. patens in the knock-out experiments, and also amplified and transformed into
A. thaliana MS2 mutants, under the control of the native MS2 promoter, to effectively
generate a gene swap experiment.
As previously discussed, P. patens displays a very high level of gene targeting
efficiency and successful knock-outs of spore wall associated genes have been
achieved previously with the generation of stable PPGAMYB1 and PPGAMYB2 loss-
of-function transformants (Aya et al. 2011). Given the P. patens life cycle data
presented in chapter 3, the Villersexel K3 and Gransden GrD12 wildtypes were

Chapter 5. Functional analysis of PPMS2-1
103
selected as the background lines for generating PPMS2-1 knock-out mutants by way
of PEG-mediated protoplast transformation.
In order for gene swap, or complementation, experiments to be conducted, it was
necessary to generate or obtain A. thaliana ms2 mutant plants. Conveniently, three A.
thaliana ms2 mutant lines are available from the European Arabidopsis Stock Centre.
The MS2 pollen wall phenotype was first reported in a transposon excision mutant
produced by Aarts et al. (1993, 1997) which also exhibited male sterility due to the
collapse of the microspores towards the latter stages of their development. The
mutation did not completely eradicate the production of viable pollen but the plants
could only yield approximately 1 % of the wildtype seed set (Aarts et al. 1997). This
lack of fertility presents practical difficulties for gene swap experiments. However,
two MS2 T-DNA insertion lines (SAIL_75_E01 and SAIL_92_C07) have recently
been made available from the Syngenta Arabidopsis Insertion Library (SAIL)
(Sessions et al. 2002). These T-DNA insertion lines still seemingly have the same
defective pollen wall phenotype but observations of their life cycles have shown that
they produce large amounts of pollen and are much more fertile than the transposon
excision mutant (Dobritsa et al. 2009). The reasons for these phenotypic differences
are unclear but Dobritsa et al. (2009) postulated that it is possible that the differences
in the wildtype backgrounds (Landsberg erecta for the transposon excision mutant and
Col-3 for the two SAIL lines), and the potential for second site mutations with
transposon mobilisation, may be responsible. Given their more practical levels of
fertility, the two SAIL lines were therefore used for the gene swap experiments carried
out in the study presented here.
A gene swap experiment involving an MS2 homologue has been conducted previously
where a predicted homologue in the monocot rice, DEFECTIVE POLLEN WALL
(DPW), was shown to be able to complement an A. thaliana ms2 mutant (a dicot) by
restoring the wildtype pollen wall phenotype (Shi et al. 2011). This suggested that the
fatty alcohol synthesis step in pollen wall development is conserved in monocots and
dicots. The complementation of an A. thaliana ms2 mutant by a P. patens homologue
would provide greater insights regarding the evolutionary development of the
spore/pollen wall and land plant evolution due to the large evolutionary gulf between
the two species, and would provide compelling evidence for the conservation of MS2
Chapter 5. Functional analysis of PPMS2-1
104
function in spore/pollen walls. Therefore, the primary aim of the A. thaliana gain-of-
function and P. patens loss-of-function experiments is to further elucidate the function
of PPMS2-1 in the P. patens sporophyte and determine the conservation of a key
component of the spore/pollen wall biochemical and developmental pathway
throughout land plant history. The materials and methods required/applied to conduct
these experiments and subsequent analyses, including plant transformation, SEM,
TEM, acetolysis and Raman microspectroscopy, are described in chapter 2.
5.2 Results
5.2.1 Generation and molecular analysis of Physcomitrella patens PPMS2-1
knock-out lines and Arabidopsis thaliana PPMS2-1 gain-of-function lines
Physcomitrella patens mutant lines lacking the PPMS2-1 CDS were successfully
created, in both Villersexel K3 and Gransden GrD12 ecotypes, by way of PEG-
mediated protoplast transformation. Transformation efficiency was greater with
GrD12 with many more stable putative positive transformants observed after
antibiotic selection than with Villersexel K3. The deletion of PPMS2-1 was
confirmed in five transformants, obtained using Villersexel K3, by genotyping (Fig.
5.1). Genotyping was also carried out on three of the numerous putative positive
transformants obtained with GrD12 which confirmed the deletion of PPMS2-1 in two
of these transformants (Fig. 5.2). Southern blot analysis confirmed that three of the
five genotyped transformants obtained with Villersexel K3 were single-copy
replacement transformants (ppms2-1 KO1, KO2 and KO3) (Fig. 5.1), therefore these
lines were primarily used for phenotypic analysis. RT-PCR confirmed the absence of
a PPMS2-1 gene product in one of these lines (ppms2-1 KO3) and demonstrated that
the deletion of PPMS2-1 does not affect PPMS2-2 (Pp_120173) expression.
However, the PPMS2-1 gene product was observed in ppms2-1 KO1 and KO2 (Fig.
5.1) confirming the occurrence of ectopic reintegration whereby the replaced wildtype
DNA has reintegrated elsewhere in the genome (Puchta 2003). RT-PCR also
confirmed the absence of PPMS2-1 gene product in a genotyped transformant (ppms2-
1 Gr77) derived from GrD12 (Fig. 5.2). The cDNA used for RT-PCR verification was
derived from mid sporophyte tissue as expression of PPMS2-1 could not be detected
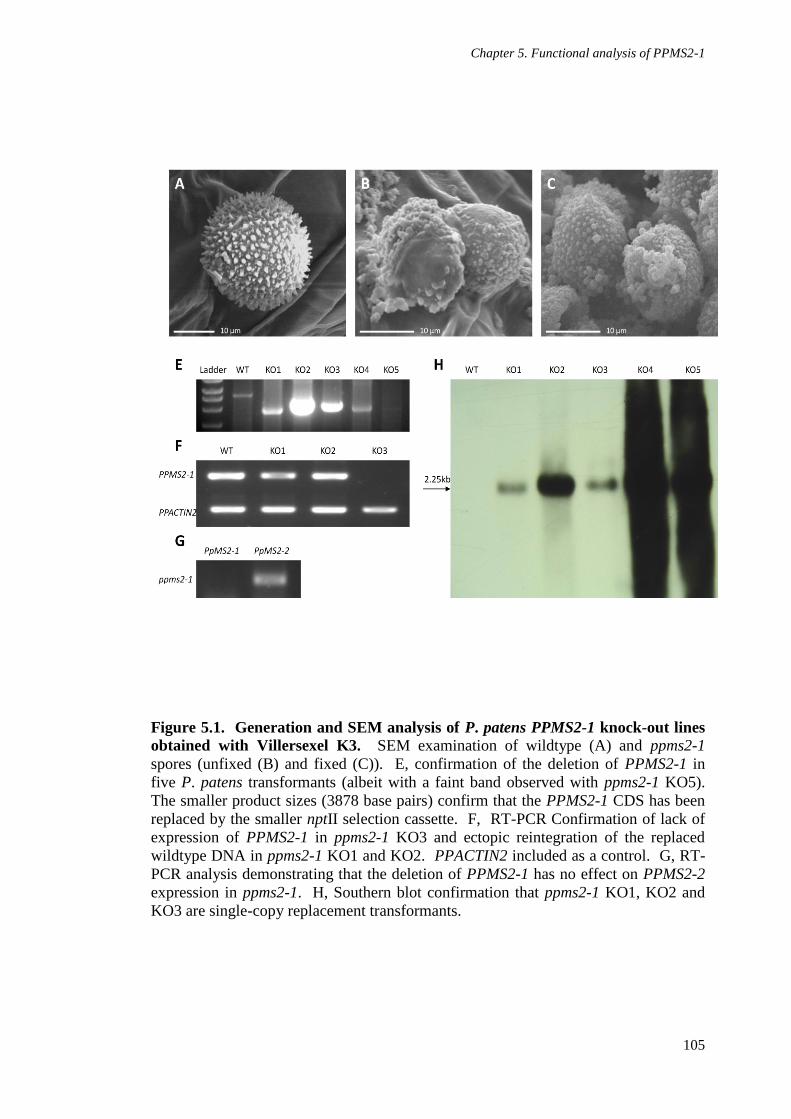
Chapter 5. Functional analysis of PPMS2-1
105
Figure 5.1. Generation and SEM analysis of P. patens PPMS2-1 knock-out lines
obtained with Villersexel K3. SEM examination of wildtype (A) and ppms2-1
spores (unfixed (B) and fixed (C)). E, confirmation of the deletion of PPMS2-1 in
five P. patens transformants (albeit with a faint band observed with ppms2-1 KO5).
The smaller product sizes (3878 base pairs) confirm that the PPMS2-1 CDS has been
replaced by the smaller nptII selection cassette. F, RT-PCR Confirmation of lack of
expression of PPMS2-1 in ppms2-1 KO3 and ectopic reintegration of the replaced
wildtype DNA in ppms2-1 KO1 and KO2. PPACTIN2 included as a control. G, RT-
PCR analysis demonstrating that the deletion of PPMS2-1 has no effect on PPMS2-2
expression in ppms2-1. H, Southern blot confirmation that ppms2-1 KO1, KO2 and
KO3 are single-copy replacement transformants.

Chapter 5. Functional analysis of PPMS2-1
106
in wildtype gametophyte tissue. Given the small size of the P. patens sporophyte, and
the lengthy time period required to harvest sufficient sporophyte tissue for cDNA
synthesis, RT-PCR verification could only be conducted on a limited number of
ppms2-1 lines.
Successful transformation of Arabidopsis thaliana ms2 mutants with PPMS2-1
(ATMS2pro::PPMS2-1) was initially determined by detection of seed-expressed GFP
(see chapter 2, section 2.6.3), a component of the same destination vector carrying
PPMS2-1. Once GFP fluorescent seeds (T1 lines) were identified they were sown and
cultivated, and PCR confirmation of the PPMS2-1 and PPMS2-1 splice variant
insertions in T1 and T2 lines was conducted using genomic DNA extracted from
leaves. The pollen phenotype of mature T1 and T2 lines was then analysed.
5.2.2 Phenotypic analysis of ppms2-1 spores
SEM analysis of ppms2-1 spores revealed a distinct phenotype (Fig. 5.1). Mature
ppms2-1 spores typically range from 14-21 µm and are therefore mostly around two
thirds of the size of wildtype spores (Table 5.1). The projections which form the
perine layer are much less dense, pointed and regular than those observed in the
wildtype and therefore the outer surface of ppms2-1 spores generally comprise a
mosaic of blunted, incomplete perine projections and smooth areas seemingly devoid
of perine material. The material for the perine is still seemingly synthesised normally
but would appear to be unable to adhere properly to the surface of the spore and
therefore large quantities of perine material are scattered throughout the spore capsule.
This phenotype was observed in knock-out lines generated using both Villersexel K3
and Gransden GrD12 ecotypes, and in all lines exhibiting ectopic reintegration, with a
particularly pronounced phenotype in ppms2-1 KO1. TEM analysis of ppms2-1 KO1
and KO3 confirmed the irregular nature of the perine and showed that in mature
spores an entire layer of the wall is absent (Fig. 5.3). Given the homogenous nature of
both the exine and intine layers, and their similar thicknesses in the wildtype, it is
difficult to determine which of these is missing in ppms2-1 although, at 0.5-0.7 µm
thick, the remaining layer is approximately twice the thickness of both the wildtype
intine and exine. In addition to an altered wall, mature ppms2-1 spores exhibited an
abnormal cytoplasmic organisation with the characteristic spherical vesicles, or oil
bodies, associated with the wildtype greatly reduced in number. Post-tetrad stage

Chapter 5. Functional analysis of PPMS2-1
107
Table 5.1. Average diameter of P. patens wildtype and ppms2-1 spores (n=12).
Line
Average Spore Diameter (µm) (± SD)*
Villersexel K3 wildtype
28.45 ± 1.64
ppms2-1 18.05 ± 2.69
*P<0.0001; unpaired two tailed Student's t-test (two-tailed).
Figure 5.2. Generation and SEM analysis of P. patens PPMS2-1 knock-out lines
obtained with Gransden GrD12. SEM examination of spores in ppms2-1 Gr74 (A)
and Gr77 (B) knock-out lines. C, Confirmation of the deletion of PPMS2-1 in two P.
patens transformants (Gr74 and Gr77). The smaller product sizes (3878 base pairs)
confirm that the PPMS2-1 CDS has been replaced by the smaller nptII selection
cassette. D, RT-PCR Confirmation of lack of expression of PPMS2-1 in ppms2-1
Gr77. PPACTIN2 included as a control.

Chapter 5. Functional analysis of PPMS2-1
108
Figure 5.3. TEM analysis of wildtype (A, C and E) and ppms2-1 (B, D and F)
spore ultrastructure. A, wildtype spore wall ultrastructure at the post-tetrad
developmental stage. B, ppms2-1 (KO3) spore wall ultrastructure at the post-tetrad
stage. C and E, mature wildtype spore ultrastructure. D and F, mature ppms2-1
(KO3) spore ultrastructure. Key: pm = plasma membrane; p = perine; ex1 = inner
exine; ex2 = outer exine; in = intine; ob = oil body.

Chapter 5. Functional analysis of PPMS2-1
109
Figure 5.4. Acetolysis of wildtype and ppms2-1 spores. Light microscope images of
wildtype (A) and ppms2-1 (B) spores after acetolysis. C, Quantitative analysis of
acetolysed wildtype and ppms2-1 spores. Chart shows the percentage of spores
remaining (not completely lysed) after acetolysis. P=0.4378 (unpaired two tailed
Student's t-test (two-tailed)).

Chapter 5. Functional analysis of PPMS2-1
110
Figure 5.5. Raman spectra of one representative replicate each of wildtype (A),
ppms2-1 KO1 (B) and KO3 (C) spores. Spectra were produced with LabSpec 5 software.
n = 16 (spores across 3 sporangia)
n = 22 (spores across 3 sporangia)
n = 15 (spores across 3 sporangia)

Chapter 5. Functional analysis of PPMS2-1
111
Figure 5.6. PCA analysis (baseline corrected and normalised) of Raman spectra
obtained from wildtype, ppms2-1 KO1 and KO3 spores. PCA and resultant plots
were conducted and produced using SIMCA (v. 8.0). The circle represents the 95%
confidence level.
ppms2-1 spores possess two wall layers although the outer layer does not resemble the
perine present in wildtype spore walls at the same developmental stage. Instead this
layer is thin and light and is replaced, by the time the spores mature, by the perine.
ppms2-1 spores also exhibit a disorganised cytoplasm at this stage.
Previous studies have shown that some exine mutants in both P. patens and A.
thaliana (Aarts et al. 1997; Ariizumi et al. 2003; Aya et al. 2011) are sensitive
to acetolysis, a procedure which involves incubating spores/pollen in a solution of
acetic anhydride and sulphuric acid which generally degrades all spore/pollen
-25
-20
-15
-10
-5
0
5
10
15
20
25
-50 -40 -30 -20 -10 0 10 20 30 40 50 60
t[2]
t[1]
Baseline corrected compiled.M6 (PCA-X), Removed outliers
t[Comp. 1]/t[Comp. 2]
Colored according to Obs ID (Type)
R2X[1] = 0.408845 R2X[2] = 0.0913759 Ellipse: Hotelling T2 (0.95)
KO1
KO3
WT
SIMCA-P+ 12 - 2013-02-23 20:54:33 (UTC+0)

Chapter 5. Functional analysis of PPMS2-1
112
material except for the exospores (Erdtman 1960). However, ppms2-1 spores were
not more sensitive to acetolysis treatment than wildtype spores and slightly more
mutant spores were observed after acetolysis than wildtype spores (Fig. 5.4), albeit
percentages of remaining spores (62.18 % wildtype and 78.55 % ppms2-1) were
within margin of error. Next, in order to discern differences in spore chemistry,
Raman microspectroscopy, a rapid technique for biochemical analysis of cells by way
of measurement of the vibrational energies of molecules by the inelastic scattering
Figure 5.7. Spore germination for P. patens Villersexel K3 wildtype and ppms2-1
KO1, KO2 and KO3 knock-out lines under controlled axenic conditions (n=3).
0
10
20
30
40
50
60
70
80
90
0 1 2 3 4 5
% G
erm
inat
ion
Day
PpVx WT 8-19
ppms2-1 KO line 1
ppms2-1 KO line 2
ppms2-1 KO line 3
Villersexel K3
ppms2-1 KO1
ppms2-1 KO2
ppms2-1 KO3

Chapter 5. Functional analysis of PPMS2-1
113
Figure 5.8. Electron microscope analysis of the ATMS2pro::PPMS2-1 pollen
phenotype. A (SEM) and D (TEM), mature wildtype pollen. B (SEM) and E (TEM),
ms2 (SAIL_75_E01) mature pollen. C (SEM) and F (TEM), ATMS2pro::PPMS2-1 T2
mature pollen. G, RT-PCR confirmation of expression of PPMS2-1 in
ATMS2pro::PPMS2-1 flowers. UBIQUITIN and the tapetum specific LAP5/PKSB
included as controls. Key: n = nexine; bc = baculae; tc = tecta; pc = pollen coat; in =
intine; pm = plasma membrane.

Chapter 5. Functional analysis of PPMS2-1
114
of photons (De Gelder et al. 2007; Huang et al. 2010), was applied to wildtype,
ppms2-1 KO1 and KO3 spores. However, PCA of the resultant Raman spectra could
not distinguish the three lines (Figs. 5.5 and 5.6). Replicates of the two ppms2-1 lines
did scatter widely on the PCA plot and form two groups within each line, but many of
the mutant replicates formed a grouping with the wildtype replicates.
Given their distinct phenotype the functionality of ppms2-1 spores was examined by
the application of a spore germination test (Fig. 5.7). Five days after plating very few
ppms2-1 KO2 and KO3 lines spores had germinated (KO2 – 7. 91 %; KO3 – 3.64 %)
compared to the wildtype (74.25 %). In ppms2-1 KO1 germination percentage was 0
% and therefore this line was completely infertile.
5.2.3 Phenotypic analysis of Arabidopsis thaliana ms2 mutants transformed with
PPMS2-1
Once RT-PCR had confirmed the expression of PPMS2-1 in the flowers of the plants
transformed with the ATMS2pro::PPMS2-1 construct (Fig. 5.8G), phenotypic analysis
was conducted. SEM and TEM analysis of mature T1 and T2 A. thaliana ms2 mutants
(SAIL_75_E01 and SAIL_92_C07 backgrounds), transformed with PPMS2-1
expressed under the control of the A. thaliana MS2 promoter, showed that the moss
gene could not restore the wildtype pollen wall phenotype and the same highly
defective exine layer observed in A. thaliana ms2 mutant pollen walls was therefore
still present (Fig. 5.8). Transformations with the PPMS2-1 splice variant described in
section 2.5.1 of chapter 2 also yielded the same unaltered ms2 defective exospore
phenotype.
5.3 Discussion
5.3.1 Role of PPMS2-1 in spore wall development in Physcomitrella patens
The results from the phenotypic analysis of ppms2-1 mutant spores presented here
demonstrate that, as in flowering plant pollen (Aarts et al. 1997; Shi et al. 2011), MS2
is essential for the normal development of the spore wall and the spore as a whole in
the bryophyte P. patens. Whilst the function of MS2 in P. patens can be directly

Chapter 5. Functional analysis of PPMS2-1
115
associated with the spore wall, definitively linking it to a specific component, or layer,
of the wall is difficult.
The electron microscope analysis indicates that despite the appearance of a defective
perine in ppms2-1 knock-out lines, the perine material is still synthesised by the
tapetum in the same way as the wildtype, and the aberrant nature of the perine in
mature spores is a consequence of a defect in another layer, which perhaps has a
template system associated with it, and does not allow the perine material to adhere to
the spores in the normal manner. Additionally, or alternatively, the absence of this
layer may simply disrupt molecular interactions associated with previously described
self-assembly processes in exospores (Hemsley et al. 1992; Gabarayeva 1993;
Collinson et al. 1993; Gabarayeva and Hemsley 2006; Hemsley and Gabarayeva
2007) which may possibly be involved in normal perine development in P. patens.
Either way, the electron microscope evidence implies that PPMS2-1 is not directly
associated with the synthesis of perine designated sporopollenin.
The protein sequence homology of PPMS2-1 with A. thaliana MS2 suggests that it is
involved with the biosynthesis of the sporopolleninous exine layer of the moss spore
wall, and therefore the layer missing in the mature spore walls of ppms2-1 is the
exine. However, data obtained from TEM analysis and acetolysis tests contradict this.
In P. patens wildtype spores, at the post-tetrad stage, the exine is fully formed and a
rapidly developing perine is present. Therefore, if the deletion of PPMS2-1 results in
the absence of the exine then in ppms2-1 spores at the same stage it would be expected
that the only potentially observable wall layer would be the perine. However, the
post-tetrad ppms2-1 TEM image presented here (Fig. 5.3B) shows two homogenous
layers of different thicknesses which tentatively suggests that the exine layer, or an
exine-like layer, is still present in ppms2-1, and the intine is the absent layer in mature
ppms2-1 spore walls. Further credence is added to this suggestion by the finding that
ppms2-1 spores are no more sensitive to acetolysis than wildtype spores (Fig. 5.4). A
role of PPMS2-1 in intine development would represent a remarkable finding as it
would imply a major switch in the function of MS2 in spore/pollen wall development
from an involvement in polysaccharide synthesis in ‘lower’ land plants, to playing a
key role in sporopollenin synthesis in ‘higher’ land plants. However, the TEM
evidence underpinning this proposition consists of just one image. Further

Chapter 5. Functional analysis of PPMS2-1
116
images/replicates could not be obtained in the time frame allocated for this study due
to the fixation and infiltration problems associated with early to mid developmental
stage spores/sporophytes described in chapter 3. Therefore further replicates are
required to validate or invalidate this proposition. It could be the case that if the intine
is still present then the deletion of PPMS2-1, in addition to severely compromising
exine formation, affects the timing of intine development. An undetectable exine may
still be present in some form and capable of affording ppms2-1 spores resistance to
acetolysis. If further investigations were to confirm that the missing, or highly
defective, wall layer in ppms2-1 mature spores is the exine then it would strongly
suggest that PPMS2-1 plays a homologous role to A. thaliana MS2 in P. patens exine
formation and spore wall formation as a whole.
Spore germination tests show that whichever layer is missing/undiscernable, the
distinct and severe wall phenotype exhibited by ppms2-1 renders the spores mostly
inviable (Fig. 5.7), and one line (ppms2-1 KO1) is completely infertile and cannot
produce any spores of wildtype size. The reason for the discrepancy between ppms2-1
KO1 and the other knock-out lines is unclear. It is feasible that this difference is due
to a second site mutation occurring during the transformation process, and it would be
interesting to determine, with inverse PCR, where the replaced wildtype DNA has
recombined in the P. patens genome since RT-PCR showed that ppms2-1 KO1
exhibited ectopic reintegration. Of course, phenotypic variation has often been
observed with targeted mutagenesis and it is possible that mutant phenotypes are
associated not only with specific functional effects, but also interference with wildtype
networks resulting in the expression of numerous unrelated genes being affected
(Featherstone and Brodie 2002; Bergman and Siegal 2003; Pouteau et al. 2004).
The abnormal cytoplasmic arrangement of ppms2-1 spores indicates that PPMS2-1
may be expressed in the spore itself and that the missing wall layer is derived from the
spore. Of course, it is not inconceivable that this defect of the cytoplasm may in some
part be due to the degradation observed in a number of the mutant spores. In order to
determine the expression of PPMS2-1 in haploid spores the transformation of P.
patens, with a construct consisting of the GUS reporter gene under the control of the
PPMS2-1 promoter (PPMS2-1::GUS) (see chapter 2, section 2.5.3), was conducted.
However, at the time of writing this thesis, putative positive transformants had not yet

Chapter 5. Functional analysis of PPMS2-1
117
been acquired. Once positive transformants are analysed in the near future, the
specific location of PPMS2-1 expression may be clarified and further illuminate its
role in wall formation.
Attempts at determining differences in wildtype and mutant spore chemistry using
Raman microspectroscopy were unsuccessful due to the lack of separation between
sample sets with PCA. The wide scattering of replicates from ppms2-1 on the PCA
plot is possibly due to the ruptured nature of many of the mutant spores resulting in
some spectra being representative of the outer surface of spores, and others
representative of spore contents. Given these inconclusive data it would appear that
Raman microspectroscopy is not a practical approach for the ppms2-1 spore
phenotype and other techniques, such as mass spectrometry where samples are
ionised, should be explored.
There were no obvious morphological or growth defects at the protonemal or
gametophore stages of the ppms2-1 KO lines and sporophyte production appeared
normal, although further analyses should be undertaken to detect any possible subtle
phenotypes. In particular, given that a recent study has shown that moss calyptrae are
covered by a cuticle (Budke et al. 2011), analysis of the P. patens calyptra cuticle may
shed further light on which type of enzymatic pathway PPMS2-1 is involved in since
it is has been proposed that exine and cutin possibly share a common lipidic
biosynthetic pathway. Additionally, it would be interesting to discover if a double
knock-out of PPMS2-1 and PPMS2-2 (Pp_120173) would produce an even more
pronounced spore phenotype.
Nevertheless, the observation of a highly defective spore wall with PPMS2-1 loss of
function suggests that the MS2-linked enzymatic pathway required for pollen wall
development in angiosperms is present in some form in the sporophyte/spores of P.
patens and therefore is most likely shared by all embryophytes.
5.3.2 Lack of complementation of Arabidopsis thaliana ms2 mutants by PPMS2-1
The observation that PPMS2-1 is unable to rescue the defective pollen wall of A.
thaliana ms2 suggests that the MS2 gene has evolved in ‘higher’ land plants in concert
with the increased complexity of their pollen walls. This is supported by the relatively

Chapter 5. Functional analysis of PPMS2-1
118
low protein sequence homology (48%) of the MS2 homologues which is not
particularly unexpected given the large evolutionary gulf between A. thaliana and P.
patens. The same experiment was attempted using a PPMS2-1 splice variant
containing three introns (Fig. 5.9), as gene expression is often enhanced by the
presence of introns, and in some instances the presence of multiple introns has been
shown to be essential for gene expression (Karve et al. 2011). However, the same
unrestored phenotype in the A. thaliana ms2 background was also observed in this
instance.
Figure 5.9. Schematic of ATMS2pro::PPMS2-1 and a ATMS2pro::PPMS2-1
splice variant constructs used for the attempted complementation of A. thaliana
ms2 mutants. The promoter is the A. thaliana HindIII MS2 promoter fragment (1,077
base pairs) identified by Aarts et al. (1997). The splice variant consisted of the full
PPMS2-1 (Pp136_166V6; alias Pp_11916) CDS proposed and presented on the
Cosmoss database, and three proposed introns.
It is possible that electron microscope analysis may not be sufficient to detect subtle
partial rescues and future analysis should at least examine the functionality of
ATMS2pro::PPMS2-1 pollen with pollen germination tests. A partial rescue would
indicate a conserved role of MS2 in exine formation in land plants, but would also
suggest that the interaction of PPMS2-1 protein with other elements of the
sporopollenin biosynthesis pathway is less efficient than with the A. thaliana MS2
protein. Additionally, whilst the expression of PPMS2-1 was verified in the flowers
of ATMS2pro::PPMS2-1, this study did not attempt to confirm whether the PPMS2-1
gene can actually produce a protein in the A. thaliana ms2 background, and future
analyses of this line should examine this by way of epitope tagging and/or western
blot. Furthermore, the PPMS2-1 model used for the complementation experiment has
been produced using gene prediction algorithms with limited EST evidence to support

Chapter 5. Functional analysis of PPMS2-1
119
it. Therefore, some doubt remains as to whether the correct start codon has been
identified (the start codon in the Cosmoss model has an adequate Kozak consensus)
and consequently, whether the correct CDS has been used. Further mRNA
sequencing and genetic characterisation should clarify the PPMS2-1 CDS. Future
complementation attempts may also look to use a different A. thaliana MS2 promoter
fragment. The A. thaliana MS2 HindIII promoter fragment employed here was
originally used for a MS2 promoter-GUS gene fusion by Aarts et al. (1997). The gene
swap experiment which demonstrated that a rice MS2 homologue, DPW, could
complement A. thaliana ms2 mutants, used a ~1,100 base pair A. thaliana MS2
promoter fragment amplified directly upstream of the start codon (Shi et al. 2011),
unlike the HindIII promoter fragment which was a 1,077 base pair fragment amplified
127 base pairs upstream of the start codon. It would be interesting to see if the use of
this promoter fragment may yield a more obvious rescue, or partial rescue, in A.
thaliana ms2 mutants with PPMS2-1.
Complementation attempts were also made with PPMS2-1 under the control of the
constitutive A. thaliana UB14 promoter (ATUBQ14pro::PPMS2-1) (see chapter 2,
section 2.5.1) and positive transformants were identified. However, analysis of
ATUBQ14pro::PPMS2-1 pollen had not yet been conducted at the time of writing this
thesis.
When these gene swap results are considered alongside the data from the P. patens
knock-out experiments it would appear that the role of MS2 in spore/pollen wall
development is conserved across land plants. However, the lack of complementation
of A. thaliana MS2 with PPMS2-1 suggests that, although MS2 is conserved, it has
evolved in ‘higher’ land plants as their pollen walls have increased in complexity.
5.4 Summary
The knock-out experiment results presented in this chapter have demonstrated that
PPMS2-1 is essential for normal P. patens spore wall development and the viability of
spores as a whole which indicates that the involvement of MS2 in spore/pollen wall
formation is conserved in land plants. PPMS2-1 deletion results in a defective perine
and the absence of a spore wall layer. ppms2-1 spores also exhibit a highly

Chapter 5. Functional analysis of PPMS2-1
120
disorganised cytoplasm which suggests that PPMS2-1 is expressed in the spore itself
and the absent layer is spore derived. Analysis of ppms2-1 spores could not
definitively determine which wall layer is absent and therefore two roles for PPMS2-1
in spore wall development are hypothesised. First, the absent wall layer is the intine
and therefore PPMS2-1 is involved in intine formation which would infer that MS2
has switched from playing a role in polysaccharide synthesis in ‘lower’ land plant
spores to being recruited to play a role in sporopollenin synthesis and exine formation
in the pollen grains of ‘higher’ land plants. Second, PPMS2-1 is involved in exine
formation and a highly defective and undetectable exine is present in ppms2-1 spores,
along with the intine, and enables the spores to still mostly resist acetolysis. Should
this be subsequently proven, it would strongly suggest that the role of MS2 in exine
formation in angiosperms, and associated sporopollenin synthesis, has been conserved
across 400 million years of land plant evolution. Additionally, the apparent inability
of PPMS2-1 to complement A. thaliana ms2 mutants suggests that, whilst MS2 is
conserved, it has evolved in ‘higher’ land plants as pollen walls have accumulated
greater complexity.

Chapter 6. General discussion
121
CHAPTER 6. General discussion
This chapter consolidates the findings from previous chapters so that the principle
conclusions are discussed and put in context with existing research conducted in the
field of spore and pollen wall development, and land plant evolution as a whole.
Additionally, potential future works required to resolve some of the enduring
unanswered questions are also considered. The principle conclusions are summarised
first.
6.1 Principle conclusions
Physcomitrella patens spore walls receive a sporopollenin input from both the
spore and the tapetum, and therefore exospore development is controlled by
both the diploid sporophyte and the haploid spore.
Physcomitrella patens spores only reach full maturity at the latter stages of
spore capsule development, a finding which contradicts previous propositions
regarding sporogenesis with respect to spore capsule development put forward
by Huang et al. (2009) and S. Schuette (University of Southern Illinois, USA,
pers. comm.. 2009).
Perine designated sporopollenin in P. patens appears to be supplied by a
degenerating tapetum rather than a secretory tapetum.
The vast majority of pollen wall associated genes identified in A. thaliana have
homologues in P. patens and S. moellendorffii, and these homologues largely
belong to multigene families indicating a high potential for genetic
redundancy.

Chapter 6. General discussion
122
Homologues of seven A. thaliana pollen wall associated genes (specifically
implicated in tetrad separation and sporopollenin biosynthesis/exine
formation) exhibit significantly upregulated expression in the P. patens
sporophyte at stages when spore walls develop.
PPMS2-1 is essential for normal spore wall development and spore viability in
P. patens and therefore, the involvement of MS2 in spore and pollen wall
development appears to be conserved in land plants.
PPMS2-1 cannot complement A. thaliana ms2 mutants in the experiments
conducted in this study which suggests that MS2, although conserved, may
have evolved in higher plants as pollen walls have increased in complexity.
6.2 Spore wall development in Physcomitrella patens
Previous studies have emphasised how remarkably conserved the processes associated
with sporogenesis and spore/pollen wall formation are within land plants (Owen and
Makaroff 1995; Renzaglia et al. 2000; Scott et al. 2004; Blackmore et al. 2007),
whereby contributions from diploid and haploid generations result in the formation of
a sporopolleninous exospore shortly after meiosis at the tetrad stage, followed by the
development of a pectocellulosic, microspore derived intine layer upon the release of
the microspores from the tetrad. The observations presented in chapter 3 confirm that
sporogenesis and spore wall formation in P. patens conforms to this paradigm. These
observations also confirm the interplay between the diploid sporophyte and haploid
microspores by identifying the main sources of sporopollenin for the perine and exine
layers. Exine designated sporopollenin would appear to be derived from the spore
(although the mechanisms for sporopollenin deposition in this instance remain
unclear), and perine designated sporopollenin is provided by a rapidly degenerating
tapetum. In ‘higher’ land plant pollen grains, which lack a perine, the tapetum
contributes much of the exine sporopollenin (Ariizumi and Toriyama 2011; Dou et al.
2011). It seems highly feasible that the perine has become incorporated into the exine
of ‘higher’ land plants which would mostly account for the tapetum assuming greater
responsibility for exine sporopollenin and explain, to some degree, the increased
complexity observed in pollen exines. In a number of A. thaliana pollen exine

Chapter 6. General discussion
123
mutants (Aarts et al. 1997; Morant et al. 2007; de Azevedo et al. 2009; Dobritsa et al.
2009), which exhibit highly aberrant exines due to the disruption in the synthesis of
tapetally sourced sporopollenin, a thin layer which corresponds to the nexine, the
internal part of the exine, is still present. The presence of this layer suggests that it
may be microspore derived although an ongoing study has identified a tapetally
expressed gene, named NEXINE LAYER CONTROLLER (NLC), which is thought to
be involved in nexine development (Yang et al. 2012). Hopefully, the source of the
nexine will be clarified further upon the conclusion of this study.
Consideration of these assertions allows propositions regarding spore/pollen wall
component homology in land plants to be put forward. It would seem that the perine
of ‘lower’ land plant spores may be homologous to the sexine division of the ‘higher’
land plant pollen exine. Additionally, should the nexine be shown to be microspore
derived in some part then it would be reasonable to suggest that it is homologous to
the exine of ‘lower’ land plant spores.
The study presented in chapter 3 has also further clarified spore development in P.
patens with respect to spore capsule development. It has established a rudimentary
developmental staging model which can more reliably aid and direct morphological
and gene expression studies in the sporophyte than previously proposed schemes.
6.3 Identification of candidate spore wall genes in Physcomitrella patens
Through the combination of genome searches and transcriptomic analysis presented in
chapter 4, a suite of candidate spore wall genes in P. patens has been identified and
offers an insight into the biochemical and developmental pathways shared by the
sporophytes and spores of mosses and anthers and pollen of 'higher' plants.
Microarray analysis suggests that A. thaliana pectin degradation/tetrad separation and
sporopollenin synthesis/exine gene homologues in P. patens are highly expressed
during the spore wall building stages of sporophyte development. This implies that
certain mechanisms required for pollen wall development in 'higher' land plants are
conserved, and this conservation is due to similarites at the molecular level indicating
that the proposed associated genetic pathways underpinning pollen wall development
are ancient. Additionally, the finding that P. patens homologues of A. thaliana callose

Chapter 6. General discussion
124
wall genes are not significantly upregulated in the sporophyte is consistent with
morphological observations which suggest that a callose wall only contributes to wall
development in gymnosperms and angiosperms (Gabarayeva and Hemsley 2006).
The callose wall can therefore be described as a more specialist element of pollen wall
development and, as such, the genes and pathways associated with it are less well
conserved and have evolved de novo or have been conscripted from existing callose
networks involved with different cellular functions in 'lower' land plants.
6.4 A core component of the pollen wall developmental pathway appears to be
ancient and highly conserved
The observations of abnormal spore walls with PPMS2-1 loss of function, as
presented in chapter 5, provides compelling evidence that the role of MS2 in pollen
wall development is highly conserved in land plants, and confirms that MS2 is
essential for normal spore and pollen wall development. Whilst this study does not
definitively determine which aspect of spore wall formation PPMS2-1 is involved in,
a connection to sporopollenin synthesis seems most likely given the involvement of
MS2 in exine formation in angiosperms. This likely connection is reinforced by the
significantly upregulated expression, during sporogenesis, of P. patens homologues of
A. thaliana genes proposed to operate within the same fatty acid branch of the
sporopollenin biosynthesis network as MS2.
The conservation of the biochemical and developmental pathway required for
spore/pollen wall development is consistent with the findings from previous EvoDevo
studies which have also found that core components of genetic networks, which
underpin other evolutionary innovations which permitted the colonisation of land and
subsequent diversification (leaf, root and stomata), are also ancient and highly
conserved (Harrison et al. 2005; Menand et al. 2007; Chater et al. 2011; Ruszala et al.
2011). More specifically, the conservation of the genetic networks which control
sporopollenin synthesis also meshes with the results obtained by a recent study which
employed Fourier transform infrared spectroscopy (FT-IR) to demonstrate that the
structure of sporopollenin has not changed since plants colonised land (Fraser et al.
2012).

Chapter 6. General discussion
125
The inability of PPMS2-1 to complement A. thaliana ms2 mutants suggests that the
conservation of the MS2 component of the sporopollenin biosynthesis framework is
partial, and its evolution has been important in driving the increasing complexity
observed in angiosperm pollen walls. Additionally, the abnormal cytoplasmic
arrangement present in ppms2-1 spores supports the electron microscope observations
in chapter 3 that the sporopolleninous components (exine and perine) of the P. patens
spore wall are most likely controlled by both the diploid sporophyte (perine) and the
haploid spore (exine).
The support, provided in chapters 4 and 5, for the proposition that core components of
the angiosperm pollen wall developmental pathway are operational in bryophyte spore
walls suggests that these components were most likely co-opted from an existing
network present in the last common ancestor of embryophytes, associated with the
sporopolleninous zygote wall of algae. Therefore, the recruitment of parts of this
genetic system represents a crucial step in the emergence of spore walls, an innovation
which would endow the earliest ‘prototypes’ of land plants, or ‘protoembryophytes’,
with the reproductive advantage of being able to manufacture desiccation-resistant
spores (Brown and Lemmon 2011).
6.5 Future work
6.5.1 Physcomitrella patens spore wall development
Whilst the ultrastructural analysis presented in this thesis provides further insight and
resolution with regards to spore wall ontogeny in P. patens, questions still remain with
respect to key stages of its development. In particular, uncertainty persists as to
whether lamellae are present and play a role in sporopollenin accumulation. The
homogenous appearance of the mature P. patens spore exine may tempt observers to
conclude that lamellae are not involved in its formation since their presence is often
associated with observable substructure in embryophytes. However, sporopollenin
deposition and/or compression can mask this substructure (Wellman 2004), and
therefore, further and more exhaustive TEM analysis is required at early wall
developmental stages to confirm their presence or absence. In addition to aiding
future spore wall gene function studies, further elucidation of wall developmental

Chapter 6. General discussion
126
processes in this valuable model bryophyte may also assist in determining whether
self-assembly processes are operative in the spore walls of basal land plants. The role
of self-assembly in spore and pollen exine construction has been discussed by
numerous authors (Heslop-Harrison 1972; Collinson et al. 1993; Hemsley et al. 1994,
2000, 2004; Borsh and Wilde 2000; Gabareyeva 2000; Gabarayeva and Hemsley
2006). The integration of EvoDevo studies and materials science, specifically colloid
chemistry, which is central to studies of self-assembly in this context (Gabarayeva and
Hemsley 2006), may clarify whether self-assembly processes are active in bryophyte
spore walls and, if so, how these processes build upon the genetic control of wall
development.
6.5.2 The fatty acid synthesis component of the sporopollenin biosynthesis
framework
The finding that the function of MS2 is conserved, or partially conserved, in
embryophytes begs the question as to whether other genes proposed to function within
a MS2-linked pathway in A. thaliana are also conserved, and as such potentially
provide further evidence of a role in sporopollenin synthesis for PPMS2-1. These
additional studies would indicate how much of the fatty acid synthesis component of
the sporopollenin biosynthesis framework in higher plants is evolutionary conserved.
The transcriptomic analysis presented in chapter 4 certainly suggests that all of the
components of this proposed pathway may be similarly conserved and given this,
verification by functional analyses of some of these genes is desirable. P. patens
homologues of these genes, (e.g., ACOS5, CYP703A2 and CYP704B1) were not
investigated beyond the microarray analysis in this study due to their lack of obvious
suitability for knock-out experiments, mostly because of the high potential for genetic
redundancy. Therefore, different functional approaches could be investigated with
these genes. For example, targeted gene silencing using RNA interference (RNAi)
could be explored. Whilst this approach can be less definitive than knocking out
genes, RNAi can enable multiple gene family members to be targeted and knocked-
down with a single transgene. Additionally, if the conservation of the fatty acid
synthesis pathway is to be further tested, the model proposed in A. thaliana (described
in chapter 4) requires further verification. For example, clarification is required as to
whether the two hydroxylation steps involving CYP703A2 and CYP704B1 operate
within the same pathway. The results garnered from promising ongoing studies, using

Chapter 6. General discussion
127
FT-IR and pyrolysis to further elucidate the structure of sporopollenin (Fraser et al.
2012), should help to direct further propositions of models of sporopollenin synthesis.
6.5.3 The utilisation of emerging model systems and wider implications
Whilst much of the focus of this thesis has been on the bryophyte, P. patens (due to
the availability of appropriate genetic resources), the development of novel 'lower'
land plant experimental systems, such as S. moellendorffii and the liverwort,
Marchantia polymorpha, will allow a deeper insight into the evolution of the spore
and pollen wall, and more broadly, enable us to better assess whether the key
mechanisms required for plant terrestrialisation have been conserved over 400 million
years of embryophyte evolution. Additionally, comparisons of the genomes of these
basal model plants with that of a genome of a charophycean green alga, the ancestral
lineage from which embryophytes emerged, should further illuminate the evolution of
sporopollenin encased propagules during the emergence of terrestrial plants, and
perhaps confirm the direct evolutionary transfer of the algal zygote wall to the spores
of embryophytes. Furthermore, as our understanding of the developmental processes
which enabled plant terrestrialisation progresses, future research in this area may yield
practical benefits. The rising global human population will further increase demand
for natural resources, particularly water, and food. If crop plants can be genetically
modified to use water more efficiently then an important contribution can be made
towards ensuring that the demand for food and water does not outstrip supply.

References
128
References
Aarts MGM, Dirkse WG, Stiekema WJ, Pereira A. 1993. Transposon tagging of a
male sterility gene in Arabidopsis. Nature, 363: 715-717.
Aarts MGM, Hodge R, Halantidis K, Florack D, Wilson AZ, Mulligan BJ,
Stiekema WJ Scott R, Pereira A. 1997. The Arabidopsis MALE
STERILITY 2 protein shares similarity with reductases in
elongation/condensation complexes. The Plant Journal, 12(3): 615-623.
Abercrombie JM, O'Meara BC, Moffatt AR, Williams JH. 2011. Developmental
evolution of flowering plant pollen tube cell walls: callose synthase (CalS)
gene expression patterns. EvoDevo, 2: 14.
Ahlers F, Thom I, Lambert J, Kuckuk R, Wiermann R. 1999. 1H NMR analysis
of sporopollenin from Typha angustifolia. Phytochemistry, 5: 1095-1098.
Ariizumi T, Hatakeyama K, Hinata K, Inatsugi R, Nishida I, Sato S, Kato T,
Tabata S, Toriyama K. 2004. Disruption of the novel plant protein NEF1
affects lipid accumulation in the plastids of the tapetum and exine formation of
pollen, resulting in male sterility in Arabidopsis thaliana. The Plant Journal,
39: 170-181.
Ariizumi T, Hatakeyama K, Hinata K, Sato S, Kato T, Tabata S, Toriyama K.
2003. A novel male-sterile mutant of Arabidopsis thaliana, faceless pollen-1,
produces pollen with a smooth and an acetolysis-sensitive exine. Plant
Molecular Biology, 53: 107-116.
Ariizumi T, Hatakeyama K, Hinata K, Sato S, Kato T, Tabata S, Toriyama K. 2005. The HKM gene, which is identical to the MS1 gene of Arabidopsis
thaliana, is essential for primexine formation and exine pattern formation.
Sexual Plant Reproduction, 18: 1-7.
Ariizumi T, Kawanabe T, Hatakeyama K, Sato S, Kato T, Tabata S, Toriyama
K. 2008. Ultrastructural characterization of exine development of the transient
defective exine 1 mutant suggests the existence of a factor involved in
constructing reticulate exine architecture from sporopollenin aggregates. Plant
Cell Physiology, 49(1): 58-67.
Ariizumi T, Toriyama K. 2011. Genetic regulation of sporopollenin synthesis and
pollen exine development. Annual Review of Plant Biology, 62: 437-460.
Ashton NW, Cove DJ. 1977. The isolation and preliminary characterization of
auxotrophic and analogue resistant mutants of the moss Physcomitrella patens.
Molecular and General Genetics, 154: 87-95.

References
129
Aya K, Hiwatashi Y, Kojima M, Sakakibara H, Ueguchi-Tanaka M, Hasebe M,
Matsuoka M. 2011. The Gibberellin perception system evolved to regulate a
pre-existing GAMYB-mediated system during land plant evolution. Nature
Communications, 2: 544.
Aya K, Ueguchi-Tanaka M, Kondo M, Hamada K, Yano K, Nishimura M,
Matsuoka M. 2009. Gibberellin modulates anther development in rice via the
transcriptional regulation of GAMYB. Plant Cell, 21: 1453-1472.
Babenko VN, Rogozin IB, Mekhedov SL, Koonin EV. Prevalence of intron gain
over intron loss in the evolution of paralogous gene families. Nucleic Acids
Research, 32(12): 3724-3733.
Banks JA, Nishiyama T, Hasebe M, Bowman JL, Gribskov M, De Pamphilis C,
Albert VA, Aono N, Aoyama T, Ambrose BA et al. 2011. The Selaginella
genome identifies genetic changes associated with the evolution of vascular
plants. Science, 332: 960-963.
Beerling DJ. 2007. Emerald planet. How plants changed Earth’s history. Oxford:
Oxford University Press.
Belin C. 2006. Structure et fonctions de la protein kinase OST1 dans la cellule de
garde d’Arabidopsis thaliana. PhD Thesis. University of Paris-Sud: France.
Bergman A, Siegal ML. 2003. Evolutionary capacitance as a general feature of
complex gene networks. Nature, 424: 549-552.
Blackmore S, Barnes SH. 1987. Embryophyte spore walls: origin, development and
homologies. Cladistics, 3: 185-195.
Blackmore S, Takahashi M, Uehara K. 2000. A preliminary phylogenetic analysis
of sporogenesis in pteridophytes. In: Harley MM, Morton CM, Blackmore S,
eds. Pollen and Spores: Morphology and Biology. London: Royal Botanic
Gardens, Kew, 109-124.
Blackmore S, Wortley AH, Skvarla JJ, Rowley JR. 2007. Pollen wall development
in flowering plants. New Phytologist, 174: 483-498.
Borsh T, Wilde V. 2000. Pollen variability within species, populations, and
individuals, with particular reference to Nelumbo. In: Harley MM, Morton
CM, Blackmore S, eds. Pollen and Spores: Morphology and Biology.
London: Royal Botanic Gardens, Kew, 285-299.
Brett C, Waldron K. 1996. Physiology and Biochemistry of Plant Cell Walls.
London: Chapman and Hall.
Brown RC, Lemmon BE. 1980. Ultrastructure of sporogenesis in a moss, Ditrichum
pallidum. III. Spore wall formation. American Journal of Botany, 67(6): 918-
934.

References
130
Brown RC, Lemmon BE. 1984. Spore wall development in Andreaea (Musci:
Andreaeopsida). American journal of Botany, 71(3): 412-420.
Brown RC, Lemmon BE. 1985. Spore wall development in the liverwort,
Haplomitrium hookeri. Canadian Journal of Botany, 64: 1174-1182.
Brown RC, Lemmon BE. 1988. Sporogenesis in bryophytes. Advances in Bryology,
3: 159-223.
Brown RC, Lemmon BE. 1990. Sporogenesis in bryophytes. In: Blackmore S,
Barnes SH, eds. Pollen and Spores: Patterns of Diversification. The
Systematics Association Special Volume No. 44. Oxford: Oxford Science
Publications, 9-24.
Brown RC, Lemmon BE. 1993. Spore wall development in the liverwort
Fossombronia wondraczekii (Corda) Dum. Journal of the Hattori Botanical
Laboratory, 74: 83-94.
Brown RC, Lemmon BE. 2011. Spores before sporophytes: hypothesizing the origin
of sporogenesis at the algal-plant transition. New Phytologist, 190(4): 875-
881.
Brown RC, Lemmon BE, Carothers ZB. 1982. Spore wall development in
Sphagnum lescurii. Canadian Journal of Botany, 60(11): 2394-2409.
Brown RC, Lemmon BE, Renzaglia KS. 1986. Sporocytic control of spore wall
pattern in liverworts. American Journal of Botany, 73(4): 593-596.
Budke JM, Goffinet B, Jones CS. 2011. A hundred-year-old question: is the moss
calyptras covered by a cuticle? A case study of Funaria hygrometrica. Annals
of Botany, 107(8): 1279-1286.
Carrión JS, Cano MJ, Guerra J. 1995. Spore morphology in the moss genus
Pterygoneurum Jur. (Pottiaceae). Nova Hedwigia, 61: 481-496.
Chater C, Kamisugi Y, Movahedi M, Fleming A, Cuming AC, Gray JE, Beerling
DJ. 2011. Regulatory Mechanism controlling stomatal behavior conserved
across 400 million years of land plant evolution. Current Biology, 12: 1025-
1029.
Chen X, Goodwin SM, Boroff VL, Liu X, Jenks MA. 2003. Cloning and
characterization of the WAX2 gene of Arabidopsis involved in cuticle
membrane and wax production. Plant Cell, 15: 1170-1185.
Chen W, Yu X, Zhang K, Shi J, De Oliveira S, Schreiber L, Shanklin J, Zhang D.
2011. Male Sterile2 encodes a plastid-localized fatty acyl carrier protein
reductase required for pollen exine development in Arabidopsis. Plant
Physiology, 157: 842-853.
Clough SJ, Bent AF. 1998. Floral dip: A simplified method for Agrobacterium-
mediated transformation of Arabidopsis thaliana. Plant Journal, 16: 735-743.

References
131
Collier PA, Hughes KW. 1982. Life cycle of the moss, Physcomitrella patens, in
culture. Journal of Tissue Culture Methods, 7(1): 19-22.
Collinson ME, Hemsley AR, Taylor WA. 1993. Sporopollenin exhibiting colloidal
organization in spore walls. Grana, 1, supplement: 31-39.
Cove DJ. 2000. The moss, Physcomitrella patens. Journal of Plant Growth
Regulation, 19: 275-283.
Crang RE, May G. 1974. Evidence for silicon as a prevalent elemental component
in pollen wall structure. Canadian Journal of Botany, 52(10): 2171-2174.
Cronk Q. 2009. The Molecular Organography of Plants. Oxford: Oxford University
Press.
De Avezado Souza C, Kim SS, Koch S, Kienow l, Schneider K, Mckim SM,
Haugh GW, Kombrink E, Douglas CJ. 2009. A novel fatty acyl-CoA
synthase is required for pollen development and sporopollenin biosynthesis in
Arabidopsis. The Plant Cell, 21: 507-525.
De Gelder J, De Gussem K, Vandenabeele P, Moens L. 2007. Reference database
of Raman spectra of biological molecules. Journal of Raman Spectroscopy,
38: 1133-1147.
Dickinson HG. 1971. The role played by sporopollenin in the development of pollen
in Pinus banksiana. In: Brooks J, Grant PR, Muir MD, van Gijzel P, Shaw G,
eds. Sporopollenin. New York: Academic Press, 31-65.
Dickinson HG, Bell PR. 1970. The development of the sacci during pollen formation
in Pinus banksiana. Grana, 10: 101-108.
Dickinson HG, Lewis D. 1973. The formation of the tryphine coating the pollen
grains of Raphanus, and its properties relating to the self-incompatibility
system. Proceedings of the Royal Society of London, 185: 149-165.
Doan TT, Carlsson AS, Hamberg M, Bülow L, Stymne S, Olsson P. 2009.
Functional expression of five Arabidopsis fatty acyl-CoA reductase genes in
Escherichia coli. Journal of Plant Physiology, 166: 787-796.
Dobritsa AA, Lei ZT, Nishikawa SI, Urbanaczyk-Wochniak E, Huhman DV,
Preuss D, Sumner LW. 2010. LAP5 and LAP6 encode anther-specific
proteins with similarity to chalcone synthase essential for pollen exine
development in Arabidopsis. Plant Physiology, 153: 937-955.
Dobritsa AA, Shresta J, Morant M, Pinot F, Matsuno M, Swanson R, Møller BL,
Preuss D. 2009. CYP704B1 is a long-chain fatty acid ω-hydroxylase essential
for sporopollenin synthesis in pollen of Arabidopsis. Plant Physiology, 151:
574-589.
References
132
Domínguez E, Mercado JA, Quesada MA, Heredia A. 1999. Pollen sporopollenin:
degradation and structural elucidation. Sex Plant Reproduction, 12: 171-178.
Dong X, Hong Z, Sivaramakrishnan M, Mahfouz M, Verma DP. 2005. Callose
synthase (CalS5) is required for exine formation during microgametogenesis
and for pollen viability in Arabidopsis. Plant Journal, 42: 315-328.
Dou XY, Yang KZ, Zhang Y, Wang W, Liu XL, Chen LQ, Zhang XQ, Ye D.
2011. WBC27, an adenosine tri-phosphate-binding cassette protein, controls
pollen wall formation and patterning in Arabidopsis. Journal of Integrative
Plant Biology, 53(1): 74-88.
Drakakaki G, Zabotina O, Delgado I, Robert S, Keegstra K, Raikhel N. 2006.
Arabidopsis reversibly glycosylated polypeptides 1 and 2 are essential for
pollen development. Plant Physiology, 142: 1480-1492.
Duan H, Schuler MA. 2005. Differential expression and evolution of the
Arabidopsis CYP86A subfamily. Plant Physiology, 137: 1067-1081.
Echlin P, Godwin H. 1969. The ultrastructure and ontogeny of pollen in Helleborus
foetidus L. III. The formation of the pollen grain wall. Journal of Cell Science,
5: 459-477.
Edgar RC. 2004. MUSCLE: multiple sequence alignment with high accuracy and
high throughput. Nucleic Acids Research, 32(5): 1792-1797.
Erdtman G. 1960. The acetolysis method. Sven Bot Tidskr, 54: 561-564.
Estébanez B, Alfayate C, Ron E. 1997. Observations on spore ultrastructure in six
species of Grimmia (Bryopsida). Grana, 36(6): 347-357.
Featherstone DE, Broadie K. 2002. Wrestling with pleiotropy: genomic and
topological analysis of the yeast gene expression network. Bioessays, 24: 267-
274.
Federici L, Caprari C, Mattei B, Savino C, Di Matteo A, De Lorenzo, Cervone F,
Tsernoglou D. 2001. Structural requirements of endopolygalacturonase for
the interaction with PGIP (Polygalacturonase-inhibiting protein). Proceedings
of the National Academy of Sciences, 98(23): 13425-13430.
Fei H, Zhang R, Pharis RP, Sawhney VK. 2004. Pleiotropic effects of the males
sterile33 (ms33) mutation in Arabidopsis are associated with modifications in
endogenous gibberellins, indole-3-acetic acid and abscisic acid. Planta, 219:
649-660.
Felsenstein J. 1985. Confidence limits on phylogenies: an approach using the
bootstrap. Evolution, 39: 783-791.
Francis KE, Lam SY, Copenhaver GP. 2006. Separation of Arabidopsis pollen
tetrads is regulated by QUARTET1, a pectin methylesterase gene. Plant
Physiology, 142: 1004-1013.

References
133
Frankel R, Izhar S, Nitsan J. 1969. Timing of callase activity and cytoplasmic
male sterility in Petunia. Biochemical Genetics, 3: 451-455.
Fraser WT, Scott AC, Forbes AES, Glasspool IJ, Plotnick RE, Kenig F, Lomax
BH. 2012. Evolutionary stasis of sporopollenin biochemistry revealed by
unaltered Pennsylvanian spores. New Phytologist, 196(2): 397-401.
Gabarayeva NI. 1993. Hypothetical ways of exine pattern determination. Grana,
33, supplement 2: 54-59.
Gabarayeva NI. 1996. Sporoderm development in Liriodendron chinense
(Magnoliaceae): a probable role of the endoplasmic reticulum. Nordic Journal
of Botany, 16: 307-323.
Gabarayeva NI. 2000. Principles and recurrent themes in sporoderm development.
In: Harley MM, Morton CM, Blackmore S, eds. Pollen and Spores:
Morphology and Biology. London: Royal Botanical Gardens, Kew, 1-16.
Gabarayeva NI, Hemsley AR. 2006. Merging concepts: The role of self-assembly in
the development of pollen wall structure. Review of Palaeobotany and
Palynology, 138: 121-139.
Gibalová A, Reňák D, Matczuk K, Dupl’áková N, Cháb D, Twell D, Honys D.
2009. AtbZIP34 is required for Arabidopsis pollen wall patterning and the
control of several metabolic pathways in developing pollen. Plant Molecular
Biology, 70: 581-601.
Glime JM. 2007. Bryophyte Ecology. Volume 1. Physiological Ecology. Ebook
sponsored by Michigan Technological University and the International
Association of Bryologists.
Graham LE. 1993. Origin of Land Plants. New York: Wiley.
Grienenberger E, Kim SS, Lallemand B, Geoffroy P, Heintz D, Souza CD, Heitz
T, Douglas CJ, Legrand M. 2010. Analysis of TETRAKETIDE alpha-
PYRONE REDUCTASE function in Arabidopsis thaliana reveals a previously
unknown, but conserved, biochemical pathway in sporopollenin monomer
biosynthesis. The Plant Cell, 22: 4067-4083.
Guan Y, Huang X, Zhu J, Gao J, Zhang H, Yang Z. 2008. RUPTURED POLLEN
GRAIN1, a member of the MtN3/saliva gene family, is crucial for exine pattern
formation and cell integrity of microspores in Arabidopsis. Plant Physiology,
147: 852-863.
Haig D, Wilczek A. 2006. Sexual conflict and the alternation of haploid and diploid
generations. Philosophical Transactions of the Royal Society B, 361: 335-343.
Harrison CJ, Corley SB, Moylan EC, Alexander DL, Scotland RW, Langdale JA.
2005. Independent recruitment of a conserved developmental mechanism
during leaf evolution. Nature, 434: 509-514.
References
134
Hemsley AR, Collinson ME, Brain APR. 1992. Colloidal crystal-like structure of
sporopollenin in the megaspore walls of recent Selaginella and similar fossil
spores. Botanical Journal of Linnean Society, 108: 307-320.
Hemsley AR, Collinson ME, Kovach WL, Vincent B, Williams T. 1994. The role
of self-assembly in biological systems: evidence from iridescent colloidal
sporopollenin in Selaginella megaspore walls. Philosophical Transactions of
the Royal Society London, Series B, 345: 163-173.
Hemsley AR, Collinson ME, Vincent B, Griffiths PC, Jenkins PD. 2000. Self-
assembly of colloidal units in exine development. In: Harley MM, Morton
CM, Blackmore S, eds. Pollen and Spores: Morphology and Biology.
London: Royal Botanic Gardens, Kew, 31-44.
Hemsley AR, Lewis J, Griffiths PC. 2004. Soft and sticky development: some
underlying reasons for microarchitectural pattern convergence. Review of
Palaeobotany and Palynology, 130: 105-119.
Hemsley AR, Gabarayeva NI. 2007. Exine development: The importance of looking
through a colloidal chemistry “window”. Plant Systematics and Evolution,
263: 25-49.
Heslop-Harrison J. 1963. An ultrastructural study of pollen wall ontogeny in Silene
pendula. Grana Palynologica, 4: 7-24.
Heslop-Harrison J. 1968a. The pollen grain wall. Science, 161: 230-237.
Heslop-Harrison J. 1968b. Some fine structural features of intine growth in the
young microspore of Lilium henryi. Portugalie Acta Biologicae, 10: 235-246.
Heslop-Harrison J. 1972. Pattern in plant cell wall morphogenesis in miniature.
Proceedings of the Royal Institution of Great Britain, 45: 335-351.
Hess MW. 1993. Cell-wall development in freeze-fixed pollen: intine formation of
Ledebouria socialis (Hyacinthaceae). Planta, 189: 139-149.
Higginson T, Li SF, Parish RW. 2003. AtMYB103 regulates tapetum and trichome
development in Arabidopsis thaliana. Plant Journal, 35: 177-192.
Hill JP. 1996. Heterochrony in the anther. In: D'Arcy WG, Keating RC, eds. The
anther - form, function and phylogeny. Cambridge: Cambridge University
Press, 118-135.
Hird DL, Worrall D, Hodge R, Smartt S, Paul W, Scott R. 1993. The anther-
specific protein encoded by the Brassica napus and Arabidopsis thaliana A6
gene displays similarity to β-1,3-glucanase. The Plant Journal, 4: 1023-1033.

References
135
Hohe A, Rensing SA, Mildner M, Lang D, Reski R. 2002. Day length and
temperature strongly influence sexual reproduction and expression of a novel
MADS-box gene in the moss Physcomitrella patens. Plant Biology, 4: 595-
602.
Huang C, Chung C, Lin Y, Hsing YC, Huang AHC. 2009. Oil bodies and oleosins
in Physcomitrella possess characteristics representative of early trends in
evolution. Plant Physiology, 150: 1192-1203.
Huang M, Hsing YC, Huang AHC. 2011. Transcriptomes of the anther
sporopohyte: availability and uses. Plant and Cell Physiology, 52(9): 1459-
1466.
Huang WE, Li M, Jarvis RM, Goodacre R, Banwart SA. 2010. Shining light on
the microbial world: the application of Raman microspectroscopy. In: Laskin
AI, Sariaslani S, Gadd GM, eds. Advances in applied microbiology.
Burlington: Academic Press, 153-186.
Ito T, Nagata, N, Yoshiba Y, Ohme-takagi M, Ma H, Shinozaki K. 2007. Arabidopsis MALE STERILITY1 encodes a PHD-type transcription factor
and regulates pollen and tapetum development. The Plant Cell, 19: 3549-
3562.
Jones DT, Taylor WR, Thornton JM. 1992. The rapid generation of mutation data
matrices from protein sequences. Computer Applications in the Biosciences,
8: 275-282.
Jiang J, Zhang Z, Cao J. 2013. Pollen wall development: the associated enzymes
and metabolic pathways. Plant Biology, 15(2): 249-263.
Jones TM, Anderson AJ, Albersheim P. 1972. Hostpathogen interactions IV,
Studies on the polysaccharide-degrading enzymes secreted by Fusarium
oxysporum f. sp. lycopersici. Physiological Plant Pathology, 2: 153-166.
Jung KH, Han MJ, Lee DY, Lee YS, Schreiber L, Franke R, Faust A,
Yephremov A, Saedler H, Kim YW, et al. 2006. Wax-deficient anther1 is
involved in cuticle and wax production in rice anther walls and is required for
pollen development. Plant Cell, 18: 3015-3032.
Kafri R, Springer M, Pilpel Y. 2009. Genetic redundancy: new tricks for old genes.
Cell, 136: 389-392.
Kamisugi Y, Cuming AC, Cove DJ. 2005. Parameters determining the efficiency of
gene targeting in the moss Physcomitrella patens. Nucleic Acids Research,
33(19): e173.
Karve R, Liu W, Willet SG, Torii KU, Shpak ED. 2011. The presence of multiple
introns is essential for ERECTA expression in Arabidopsis. RNA,
doi:10.1261/ma.2825811.

References
136
Kasahara M, Hiwatashi Y, Ishikawa T, Suzuki Y, Kamisugi Y, Lang D, Cuming
AC, Reski R, Hasebe M, Nishiyama T. 2011. Genetic map of
Physcomitrella patens based on SNP identification with Illumina sequencing.
In Moss 2011 (Freiburg, Germany).
Kenrick P, Crane PR. 1997. The Origin and Early Diversification of Land Plants: A
Cladistic Study. Washington: Smithsonian Institution Press.
Kim SS, Grienenberger E, Lallemand B, Colpitts CC, Kim SY, Souza CD,
Geoffroy P, Henitz, D, Krahn D, Kaiser M, Kombrink E, Heitz T, Suh
DY, Legrand M, Douglas CJ. 2010. LAP6/POLYKETIDE SYNTHASE A
and LAP5/POLYKETIDE SYNTHASE B encode hydroxyalkyl alpha-
pyrone synthases required for pollen development and sporopollenin
biosynthesis in Arabidopsis thaliana. The Plant Cell, 22: 4045-4066.
Knight CD, Cuming AC, Quatrano RS. 2002. Moss gene technology. In: Gilmartin
PM, Bowler C, eds. Molecular Plant Biology. Oxford: Oxford University
Press, 285-299.
Krystyna Z. 1995. Ultrastructural features of secretory tapetum in the capsule of the
moss Ceratodon purpureus Hedw Brid. Phytomorphology, 45: 31-37.
Lallemand B, Erhardt M, Heitz T, Legrand M. 2013. Sporopollenin biosynthetic
enzymes interact and constitute a metabolon localized to the endoplasmic
reticulum of tapetum cells. Plant Physiology, doi:
http://dx.doi.org/10.1.4/pp112.213124.
Li H, Zhang DB. 2010. Biosynthesis of anther cuticle and pollen exine in rice. Plant
Signaling and Behavior, 5: 1121-1123.
Li J, Yu MA, Geng LL, Zhao J. 2010. The fasciclin-like arabinogalactan protein
gene, FLA3, is involved in microspore development of Arabidopsis. The Plant
Journal, 64: 482-497.
Li SF, Higginson T, Parish RW. 1999. A novel MYB-related gene from
Arabidopsis thaliana expressed in development anthers. Plant Cell
Physiology, 40: 343-347.
Lugardon B. 1990. Pteridophyte sporogenesis: a survey of spore wall ontogeny and
fine structure in a polyphyletic plant group. In: Blackmore S, Knox, RB, eds.
Microspores: Evolution and Ontogeny. London: Academic Press, 95-120.
Lugardon B. 1994. Exine formation in Chamaecyparis lawsoniana (Cupressaceae)
and a discussion on pteridophyte exospores and gymnosperm exine ontogeny.
Review of palaeobotany and palynology, 85: 35-51.
McClymont JW, Larson DA. 1964. An electron-microscope study of spore wall
structure in the Musci. American Journal of Botany, 51(2): 195-200.
References
137
Menand B, Yi K, Jouannic S, Hoffman L, Ryan E, Linstead P, Schaefer DG,
Dolan L. 2007. An ancient mechanism controls the development of cells with
a rooting function in land plants. Science, 316: 1477-1480.
Meuter-Gerhards A, Riegart S, Wiermann R. 1999. Studies on sporopollenin
biosynthesis in Curcurbita maxima (DUCH)-II: the involvement of aliphatic
metabolism. Journal of Plant Physiology, 154: 431-436.
Morant M, Bak S, Møller BL, Werck-Reichhart D. 2003. Plant cytochromes P450:
tools for pharmacology, plant protection and photoremediation. Current
Opinion in Biotechnology, 14: 1-12.
Morant M, Jørgensen K, Schaller H, Pinot F, Møller BL, Werck-Reichhart D,
Bak S. 2007. CYP703 is an ancient cytochrome P450 in land plants
catalyzing in-chain hydroxylation of lauric acid to provide building blocks for
sporopollenin synthesis in pollen. Plant Cell, 19: 1473-1487.
Morbelli MA. 1995. Megaspore wall in Lycophyta – ultrastructure and function.
Review of Palaeobotany and Palynology, 85: 1-12.
Nakosteen PC, Hughes KW. 1978. Sexual life cycle of three species of Funariaceae
in culture. The Bryologist, 81(2): 307-314.
Nei M, Kumar S. 2000. Molecular Evolution and Phylogenetics. New York: Oxford
University Press.
Nishikawa S, Zinkl GM, Swanson RJ, Maruyama D, Preuss D. 2005. Callose
(beta-1,3 glucan) is essential for Arabidopsis pollen wall patterning, but not
tube growth. BMC Plant Biology, 5: 22.
Nishiyama T, Fujita T, Shin-I T, Seki M, Nishide H, Uchiyama I, Kamiya A,
Carninci P, Hayashizaki Y, Shinozaki K, Kohara Y, Hasebe M. 2003. Comparative genomics of Physcomitrella patens gametophytic transcriptome
and Arabidopsis thaliana: implication for land plant evolution.
Proceedings of the National Academy of Sciences, 100 (13): 8007-8012.
Owen HA, Makaroff CA. 1995. Ultrastructure of microsporogenesis and
microgametogenesis in Arabidopsis thaliana (L.) Haynh. Ecotype
Wassilewskija (Brassicaceae). Protoplasma, 185: 7-21.
Pacini E, Franchi GG, Hesse M. 1985. The tapetum: Its form, function, and possible
phylogeny in Embryophyta. Plant Systematics and Evolution, 149(3): 155-
185.
Paxson-Sowders DM, Dodrill CH, Owen HA, Makaroff CA. 2001. DEX1, a novel
plant protein, is required for exine pattern formation during pollen
development in Arabidopsis. Plant Physiology, 127: 1739-1749.
Paxson-Sowders DM, Owen HA, Makaroff CA. 1997. A comparative
ultrastructural analysis of exine pattern development in wild-type Arabidopsis
and a mutant defective in pattern formation. Protoplasma, 198: 53-65.

References
138
Pelloux J, Rustérucci C, Mellerowicz EJ. 2007. New insights into pectin
methylesterase structure and function. Trends in Plant Science, 12(6): 267-
277.
Pérez-Muñoz CA, Jernstedt JA, Webster BD. 1993. Pollen wall development in
Vigna vexillata: II. Ultrastructural studies. American Journal of Botany,
80(10): 1193-1202.
Piffanelli P, Ross JHE, Murphy DJ. 1998. Biogenesis and function of the lipidic
structures of pollen grains. Sexual Plant reproduction, 11: 65-80.
Polevova SV. 2012. Sporoderm ultrastructure in Anthoceros agrestis Paton. Arctoa,
21: 63-69.
Pouteau S, Ferret V, Gaudin V, Lefebvre D, Sabar M, Zhao G, Prunus F. 2004. Extensive phenotypic variation in early flowering mutants of Arabidopsis.
Plant Physiology, 135: 201-211.
Preuss D, Rhee SY, Davis RW. 1994. Tetrad Analysis possible in Arabidopsis with
mutation of the QUARTET (QRT) genes. Science, 264: 1458-1460.
Prigg MJ, Bezanilla M. 2010. Evolutionary crossroads in developmental biology:
Physcomitrella patens. Development, 137: 3535-3543.
Puchta H. 2003. Towards the ideal GMP: Homologous recombination and marker
gene excision. Journal of Plant Physiology, 160: 743-754.
Quatrano RS, McDaniel SF, Khandelwal A, Perroud P, Cove, DJ. 2007. Physcomitrella patens: mosses enter the genomic age. Current Opinion in
Plant Biology, 10: 182-189.
Qui YL, Li LB, Wang B, Chen ZD, Knoop V, Groth-Malonek M, Dombrovska,
O, Lee J, Kent L, Rest J, Estabrook GF, Hendry TA, Taylor DW, Testa
CM, Ambros M, Crandall-Stotler B, Duff RJ, Stech M, Frey W, Quandt
D, Davis CC. 2006. The deepest divergences in land plants inferred from
phylogenomic evidence. Proceedings of the National Academy of Sciences of
the United States of America, 103: 15511-15516.
Quilichini TD, Friedmann MC, Samuels AL, Douglas, CJ. 2010. ATP-binding
cassette transporter G26 (ABCG26) is required for male fertility and pollen
exine formation in Arabidopsis thaliana. Plant Physiology, 154: 678-690.
Rensing SA, Ick J, Fawcett JA, Lang D, Zimmer A, Van De Peer Y, Reski R.
2007. An ancient genome duplication contribution to the abundance of
metabolic genes in the moss Physcomitrella patens. BMC Evolutionary
Biology, 7: 130.
Rensing SA, Lang D, Zimmer A, et al. 2008. The Physcomitrella genome reveals
evolutionary insights into the conquest of land by plants. Science, 319: 64-69.

References
139
Renzaglia KS, Duff RJ, Nickrent DL, Garbary DJ. 2000. Vegetative and
reproductive innovations of early land plants: implications for a unified
phylogeny. Philosophical Transactions of the Royal Society of London Series
B-Biological Sciences, 355: 769-793.
Reski R, Cove DJ. 2004. Physcomitrella patens. Current Biology, 14(7): 261-262.
Reski R, Frank W. 2005. Moss (Physcomitrella patens) functional genomics – gene
discovery and tool development, with implications for crop plants and human
health. Briefings in Functional Genomics and Proteomics, 4(1): 48-57.
Rhee SY, Osborne E, Poindexter PD, Somerville CR. 2003. Microspore separation
in the quartet 3 mutants of Arabidopsis is impaired by a defect in a
developmentally regulated polygalacturonase required for pollen mother cell
wall degradation. Plant Physiology, 133: 1170-1180.
Rhee SY, Somerville CR. 1998. Tetrad pollen formation in quartet mutants of
Arabidopsis thaliana is associated with persistence of pectic polysaccharides
of the pollen mother cell. The Plant Journal, 15(1): 79-88.
Roland F. 1971. Characterization and extraction of the polysaccharides of the intine
and of the generative cell wall in the pollen grains of some Ranunculaceae.
Grana, 11(2): 101-106.
Rowland O, Lee R, Franke R, Schreiber L, Kunst L. 2007. The CER3 wax
biosynthetic gene from Arabidopsis thaliana is allelic to WAX2/YRE/FLP1,
Federation of European Biochemical Societies Letters, 581: 3538-3544.
Ruszala EM, Beerling DJ, Franks PJ, Chater C, Casson SA, Gray JE,
Hetherington AM. 2011. Land plants acquired active stomatal control early
in their evolutionary history. Current biology, 21: 1030-1035.
Schaefer DG. 2002. A new moss genetics: targeted mutagenesis in Physcomitrella
patens. Annual Review of Plant Biology, 53: 477-501.
Schaefer DG, Zryd J. 1997. Efficient gene targeting in the moss Physcomitrella
patens. The Plant Journal, 11(6): 1195-1206.
Schaefer DG, Zrÿd J. 2001. The moss Physcomitrella patens, now and then. Plant
Physiology, 127: 1430-1438.
Schols HA, Voragen AGJ. 2002. The chemical structure of pectins. In: Seymour
GB, Knox PG, eds. Pectins and Their Manipulation. Boca Raton: CRC Press,
1-29.
Schuette S, Renzaglia KS, Duckett JG. 2006. Exploring the biology of the model
moss Physcomitrella patens: the forgotten frontier. In Botany 2006 (Chico,
USA).
References
140
Schuette S, Wood AJ, Geisler M, Geisler-Lee J, Ligrone R, Renzaglia KS. 2009. Novel localization of callose in the spores of Physcomitrella patens and
phylogenomics of the callose synthase gene family. Annals of Botany, 103(5):
749-756.
Scott RJ, Hodge R, Paul W, Draper J. 1991. The molecular biology of anther
differentiation. Plant Science, 80: 167-191.
Scott RJ, Spielman M, Dickinson HG. 2004. Stamen structure and function. Plant
Cell, 16: S46-S60.
Session A, Burke E, Presting G, Aux G, McElver J, Patton D, Dietrich B, Ho P,
Bacwaden J, Ko C et al. 2002. A high-throughput Arabidopsis reverse
genetics system. Plant Cell, 14: 2985-2994.
Shi J, Tan H, Yu X, Liu Y, Liang W, Ranathunge K, Franke RB, Schreiber L,
Wang Y, Kai G, Shanklin J, Ma H, Zhang D. 2011. Defective Pollen Wall
is required for anther and microspore development in rice and encodes a fatty
acyl carrier protein reductase. The Plant Cell, 23: 2225-2246.
Smyth GK. 2004. Linear models and empirical bayes methods for assessing
differential expression in microarray experiments. Statistical Applications in
Genetics and Molecular Biology, 3(1): Article 3.
Smyth GK. 2005. Limma: linear models for microarray data. In: Gentleman VCR,
Dudoit S, Irizarry R, Huber W, eds. Bioinformatics and computational biology
solutions using R and Bioconductor. New York: Springer, 397-420.
Stetler DA, DeMaggio AE. 1976. Ultrastructural characteristics of spore germination
in the moss Dawsonia superba. American Journal of Botany, 63(4): 438-442.
Stieglitz H, Stern H. 1973. Regulation of β-1,3-glucanase activity in developing
anthers of Lilium. Developmental Biology, 34: 169-173.
Suárez-Cervera M, Arcalís E, Le Thomas A, Seoane-Camba JA. 2002. Pectin
distribution pattern in the apertural intine of Euphorbia peplus L.
(Euphorbiaceae) pollen. Sexual Plant Reproduction, 14: 291-298.
Suzuki T, Masaoka K, Nishi M, Nakamura K, Ishiguro S. 2008. Identification of
kaonashi mutants showing abnormal pollen exine structure in Arabidopsis
thaliana. Plant and Cell Physiology, 49(10): 1465-1477.
Tamura K, Peterson D, Peterson N, Stecher G, Nei M, Kumar S. 2011. MEGA5:
molecular evolutionary genetics analysis using maximum likelihood,
evolutionary distance, and maximum parsimony methods. Molecular Biology
and Evolution, 28: 2731-2739.
Tan H, Liang W, Hu J, Zhang D. 2012. MTR1 encodes a secretory fasciclin
glycoprotein required for male reproductive development in rice.
Developmental Cell, 22: 1127-1137.

References
141
Taylor WA. 1986. Ultrastructure of sphenophyllalean spores. Review of
Palaeobotany and Palynology, 47: 105-128.
Tryon AF, Lugardon B. 1991. Spores of the Pteridophyta. Surface, wall structure
and diversity based on electron microscope studies. New York: Springer.
Tucker GA, Seymour GB. 2002. Modification and degradation of pectins. In:
Seymour GB, Knox PG, eds. Pectins and Their Manipulation. Boca Raton,
CRC Press, 150-173.
Uehara K, Kurita S. 1989. An ultrastructural study of spore wall morphogenesis in
Equisetum arvense. American Journal of Botany, 76: 939-951.
Uehara K, Kurita S. 1991. Ultrastructural study on spore wall morphogenesis in
Lycopodium clavatum (Lycopodiaceae). American Journal of Botany, 78(1):
24-36.
Uehara K, Kurita S, Sahashi N, Ohmoto T. 1991. Ultrastructural study of
microspore wall morphogenesis in Isoetes japonica (Isoetaceae). American
Journal of Botany, 78: 1182-1190.
Updegraff DM. 1969. Semimicro determination of cellulose in biological materials.
Analytical Biochemistry, 32(3): 420-424.
Villarreal JC, Renzaglia KS. 2006. Sporophyte structure in the neotropical hornwort
Phaeomegaceros fimbriatus: Implications for phylogeny, taxonomy, and
character evolution. International Journal of Plant science, 167(3): 413-427.
Vizcay-Barrena G, Wilson ZA. 2006. Altered tapetal PCD and pollen wall
development in the Arabidopsis ms1 mutant. Journal of Experimental Botany,
57(11): 2709-2717.
Waterkeyn L, Bienfait A. 1971. Morphologie et nature des parois sporocytaires chez
les pteridophytes. La Cellule, 69: 7-23.
Waters ER. 2003. Molecular adaptation and the origin of land plants. Molecular
Phylogenetics and Evolution, 29: 456-463.
Wellman CH. 2004. Origin, function and development of the spore wall in early land
plants. In: Hemsley AR, Poole I, eds. Evolution of plant physiology. London:
Royal Botanic Gardens, Kew, 43-63.
Wellman CH. 2009. Ultrastructure of dispersed and in situ specimens of the
Devonian spore Rhabdosporites langii (Eisenack) Richardson 1960: evidence
for the evolutionary relationships of Progymnosperms. Palaeontology, 52:
139-167.
Whelan S, Goldman N. 2001. A general empirical model of protein evolution
derived from multiple protein families using a maximum-likelihood approach.
Molecular Biology and Evolution, 18: 691-699.

References
142
Wilson ZA, Zhang D. 2009. From Arabidopsis to rice: pathways in pollen
development. Journal of Experimental Botany, 60(5): 1479-1492.
Yang C, Vizcay-Barrena G, Conner K, Wilson ZA. 2007. MALE STERILITY1 is
required for tapetal developmental and pollen wall biosynthesis. The Plant
Cell, 19: 3530-3548.
Yang ZN, Lou Y, Xu XF, Zhang C, Chang HS, Zhu J. 2012. Genetic pathways for
pollen wall formation in Arabidopsis. In IPC XIII/IOPC IX 2012 (Tokyo,
Japan).
Yi B, Zeng FQ, Lei SL, Chen YN, Yao XQ, Zhu Y, Wen J, Shen JX, Ma CZ, Tu
JX, Fu TD. 2010. Two duplicate CYP704B1-homologous genes BnMs1 and
BnMs2 are required for pollen exine formation and tapetal development in
Brassica napus. The Plant Journal, 63: 925-938.
Zavada MS. 1983. Comparative morphology of monocot pollen and evolutionary
trends of apertures and wall structures. Botanical Review, 49: 331-379.
Zavada MS, Gabarayeva N. 1991. Comparative pollen wall development of
Welwitschia mirabilis angiosperms. Bulletin of the Torrey Botanical Club,
118(3): 292-302.
Zhang DS, Liang WQ, Yin C, Zong J, Gu F, Zhang D. 2010. OsC6, encoding a
lipid transfer protein, is required for postmeiotic anther development in rice.
Plant Physiology, 154: 149-162.
Zhang Z, Zhu J, Gao J, Wang C, Li H, Li H, Zhang H, Zhang S, Wang D, Wang
Q, Huang H, Xia H, Yang Z. 2007. Transcription factor AtMYB103 is
required for anther development by regulating tapetum development, callose
dissolution and exine formation in Arabidopsis. The Plant Journal, 52: 528-
538
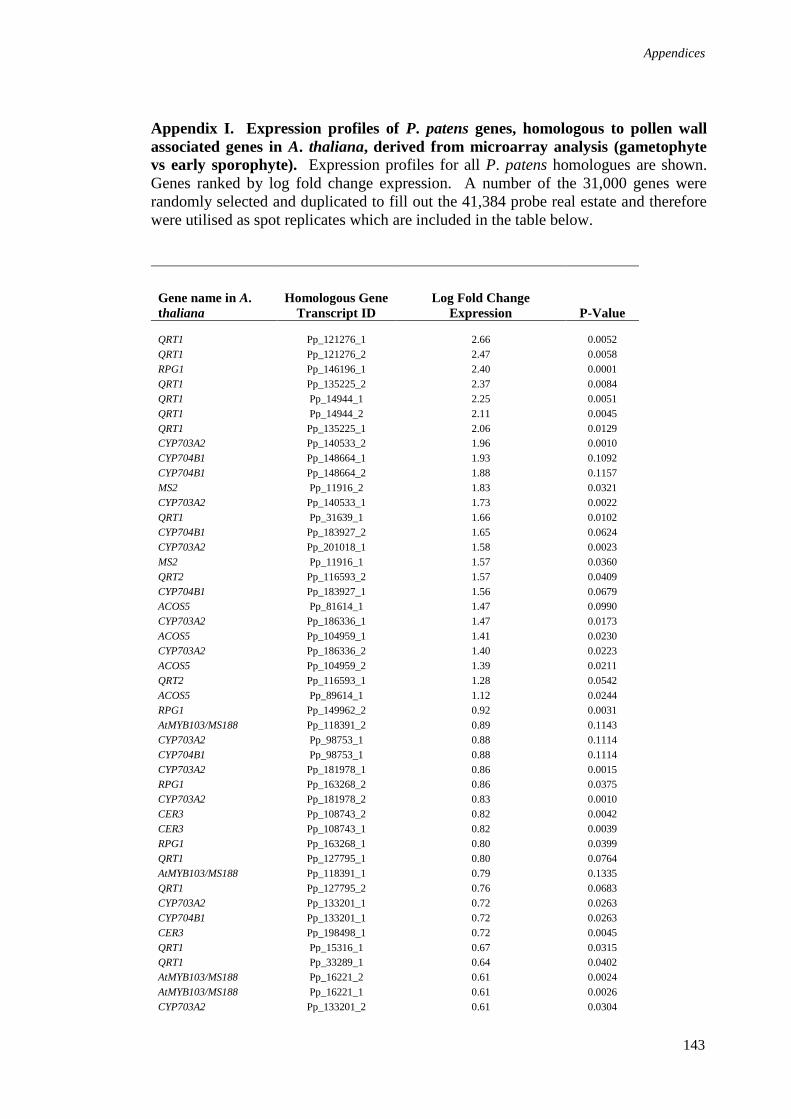
Appendices
143
Appendix I. Expression profiles of P. patens genes, homologous to pollen wall
associated genes in A. thaliana, derived from microarray analysis (gametophyte
vs early sporophyte). Expression profiles for all P. patens homologues are shown.
Genes ranked by log fold change expression. A number of the 31,000 genes were
randomly selected and duplicated to fill out the 41,384 probe real estate and therefore
were utilised as spot replicates which are included in the table below.
Gene name in A.
thaliana
Homologous Gene
Transcript ID
Log Fold Change
Expression P-Value
QRT1 Pp_121276_1 2.66 0.0052
QRT1 Pp_121276_2 2.47 0.0058
RPG1 Pp_146196_1 2.40 0.0001
QRT1 Pp_135225_2 2.37 0.0084
QRT1 Pp_14944_1 2.25 0.0051
QRT1 Pp_14944_2 2.11 0.0045
QRT1 Pp_135225_1 2.06 0.0129
CYP703A2 Pp_140533_2 1.96 0.0010
CYP704B1 Pp_148664_1 1.93 0.1092
CYP704B1 Pp_148664_2 1.88 0.1157
MS2 Pp_11916_2 1.83 0.0321
CYP703A2 Pp_140533_1 1.73 0.0022
QRT1 Pp_31639_1 1.66 0.0102
CYP704B1 Pp_183927_2 1.65 0.0624
CYP703A2 Pp_201018_1 1.58 0.0023
MS2 Pp_11916_1 1.57 0.0360
QRT2 Pp_116593_2 1.57 0.0409
CYP704B1 Pp_183927_1 1.56 0.0679
ACOS5 Pp_81614_1 1.47 0.0990
CYP703A2 Pp_186336_1 1.47 0.0173
ACOS5 Pp_104959_1 1.41 0.0230
CYP703A2 Pp_186336_2 1.40 0.0223
ACOS5 Pp_104959_2 1.39 0.0211
QRT2 Pp_116593_1 1.28 0.0542
ACOS5 Pp_89614_1 1.12 0.0244
RPG1 Pp_149962_2 0.92 0.0031
AtMYB103/MS188 Pp_118391_2 0.89 0.1143
CYP703A2 Pp_98753_1 0.88 0.1114
CYP704B1 Pp_98753_1 0.88 0.1114
CYP703A2 Pp_181978_1 0.86 0.0015
RPG1 Pp_163268_2 0.86 0.0375
CYP703A2 Pp_181978_2 0.83 0.0010
CER3 Pp_108743_2 0.82 0.0042
CER3 Pp_108743_1 0.82 0.0039
RPG1 Pp_163268_1 0.80 0.0399
QRT1 Pp_127795_1 0.80 0.0764
AtMYB103/MS188 Pp_118391_1 0.79 0.1335
QRT1 Pp_127795_2 0.76 0.0683
CYP703A2 Pp_133201_1 0.72 0.0263
CYP704B1 Pp_133201_1 0.72 0.0263
CER3 Pp_198498_1 0.72 0.0045
QRT1 Pp_15316_1 0.67 0.0315
QRT1 Pp_33289_1 0.64 0.0402
AtMYB103/MS188 Pp_16221_2 0.61 0.0024
AtMYB103/MS188 Pp_16221_1 0.61 0.0026
CYP703A2 Pp_133201_2 0.61 0.0304

Appendices
144
CYP704B1 Pp_133201_2 0.61 0.0304
QRT1 Pp_15316_2 0.59 0.0460
CYP703A2 Pp_167379_2 0.59 0.0260
CYP704B1 Pp_128150_1 0.59 0.0644
ACOS5 Pp_140413_2 0.57 0.1427
CYP703A2 Pp_167379_1 0.57 0.0425
ACOS5 Pp_140413_1 0.53 0.1433
CYP704B1 Pp_128150_2 0.51 0.0793
CYP704B1 Pp_151187_1 0.47 0.0193
CYP704B1 Pp_151187_2 0.46 0.0240
TDE1/DET2 Pp_151601_2 0.44 0.0029
CYP703A2 Pp_220794_1 0.44 0.1110
CYP704B1 Pp_220794_1 0.44 0.1110
A6 Pp_99807_1 0.39 0.0958
TDE1/DET2 Pp_151601_1 0.38 0.0025
AtbZIP34 Pp_176895_1 0.37 0.0251
QRT1 Pp_44526_1 0.34 0.0722
NEF1 Pp_121066_1 0.34 0.1431
AtbZIP34 Pp_176895_2 0.34 0.0406
QRT1 Pp_16387_1 0.33 0.0431
QRT1 Pp_33184_1 0.32 0.0047
DEX1 Pp_172150_2 0.32 0.0095
CYP703A2 Pp_31920_1 0.31 0.0032
NEF1 Pp_121066_2 0.31 0.0337
MS1 Pp_148091_1 0.30 0.0100
AtbZIP34 Pp_162038_2 0.30 0.0262
A6 Pp_150189_2 0.30 0.0133
DEX1 Pp_172150_1 0.29 0.0092
AtbZIP34 Pp_162038_1 0.29 0.0232
CALS5/LAP1 Pp_143195_2 0.28 0.0481
CYP704B1 Pp_197900_1 0.28 0.0053
CYP703A2 Pp_31879_1 0.27 0.0191
CYP704B1 Pp_31879_1 0.27 0.0191
CYP703A2 Pp_152476_1 0.26 0.0606
CALS5/LAP1 Pp_143195_1 0.26 0.0424
QRT1 Pp_16387_2 0.26 0.0700
A6 Pp_150189_1 0.24 0.0443
CYP703A2 Pp_165869_2 0.24 0.0099
QRT2 Pp_149319_1 0.24 0.0444
AtbZIP34 Pp_45185_1 0.22 0.0063
CALS5/LAP1 Pp_190367_2 0.22 0.0142
CYP703A2 Pp_152476_2 0.22 0.0752
CYP703A2 Pp_165869_1 0.21 0.0239
CALS5/LAP1 Pp_139798_1 0.20 0.0033
CALS5/LAP1 Pp_190367_1 0.20 0.0201
QRT2 Pp_149319_2 0.20 0.0444
MS1 Pp_148091_2 0.20 0.0466
MS1 Pp_150355_2 0.19 0.0528
AtMYB103/MS188 Pp_8347_1 0.19 0.0482
CYP703A2 Pp_151293_2 0.19 0.1110
CYP704B1 Pp_151293_2 0.19 0.1110
MS1 Pp_150355_1 0.19 0.0564
CYP703A2 Pp_151293_1 0.18 0.0675
CYP704B1 Pp_151293_1 0.18 0.0675
QRT1 Pp_24242_1 0.18 0.0772
AtbZIP34 Pp_160508_2 0.18 0.1903
AtbZIP34 Pp_160508_1 0.18 0.1326
A6 Pp_214139_1 0.18 0.0959
CYP703A2 Pp_64513_1 0.17 0.0656
CYP704B1 Pp_64513_1 0.17 0.0656
KNS2 Pp_197679_1 0.17 0.0207
CER3 Pp_199329_1 0.17 0.0115
ACOS5 Pp_117032_2 0.17 0.3605

Appendices
145
QRT2 Pp_199574_1 0.17 0.0978
CALS5/LAP1 Pp_199665_1 0.16 0.0732
CALS5/LAP1 Pp_139798_2 0.15 0.0091
CYP704B1 Pp_149913_1 0.15 0.0170
AtbZIP34 Pp_171242_2 0.15 0.0968
CALS5/LAP1 Pp_117054_1 0.15 0.0394
A6 Pp_60798_1 0.14 0.0207
ACOS5 Pp_117032_1 0.14 0.3257
QRT3 Pp_227125_1 0.14 0.0549
ACOS5 Pp_192148_1 0.14 0.1113
CYP704B1 Pp_139286_2 0.13 0.0486
CYP704B1 Pp_139286_1 0.13 0.1093
CALS5/LAP1 Pp_185944_2 0.12 0.3377
QRT1 Pp_145419_1 0.12 0.2801
A6 Pp_75622_1 0.12 0.1487
AtbZIP34 Pp_171242_1 0.11 0.2751
CALS5/LAP1 Pp_117054_2 0.11 0.1732
CYP704B1 Pp_119258_1 0.11 0.3154
CALS5/LAP1 Pp_185944_1 0.11 0.3956
QRT1 Pp_145419_2 0.11 0.2994
AtMYB103/MS188 Pp_8874_1 0.11 0.3123
QRT2 Pp_43415_1 0.10 0.3054
KNS2 Pp_186437_1 0.10 0.1208
CYP703A2 Pp_120688_2 0.10 0.0713
CYP703A2 Pp_120688_1 0.10 0.0614
RPG1 Pp_146546_2 0.10 0.0506
A6 Pp_19653_1 0.10 0.3368
TDE1/DET2 Pp_119780_2 0.10 0.0277
QRT2 Pp_163808_1 0.10 0.0495
QRT2 Pp_163808_2 0.10 0.0977
CYP704B1 Pp_149913_2 0.10 0.0898
CYP703A2 Pp_111667_1 0.09 0.0899
TDE1/DET2 Pp_166483_2 0.09 0.0819
KNS2 Pp_216637_1 0.08 0.2985
CALS5/LAP1 Pp_127776_2 0.08 0.0804
CALS5/LAP1 Pp_127776_1 0.08 0.1992
CYP704B1 Pp_119258_2 0.08 0.4065
A6 Pp_19653_2 0.08 0.3861
AtMYB103/MS188 Pp_150459_1 0.07 0.1933
QRT2 Pp_133517_1 0.07 0.1955
ACOS5 Pp_174501_2 0.07 0.2298
A6 Pp_25096_1 0.07 0.2124
AtMYB103/MS188 Pp_150459_2 0.07 0.2810
QRT3 Pp_198113_1 0.07 0.5625
ACOS5 Pp_192148_2 0.07 0.4863
TDE1/DET2 Pp_119780_1 0.06 0.1320
QRT2 Pp_133517_2 0.06 0.3832
CYP704B1 Pp_182724_1 0.06 0.1340
AtbZIP34 Pp_64165_1 0.06 0.3300
RPG1 Pp_146546_1 0.06 0.2038
AtbZIP34 Pp_201072_1 0.06 0.2115
QRT1 Pp_150987_1 0.06 0.2204
ACOS5 Pp_113172_1 0.06 0.3184
CYP703A2 Pp_110612_2 0.06 0.6475
CYP704B1 Pp_110612_2 0.06 0.6475
CYP704B1 Pp_182724_2 0.05 0.2491
CYP703A2 Pp_110612_1 0.05 0.6534
CYP704B1 Pp_110612_1 0.05 0.6534
AtMYB103/MS188 Pp_173907_2 0.05 0.6679
CYP703A2 Pp_167047_1 0.05 0.5366
CYP703A2 Pp_138465_2 0.04 0.4768
AtMYB103/MS188 Pp_135480_1 0.04 0.3822
ACOS5 Pp_122015_1 0.04 0.3758

Appendices
146
ACOS5 Pp_174501_1 0.04 0.5066
AtbZIP34 Pp_64750_1 0.04 0.6003
CYP703A2 Pp_148103_2 0.04 0.5848
CYP704B1 Pp_148103_2 0.04 0.5848
AtMYB103/MS188 Pp_135480_2 0.04 0.4319
A6 Pp_105138_2 0.04 0.6471
AtbZIP34 Pp_163915_1 0.04 0.5360
AtMYB103/MS188 Pp_143587_2 0.04 0.4412
AtMYB103/MS188 Pp_143587_1 0.03 0.5934
QRT1 Pp_31656_1 0.03 0.5985
KNS2 Pp_210965_1 0.03 0.5089
CYP703A2 Pp_219188_1 0.03 0.4330
QRT1 Pp_94470_1 0.03 0.5350
ACOS5 Pp_113172_2 0.03 0.5936
ACOS5 Pp_122015_2 0.03 0.6083
CYP703A2 Pp_149501_2 0.03 0.6946
AtMYB103/MS188 Pp_173907_1 0.03 0.8254
A6 Pp_105138_1 0.02 0.7231
KNS2 Pp_186437_2 0.02 0.7239
A6 Pp_61200_1 0.02 0.5946
A6 Pp_65557_1 0.02 0.6386
QRT2 Pp_176513_2 0.02 0.8058
CYP703A2 Pp_167047_2 0.02 0.8350
QRT2 Pp_176513_1 0.02 0.8631
CYP703A2 Pp_148103_1 0.02 0.7747
CYP704B1 Pp_148103_1 0.02 0.7747
AtbZIP34 Pp_163915_2 0.02 0.8694
CYP703A2 Pp_204665_1 0.01 0.9220
CYP703A2 Pp_149501_1 0.01 0.8676
A6 Pp_189861_1 0.01 0.8056
CYP703A2 Pp_32062_1 0.01 0.7968
CYP703A2 Pp_111667_2 0.01 0.8134
AtMYB103/MS188 Pp_61394_1 0.01 0.8849
ACOS5 Pp_150981_2 0.01 0.9256
CYP703A2 Pp_138465_1 0.00 0.9492
TDE1/DET2 Pp_166483_1 0.00 0.9464
AtMYB103/MS188 Pp_126855_2 0.00 0.9628
CYP703A2 Pp_50846_1 0.00 0.9854
CYP703A2 Pp_189599_2 0.00 0.9771
AtMYB103/MS188 Pp_89855_1 0.00 0.9964
QRT1 Pp_118762_1 0.00 0.9744
RPG1 Pp_136254_2 0.00 0.9395
AtMYB103/MS188 Pp_153206_2 -0.01 0.9121
ACOS5 Pp_115006_2 -0.01 0.9021
QRT1 Pp_174093_2 -0.01 0.9340
CYP703A2 Pp_189599_1 -0.01 0.8790
QRT1 Pp_103704_1 -0.01 0.9561
QRT1 Pp_135307_2 -0.01 0.9474
ACOS5 Pp_233094_1 -0.01 0.8050
QRT1 Pp_118762_2 -0.01 0.8926
AtMYB103/MS188 Pp_148816_2 -0.01 0.7681
A6 Pp_189861_2 -0.01 0.7251
QRT1 Pp_134522_2 -0.02 0.8400
CYP703A2 Pp_200880_1 -0.02 0.7520
A6 Pp_56975_1 -0.02 0.8140
AtMYB103/MS188 Pp_34929_1 -0.02 0.7297
A6 Pp_167530_1 -0.02 0.8176
QRT1 Pp_174093_1 -0.02 0.8144
CYP703A2 Pp_133330_2 -0.02 0.6519
AtMYB103/MS188 Pp_123689_1 -0.02 0.7510
ACOS5 Pp_122068_2 -0.02 0.6137
QRT2 Pp_160263_1 -0.02 0.5864
AtMYB103/MS188 Pp_121437_1 -0.02 0.8544

Appendices
147
ACOS5 Pp_150981_1 -0.02 0.7998
AtMYB103/MS188 Pp_153206_1 -0.02 0.6248
QRT1 Pp_152977_1 -0.02 0.8767
ACOS5 Pp_122068_1 -0.02 0.6049
CYP703A2 Pp_140101_2 -0.03 0.8024
CYP704B1 Pp_140101_2 -0.03 0.8024
CYP703A2 Pp_133330_1 -0.03 0.6200
A6 Pp_131016_1 -0.03 0.5836
A6 Pp_175736_2 -0.03 0.5382
CYP703A2 Pp_147541_2 -0.03 0.5915
AtMYB103/MS188 Pp_189472_2 -0.03 0.5432
A6 Pp_131016_2 -0.03 0.5506
QRT2 Pp_160263_2 -0.03 0.4995
A6 Pp_160804_1 -0.03 0.8314
A6 Pp_163193_2 -0.03 0.6318
CYP704B1 Pp_180507_2 -0.03 0.8017
QRT1 Pp_135307_1 -0.03 0.8278
QRT2 Pp_22776_1 -0.03 0.6805
ACOS5 Pp_152177_1 -0.03 0.5851
CYP703A2 Pp_140101_1 -0.03 0.7227
CYP704B1 Pp_140101_1 -0.03 0.7227
CYP703A2 Pp_147541_1 -0.03 0.4135
A6 Pp_175736_1 -0.03 0.4610
A6 Pp_160804_2 -0.03 0.8026
CYP703A2 Pp_106848_2 -0.03 0.4911
CYP704B1 Pp_106848_2 -0.03 0.4911
QRT1 Pp_103704_2 -0.04 0.7772
AtMYB103/MS188 Pp_189472_1 -0.04 0.5877
CALS5/LAP1 Pp_183682_2 -0.04 0.4666
CYP703A2 Pp_64909_1 -0.04 0.6796
CYP703A2 Pp_87503_1 -0.04 0.5291
QRT1 Pp_132301_1 -0.04 0.5682
QRT1 Pp_189145_2 -0.04 0.5582
ACOS5 Pp_115006_1 -0.04 0.4264
QRT1 Pp_189145_1 -0.04 0.4748
AtMYB103/MS188 Pp_126855_1 -0.04 0.4013
QRT1 Pp_121267_1 -0.04 0.6483
A6 Pp_147889_1 -0.04 0.4090
A6 Pp_163193_1 -0.04 0.4637
AtbZIP34 Pp_159871_2 -0.04 0.4696
A6 Pp_147889_2 -0.04 0.3737
CALS5/LAP1 Pp_175718_2 -0.05 0.4980
QRT1 Pp_134522_1 -0.05 0.5253
CER3 Pp_177243_2 -0.05 0.3710
A6 Pp_167530_2 -0.05 0.4489
CYP704B1 Pp_195286_2 -0.05 0.3010
CYP703A2 Pp_139150_1 -0.05 0.6112
QRT1 Pp_44780_1 -0.05 0.4767
NEF1 Pp_230745_1 -0.06 0.5766
QRT1 Pp_152977_2 -0.06 0.6512
ACOS5 Pp_152177_2 -0.06 0.4048
CYP703A2 Pp_106848_1 -0.06 0.3837
CYP704B1 Pp_106848_1 -0.06 0.3837
CALS5/LAP1 Pp_183682_1 -0.06 0.2126
A6 Pp_172885_2 -0.06 0.3501
ACOS5 Pp_124849_2 -0.06 0.3915
AtbZIP34 Pp_159871_1 -0.06 0.2711
ACOS5 Pp_124849_1 -0.06 0.3255
CYP703A2 Pp_110816_2 -0.06 0.1962
CYP704B1 Pp_110816_2 -0.06 0.1962
A6 Pp_110742_2 -0.07 0.2756
AtMYB103/MS188 Pp_123689_2 -0.07 0.2980
CYP703A2 Pp_139150_2 -0.07 0.6035
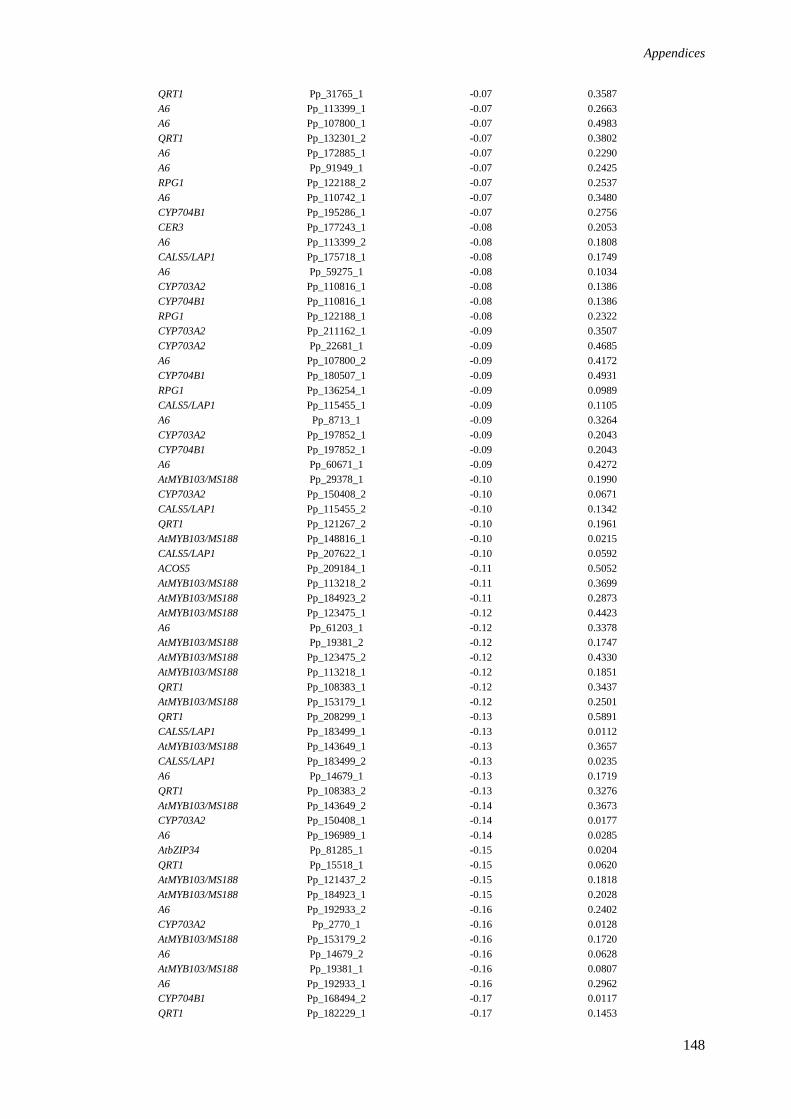
Appendices
148
QRT1 Pp_31765_1 -0.07 0.3587
A6 Pp_113399_1 -0.07 0.2663
A6 Pp_107800_1 -0.07 0.4983
QRT1 Pp_132301_2 -0.07 0.3802
A6 Pp_172885_1 -0.07 0.2290
A6 Pp_91949_1 -0.07 0.2425
RPG1 Pp_122188_2 -0.07 0.2537
A6 Pp_110742_1 -0.07 0.3480
CYP704B1 Pp_195286_1 -0.07 0.2756
CER3 Pp_177243_1 -0.08 0.2053
A6 Pp_113399_2 -0.08 0.1808
CALS5/LAP1 Pp_175718_1 -0.08 0.1749
A6 Pp_59275_1 -0.08 0.1034
CYP703A2 Pp_110816_1 -0.08 0.1386
CYP704B1 Pp_110816_1 -0.08 0.1386
RPG1 Pp_122188_1 -0.08 0.2322
CYP703A2 Pp_211162_1 -0.09 0.3507
CYP703A2 Pp_22681_1 -0.09 0.4685
A6 Pp_107800_2 -0.09 0.4172
CYP704B1 Pp_180507_1 -0.09 0.4931
RPG1 Pp_136254_1 -0.09 0.0989
CALS5/LAP1 Pp_115455_1 -0.09 0.1105
A6 Pp_8713_1 -0.09 0.3264
CYP703A2 Pp_197852_1 -0.09 0.2043
CYP704B1 Pp_197852_1 -0.09 0.2043
A6 Pp_60671_1 -0.09 0.4272
AtMYB103/MS188 Pp_29378_1 -0.10 0.1990
CYP703A2 Pp_150408_2 -0.10 0.0671
CALS5/LAP1 Pp_115455_2 -0.10 0.1342
QRT1 Pp_121267_2 -0.10 0.1961
AtMYB103/MS188 Pp_148816_1 -0.10 0.0215
CALS5/LAP1 Pp_207622_1 -0.10 0.0592
ACOS5 Pp_209184_1 -0.11 0.5052
AtMYB103/MS188 Pp_113218_2 -0.11 0.3699
AtMYB103/MS188 Pp_184923_2 -0.11 0.2873
AtMYB103/MS188 Pp_123475_1 -0.12 0.4423
A6 Pp_61203_1 -0.12 0.3378
AtMYB103/MS188 Pp_19381_2 -0.12 0.1747
AtMYB103/MS188 Pp_123475_2 -0.12 0.4330
AtMYB103/MS188 Pp_113218_1 -0.12 0.1851
QRT1 Pp_108383_1 -0.12 0.3437
AtMYB103/MS188 Pp_153179_1 -0.12 0.2501
QRT1 Pp_208299_1 -0.13 0.5891
CALS5/LAP1 Pp_183499_1 -0.13 0.0112
AtMYB103/MS188 Pp_143649_1 -0.13 0.3657
CALS5/LAP1 Pp_183499_2 -0.13 0.0235
A6 Pp_14679_1 -0.13 0.1719
QRT1 Pp_108383_2 -0.13 0.3276
AtMYB103/MS188 Pp_143649_2 -0.14 0.3673
CYP703A2 Pp_150408_1 -0.14 0.0177
A6 Pp_196989_1 -0.14 0.0285
AtbZIP34 Pp_81285_1 -0.15 0.0204
QRT1 Pp_15518_1 -0.15 0.0620
AtMYB103/MS188 Pp_121437_2 -0.15 0.1818
AtMYB103/MS188 Pp_184923_1 -0.15 0.2028
A6 Pp_192933_2 -0.16 0.2402
CYP703A2 Pp_2770_1 -0.16 0.0128
AtMYB103/MS188 Pp_153179_2 -0.16 0.1720
A6 Pp_14679_2 -0.16 0.0628
AtMYB103/MS188 Pp_19381_1 -0.16 0.0807
A6 Pp_192933_1 -0.16 0.2962
CYP704B1 Pp_168494_2 -0.17 0.0117
QRT1 Pp_182229_1 -0.17 0.1453

Appendices
149
KNS2 Pp_119166_1 -0.17 0.1184
QRT1 Pp_187864_1 -0.18 0.1390
QRT2 Pp_193100_2 -0.18 0.1153
QRT1 Pp_232357_1 -0.18 0.0932
QRT1 Pp_182229_2 -0.18 0.1517
CYP703A2 Pp_115760_1 -0.19 0.0666
CYP704B1 Pp_115760_1 -0.19 0.0666
CYP703A2 Pp_115760_2 -0.19 0.0831
CYP704B1 Pp_115760_2 -0.19 0.0831
KNS2 Pp_119166_2 -0.19 0.0876
QRT1 Pp_187864_2 -0.19 0.1303
A6 Pp_90481_1 -0.19 0.0112
AtMYB103/MS188 Pp_100368_2 -0.20 0.0618
A6 Pp_196989_2 -0.20 0.0189
A6 Pp_218702_1 -0.20 0.0133
QRT1 Pp_190734_2 -0.20 0.0048
CYP704B1 Pp_177185_1 -0.21 0.0023
AtMYB103/MS188 Pp_111064_1 -0.22 0.0196
AtMYB103/MS188 Pp_111064_2 -0.22 0.0128
AtMYB103/MS188 Pp_100368_1 -0.22 0.0477
CYP704B1 Pp_177185_2 -0.22 0.0030
QRT1 Pp_58226_1 -0.22 0.0011
CYP704B1 Pp_168494_1 -0.23 0.0012
A6 Pp_122478_1 -0.23 0.0016
A6 Pp_54237_1 -0.23 0.1052
QRT1 Pp_190734_1 -0.24 0.0016
KNS2 Pp_188513_2 -0.25 0.0405
CYP703A2 Pp_188189_1 -0.27 0.0026
CYP704B1 Pp_188189_1 -0.27 0.0026
A6 Pp_122478_2 -0.27 0.0089
QRT1 Pp_15518_2 -0.28 0.0028
KNS2 Pp_188513_1 -0.28 0.0054
CYP703A2 Pp_63679_1 -0.30 0.0486
QRT2 Pp_13931_2 -0.31 0.0115
QRT1 Pp_138756_1 -0.33 0.0419
CYP703A2 Pp_188189_2 -0.33 0.0009
CYP704B1 Pp_188189_2 -0.33 0.0009
AtMYB103/MS188 Pp_27442_1 -0.33 0.0470
AtMYB103/MS188 Pp_8210_1 -0.33 0.0117
QRT1 Pp_121141_1 -0.33 0.0056
QRT1 Pp_152856_1 -0.34 0.0021
CYP704B1 Pp_105982_2 -0.34 0.0120
QRT1 Pp_152856_2 -0.35 0.0035
CYP703A2 Pp_149034_1 -0.35 0.0054
CYP704B1 Pp_149034_1 -0.35 0.0054
A6 Pp_8710_1 -0.36 0.0072
CYP704B1 Pp_105982_1 -0.36 0.0053
QRT1 Pp_121141_2 -0.38 0.0049
AtbZIP34 Pp_128606_2 -0.38 0.0002
QRT2 Pp_193100_1 -0.39 0.0145
QRT1 Pp_138756_2 -0.40 0.0309
CYP703A2 Pp_149034_2 -0.41 0.0025
CYP704B1 Pp_149034_2 -0.41 0.0025
QRT1 Pp_45683_1 -0.43 0.0327
AtbZIP34 Pp_128606_1 -0.44 0.0003
QRT2 Pp_13931_1 -0.52 0.0017
CYP704B1 Pp_116547_1 -0.55 0.0011
CYP704B1 Pp_116547_2 -0.57 0.0005
CYP703A2 Pp_172320_2 -0.57 0.0004
QRT1 Pp_79815_1 -0.58 0.0011
CYP703A2 Pp_172320_1 -0.59 0.0004
ACOS5 Pp_92121_1 -0.65 0.0001
TDE1/DET2 Pp_181942_1 -0.70 0.0005

Appendices
150
TDE1/DET2 Pp_181942_2 -0.71 0.0013
QRT1 Pp_145945_1 -0.87 0.0002
QRT1 Pp_145945_2 -0.97 0.0002
CYP703A2 Pp_102043_1 -1.10 0.0003
CYP703A2 Pp_102043_2 -1.13 0.0003
QRT1 Pp_4364_1 -1.40 0.0000
QRT1 Pp_15580_2 -1.74 0.0001
QRT1 Pp_15580_1 -1.83 0.0001
QRT1 Pp_222560_1 -1.92 0.0001
QRT1 Pp_155350_1 -2.13 0.0001
QRT1 Pp_155350_2 -2.22 0.0001
Appendix II. Expression profiles of P. patens genes, homologous to pollen wall
associated genes in A. thaliana, derived from microarray analysis (gametophyte
vs mid sporophyte). Expression profiles for all P. patens homologues are shown.
Genes ranked by log fold change expression. A number of the 31,000 genes were
randomly selected and duplicated to fill out the 41,384 probe real estate and therefore
were utilised as spot replicates which are included in the table below.
Gene name in A.
thaliana
Homologous Gene
Transcript ID
Log Fold Change
Expression P-Value
RPG1 Pp_146196_1 3.40 2.67E-05
RPG1 Pp_146196_2 3.22 3.51E-05
QRT1 Pp_121276_1 3.05 0.0016
QRT1 Pp_121276_2 2.84 0.0018
QRT1 Pp_135225_2 2.63 0.0017
QRT1 Pp_14944_1 2.57 0.0016
QRT1 Pp_14944_2 2.43 0.0018
QRT1 Pp_135225_1 2.27 0.0028
CYP703A2 Pp_140533_2 2.17 0.0001
CYP704B1 Pp_148664_1 1.97 0.0898
CYP704B1 Pp_148664_2 1.91 0.0937
CYP703A2 Pp_140533_1 1.91 0.0003
QRT1 Pp_31639_1 1.90 0.0030
QRT2 Pp_116593_2 1.84 0.0178
RPG1 Pp_163268_2 1.81 0.0017
CYP703A2 Pp_201018_1 1.74 0.0004
CYP704B1 Pp_183927_2 1.72 0.0409
RPG1 Pp_163268_1 1.71 0.0018
CYP703A2 Pp_186336_1 1.62 0.0043
CYP704B1 Pp_183927_1 1.61 0.0458
CYP703A2 Pp_186336_2 1.54 0.0061
ACOS5 Pp_104959_1 1.53 0.0071
MS2 Pp_11916_2 1.52 0.0662
ACOS5 Pp_104959_2 1.51 0.0062
QRT2 Pp_116593_1 1.50 0.0237
ACOS5 Pp_81614_1 1.50 0.0830
RPG1 Pp_149962_1 1.36 0.0012
RPG1 Pp_149962_2 1.31 0.0007
MS2 Pp_11916_1 1.30 0.0730
ACOS5 Pp_89614_1 1.20 0.0109
CYP703A2 Pp_181978_1 0.97 0.0003

Appendices
151
CYP703A2 Pp_181978_2 0.93 0.0003
AtMYB103/MS188 Pp_118391_2 0.91 0.0893
CYP703A2 Pp_98753_1 0.89 0.0957
CYP704B1 Pp_98753_1 0.89 0.0957
QRT1 Pp_127795_1 0.84 0.0409
AtMYB103/MS188 Pp_118391_1 0.80 0.1041
QRT1 Pp_127795_2 0.80 0.0346
CYP703A2 Pp_133201_1 0.77 0.0134
CYP704B1 Pp_133201_1 0.77 0.0134
CYP703A2 Pp_167379_2 0.72 0.0207
QRT1 Pp_15316_1 0.71 0.0145
CYP703A2 Pp_167379_1 0.69 0.0325
QRT1 Pp_33289_1 0.67 0.0270
AtMYB103/MS188 Pp_16221_2 0.67 0.0007
AtMYB103/MS188 Pp_16221_1 0.67 0.0007
CYP703A2 Pp_133201_2 0.64 0.0167
CYP704B1 Pp_133201_2 0.64 0.0167
QRT1 Pp_15316_2 0.62 0.0259
CYP704B1 Pp_128150_1 0.62 0.0355
ACOS5 Pp_140413_2 0.58 0.1146
ACOS5 Pp_140413_1 0.54 0.1135
CYP704B1 Pp_128150_2 0.53 0.0456
CYP704B1 Pp_151187_1 0.50 0.0080
CYP704B1 Pp_151187_2 0.49 0.0112
CYP703A2 Pp_220794_1 0.46 0.0743
CYP704B1 Pp_220794_1 0.46 0.0743
NEF1 Pp_121066_1 0.41 0.0912
QRT1 Pp_16387_1 0.40 0.0352
A6 Pp_99807_1 0.40 0.0691
AtbZIP34 Pp_176895_1 0.39 0.0135
QRT1 Pp_33184_1 0.38 0.0046
AtbZIP34 Pp_176895_2 0.36 0.0241
QRT1 Pp_44526_1 0.36 0.0566
KNS2 Pp_197679_1 0.35 0.0009
CYP703A2 Pp_31920_1 0.34 0.0007
AtbZIP34 Pp_162038_2 0.33 0.0094
A6 Pp_150189_2 0.33 0.0042
AtbZIP34 Pp_162038_1 0.31 0.0079
CYP704B1 Pp_197900_1 0.31 0.0025
QRT1 Pp_16387_2 0.31 0.0538
CYP703A2 Pp_31879_1 0.30 0.0057
CYP704B1 Pp_31879_1 0.30 0.0057
CALS5/LAP1 Pp_143195_2 0.30 0.0311
TDE1/DET2 Pp_151601_2 0.29 0.0197
CALS5/LAP1 Pp_143195_1 0.28 0.0291
CYP703A2 Pp_165869_2 0.28 0.0061
TDE1/DET2 Pp_151601_1 0.28 0.0118
CER3 Pp_199329_1 0.27 0.0014
CYP703A2 Pp_152476_1 0.27 0.0436
DEX1 Pp_172150_1 0.27 0.0145
A6 Pp_150189_1 0.26 0.0247
QRT2 Pp_149319_1 0.25 0.0193
AtbZIP34 Pp_45185_1 0.25 0.0013
DEX1 Pp_172150_2 0.25 0.0316
NEF1 Pp_121066_2 0.24 0.0830
CYP703A2 Pp_165869_1 0.24 0.0150
CALS5/LAP1 Pp_190367_2 0.24 0.0064
CYP703A2 Pp_151293_2 0.23 0.0609
CYP704B1 Pp_151293_2 0.23 0.0609
CYP703A2 Pp_152476_2 0.23 0.0581
CALS5/LAP1 Pp_139798_1 0.22 0.0012

Appendices
152
CALS5/LAP1 Pp_190367_1 0.22 0.0107
CYP703A2 Pp_151293_1 0.21 0.0346
CYP704B1 Pp_151293_1 0.21 0.0346
AtMYB103/MS188 Pp_8347_1 0.21 0.0305
QRT2 Pp_149319_2 0.21 0.0221
MS2 Pp_120173_2 0.21 0.3410
CYP703A2 Pp_64513_1 0.21 0.0661
CYP704B1 Pp_64513_1 0.21 0.0661
A6 Pp_214139_1 0.19 0.0482
AtbZIP34 Pp_160508_1 0.18 0.0968
QRT1 Pp_24242_1 0.18 0.0594
AtbZIP34 Pp_160508_2 0.18 0.1424
MS2 Pp_120173_1 0.18 0.4064
ACOS5 Pp_117032_2 0.18 0.3049
QRT2 Pp_199574_1 0.18 0.0735
CYP704B1 Pp_149913_1 0.17 0.0081
CALS5/LAP1 Pp_139798_2 0.17 0.0030
CALS5/LAP1 Pp_199665_1 0.17 0.0310
QRT3 Pp_227125_1 0.17 0.0447
A6 Pp_60798_1 0.16 0.0087
CALS5/LAP1 Pp_117054_1 0.16 0.0182
AtbZIP34 Pp_171242_2 0.16 0.0491
ACOS5 Pp_117032_1 0.16 0.2754
TDE1/DET2 Pp_166483_2 0.15 0.0121
CER3 Pp_108743_1 0.15 0.4902
CER3 Pp_108743_2 0.15 0.5074
CYP704B1 Pp_139286_2 0.14 0.0422
ACOS5 Pp_192148_1 0.14 0.0796
CYP704B1 Pp_139286_1 0.13 0.0916
A6 Pp_75622_1 0.13 0.1411
CALS5/LAP1 Pp_117054_2 0.12 0.1375
QRT1 Pp_145419_1 0.12 0.2956
CALS5/LAP1 Pp_185944_2 0.12 0.3023
AtbZIP34 Pp_171242_1 0.12 0.2553
CYP704B1 Pp_119258_1 0.12 0.2817
AtMYB103/MS188 Pp_8874_1 0.12 0.2584
CYP703A2 Pp_120688_1 0.12 0.0275
CYP703A2 Pp_120688_2 0.12 0.0383
QRT2 Pp_43415_1 0.11 0.2126
QRT1 Pp_145419_2 0.11 0.2967
CYP704B1 Pp_149913_2 0.11 0.0620
CYP703A2 Pp_111667_1 0.11 0.0610
CALS5/LAP1 Pp_185944_1 0.11 0.3626
QRT2 Pp_163808_1 0.11 0.0253
QRT2 Pp_163808_2 0.11 0.0545
A6 Pp_19653_1 0.09 0.3424
CALS5/LAP1 Pp_127776_2 0.09 0.0472
CALS5/LAP1 Pp_127776_1 0.09 0.1713
A6 Pp_25096_1 0.08 0.1375
TDE1/DET2 Pp_166483_1 0.08 0.0800
KNS2 Pp_216637_1 0.08 0.3322
CYP704B1 Pp_119258_2 0.08 0.3726
KNS2 Pp_210965_1 0.08 0.1565
AtMYB103/MS188 Pp_150459_1 0.08 0.1826
QRT2 Pp_133517_1 0.08 0.1382
ACOS5 Pp_174501_2 0.07 0.2037
CYP704B1 Pp_182724_1 0.07 0.0852
A6 Pp_19653_2 0.07 0.4052
AtbZIP34 Pp_201072_1 0.07 0.1850
AtbZIP34 Pp_64165_1 0.07 0.2457
AtMYB103/MS188 Pp_150459_2 0.07 0.3006

Appendices
153
QRT1 Pp_150987_1 0.07 0.1630
TDE1/DET2 Pp_119780_1 0.07 0.1332
TDE1/DET2 Pp_119780_2 0.07 0.1122
QRT2 Pp_133517_2 0.06 0.3341
ACOS5 Pp_192148_2 0.06 0.5035
ACOS5 Pp_113172_1 0.06 0.2320
CYP703A2 Pp_138465_2 0.06 0.3837
CYP704B1 Pp_182724_2 0.06 0.1908
QRT3 Pp_198113_1 0.06 0.6156
CYP703A2 Pp_167047_1 0.06 0.4302
ACOS5 Pp_122015_1 0.05 0.3440
KNS2 Pp_186437_1 0.05 0.4978
AtbZIP34 Pp_64750_1 0.05 0.5543
ACOS5 Pp_174501_1 0.05 0.5056
AtMYB103/MS188 Pp_135480_1 0.04 0.3834
MS1 Pp_148091_2 0.04 0.6435
MS1 Pp_148091_1 0.04 0.6641
AtbZIP34 Pp_163915_1 0.04 0.4868
CYP703A2 Pp_148103_2 0.04 0.5731
CYP704B1 Pp_148103_2 0.04 0.5731
AtMYB103/MS188 Pp_143587_1 0.04 0.5246
AtMYB103/MS188 Pp_135480_2 0.04 0.4376
AtMYB103/MS188 Pp_143587_2 0.04 0.3882
A6 Pp_105138_2 0.04 0.6111
CYP703A2 Pp_110612_2 0.04 0.7747
CYP704B1 Pp_110612_2 0.04 0.7747
AtMYB103/MS188 Pp_173907_2 0.04 0.7515
QRT1 Pp_94470_1 0.04 0.4821
RPG1 Pp_146546_2 0.04 0.4757
CYP703A2 Pp_110612_1 0.03 0.7628
CYP704B1 Pp_110612_1 0.03 0.7628
CYP703A2 Pp_219188_1 0.03 0.4212
ACOS5 Pp_122015_2 0.03 0.5787
ACOS5 Pp_113172_2 0.03 0.5404
QRT1 Pp_31656_1 0.03 0.6719
KNS2 Pp_186437_2 0.03 0.6816
QRT2 Pp_176513_2 0.03 0.7486
A6 Pp_105138_1 0.03 0.6542
A6 Pp_61200_1 0.03 0.5519
A6 Pp_65557_1 0.03 0.5809
CYP703A2 Pp_167047_2 0.03 0.7445
CER3 Pp_198498_1 0.02 0.9099
QRT2 Pp_176513_1 0.02 0.8107
AtbZIP34 Pp_163915_2 0.02 0.8230
CYP703A2 Pp_149501_2 0.02 0.7837
CER3 Pp_177243_1 0.02 0.7642
CYP703A2 Pp_148103_1 0.02 0.7344
CYP704B1 Pp_148103_1 0.02 0.7344
AtMYB103/MS188 Pp_173907_1 0.02 0.9000
RPG1 Pp_146546_1 0.01 0.7787
CYP703A2 Pp_149501_1 0.01 0.8596
A6 Pp_189861_1 0.01 0.7817
CYP703A2 Pp_204665_1 0.01 0.9155
AtMYB103/MS188 Pp_61394_1 0.01 0.8174
CYP703A2 Pp_32062_1 0.01 0.7655
QRT1 Pp_103704_1 0.01 0.9406
ACOS5 Pp_150981_2 0.01 0.8517
CYP703A2 Pp_111667_2 0.01 0.7647
CYP703A2 Pp_138465_1 0.01 0.8346
CYP703A2 Pp_189599_2 0.01 0.9259
AtMYB103/MS188 Pp_126855_2 0.00 0.9680

Appendices
154
QRT1 Pp_118762_1 0.00 0.9843
AtMYB103/MS188 Pp_89855_1 0.00 0.9678
CYP703A2 Pp_50846_1 0.00 0.9783
CYP703A2 Pp_189599_1 0.00 0.9271
AtMYB103/MS188 Pp_153206_2 0.00 0.9205
QRT1 Pp_174093_2 0.00 0.9526
QRT1 Pp_118762_2 -0.01 0.9556
QRT1 Pp_135307_2 -0.01 0.9600
ACOS5 Pp_233094_1 -0.01 0.8274
ACOS5 Pp_115006_2 -0.01 0.8349
AtMYB103/MS188 Pp_123689_1 -0.01 0.8512
A6 Pp_56975_1 -0.01 0.8556
A6 Pp_160804_1 -0.01 0.9344
AtMYB103/MS188 Pp_34929_1 -0.02 0.7624
AtMYB103/MS188 Pp_148816_2 -0.02 0.7458
CYP703A2 Pp_200880_1 -0.02 0.7226
A6 Pp_189861_2 -0.02 0.6809
ACOS5 Pp_150981_1 -0.02 0.8221
QRT1 Pp_174093_1 -0.02 0.7957
CYP703A2 Pp_133330_2 -0.02 0.6477
A6 Pp_160804_2 -0.02 0.8959
ACOS5 Pp_122068_2 -0.02 0.6204
CYP704B1 Pp_180507_2 -0.02 0.8755
QRT1 Pp_134522_2 -0.02 0.7536
QRT2 Pp_160263_1 -0.02 0.5616
CYP703A2 Pp_140101_2 -0.02 0.8341
CYP704B1 Pp_140101_2 -0.02 0.8341
QRT1 Pp_103704_2 -0.02 0.8677
CYP703A2 Pp_133330_1 -0.02 0.6684
ACOS5 Pp_122068_1 -0.02 0.6079
RPG1 Pp_136254_1 -0.02 0.6687
QRT1 Pp_152977_1 -0.03 0.8529
A6 Pp_163193_2 -0.03 0.7131
CYP703A2 Pp_140101_1 -0.03 0.7947
CYP704B1 Pp_140101_1 -0.03 0.7947
A6 Pp_131016_1 -0.03 0.6241
ACOS5 Pp_152177_1 -0.03 0.6620
AtMYB103/MS188 Pp_153206_1 -0.03 0.5510
QRT2 Pp_22776_1 -0.03 0.7549
AtMYB103/MS188 Pp_189472_2 -0.03 0.5611
A6 Pp_131016_2 -0.03 0.5667
CYP703A2 Pp_147541_2 -0.03 0.5712
A6 Pp_167530_1 -0.03 0.7127
QRT1 Pp_135307_1 -0.03 0.8057
RPG1 Pp_136254_2 -0.03 0.5748
QRT2 Pp_160263_2 -0.03 0.4559
A6 Pp_175736_2 -0.03 0.4459
CYP703A2 Pp_87503_1 -0.03 0.5901
MS1 Pp_150355_1 -0.03 0.7297
AtMYB103/MS188 Pp_189472_1 -0.03 0.6181
CYP703A2 Pp_147541_1 -0.04 0.3981
CALS5/LAP1 Pp_183682_2 -0.04 0.4814
QRT1 Pp_121267_1 -0.04 0.7139
QRT1 Pp_189145_2 -0.04 0.6083
CYP703A2 Pp_64909_1 -0.04 0.6869
QRT1 Pp_189145_1 -0.04 0.5098
A6 Pp_175736_1 -0.04 0.3876
A6 Pp_163193_1 -0.04 0.5097
AtbZIP34 Pp_159871_2 -0.04 0.5069
QRT1 Pp_132301_1 -0.04 0.5295
CYP703A2 Pp_106848_2 -0.04 0.4236

Appendices
155
CYP704B1 Pp_106848_2 -0.04 0.4236
A6 Pp_147889_1 -0.04 0.4266
CYP703A2 Pp_139150_1 -0.04 0.6800
A6 Pp_147889_2 -0.04 0.3791
ACOS5 Pp_115006_1 -0.05 0.3299
AtMYB103/MS188 Pp_121437_1 -0.05 0.7156
AtMYB103/MS188 Pp_126855_1 -0.05 0.3127
CALS5/LAP1 Pp_175718_2 -0.05 0.4084
CER3 Pp_177243_2 -0.06 0.3476
ACOS5 Pp_152177_2 -0.06 0.4350
QRT1 Pp_134522_1 -0.06 0.4205
QRT1 Pp_152977_2 -0.06 0.5916
CYP703A2 Pp_139150_2 -0.06 0.6477
A6 Pp_172885_2 -0.06 0.3840
CYP704B1 Pp_195286_2 -0.06 0.2773
A6 Pp_167530_2 -0.06 0.3509
CALS5/LAP1 Pp_183682_1 -0.06 0.1670
AtbZIP34 Pp_159871_1 -0.06 0.2239
QRT1 Pp_31765_1 -0.07 0.3872
A6 Pp_110742_2 -0.07 0.2550
QRT1 Pp_44780_1 -0.07 0.3778
A6 Pp_110742_1 -0.07 0.3761
AtMYB103/MS188 Pp_123689_2 -0.07 0.2574
MS1 Pp_150355_2 -0.07 0.4604
A6 Pp_172885_1 -0.07 0.2268
A6 Pp_107800_1 -0.07 0.4541
ACOS5 Pp_124849_1 -0.07 0.2555
ACOS5 Pp_124849_2 -0.07 0.3237
CYP703A2 Pp_106848_1 -0.07 0.3168
CYP704B1 Pp_106848_1 -0.07 0.3168
CYP703A2 Pp_110816_2 -0.08 0.1469
CYP704B1 Pp_110816_2 -0.08 0.1469
QRT1 Pp_132301_2 -0.08 0.2810
A6 Pp_91949_1 -0.08 0.1605
A6 Pp_113399_1 -0.08 0.2031
CYP703A2 Pp_22681_1 -0.08 0.5199
CYP704B1 Pp_195286_1 -0.08 0.2553
A6 Pp_107800_2 -0.09 0.4221
CYP704B1 Pp_180507_1 -0.09 0.5467
CYP703A2 Pp_211162_1 -0.09 0.3468
A6 Pp_59275_1 -0.09 0.0719
A6 Pp_113399_2 -0.09 0.1421
A6 Pp_60671_1 -0.09 0.4277
CALS5/LAP1 Pp_175718_1 -0.09 0.0982
CYP703A2 Pp_110816_1 -0.10 0.0901
CYP704B1 Pp_110816_1 -0.10 0.0901
AtMYB103/MS188 Pp_29378_1 -0.10 0.1128
CYP703A2 Pp_197852_1 -0.10 0.1408
CYP704B1 Pp_197852_1 -0.10 0.1408
CYP703A2 Pp_150408_2 -0.10 0.0297
A6 Pp_8713_1 -0.11 0.2022
QRT1 Pp_121267_2 -0.11 0.1814
ACOS5 Pp_209184_1 -0.11 0.4688
AtMYB103/MS188 Pp_123475_1 -0.11 0.4975
CALS5/LAP1 Pp_115455_1 -0.11 0.0834
AtMYB103/MS188 Pp_113218_2 -0.11 0.3456
QRT1 Pp_208299_1 -0.11 0.6418
CALS5/LAP1 Pp_207622_1 -0.12 0.0272
AtMYB103/MS188 Pp_123475_2 -0.12 0.4603
A6 Pp_61203_1 -0.12 0.3671
CALS5/LAP1 Pp_115455_2 -0.12 0.0847

Appendices
156
AtMYB103/MS188 Pp_148816_1 -0.12 0.0124
AtMYB103/MS188 Pp_184923_2 -0.12 0.1743
AtMYB103/MS188 Pp_153179_1 -0.12 0.2593
QRT1 Pp_108383_1 -0.12 0.3383
AtMYB103/MS188 Pp_113218_1 -0.13 0.1504
AtMYB103/MS188 Pp_19381_2 -0.13 0.1309
AtMYB103/MS188 Pp_143649_1 -0.13 0.3784
AtMYB103/MS188 Pp_143649_2 -0.13 0.3938
RPG1 Pp_122188_2 -0.13 0.0488
QRT1 Pp_108383_2 -0.14 0.3059
A6 Pp_14679_1 -0.14 0.1454
CALS5/LAP1 Pp_183499_1 -0.14 0.0044
CYP703A2 Pp_150408_1 -0.15 0.0051
CALS5/LAP1 Pp_183499_2 -0.15 0.0089
A6 Pp_192933_2 -0.16 0.2465
A6 Pp_196989_1 -0.16 0.0117
RPG1 Pp_122188_1 -0.16 0.0392
A6 Pp_192933_1 -0.16 0.3009
AtMYB103/MS188 Pp_153179_2 -0.16 0.1446
AtMYB103/MS188 Pp_184923_1 -0.17 0.1375
CYP703A2 Pp_2770_1 -0.17 0.0049
A6 Pp_14679_2 -0.17 0.0427
AtMYB103/MS188 Pp_19381_1 -0.17 0.0635
AtbZIP34 Pp_81285_1 -0.17 0.0164
QRT1 Pp_15518_1 -0.18 0.0478
QRT1 Pp_182229_1 -0.18 0.0903
CYP704B1 Pp_168494_2 -0.19 0.0032
AtMYB103/MS188 Pp_121437_2 -0.19 0.1393
CYP703A2 Pp_115760_1 -0.20 0.0254
CYP704B1 Pp_115760_1 -0.20 0.0254
QRT1 Pp_182229_2 -0.20 0.0941
QRT1 Pp_232357_1 -0.20 0.0327
QRT1 Pp_187864_1 -0.20 0.0595
CYP703A2 Pp_115760_2 -0.20 0.0306
CYP704B1 Pp_115760_2 -0.20 0.0306
KNS2 Pp_119166_1 -0.21 0.0696
A6 Pp_90481_1 -0.21 0.0070
AtMYB103/MS188 Pp_100368_2 -0.21 0.0323
A6 Pp_196989_2 -0.22 0.0125
QRT1 Pp_187864_2 -0.22 0.0539
QRT2 Pp_193100_2 -0.22 0.1127
A6 Pp_218702_1 -0.23 0.0042
QRT1 Pp_190734_2 -0.23 0.0013
KNS2 Pp_119166_2 -0.23 0.0527
AtMYB103/MS188 Pp_111064_2 -0.24 0.0022
AtMYB103/MS188 Pp_111064_1 -0.24 0.0043
AtMYB103/MS188 Pp_100368_1 -0.24 0.0234
CYP704B1 Pp_177185_1 -0.24 0.0019
A6 Pp_54237_1 -0.25 0.0798
CYP704B1 Pp_177185_2 -0.25 0.0026
QRT1 Pp_58226_1 -0.25 0.0004
A6 Pp_122478_1 -0.26 0.0007
CYP704B1 Pp_168494_1 -0.26 0.0007
QRT1 Pp_190734_1 -0.27 0.0005
CYP703A2 Pp_188189_1 -0.30 0.0015
CYP704B1 Pp_188189_1 -0.30 0.0015
A6 Pp_122478_2 -0.30 0.0036
KNS2 Pp_188513_2 -0.32 0.0182
CYP703A2 Pp_63679_1 -0.32 0.0246
QRT1 Pp_15518_2 -0.33 0.0022
QRT2 Pp_13931_2 -0.34 0.0063

Appendices
157
QRT1 Pp_138756_1 -0.35 0.0218
AtMYB103/MS188 Pp_27442_1 -0.36 0.0240
AtMYB103/MS188 Pp_8210_1 -0.37 0.0026
QRT1 Pp_121141_1 -0.37 0.0013
QRT1 Pp_152856_1 -0.37 0.0005
CYP703A2 Pp_188189_2 -0.37 0.0003
CYP704B1 Pp_188189_2 -0.37 0.0003
CYP704B1 Pp_105982_2 -0.37 0.0042
CYP703A2 Pp_149034_1 -0.38 0.0030
CYP704B1 Pp_149034_1 -0.38 0.0030
QRT1 Pp_152856_2 -0.38 0.0011
CYP704B1 Pp_105982_1 -0.39 0.0021
A6 Pp_8710_1 -0.40 0.0034
KNS2 Pp_188513_1 -0.42 0.0011
QRT1 Pp_121141_2 -0.42 0.0009
QRT1 Pp_138756_2 -0.43 0.0171
AtbZIP34 Pp_128606_2 -0.43 0.0001
CYP703A2 Pp_149034_2 -0.45 0.0013
CYP704B1 Pp_149034_2 -0.45 0.0013
QRT2 Pp_193100_1 -0.46 0.0181
QRT1 Pp_45683_1 -0.49 0.0086
AtbZIP34 Pp_128606_1 -0.51 0.0004
QRT2 Pp_13931_1 -0.57 0.0007
CYP704B1 Pp_116547_1 -0.61 0.0004
CYP704B1 Pp_116547_2 -0.63 0.0001
CYP703A2 Pp_172320_2 -0.65 0.0002
QRT1 Pp_79815_1 -0.65 0.0010
CYP703A2 Pp_172320_1 -0.67 0.0001
ACOS5 Pp_92121_1 -0.74 0.0000
QRT1 Pp_145945_1 -0.99 0.0002
TDE1/DET2 Pp_181942_1 -1.03 0.0001
TDE1/DET2 Pp_181942_2 -1.07 0.0002
QRT1 Pp_145945_2 -1.10 0.0002
CYP703A2 Pp_102043_1 -1.24 0.0002
CYP703A2 Pp_102043_2 -1.27 0.0002
QRT1 Pp_4364_1 -1.58 0.0000
QRT1 Pp_15580_2 -1.97 0.0001
QRT1 Pp_15580_1 -2.05 0.0001
QRT1 Pp_222560_1 -2.16 0.0001
QRT1 Pp_155350_1 -2.40 0.0001
QRT1 Pp_155350_2 -2.49 0.0001