Embed Size (px)
Citation preview
Evolution Evolution of of
PopulatioPopulationsns
Evolution Unit
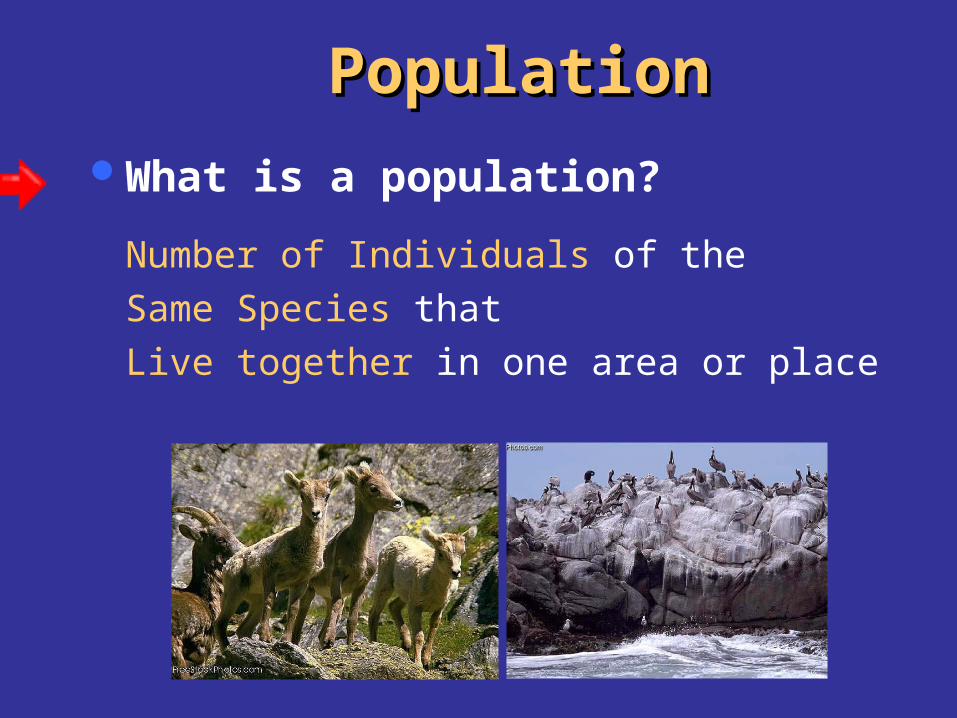
PopulationPopulationWhat is a population?
Number of Individuals of theSame Species thatLive together in one area or place
Factors That Control Factors That Control Population GrowthPopulation Growth
A population’s biotic potential is the size it would be if nothing stopped it.
Why don’t populations grow indefinitely?
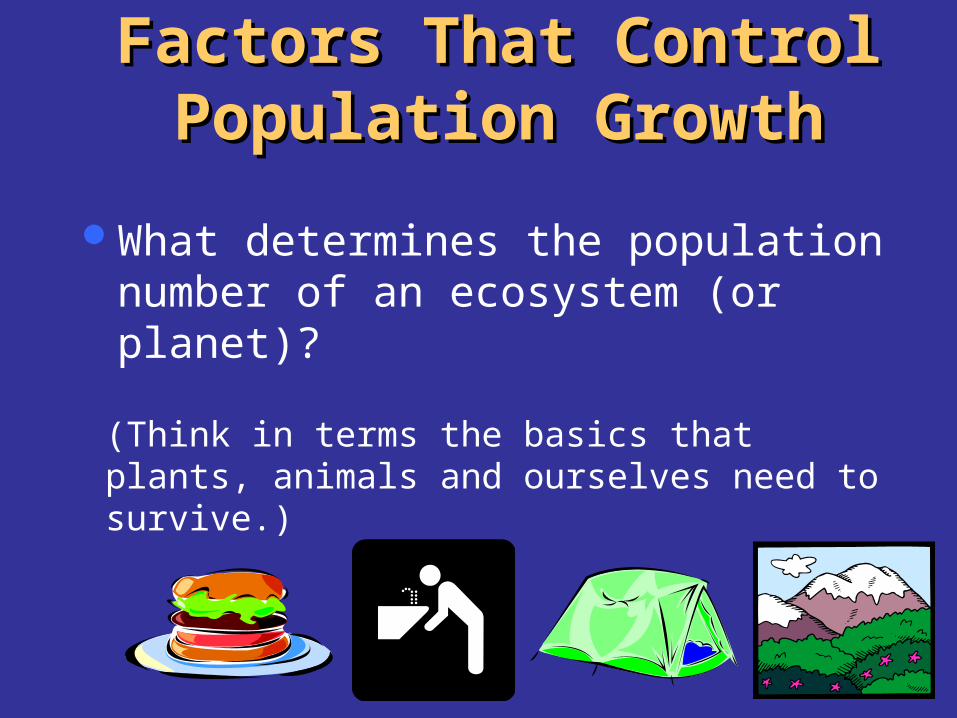
Factors That ControlFactors That ControlPopulation GrowthPopulation Growth
What determines the population number of an ecosystem (or planet)?
(Think in terms the basics that plants, animals and ourselves need to survive.)
Factors That Control Factors That Control Population GrowthPopulation Growth
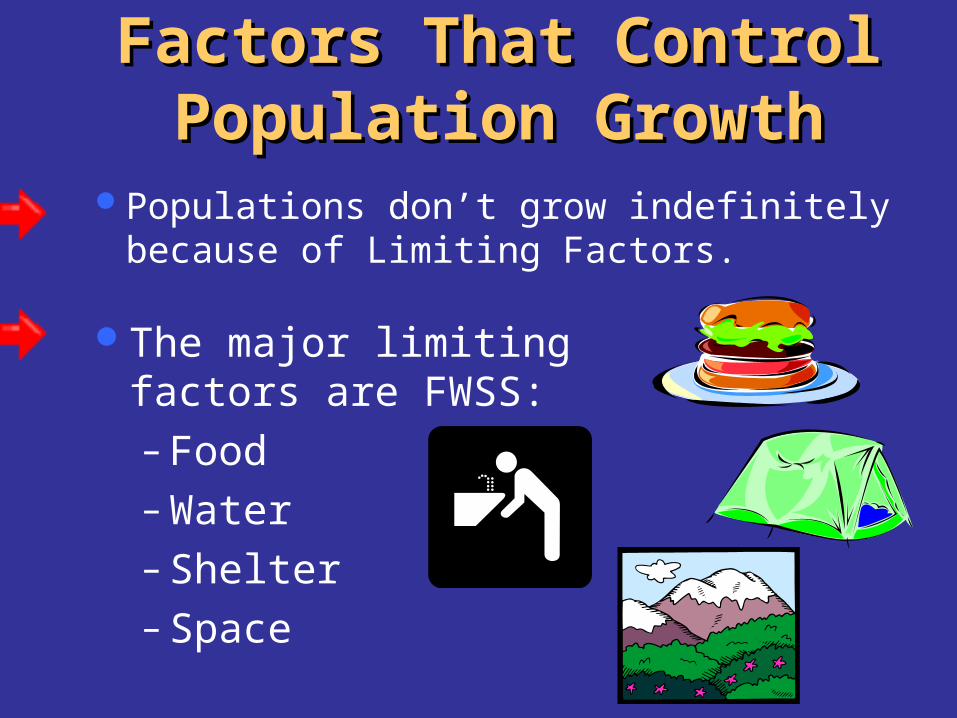
Populations don’t grow indefinitely because of Limiting Factors.
The major limiting factors are FWSS:– Food– Water– Shelter– Space
Factors That Control Factors That Control Population GrowthPopulation Growth
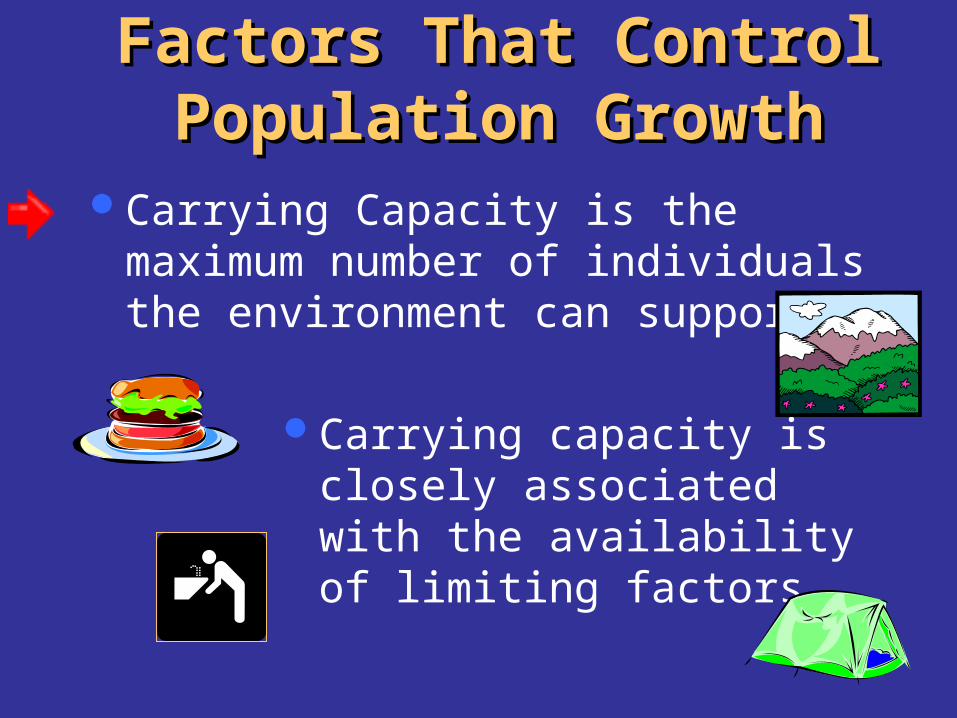
Carrying Capacity is the maximum number of individuals the environment can support.
Carrying capacity is closely associated with the availability of limiting factors.
Factors That Control Factors That Control Population GrowthPopulation Growth
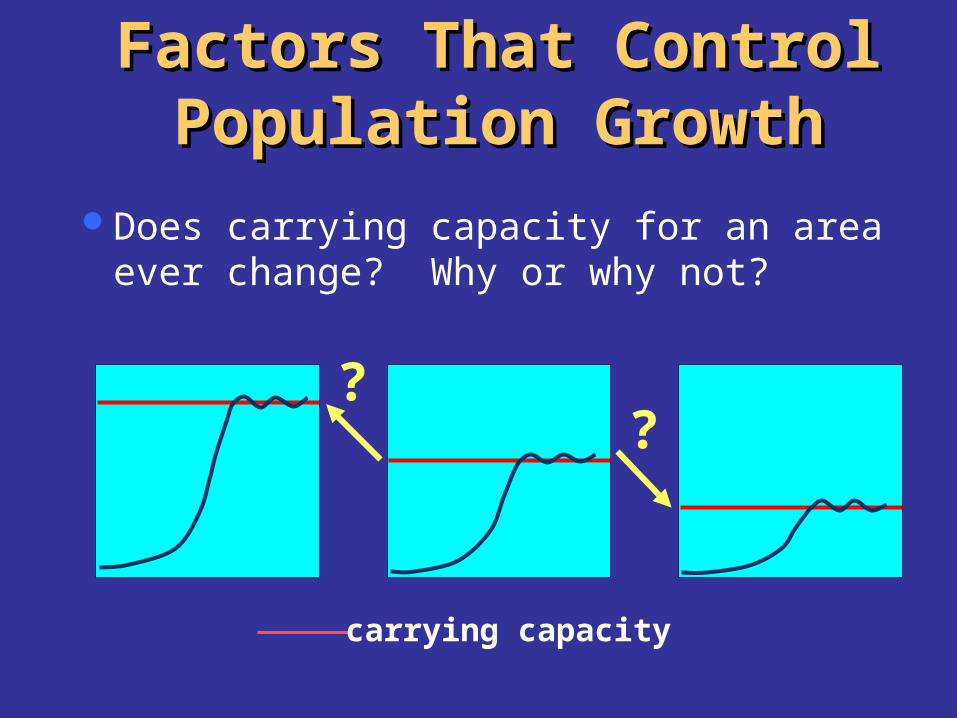
Does carrying capacity for an area ever change? Why or why not?
??
carrying capacity
Population Growth Population Growth RateRate
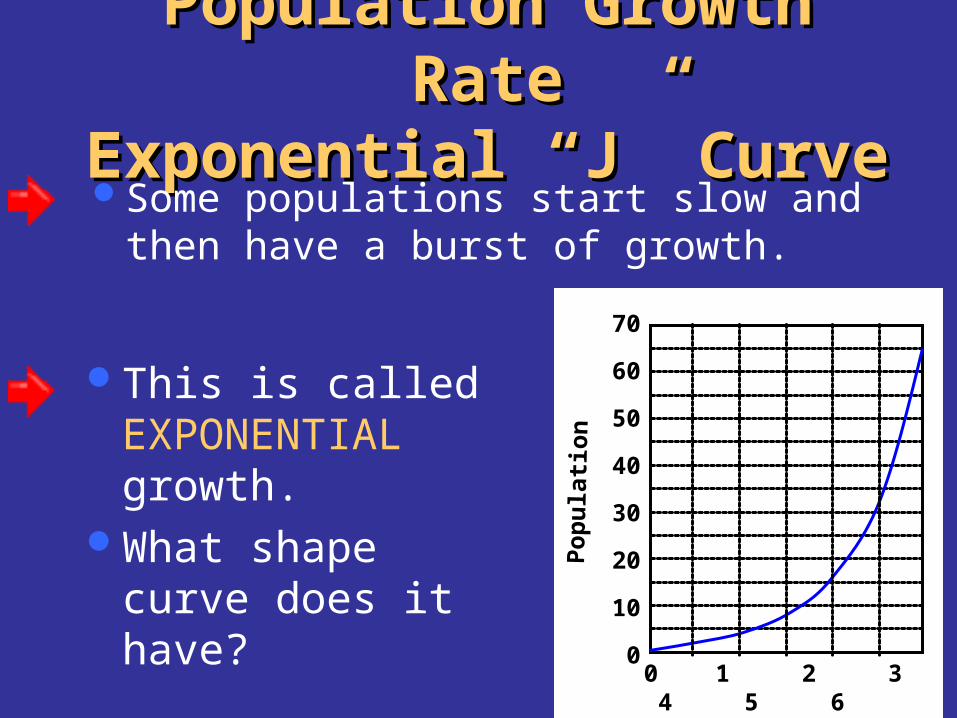
Exponential “J” CurveExponential “J” CurveSome populations start slow and
then have a burst of growth.
This is called EXPONENTIAL growth.
What shape curve does it have?
70
60
50
40
30
20
10
00 1 2 3 4 5 6
Time
Po
pu
lati
on
70
60
50
40
30
20
10
00 1 2 3 4 5 6
Time
Po
pu
lati
on
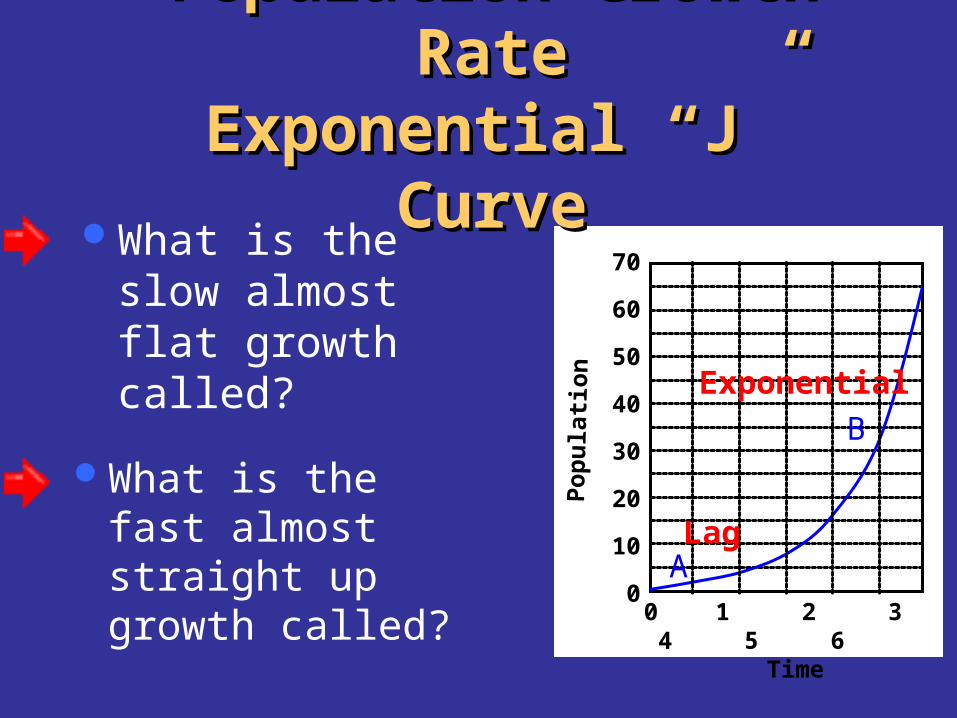
Population Growth Population Growth RateRate
Exponential “J” CurveExponential “J” CurveWhat is the slow
almost flat growth called?
What is the fast almost straight up growth called?
Lag
Exponential
A
B
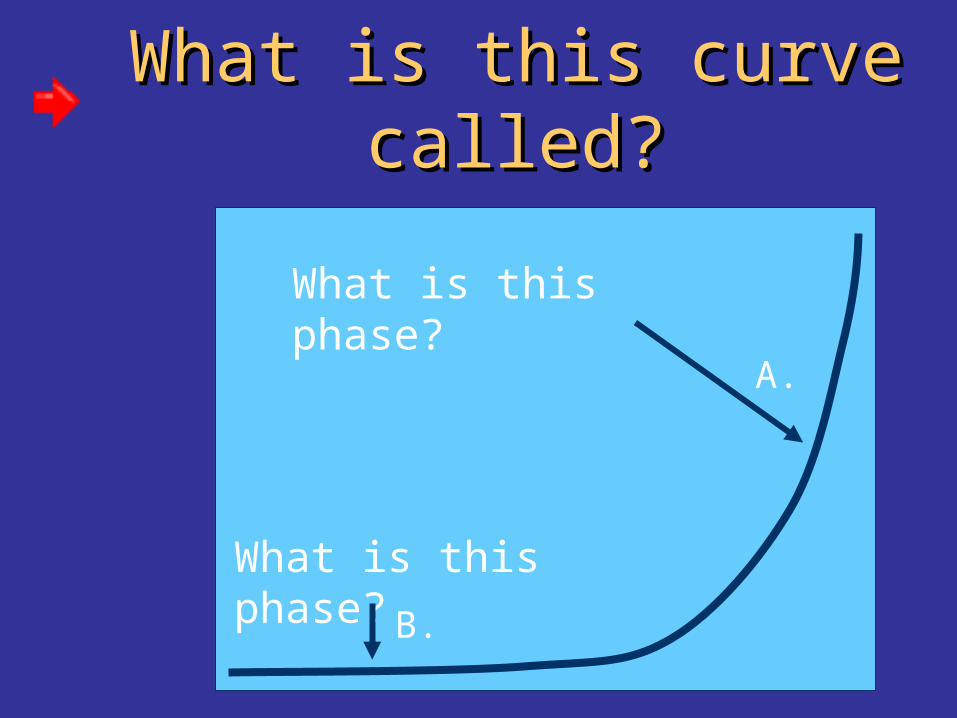
What is this curve What is this curve called?called?
What is this phase?
What is this phase?
B.
A.

Population Growth Population Growth RateRate
Logistic “S” CurveLogistic “S” CurveSome populations start slow, have
a burst of growth, then level off.
This is called LOGISTIC growth.
What shape is the curve?
600
500
400
300
200
100
00 10 20 30
Time (in days)
Population
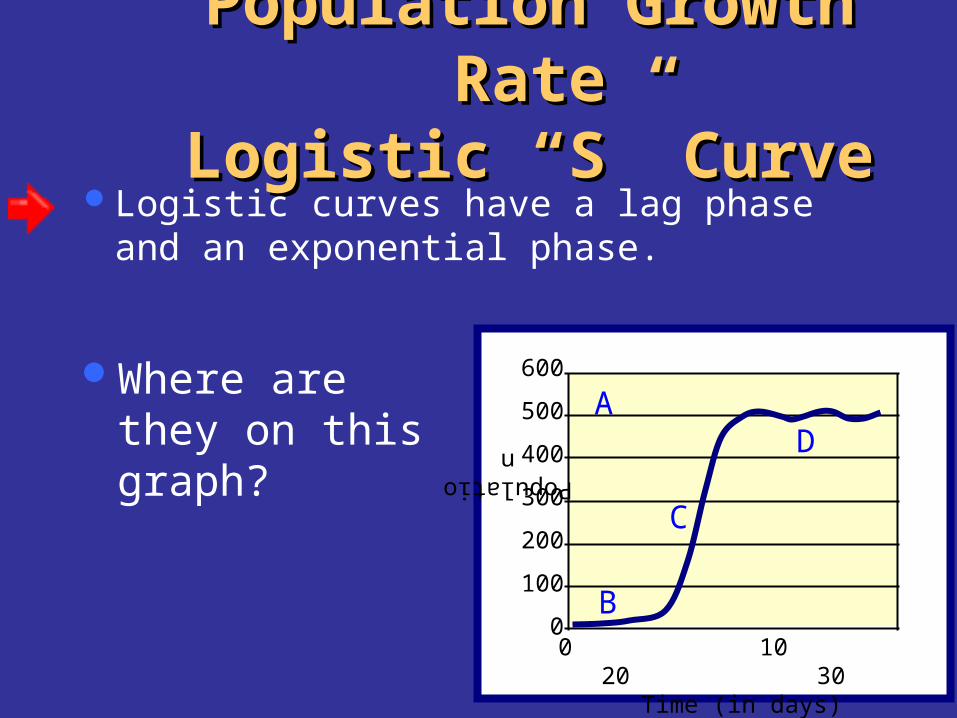
Population Growth Population Growth RateRate
Logistic “S” CurveLogistic “S” CurveLogistic curves have a lag phase
and an exponential phase.
Where are they on this graph?
600
500
400
300
200
100
00 10 20 30
Time (in days)
Population
A
B
C
D
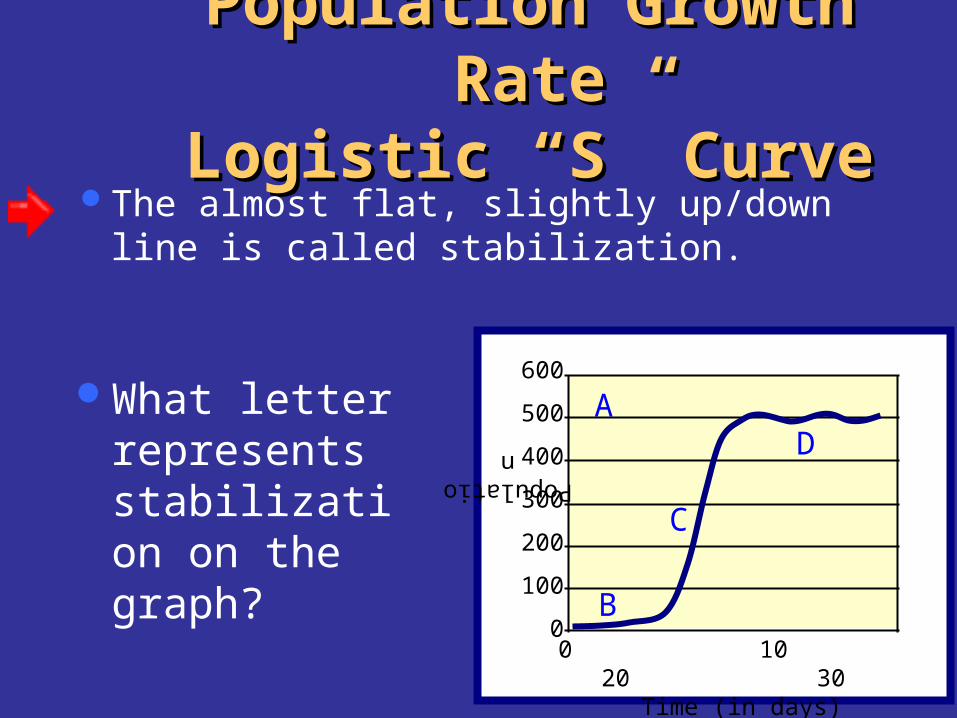
Population Growth Population Growth RateRate
Logistic “S” CurveLogistic “S” CurveThe almost flat, slightly up/down
line is called stabilization.
What letter represents stabilization on the graph?
600
500
400
300
200
100
00 10 20 30
Time (in days)
Population
A
B
C
D
Population Growth Population Growth RateRate
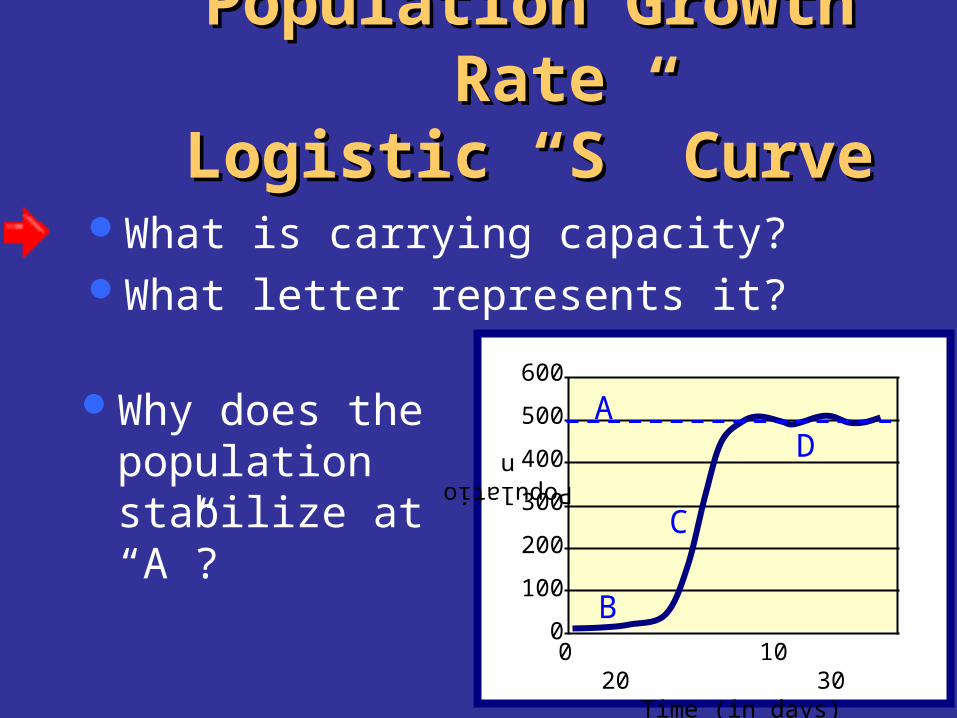
Logistic “S” CurveLogistic “S” CurveWhat is carrying capacity?What letter represents it?
Why does the population stabilize at “A”?
600
500
400
300
200
100
00 10 20 30
Time (in days)
Population
A
B
C
D
Population Growth Population Growth RateRate
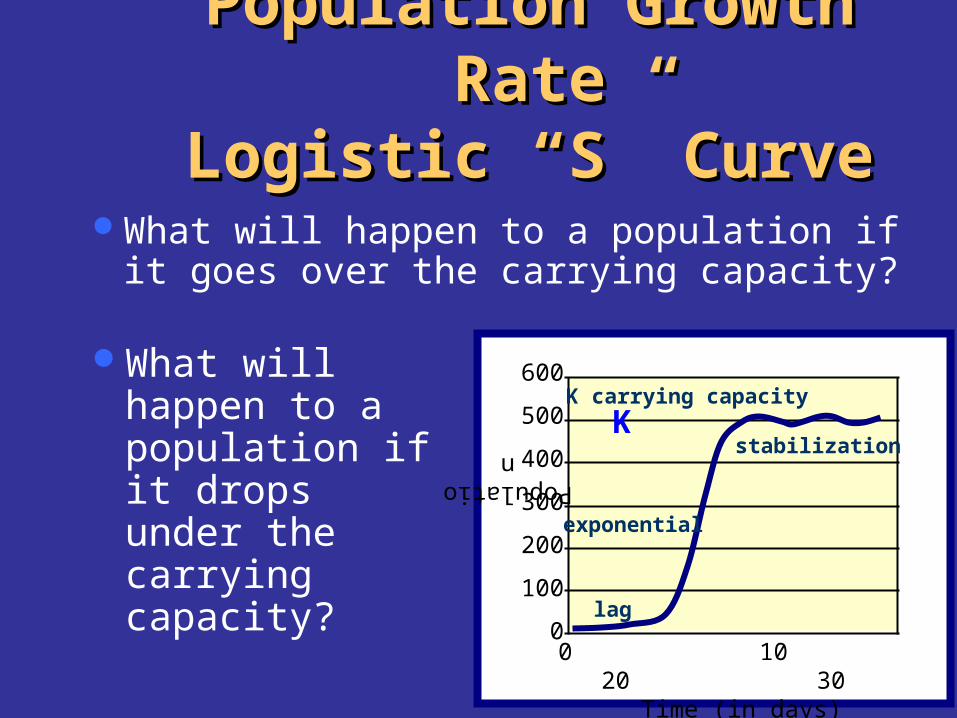
Logistic “S” CurveLogistic “S” CurveWhat will happen to a population if
it goes over the carrying capacity?
What will happen to a population if it drops under the carrying capacity?
600
500
400
300
200
100
00 10 20 30
Time (in days)
Population
KK carrying capacity
lag
exponential
stabilization
Population Growth Population Growth RateRate
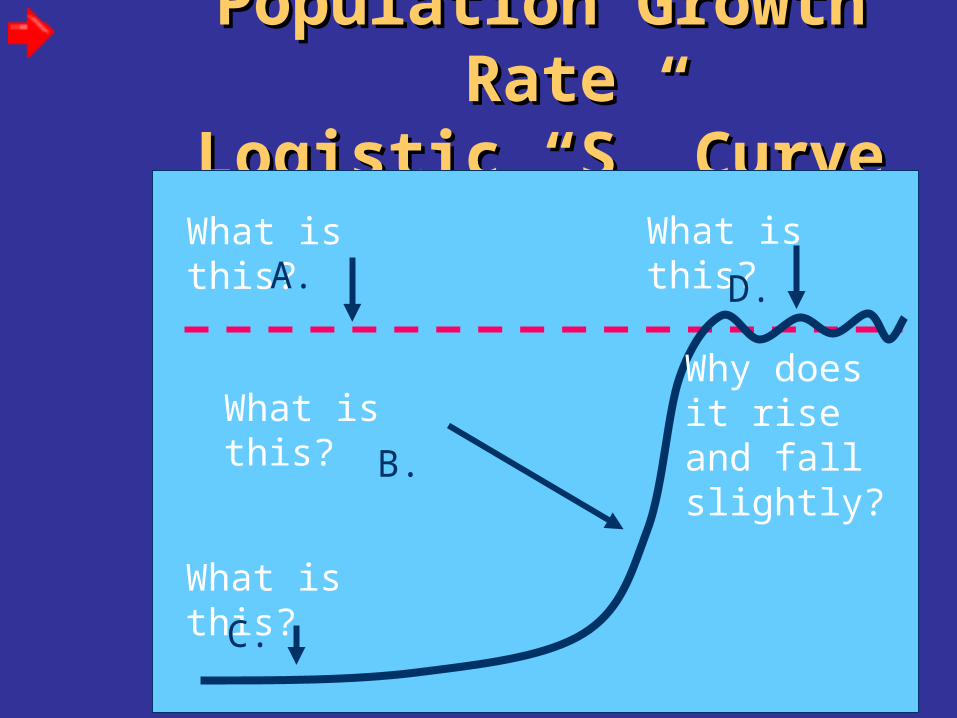
Logistic “S” CurveLogistic “S” CurveWhat is this?
What is this?
What is this?
What is this?
Why does it rise and fall slightly?
A.
C.
B.
D.

Natural SelectionNatural Selectionand Populationsand Populations
Recall Darwin’sConcepts of Natural Selection
variation exists in all species organisms produce more offspring than
can survive competition for limited life resources survival of the fittest (most suited to the
environment) descent with modification
Natural SelectionNatural Selectionand Populationsand Populations
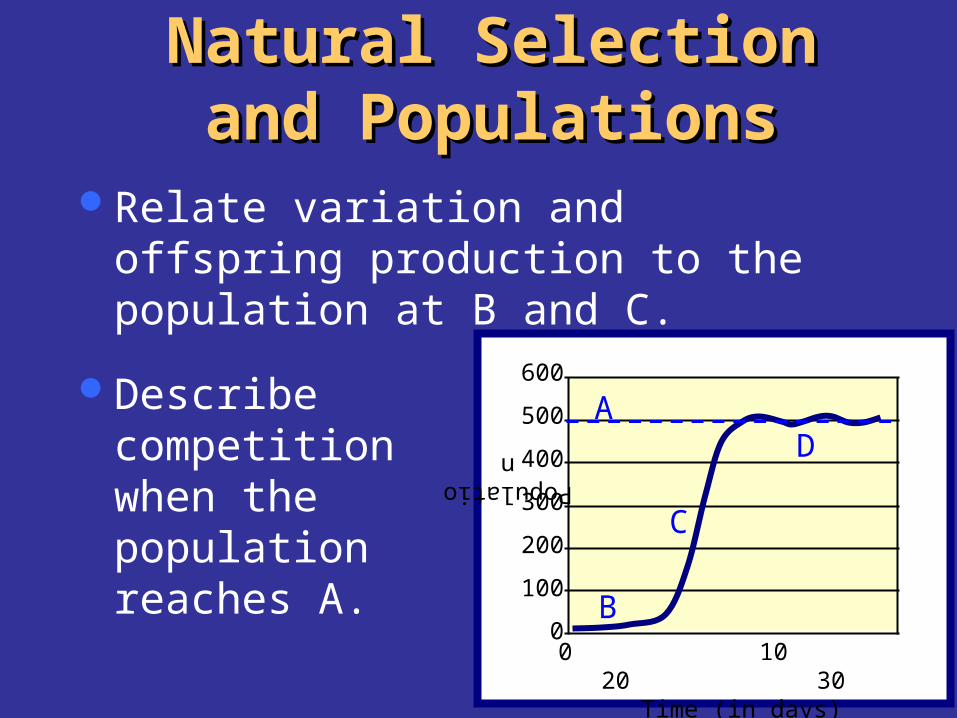
Relate variation and offspring production to the population at B and C.
Describe competition when the population reaches A.
600
500
400
300
200
100
00 10 20 30
Time (in days)
Population
A
B
C
D
Natural SelectionNatural Selectionand Populationsand Populations
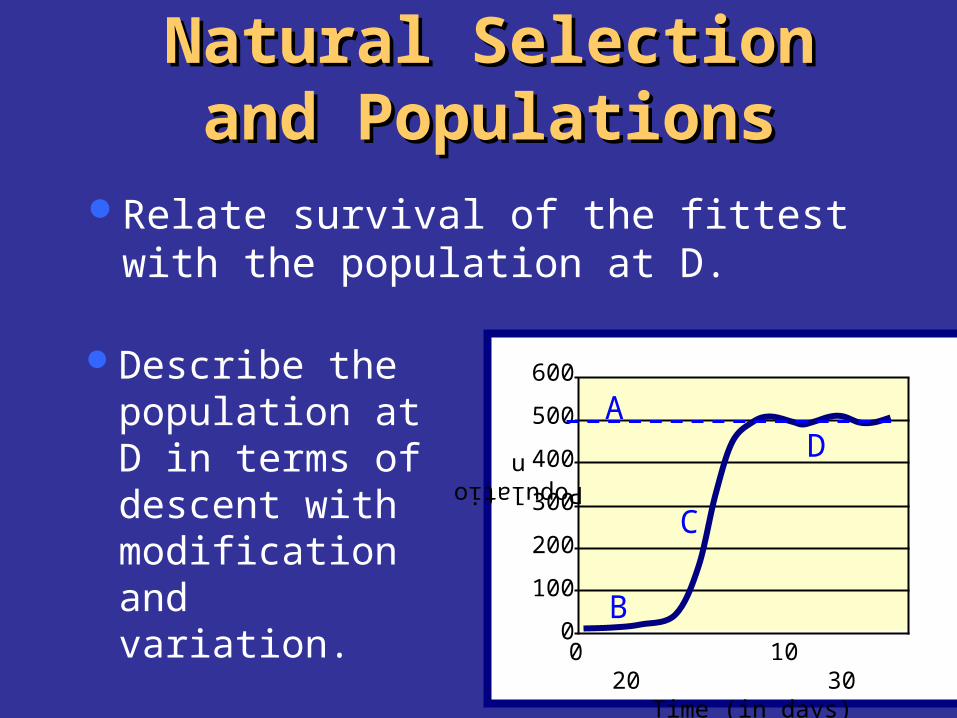
Relate survival of the fittest with the population at D.
Describe the population at D in terms of descent with modification and variation.
600
500
400
300
200
100
00 10 20 30
Time (in days)
Population
A
B
C
D
Natural SelectionNatural Selectionand Populationsand Populations
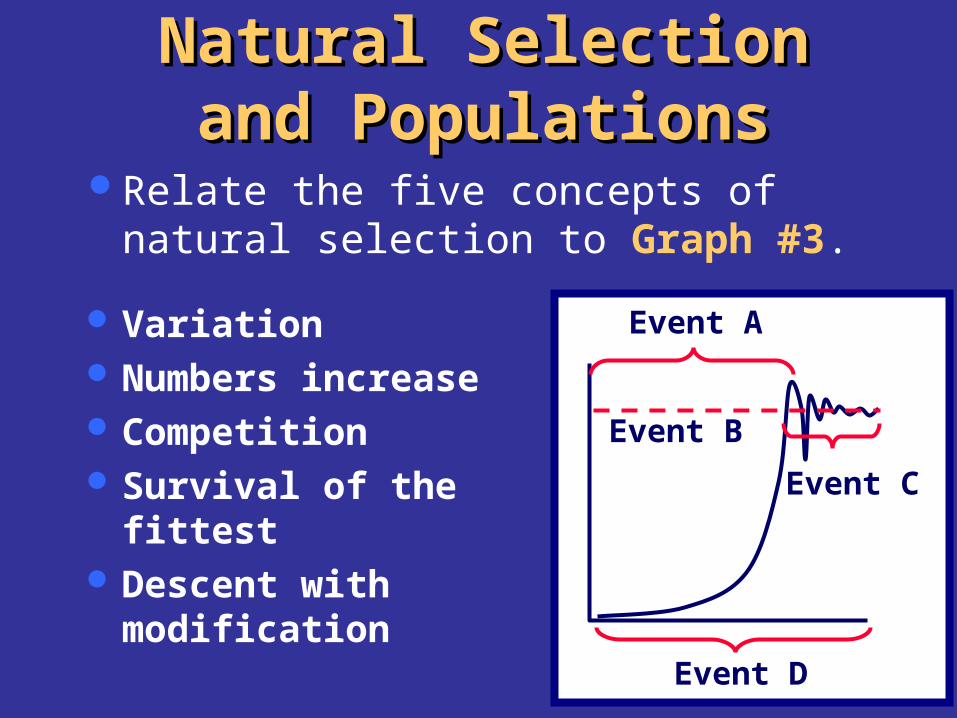
Relate the five concepts of natural selection to Graph #3.
Variation Numbers increase Competition Survival of the
fittest Descent with
modification
Event C
Event B
Event D
Event A
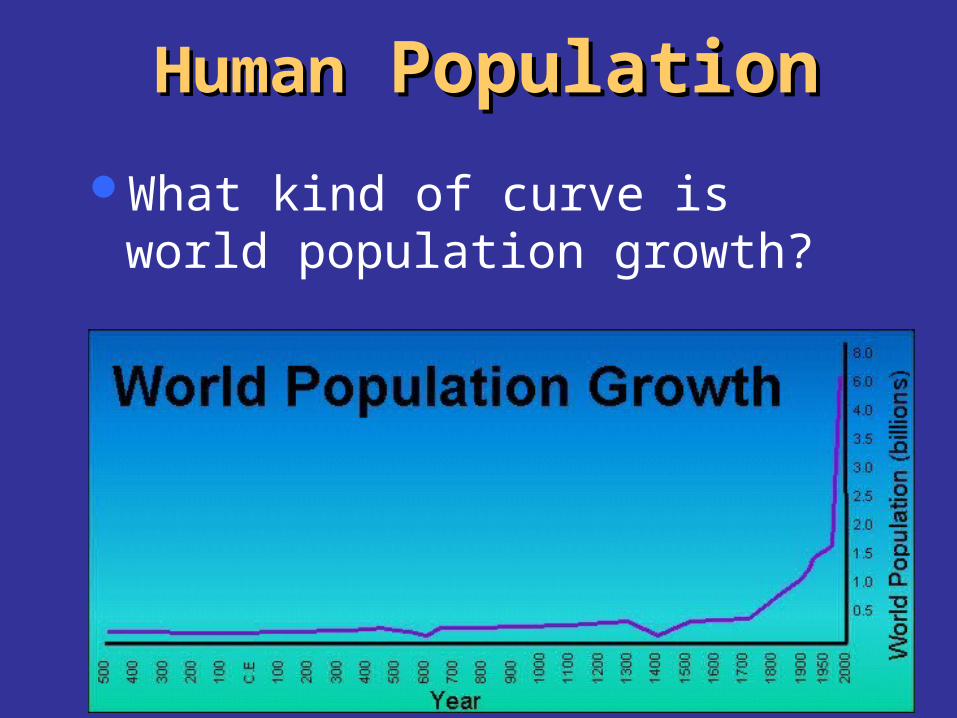
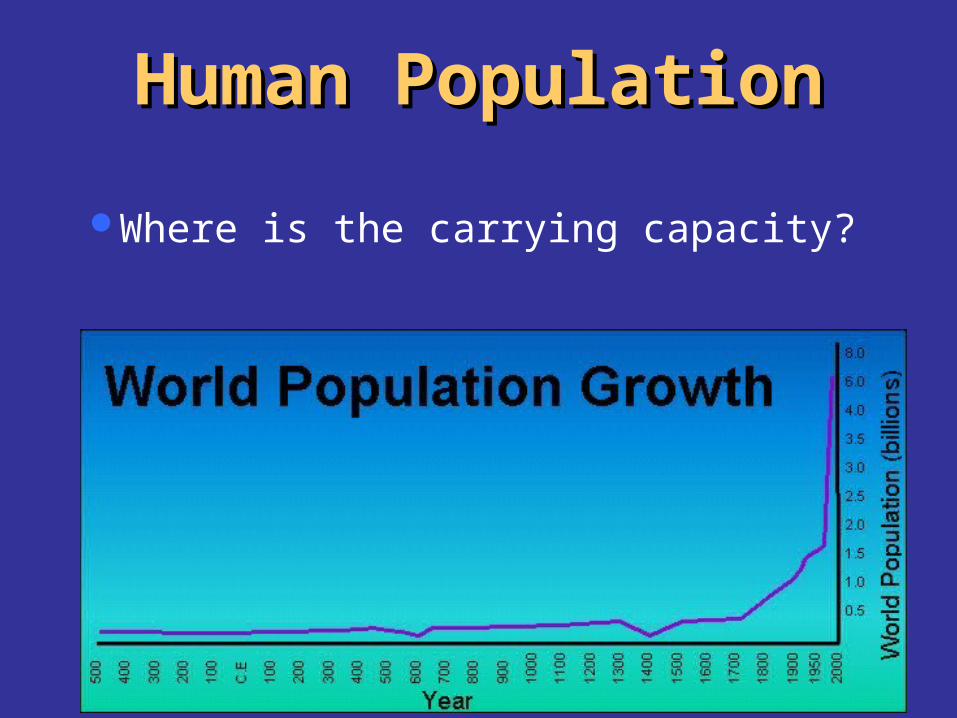
HumanHuman PopulationPopulation
What kind of curve is world population growth?
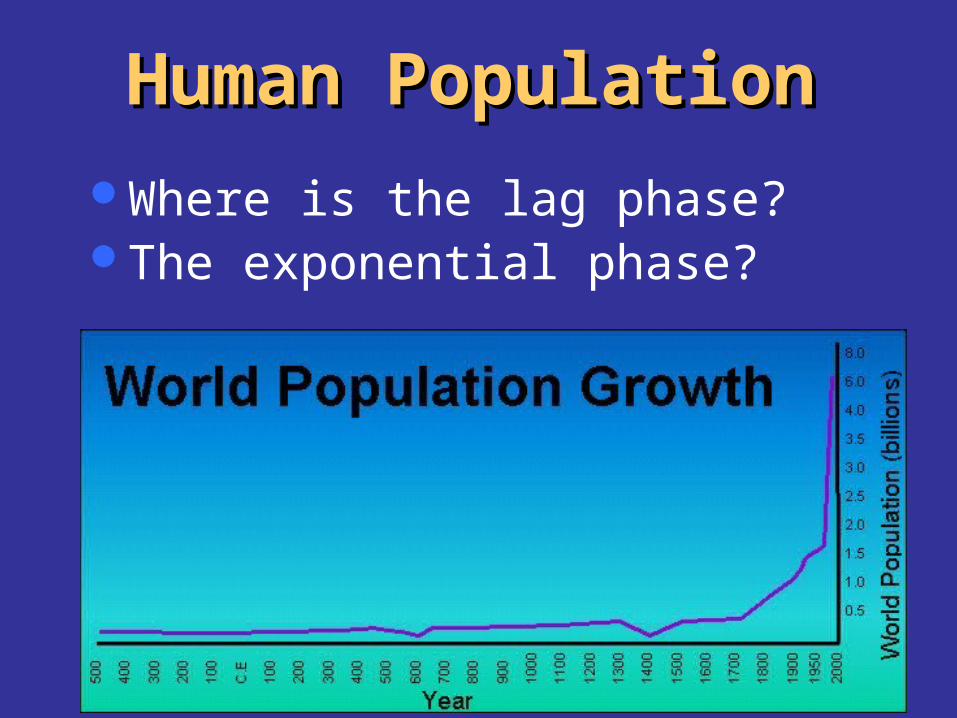
Human PopulationHuman PopulationWhere is the lag phase?The exponential phase?
Human PopulationHuman Population
Where is the carrying capacity?
Human PopulationHuman Population
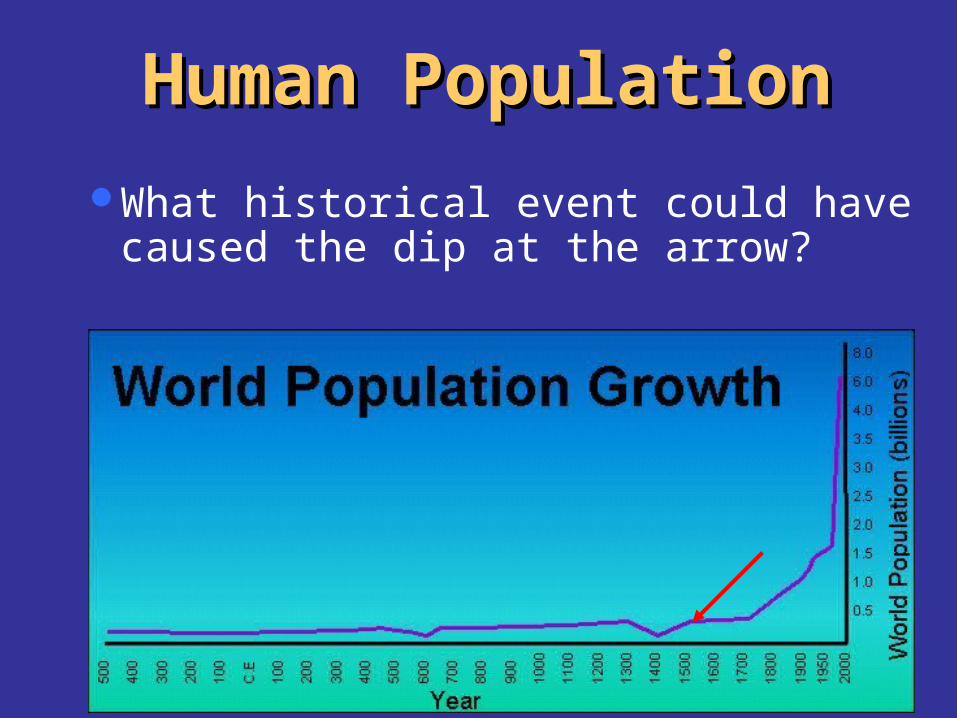
What historical event could have caused the dip at the arrow?
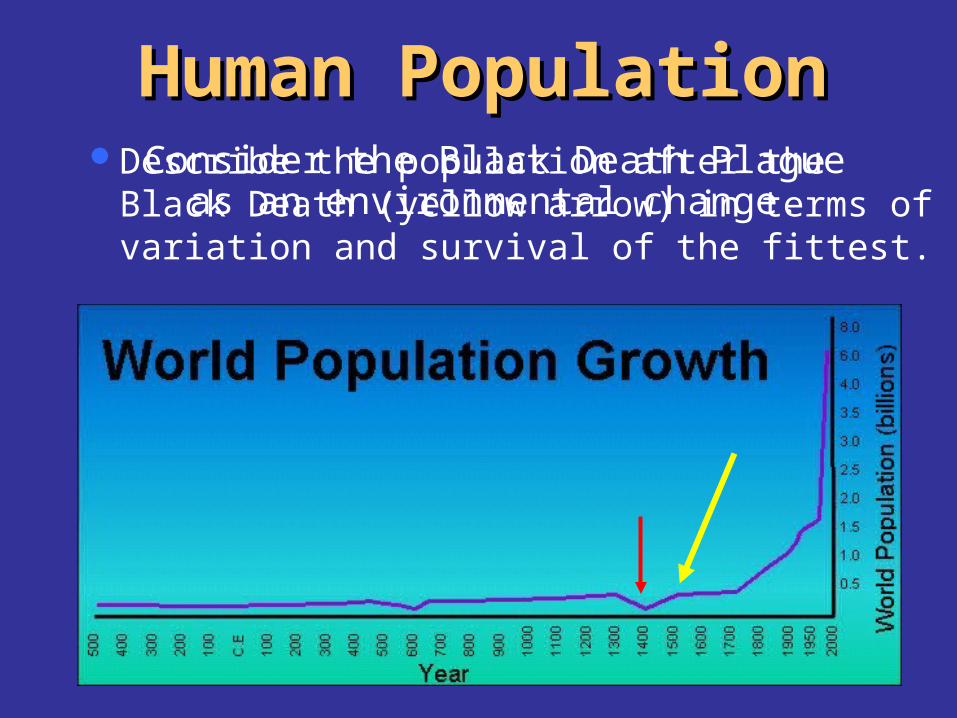
Human PopulationHuman PopulationConsider the Black Death Plague
as an environmental change.Describe the population after the
Black Death (yellow arrow) in terms of variation and survival of the fittest.
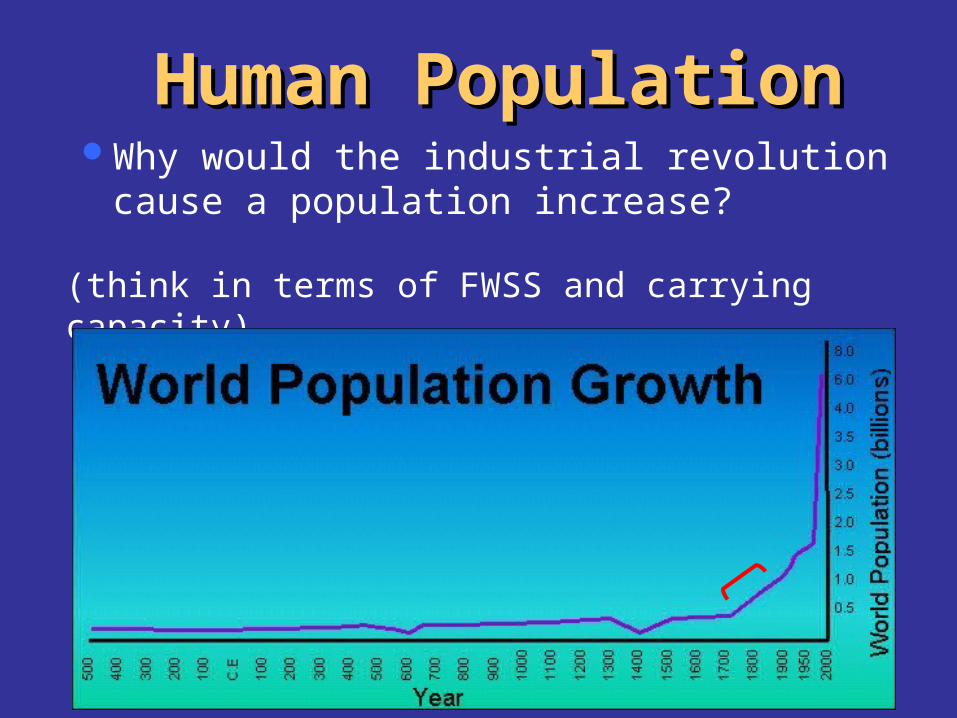
Human PopulationHuman PopulationWhy would the industrial revolution
cause a population increase?
(think in terms of FWSS and carrying capacity)
Human PopulationHuman Population
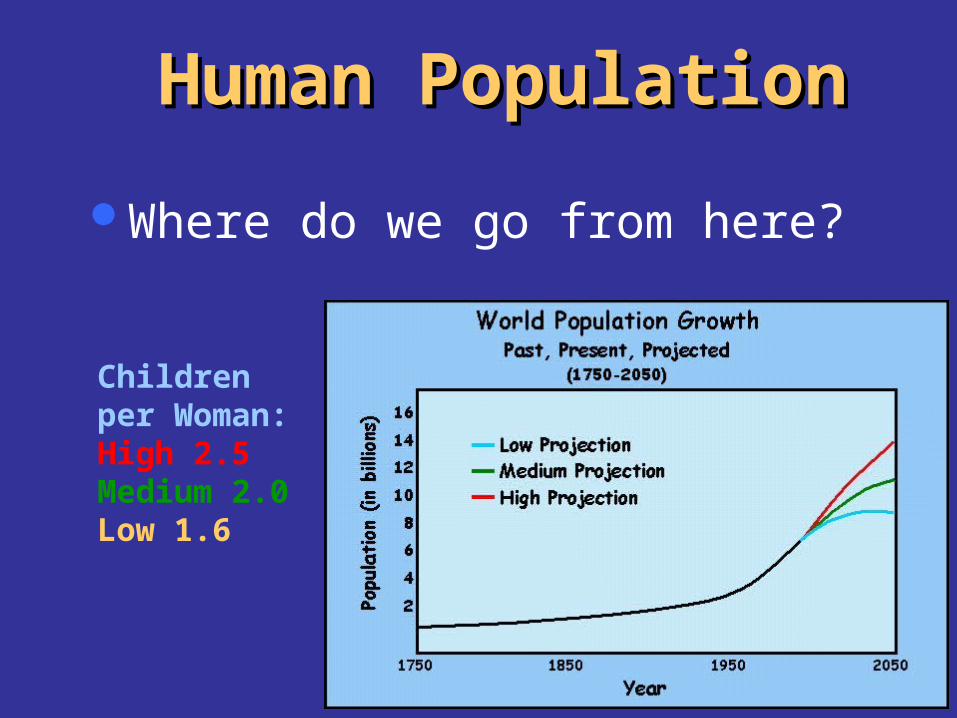
Where do we go from here?
Childrenper Woman:High 2.5Medium 2.0Low 1.6
Human PopulationHuman Population
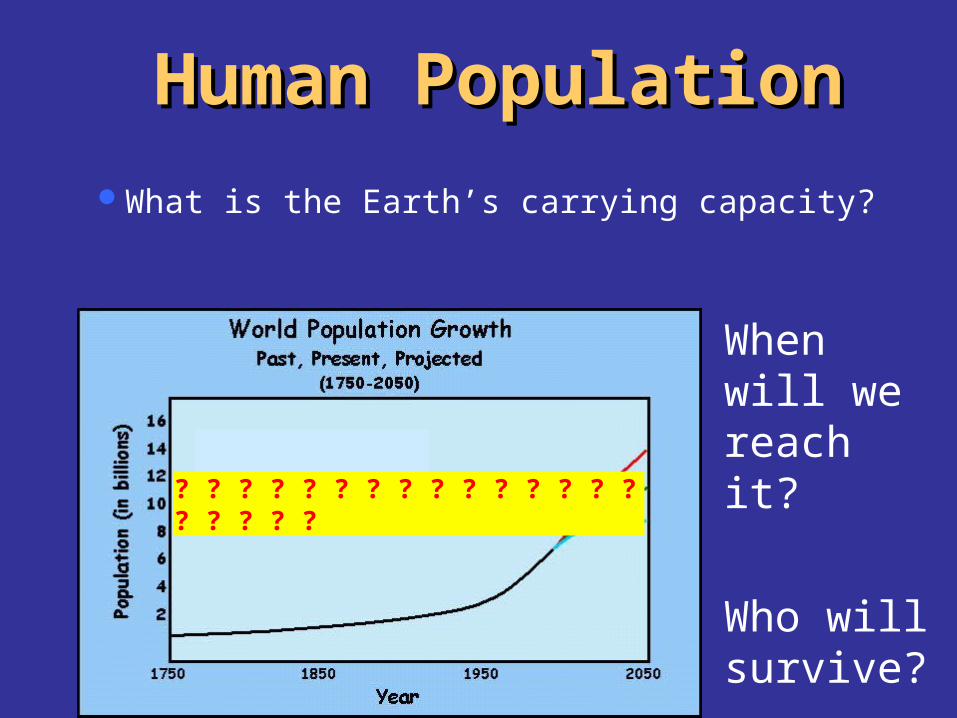
What is the Earth’s carrying capacity?
When will we reach it?
Who will survive?
? ? ? ? ? ? ? ? ? ? ? ? ? ? ? ? ? ? ? ?
Works CitedWorks Cited
“Big Horn Sheep”, “Seabirds”. No date. Online Image. Free Stock Photos. June 15, 2004. <http://www.geekphilosopher.com/MainPage/bkgLinksPhotos.htm>