Embed Size (px)
Citation preview
Respiratory Medicine (2014) 108, 1363e1370
Available online at www.sciencedirect.com
ScienceDirect
journal homepage: www.elsevier .com/locate/rmed
Evolution of occupational asthma: Doescessation of exposure really improveprognosis?
X. Munoz a,b,*, M. Viladrich a, L. Manso b,c, V. del Pozo b,d,S. Quirce b,e, M.J. Cruz a,b, F. Carmona f, A. Sanchez-Pla f,J. Sastre b,c
a Servicio de Neumologıa, Hospital Vall d’Hebron, Barcelona, Spainb Ciber Enfermedades Respiratorias (CibeRes), Spainc Servicio de Alergia, Fundacion Jimenez Dıaz, Madrid, Spaind Servicio de Inmunologıa, IIS Fundacion Jimenez Dıaz, Madrid, Spaine Department of Allergy, Hospital La Paz Institute for Health Research (IdiPAZ), Madrid, Spainf Departamento de Estadıstica, Universidad de Barcelona, Spain
Received 27 February 2014; accepted 1 August 2014Available online 14 August 2014
KEYWORDSSpecific inhalationchallenge;High molecularweight;Low molecular weight
* Corresponding author. Servei de Pnþ34 93 274 6157; fax: þ34 93 274 608
E-mail address: xmunoz@vhebron.
http://dx.doi.org/10.1016/j.rmed.2010954-6111/ª 2014 Elsevier Ltd. All rig
Summary
Aim: To assess the evolution of occupational asthma (OA) depending on whether the patientavoids or continues with exposure to the offending agent.Methods: Study in patients diagnosed with OA using a specific inhalation challenge. Patientsunderwent the following examinations on the same day: clinical interview, physical examina-tion, forced spirometry, methacholine test and determination of total IgE. Clinical improve-ment, deterioration or no change were defined according to the changes seen on the GINAseverity scale at the time of diagnosis.Results: Of the 73 patients finally included, 55 had totally ended exposure and 18 continued tobe exposed at work. Clinical improvement was observed in 47% of those who had terminatedexposure and in 22% of those who remained exposed; clinical deterioration was observed in14% and 17% respectively (p Z 0.805). Logistical regression analysis, including the type ofagent and the persistence or avoidance of exposure among the variables, did not show any pre-dictive factors of clinical evolution. Similarly, the changes in FEV1 and in bronchial hyperre-sponsiveness were not associated with the avoidance or continuation of exposure to thecausative agent.
eumologia, Hospital General Vall d’Hebron, Passeig Vall d’Hebron, 119, 08035 Barcelona, Spain. Tel.:3.net (X.Munoz).
4.08.001hts reserved.
1364 X. Munoz et al.
Conclusions: Avoiding exposure to the causative agent in patients with OA does not seem toimprove prognosis in this disease. Despite these findings, there is insufficient evidence torecommend a change in current management guidelines.ª 2014 Elsevier Ltd. All rights reserved.
Introduction
Occupational asthma (OA) is the most frequent work-related respiratory disease in developed countries [1,2]and it is estimated that roughly 10% cases of bronchialasthma and between 15 and 25% of adult onset asthma maybe of occupational origin [3,4].
For workers with OA caused by a respiratory sensitizer,complete and definitive removal from exposure to thesensitizing agent has usually been recommended as themost efficient therapeutic approach [5e9]. However,bearing in mind that cessation of exposure is often notfeasible [10], in recent years a number of meta-analyseshave been carried out to compare the effects of thesetwo management options [11e14]. The results of thesesystematic reviews indicate that the available data on theprognosis of OA are insufficient to enable physicians toprovide confident, informed advice to patients with thedisease.
Probably this conclusion is reached because the majorityof the more than 100 papers published so far are hetero-geneous single-center studies, with small patient samplesand based on a single causative agent; all apply an obser-vational approach and, for ethical reasons, none haverandomized patients to avoid or continue exposure to thecausative agent [15,16].
The aim of the present study is to assess the evolution ofall patients diagnosed with OA in the last ten years at twocenters in our country according to the persistence orcessation of exposure to the causative agent and, on thebasis of the GINA classification, of asthma severity [17]. Thestudy design also allows an assessment of the influence onthe prognosis of OA of variables that have not been widelystudied to date, such as the medical treatment receivedand the type of causative agent.
Material and methods
Patients and design
This cross-sectional study was approved by the EthicsCommittee of the two participating centers. Using the da-tabases from each center, all patients who had been diag-nosed with immunological OA by specific inhalationchallenge (SIC) were selected. All patients included had atleast one year of follow-up since diagnosis. BetweenSeptember 2010 and June 2011, patients were scheduledfor a visit at the pulmonary function laboratory after havingdiscontinued treatment with inhaled corticosteroids andlong-acting beta2 agonists 24 h previously and the use ofshort-acting beta2 agonists at least six hours previously. All
patients provided written informed consent prior toparticipation.
First, a careful review of clinical histories at the time ofdiagnosis was carried out. The GINA classification that pa-tients had at the time of diagnosis was made retrospectivelywith data from the clinical history andwas basedprimarily onthe treatment that patients were receiving at this time.Later, patients were interviewed again, placing specialemphasis on whether they had avoided exposure with thecausative agent, time between diagnosis and avoidance ofexposure and, in the case of persistence of exposure,whether they worked with protection or not. They were alsoasked about any medication they used. With this informa-tion, the classification of asthma severity was established inaccordance with the new GINA guidelines [17]. Patients alsocompleted the asthma control questionnaire (ACQ) [18].Spirometry and a methacholine challenge were then per-formed. Finally, blood analysis was performed, and eosino-phil count and total IgE were recorded.
Patientswere considered to present clinical improvementor deterioration when a change in the GINA asthma severityclassification in either direction was observed. Improvementor deterioration in bronchial hyperresponsiveness and/or thedegree of bronchial obstruction was recorded when changesin the PC20 > 2 folds were observed or in FEV1 > 10% withrespect to the value at the time of diagnosis.
Atopy and smoking status
Patients were considered atopic if they had at least onepositive prick test to any common environmental allergen[19]. Non-smokers were patients who had never smokedand ex-smokers were those who had not smoked for at leastsix months. The number of pack-years was calculated.
Spirometry and methacholine challenge
Spirometry was performed with a Datospir 200 (Sibel, Bar-celona) instrument, following the European Respiratory So-ciety (ERS) and American Thoracic Society (ATS) guidelines[20]. The reference values used were those proposed forthe Mediterranean population [21]. Bronchial challenge withmethacholine was performed with the method described byChai et al. [22] (Online repository). The methacholine chal-lenge was considered negative if the PC20 FEV1 was higherthan 16 mg/ml, in accordance with ATS guidelines [23].
Statistical analysis
Data are tabulated providing median and range of eachvariable for quantitative variables and absolute frequencies
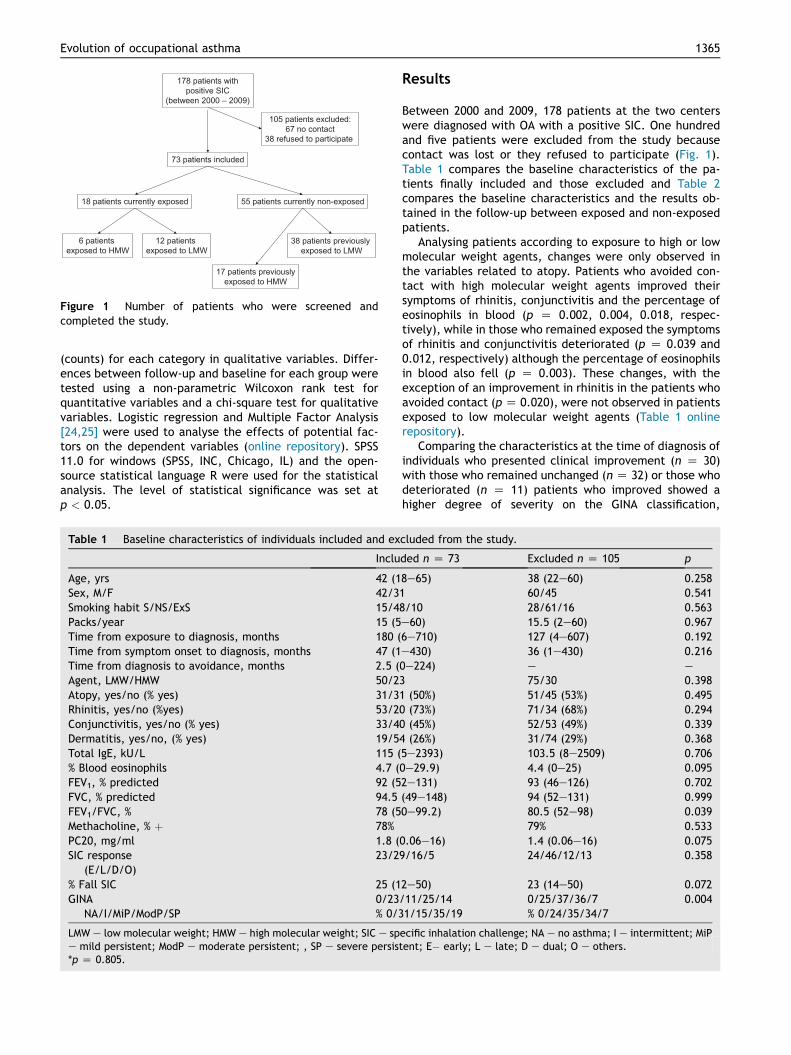
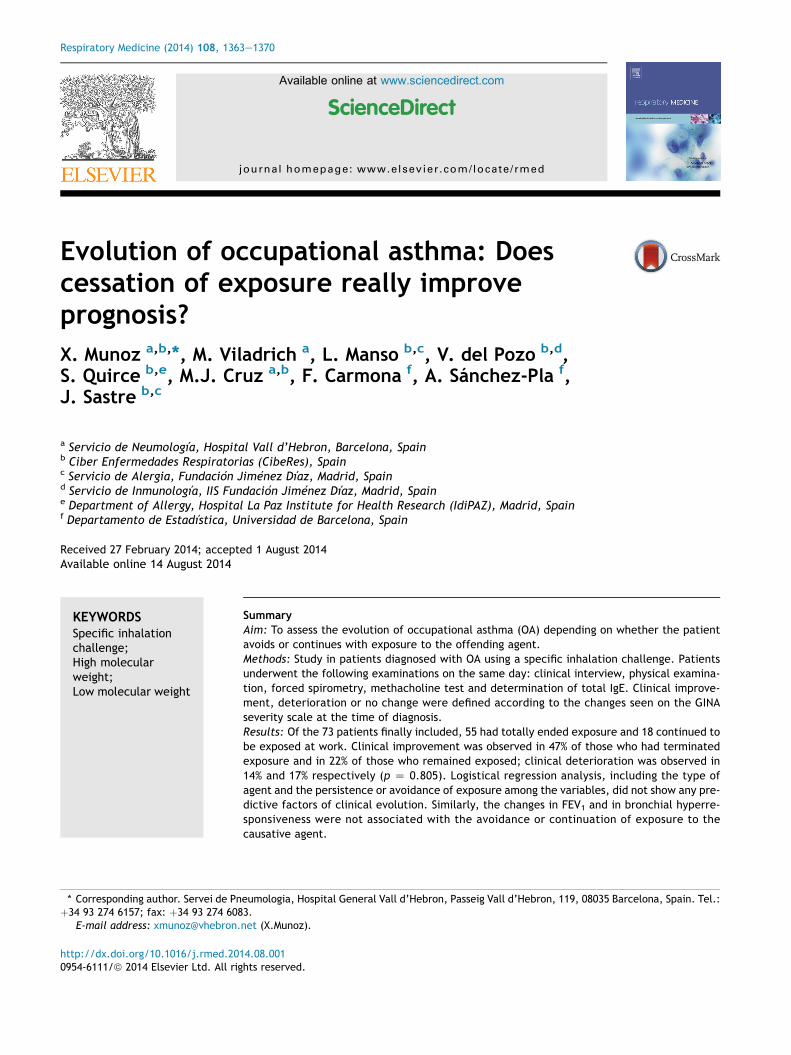
Figure 1 Number of patients who were screened andcompleted the study.
Evolution of occupational asthma 1365
(counts) for each category in qualitative variables. Differ-ences between follow-up and baseline for each group weretested using a non-parametric Wilcoxon rank test forquantitative variables and a chi-square test for qualitativevariables. Logistic regression and Multiple Factor Analysis[24,25] were used to analyse the effects of potential fac-tors on the dependent variables (online repository). SPSS11.0 for windows (SPSS, INC, Chicago, IL) and the open-source statistical language R were used for the statisticalanalysis. The level of statistical significance was set atp < 0.05.
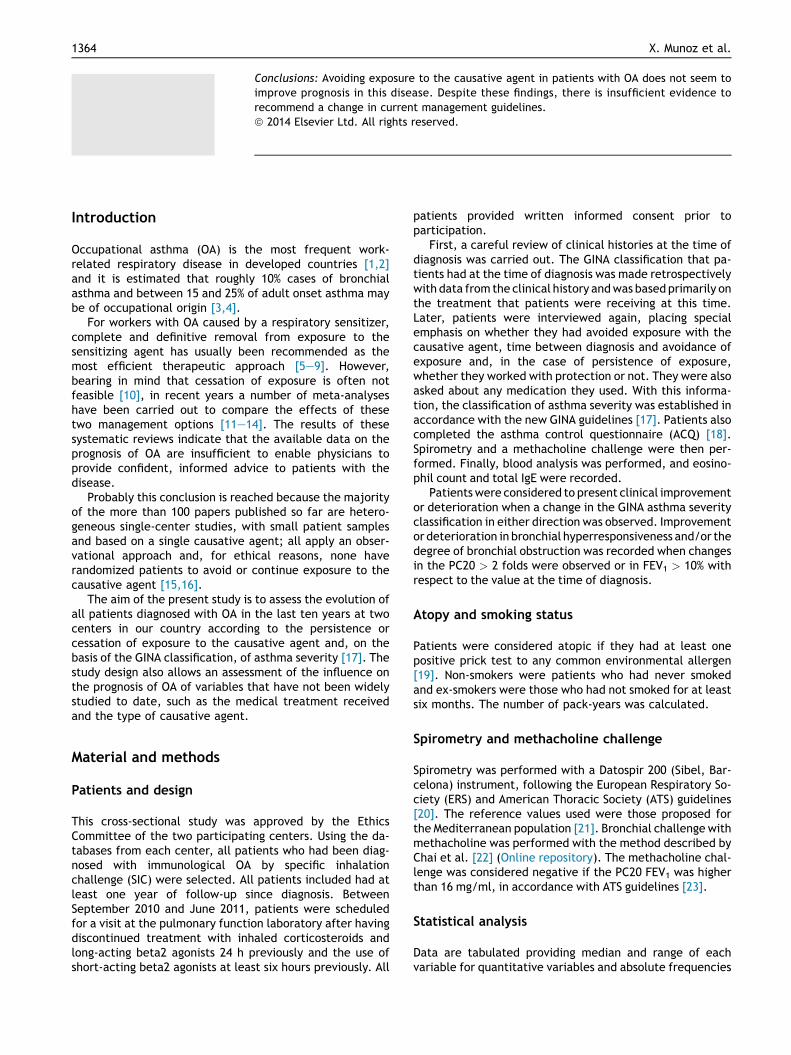
Table 1 Baseline characteristics of individuals included and ex
Inclu
Age, yrs 42 (1Sex, M/F 42/3Smoking habit S/NS/ExS 15/4Packs/year 15 (5Time from exposure to diagnosis, months 180 (Time from symptom onset to diagnosis, months 47 (1Time from diagnosis to avoidance, months 2.5 (Agent, LMW/HMW 50/2Atopy, yes/no (% yes) 31/3Rhinitis, yes/no (%yes) 53/2Conjunctivitis, yes/no (% yes) 33/4Dermatitis, yes/no, (% yes) 19/5Total IgE, kU/L 115 (% Blood eosinophils 4.7 (FEV1, % predicted 92 (5FVC, % predicted 94.5FEV1/FVC, % 78 (5Methacholine, % þ 78%PC20, mg/ml 1.8 (SIC response
(E/L/D/O)23/2
% Fall SIC 25 (1GINA
NA/I/MiP/ModP/SP0/23% 0/3
LMW e low molecular weight; HMW e high molecular weight; SIC e spe mild persistent; ModP e moderate persistent; , SP e severe persist*p Z 0.805.
Results
Between 2000 and 2009, 178 patients at the two centerswere diagnosed with OA with a positive SIC. One hundredand five patients were excluded from the study becausecontact was lost or they refused to participate (Fig. 1).Table 1 compares the baseline characteristics of the pa-tients finally included and those excluded and Table 2compares the baseline characteristics and the results ob-tained in the follow-up between exposed and non-exposedpatients.
Analysing patients according to exposure to high or lowmolecular weight agents, changes were only observed inthe variables related to atopy. Patients who avoided con-tact with high molecular weight agents improved theirsymptoms of rhinitis, conjunctivitis and the percentage ofeosinophils in blood (p Z 0.002, 0.004, 0.018, respec-tively), while in those who remained exposed the symptomsof rhinitis and conjunctivitis deteriorated (p Z 0.039 and0.012, respectively) although the percentage of eosinophilsin blood also fell (p Z 0.003). These changes, with theexception of an improvement in rhinitis in the patients whoavoided contact (p Z 0.020), were not observed in patientsexposed to low molecular weight agents (Table 1 onlinerepository).
Comparing the characteristics at the time of diagnosis ofindividuals who presented clinical improvement (n Z 30)with those who remained unchanged (n Z 32) or those whodeteriorated (n Z 11) patients who improved showed ahigher degree of severity on the GINA classification,
cluded from the study.
ded n Z 73 Excluded n Z 105 p
8e65) 38 (22e60) 0.2581 60/45 0.5418/10 28/61/16 0.563e60) 15.5 (2e60) 0.9676e710) 127 (4e607) 0.192e430) 36 (1e430) 0.2160e224) e e
3 75/30 0.3981 (50%) 51/45 (53%) 0.4950 (73%) 71/34 (68%) 0.2940 (45%) 52/53 (49%) 0.3394 (26%) 31/74 (29%) 0.3685e2393) 103.5 (8e2509) 0.7060e29.9) 4.4 (0e25) 0.0952e131) 93 (46e126) 0.702(49e148) 94 (52e131) 0.9990e99.2) 80.5 (52e98) 0.039
79% 0.5330.06e16) 1.4 (0.06e16) 0.0759/16/5 24/46/12/13 0.358
2e50) 23 (14e50) 0.072/11/25/141/15/35/19
0/25/37/36/7% 0/24/35/34/7
0.004
ecific inhalation challenge; NA e no asthma; I e intermittent; MiPent; E� early; L e late; D e dual; O e others.
Table 2 Baseline and follow-up characteristics of patients finally included (divided according to exposure/non-exposure tothe causative agent).
Non-exposed n Z 55 Exposed n Z 18
Baseline Follow-up p Baseline Follow-up p
Age, yrs 41 (18e65) e e 44 (25e57) e e
Sex, M/F 35/20 e e 7/11 e e
Smoking habitS/NS/ExS
11/36/8 4/12/2
Pack/year 15 (5e60) 14.5 (7e21)Time from exposure to diagnosis,
months120 (6e710) e e 242 (12e539) e e
Time from symptom onset todiagnosis, months
48 (2e377) e e 41 (1e430) e e
Time from diagnosis to avoidance,months
e 1.5 (0e224) e e 30 (6e120) e
Agent, LMW/HMW 38/17 e e 12/6 e e
Atopy, yes/no (% yes) 23/21 (52%) e e 8/10 (44%) e e
Rhinitis, yes/no (% yes) 39/16 (71%) 22/32 (41%) 0.001 14/4 (78%) 14/4 (78%) 0.182Conjunctivitis, yes/no (% yes) 25/30 (45%) 13/41 (24%) 0.027 8/10 (44%) 9/9 (50%) 0.149Dermatitis, yes/no (% yes) 13/42 (31%) 6/48 (11%) 0.065 6/12 (33%) 4/14 (22%) 0.125Total IgE; kU/L 118 (5e2393) 101 (5.9e1611) 0.858 75 (10e696) 105.5 (18e1212) 0.362% Blood eosinophils 4.5 (0e29.9) 3.0 (0.9e29.2) 0.006 5 (0e25) 2.6 (0.8e4.8) 0.028FEV1; % predicted 93 (60e130) 90 (52e131) 0.072 89.5 (64e113) 93 (60e131) 0.554FVC; % predicted 95.5 (71e148) 91.5 (49e138) 0.011 93 (74e123) 90 (70e120) 0.434FEV1/FVC% 78 (58e99.2) 77 (50e97) 0.150 76 (52e92) 78.3 (58.4e89.7) 0.777Methacholine, % þ 89% 78% 0.0001 67% 51% 0.006PC20, mg/ml 2 (0.06e16) 1.6 (0.06e16) 0.780 1.2 (0.13e8) 1.3 (0.4e8.5) 0.925Response to SIC (E/L/D/O) 17/24/12/2 e e 6/5/4/3 e e
% fall SIC 25 (12e50) e e 22 (8e41) e e
GINANA/I/MiP/ModP/SP
0/16/6/20/13 1/30/6/8/10 0.001 0/7/5/5/1 0/8/4/4/2 0.861
Better/worse/same* e 26/8/2147%/14%/38%
e 4/3/1122%/17%/61%
ACQ: Control/Parcial Control/no control** e 34/14/762%/25%/13%
e 13/2/372%/15%/23%
LMW e low molecular weight; HMW e high molecular weight; SIC e specific inhalation challenge; NA e no asthma; , I e intermittent; MiPe mild persistent; ModP e moderate persistent; , SP e severe persistent; E� early; L e late; D e dual; O e others.*p Z 0.805 **p Z 0.437.
1366 X. Munoz et al.
although they had higher FEV1 and better FVC than thosewho deteriorated (Table 3). No significant differences wereobserved in the univariate analysis in the rest of the vari-ables analysed.
Performing a logistical regression analysis consideringthe changes in the GINA classification as independent var-iable and comparing subjects who improved with those whoremained stable or deteriorated, no predictors of thesechanges in the GINA classification were found (Table 2online supplement). Only one model which includedavoidance of the agent, better FEV1 and better FEV1/FVC%quotient/ratio presented a sensitivity of 77% and a speci-ficity of 65%, although the differences were not significant(Fig. 2, Table 3 online supplement). In the same analysis,considering the changes in FEV1 or in PC20 as independentvariables, no predictors of the effect were found (Table 2online repository).
Performing a new logistic regression analysis, alsoconsidering the changes in the GINA classification as inde-pendentvariablebutcomparing the individualswho improved
or remained stable with those who deteriorated, again novariables predicting the effect were found (Table 4 onlinerepository). Only one model, which in this case includedtimeelapsed between symptomonset anddiagnosis, a poorerFEV1, FVCandFEV1/FVC%,presenteda sensitivityof 84%andaspecificity of 36%, although again the differences were notsignificant (Fig. 3, Table 5 online repository). Interestingly,neitheravoidanceof thecausativeagentnor the typeofagentwas associated with worse prognosis.
Multiple Factor Analysis showed that with three com-ponents the percentage of variability explained was 36.8%.However, when four variables were removed a rate of 50%was obtained with the three first components, the resultsbeing very similar. Representing the subjects in the threemain axes in three dimensions, no groupings were formedrelated to the type of causative agent and continuation orcessation of the exposure. The first axis of the graph isrelated to improvement or deterioration, and so the chartsuggests that avoiding exposure is not related to improve-ment or deterioration (Fig. 4).
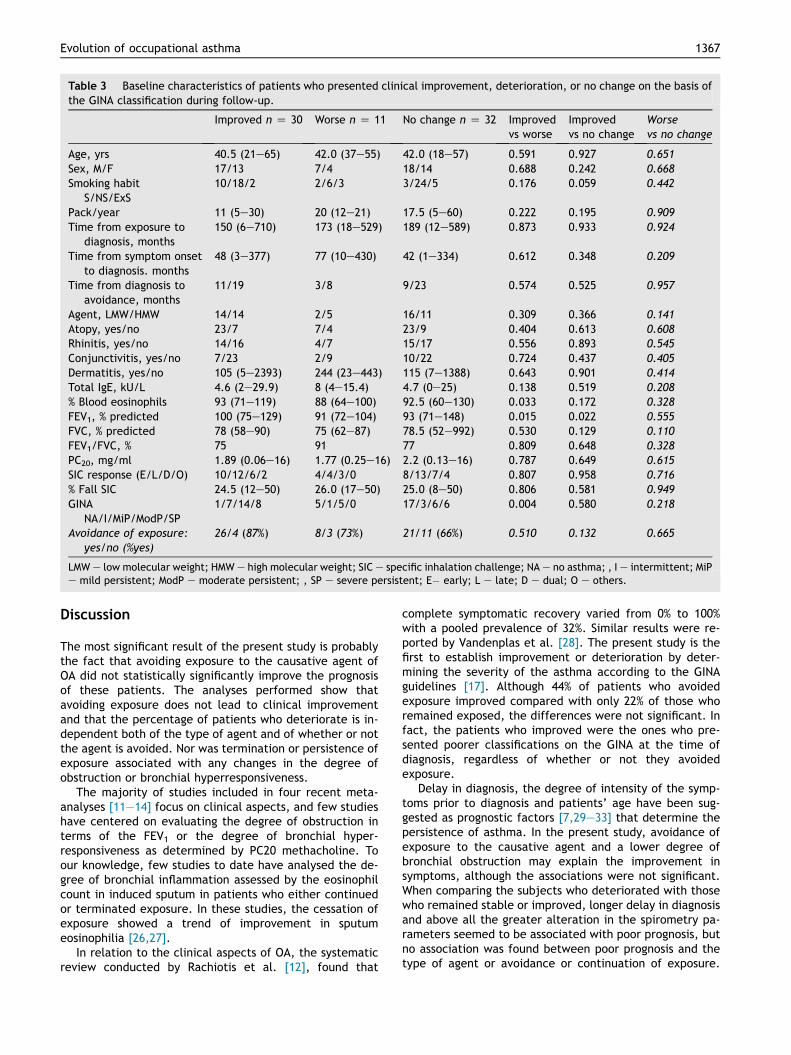
Table 3 Baseline characteristics of patients who presented clinical improvement, deterioration, or no change on the basis ofthe GINA classification during follow-up.
Improved n Z 30 Worse n Z 11 No change n Z 32 Improvedvs worse
Improvedvs no change
Worsevs no change
Age, yrs 40.5 (21e65) 42.0 (37e55) 42.0 (18e57) 0.591 0.927 0.651Sex, M/F 17/13 7/4 18/14 0.688 0.242 0.668Smoking habit
S/NS/ExS10/18/2 2/6/3 3/24/5 0.176 0.059 0.442
Pack/year 11 (5e30) 20 (12e21) 17.5 (5e60) 0.222 0.195 0.909Time from exposure to
diagnosis, months150 (6e710) 173 (18e529) 189 (12e589) 0.873 0.933 0.924
Time from symptom onsetto diagnosis. months
48 (3e377) 77 (10e430) 42 (1e334) 0.612 0.348 0.209
Time from diagnosis toavoidance, months
11/19 3/8 9/23 0.574 0.525 0.957
Agent, LMW/HMW 14/14 2/5 16/11 0.309 0.366 0.141Atopy, yes/no 23/7 7/4 23/9 0.404 0.613 0.608Rhinitis, yes/no 14/16 4/7 15/17 0.556 0.893 0.545Conjunctivitis, yes/no 7/23 2/9 10/22 0.724 0.437 0.405Dermatitis, yes/no 105 (5e2393) 244 (23e443) 115 (7e1388) 0.643 0.901 0.414Total IgE, kU/L 4.6 (2e29.9) 8 (4e15.4) 4.7 (0e25) 0.138 0.519 0.208% Blood eosinophils 93 (71e119) 88 (64e100) 92.5 (60e130) 0.033 0.172 0.328FEV1, % predicted 100 (75e129) 91 (72e104) 93 (71e148) 0.015 0.022 0.555FVC, % predicted 78 (58e90) 75 (62e87) 78.5 (52e992) 0.530 0.129 0.110FEV1/FVC, % 75 91 77 0.809 0.648 0.328PC20, mg/ml 1.89 (0.06e16) 1.77 (0.25e16) 2.2 (0.13e16) 0.787 0.649 0.615SIC response (E/L/D/O) 10/12/6/2 4/4/3/0 8/13/7/4 0.807 0.958 0.716% Fall SIC 24.5 (12e50) 26.0 (17e50) 25.0 (8e50) 0.806 0.581 0.949GINA
NA/I/MiP/ModP/SP1/7/14/8 5/1/5/0 17/3/6/6 0.004 0.580 0.218
Avoidance of exposure:yes/no (%yes)
26/4 (87%) 8/3 (73%) 21/11 (66%) 0.510 0.132 0.665
LMW e low molecular weight; HMW e high molecular weight; SIC e specific inhalation challenge; NA e no asthma; , I e intermittent; MiPe mild persistent; ModP e moderate persistent; , SP e severe persistent; E� early; L e late; D e dual; O e others.
Evolution of occupational asthma 1367
Discussion
The most significant result of the present study is probablythe fact that avoiding exposure to the causative agent ofOA did not statistically significantly improve the prognosisof these patients. The analyses performed show thatavoiding exposure does not lead to clinical improvementand that the percentage of patients who deteriorate is in-dependent both of the type of agent and of whether or notthe agent is avoided. Nor was termination or persistence ofexposure associated with any changes in the degree ofobstruction or bronchial hyperresponsiveness.
The majority of studies included in four recent meta-analyses [11e14] focus on clinical aspects, and few studieshave centered on evaluating the degree of obstruction interms of the FEV1 or the degree of bronchial hyper-responsiveness as determined by PC20 methacholine. Toour knowledge, few studies to date have analysed the de-gree of bronchial inflammation assessed by the eosinophilcount in induced sputum in patients who either continuedor terminated exposure. In these studies, the cessation ofexposure showed a trend of improvement in sputumeosinophilia [26,27].
In relation to the clinical aspects of OA, the systematicreview conducted by Rachiotis et al. [12], found that
complete symptomatic recovery varied from 0% to 100%with a pooled prevalence of 32%. Similar results were re-ported by Vandenplas et al. [28]. The present study is thefirst to establish improvement or deterioration by deter-mining the severity of the asthma according to the GINAguidelines [17]. Although 44% of patients who avoidedexposure improved compared with only 22% of those whoremained exposed, the differences were not significant. Infact, the patients who improved were the ones who pre-sented poorer classifications on the GINA at the time ofdiagnosis, regardless of whether or not they avoidedexposure.
Delay in diagnosis, the degree of intensity of the symp-toms prior to diagnosis and patients’ age have been sug-gested as prognostic factors [7,29e33] that determine thepersistence of asthma. In the present study, avoidance ofexposure to the causative agent and a lower degree ofbronchial obstruction may explain the improvement insymptoms, although the associations were not significant.When comparing the subjects who deteriorated with thosewho remained stable or improved, longer delay in diagnosisand above all the greater alteration in the spirometry pa-rameters seemed to be associated with poor prognosis, butno association was found between poor prognosis and thetype of agent or avoidance or continuation of exposure.
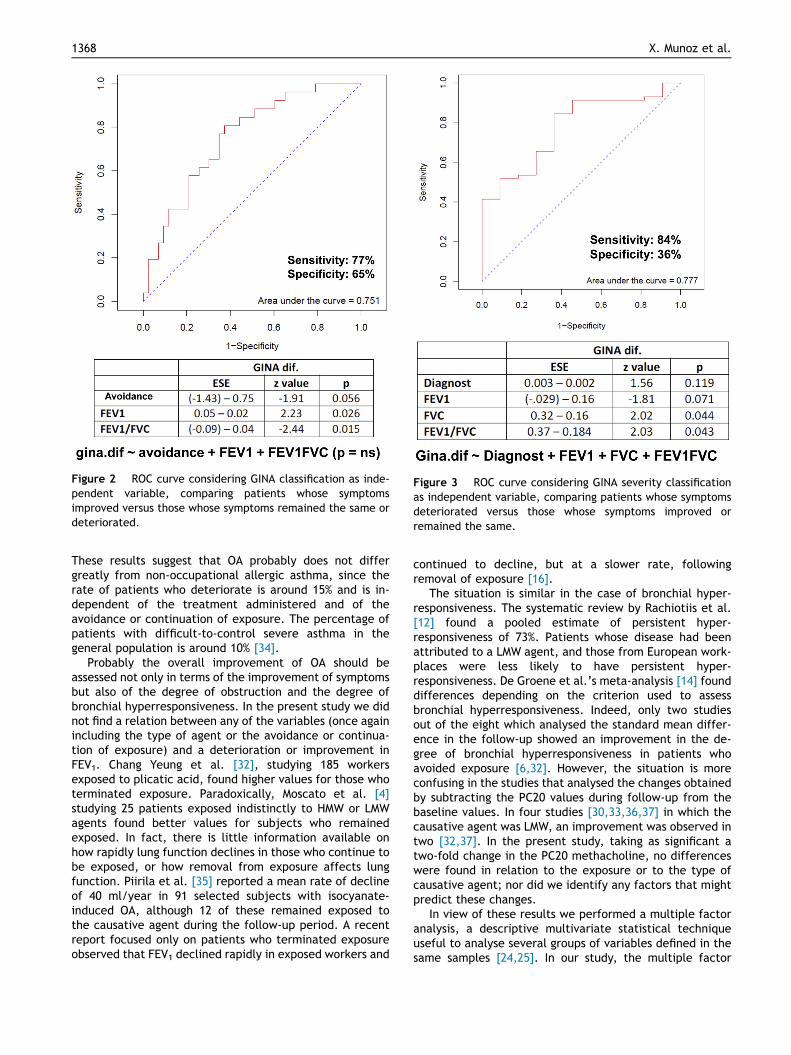
Figure 2 ROC curve considering GINA classification as inde-pendent variable, comparing patients whose symptomsimproved versus those whose symptoms remained the same ordeteriorated.
Figure 3 ROC curve considering GINA severity classificationas independent variable, comparing patients whose symptomsdeteriorated versus those whose symptoms improved orremained the same.
1368 X. Munoz et al.
These results suggest that OA probably does not differgreatly from non-occupational allergic asthma, since therate of patients who deteriorate is around 15% and is in-dependent of the treatment administered and of theavoidance or continuation of exposure. The percentage ofpatients with difficult-to-control severe asthma in thegeneral population is around 10% [34].
Probably the overall improvement of OA should beassessed not only in terms of the improvement of symptomsbut also of the degree of obstruction and the degree ofbronchial hyperresponsiveness. In the present study we didnot find a relation between any of the variables (once againincluding the type of agent or the avoidance or continua-tion of exposure) and a deterioration or improvement inFEV1. Chang Yeung et al. [32], studying 185 workersexposed to plicatic acid, found higher values for those whoterminated exposure. Paradoxically, Moscato et al. [4]studying 25 patients exposed indistinctly to HMW or LMWagents found better values for subjects who remainedexposed. In fact, there is little information available onhow rapidly lung function declines in those who continue tobe exposed, or how removal from exposure affects lungfunction. Piirila et al. [35] reported a mean rate of declineof 40 ml/year in 91 selected subjects with isocyanate-induced OA, although 12 of these remained exposed tothe causative agent during the follow-up period. A recentreport focused only on patients who terminated exposureobserved that FEV1 declined rapidly in exposed workers and
continued to decline, but at a slower rate, followingremoval of exposure [16].
The situation is similar in the case of bronchial hyper-responsiveness. The systematic review by Rachiotiis et al.[12] found a pooled estimate of persistent hyper-responsiveness of 73%. Patients whose disease had beenattributed to a LMW agent, and those from European work-places were less likely to have persistent hyper-responsiveness. De Groene et al.’s meta-analysis [14] founddifferences depending on the criterion used to assessbronchial hyperresponsiveness. Indeed, only two studiesout of the eight which analysed the standard mean differ-ence in the follow-up showed an improvement in the de-gree of bronchial hyperresponsiveness in patients whoavoided exposure [6,32]. However, the situation is moreconfusing in the studies that analysed the changes obtainedby subtracting the PC20 values during follow-up from thebaseline values. In four studies [30,33,36,37] in which thecausative agent was LMW, an improvement was observed intwo [32,37]. In the present study, taking as significant atwo-fold change in the PC20 methacholine, no differenceswere found in relation to the exposure or to the type ofcausative agent; nor did we identify any factors that mightpredict these changes.
In view of these results we performed a multiple factoranalysis, a descriptive multivariate statistical techniqueuseful to analyse several groups of variables defined in thesame samples [24,25]. In our study, the multiple factor
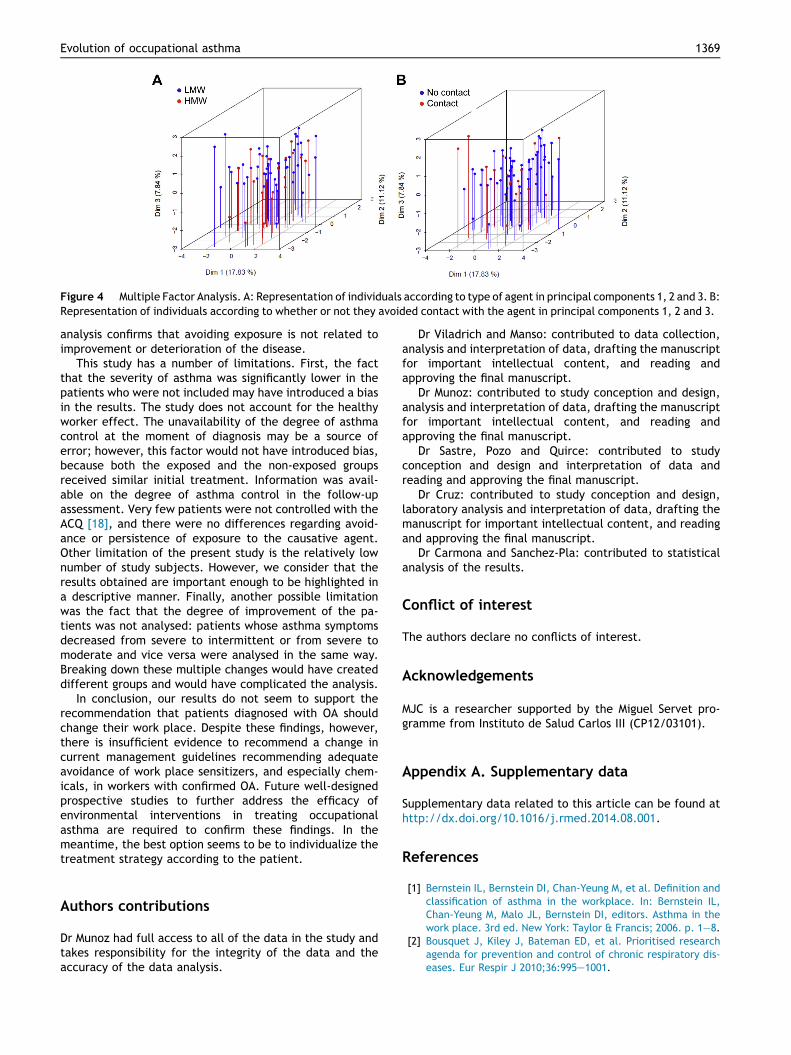
Figure 4 Multiple Factor Analysis. A: Representation of individuals according to type of agent in principal components 1, 2 and 3. B:Representation of individuals according to whether or not they avoided contact with the agent in principal components 1, 2 and 3.
Evolution of occupational asthma 1369
analysis confirms that avoiding exposure is not related toimprovement or deterioration of the disease.
This study has a number of limitations. First, the factthat the severity of asthma was significantly lower in thepatients who were not included may have introduced a biasin the results. The study does not account for the healthyworker effect. The unavailability of the degree of asthmacontrol at the moment of diagnosis may be a source oferror; however, this factor would not have introduced bias,because both the exposed and the non-exposed groupsreceived similar initial treatment. Information was avail-able on the degree of asthma control in the follow-upassessment. Very few patients were not controlled with theACQ [18], and there were no differences regarding avoid-ance or persistence of exposure to the causative agent.Other limitation of the present study is the relatively lownumber of study subjects. However, we consider that theresults obtained are important enough to be highlighted ina descriptive manner. Finally, another possible limitationwas the fact that the degree of improvement of the pa-tients was not analysed: patients whose asthma symptomsdecreased from severe to intermittent or from severe tomoderate and vice versa were analysed in the same way.Breaking down these multiple changes would have createddifferent groups and would have complicated the analysis.
In conclusion, our results do not seem to support therecommendation that patients diagnosed with OA shouldchange their work place. Despite these findings, however,there is insufficient evidence to recommend a change incurrent management guidelines recommending adequateavoidance of work place sensitizers, and especially chem-icals, in workers with confirmed OA. Future well-designedprospective studies to further address the efficacy ofenvironmental interventions in treating occupationalasthma are required to confirm these findings. In themeantime, the best option seems to be to individualize thetreatment strategy according to the patient.
Authors contributions
Dr Munoz had full access to all of the data in the study andtakes responsibility for the integrity of the data and theaccuracy of the data analysis.
Dr Viladrich and Manso: contributed to data collection,analysis and interpretation of data, drafting the manuscriptfor important intellectual content, and reading andapproving the final manuscript.
Dr Munoz: contributed to study conception and design,analysis and interpretation of data, drafting the manuscriptfor important intellectual content, and reading andapproving the final manuscript.
Dr Sastre, Pozo and Quirce: contributed to studyconception and design and interpretation of data andreading and approving the final manuscript.
Dr Cruz: contributed to study conception and design,laboratory analysis and interpretation of data, drafting themanuscript for important intellectual content, and readingand approving the final manuscript.
Dr Carmona and Sanchez-Pla: contributed to statisticalanalysis of the results.
Conflict of interest
The authors declare no conflicts of interest.
Acknowledgements
MJC is a researcher supported by the Miguel Servet pro-gramme from Instituto de Salud Carlos III (CP12/03101).
Appendix A. Supplementary data
Supplementary data related to this article can be found athttp://dx.doi.org/10.1016/j.rmed.2014.08.001.
References
[1] Bernstein IL, Bernstein DI, Chan-Yeung M, et al. Definition andclassification of asthma in the workplace. In: Bernstein IL,Chan-Yeung M, Malo JL, Bernstein DI, editors. Asthma in thework place. 3rd ed. New York: Taylor & Francis; 2006. p. 1e8.
[2] Bousquet J, Kiley J, Bateman ED, et al. Prioritised researchagenda for prevention and control of chronic respiratory dis-eases. Eur Respir J 2010;36:995e1001.
1370 X. Munoz et al.
[3] Kogevinas M, Zock JP, Jarvis D, et al. Exposure to substancesin the workplace and new-onset asthma: an internationalprospective population-based study (ECRHS-II). Lancet 2007;370(9584):336e41.
[4] Moscato G, Dellabianca A, Perfetti L, R, et al. Occupationalasthma. A longitudinal study on the clinical and socioeco-nomic outcome after diagnosis. Chest 1999;115:249e56.
[5] Tarlo SM, Balmes J, Balkissoon R, et al. Diagnosis and man-agement of work-related asthma: American College of Chestphysicians consensus statement. Chest 2008;134:1Se41S.
[6] Munoz X, Gomez-Olles S, Cruz MJ, et al. Course of bronchialhyperresponsiveness in patients with occupational asthmacaused by exposure to persulphate salts. Arch Bronconeumol2008;44:140e5.
[7] Rosenberg N, Garnier R, Rousselin X, et al. Clinical and soci-oprofessional fate of isocyanate-induced asthma. Clin Allergy1987;17:55e61.
[8] Ortega HG, Kreiss K, Schill DP, et al. Fatal asthma frompowdering shark cartilage and review of fatal asthma occu-pational literature. Am J Ind Med 2002;42(1):50e4.
[9] Perfetti L, Cartier A, Gezzo H, et al. Follow-up of occupationalasthma after removal from or diminution of exposure to theresponsible agent: relevance of the length of the interval fromcessation of exposure. Chest 1998;114:398e403.
[10] Vandenplas O, Tore K, Blanch PD. Health and socioeconomicimpact of work-related asthma. Eur Respir J 2003;22:689e97.
[11] Beach J, Rowe BH, Blitz S, et al. Evidence report/technologyassessment no 129 (Prepared by the University of AlbertaEvidence-based Practice Center, under contract no 290-02-0023). AHRQ publication no 06-E003-2. Rockville, MD: Agencyfor Healthcare Research and Quality; November 2005. Avail-able at:, www.ahrq.gov.
[12] Rachiotis G, Savani R, Brant A, et al. The outcome of occu-pational asthma after cessation of exposure: a systematicreview. Thorax 2007;62:147e52.
[13] Vandenplas O, Dressel H, Wilken D, et al., on behalf of the ERSTask Force on the Management of Work-related Asthma.Management of occupational asthma: cessation or reductionof exposure? A systematic review of available evidence. EurRespir J 2011;38:804e11.
[14] de Groene GJ, Pal TM, Beach J, et al. Workplace interventionsfor treatment of occupational asthma. Cochrane DatabaseSyst Rev 2011 May 11;(5):CD006308.
[15] Marabini A, Siracusa A, Stopponi R, et al. Outcome of occu-pational asthma in patients with continuous exposure: a 3year longitudinal study during pharmacologic treatment.Chest 2003;124:2372e6.
[16] Anees W, Moore VC, Burge PS. FEV1 decline in occupationalasthma. Thorax 2006;61(9):751e5.
[17] Global Initiative for Asthma (GINA). Global strategy forasthma management and prevention; 2010. Available from:www.ginasthma.com.
[18] Juniper EF, O’Byrne PM, Guyatt GH, et al. Development andvalidation of a questionnaire to measure asthma control. EurRespir J 1999;14:902e7.
[19] Pepys J. Atopy. In: Gell PGH, Coombes RRA, editors. Clinicalaspects of immunology. Oxford Blackwell Scientific Publica-tions; 1975.
[20] Miller MR, Hankinson J, Brusasco V, , et alATS/ERS Task Force.Standardisation of spirometry. Eur Respir J 2005;26(2):319e38.
[21] Roca J, Sanchis J, Agusti-Vidal A, et al. Spirometric referencesvalues from a Mediterranean population. Bull Eur PhysiopatholRespir 1986;22:217e22.
[22] Chai H, Farr RS, Froehlich LA, et al. Standardization of bron-chial inhalation challenge procedures. J Allergy Clin Immunol1975;56:323e7.
[23] Crapo RO, Casaburi R, Coates AL, et al. Guidelines for meth-acholine and exercise challenge testing-1999. This officialstatement of the American Thoracic Society was adopted bythe ATS Board of Directors, July 1999. Am J Respir Crit CareMed 2000 Jan;161(1):309e29.
[24] Le S, Josse J, Husson F. FactoMineR: an R package for multi-variate analysis. J Stat Softw 2008;25(1):1e18.
[25] R Development Core Team. R: a language and environment forstatistical computing. Vienna, Austria; 2011. ISBN: 3-900051-07-0, http://www.R-project.org.
[26] Talini D, Novelli F, Melosini L, et al. May the reduction ofexposure to specific sensitizers be an alternative to workcessation in occupational asthma? Results from a follow-upstudy. Int Arch Allergy Immunol 2012;157(2):186e93.
[27] Lemiere C, Boulet LP, Chaboillez S. Work-exacerbated asthmaand occupational asthma: do they really differ? J Allergy ClinImmunol 2013;131(3):704e10.
[28] Vandenplas O, Dressel H, Nowak D, et al. ERS task force on theManagement of work-related asthma. What is the optimalmanagement option for occupational asthma? Eur Respir Rev2012 Jun 1;21(124):97e104.
[29] Chan-Yeung M, Maclean L, Paggiaro PL. Follow-up study of 232patients with occupational asthma caused by western redcedar (Thuja plicata). J Allergy Clin Immunol 1987;79:792e6.
[30] Paggiaro PL, Vagaggani B, Bacci E, et al. Prognosis of occu-pational asthma. Eur Respir J 1994;7:761e7.
[31] Paggiaro PL, Loi AM, Rossi O, et al. Follow up study of patientswith respiratory diseasedue toTDI. Clin Allergy1984;14:463e9.
[32] Chan-Yeung M, Lam S, Koener S. Clinical features and naturalhistory of occupational asthma due to red cedar (Thuja pli-cata). Am J Med 1982;72:411e5.
[33] Maestrelli P, Schlunssen V, Mason P, et al. ERS task force onthe management of work-related asthma. Contribution of hostfactors and workplace exposure to the outcome of occupa-tional asthma. Eur Respir Rev 2012 Jun 1;21(124):88e96.
[34] Kupczyk M, Wenzel S. U.S. and European severe asthma co-horts: what can they teach us about severe asthma? J InternMed 2012;272(2):121e32.
[35] Piirila PL, Nordman H, Keskinen HM, et al. Long-term follow-up of hexamethylene diisocyanate-, diphenylmethane diiso-cyanate-, and toluene diisocyanate-induced asthma. Am JRespir Crit Care Med 2000;162(2 Pt 1):516e22.
[36] Mapp CE, Corona PC, De Marzo N, et al. Persistent asthma dueto isocyanates. A follow-up study of subjects with occupa-tional asthma due to toluene diisocyanate (TDI). Am RevRespir Dis 1988 Jun;137(6):1326e9.
[37] Marabini A, Dimich-Ward H, Kwan SY, et al. Clinical and so-cioeconomic features of subjects with red cedar asthma. Afollow-up study. Chest 1993 Sep;104(3):821e4.