Embed Size (px)
Citation preview
EVOLUTION OF MOBILITY:A SHIFT TOWARDS ALTERNATIVE OWNERSHIP
2
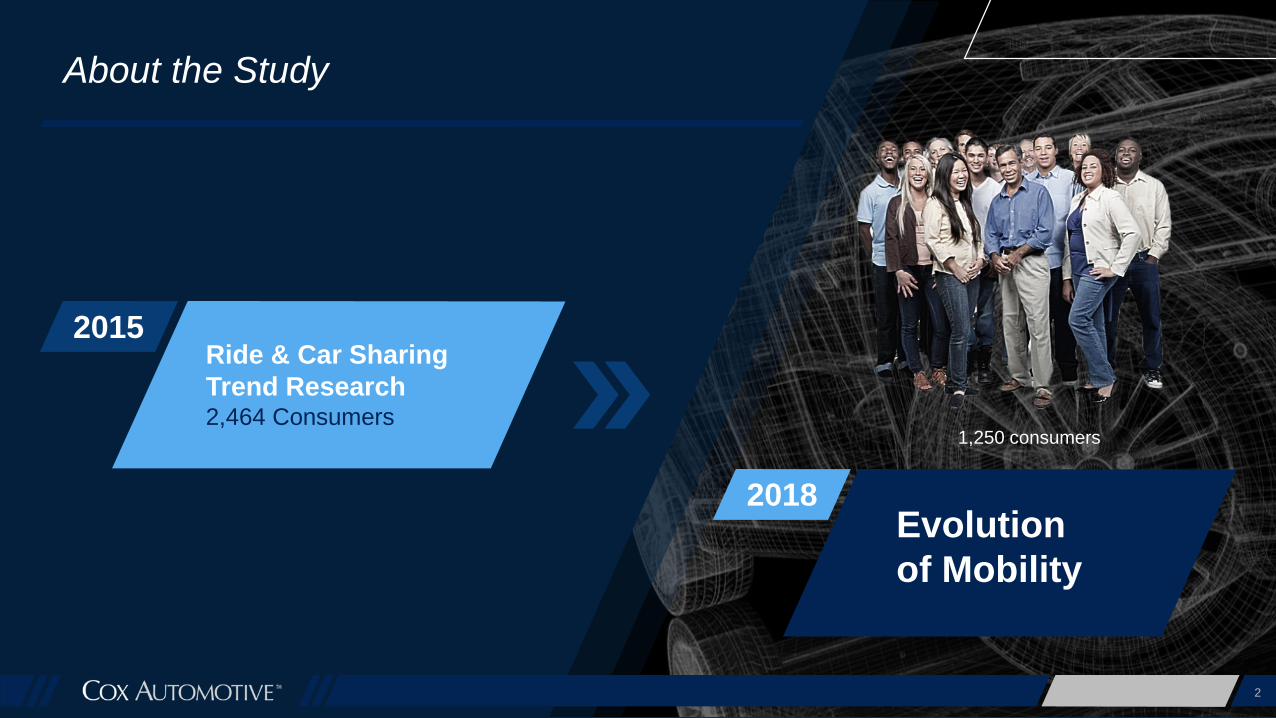
About the Study
1,250 consumers
2015Ride & Car Sharing
Trend Research2,464 Consumers
2018Evolution
of Mobility
2
TRADITIONAL
OWNERSHIP
PUBLIC
TRANSPORTATION
TAXI
3
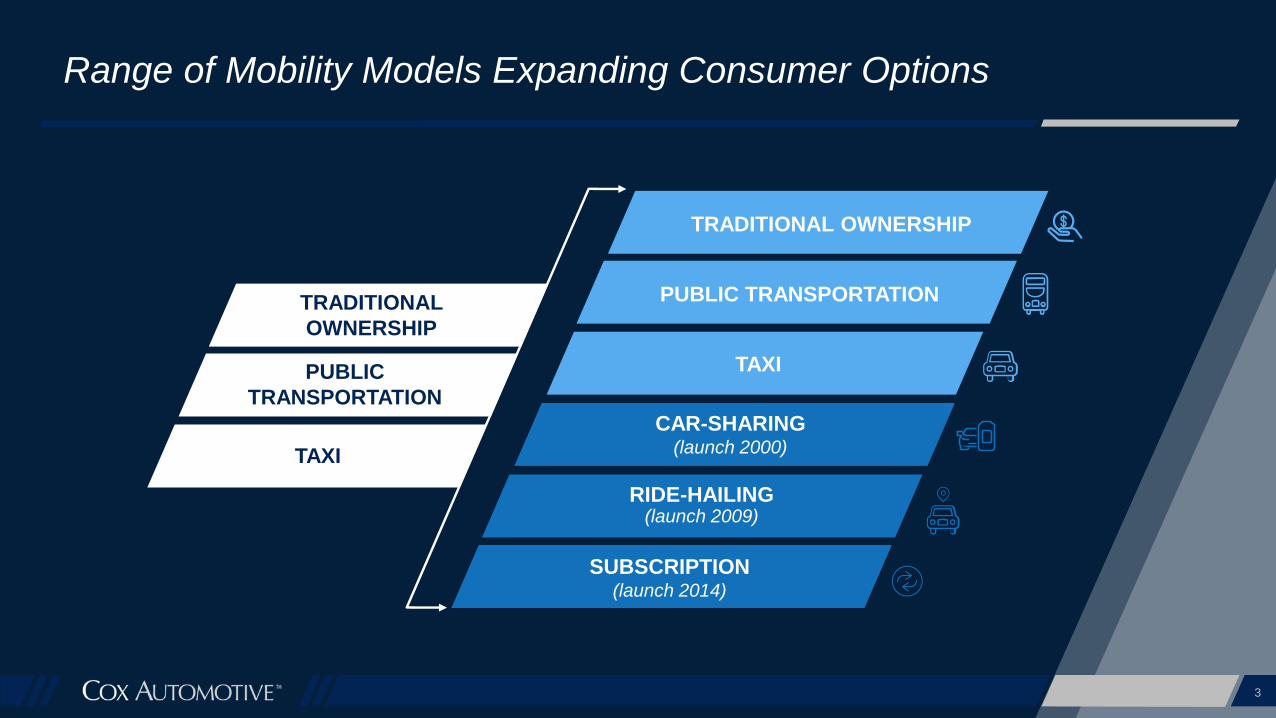
Range of Mobility Models Expanding Consumer Options
RIDE-HAILING(launch 2009)
CAR-SHARING(launch 2000)
SUBSCRIPTION(launch 2014)
TAXI
PUBLIC TRANSPORTATION
TRADITIONAL OWNERSHIP
RIDE-HAILING IS MAINSTREAM; CAR-SHARING REMAINS NICHE
5
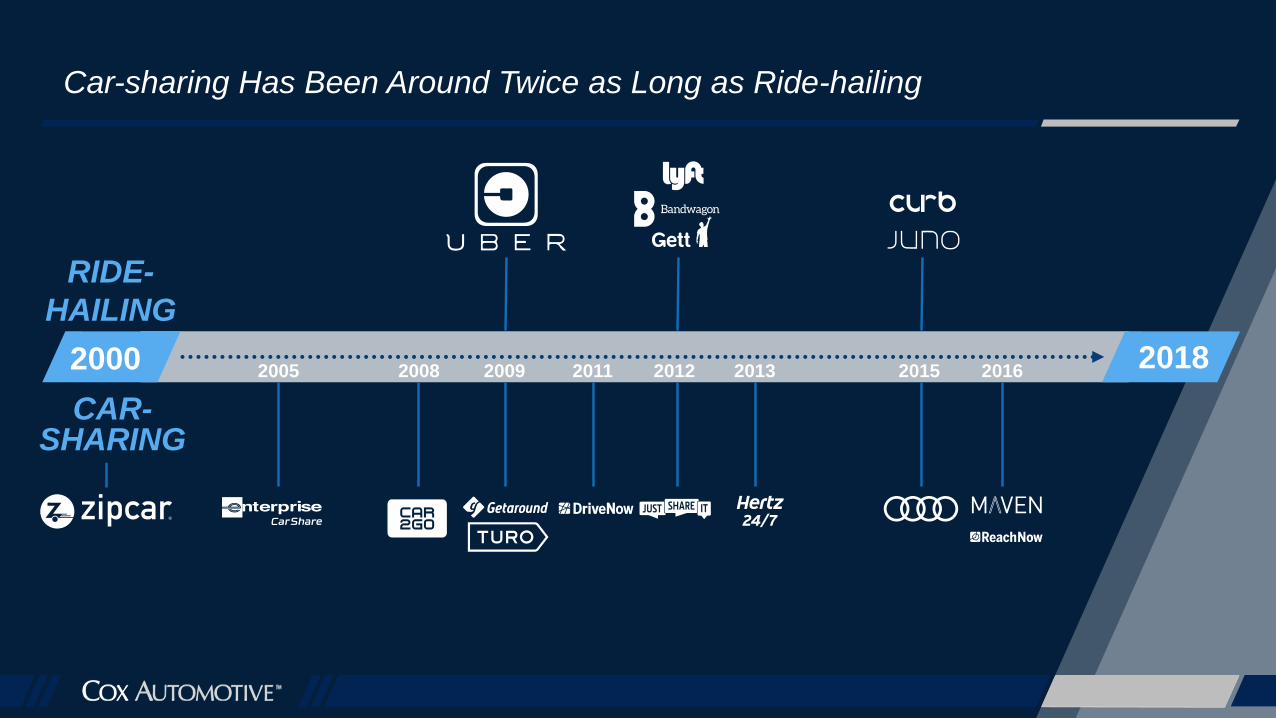
Car-sharing Has Been Around Twice as Long as Ride-hailing
2000 20182005 2008 2009 2011 2012 2013 2015 2016
RIDE-
HAILING
CAR-SHARING
Source: 2018 Cox Automotive Evolution of Mobility Study 6
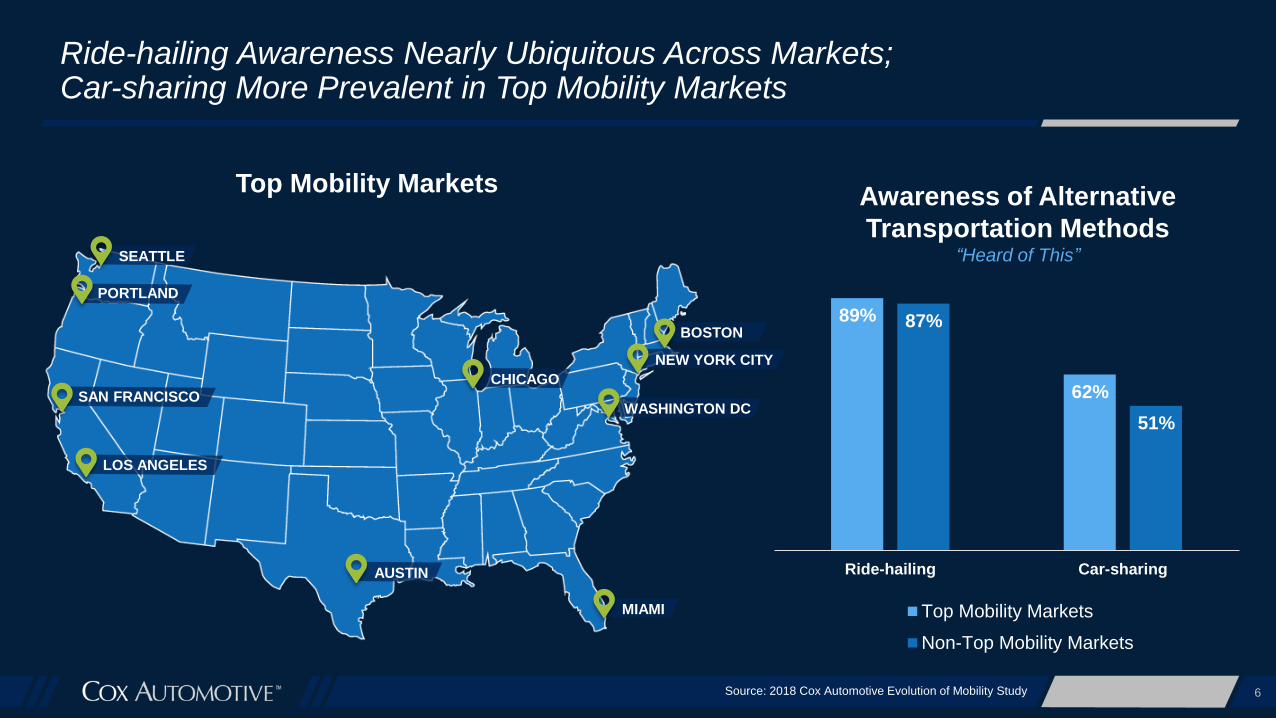
Ride-hailing Awareness Nearly Ubiquitous Across Markets; Car-sharing More Prevalent in Top Mobility Markets
Awareness of Alternative
Transportation Methods“Heard of This”
Top Mobility Markets
LOS ANGELES
SAN FRANCISCO
SEATTLE
PORTLAND
CHICAGO
NEW YORK CITY
BOSTON
MIAMI
WASHINGTON DC
AUSTIN
89%
62%
87%
51%
Ride-hailing Car-sharing
Top Mobility Markets
Non-Top Mobility Markets
Source: 2018 Cox Automotive Evolution of Mobility Study 7
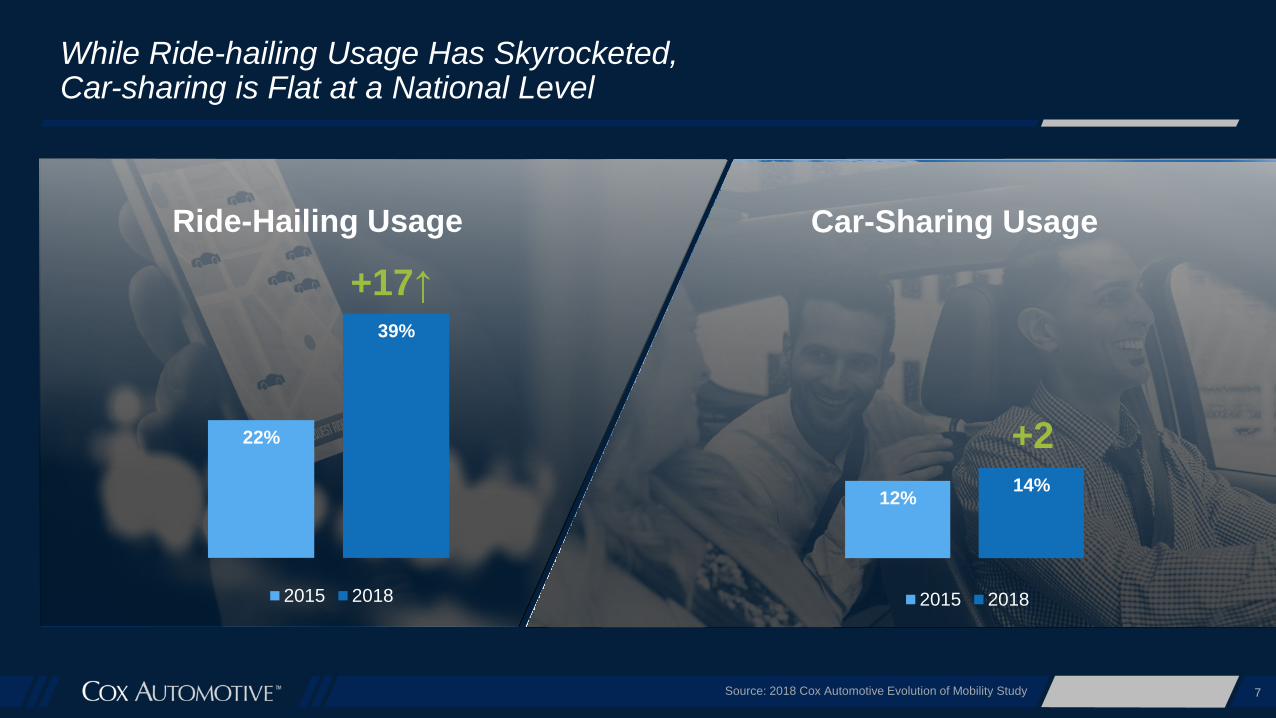
While Ride-hailing Usage Has Skyrocketed, Car-sharing is Flat at a National Level
12%14%
2015 2018
22%
39%
2015 2018
Ride-Hailing Usage Car-Sharing Usage
+17↑
+2
Source: 2018 Cox Automotive Evolution of Mobility Study 8
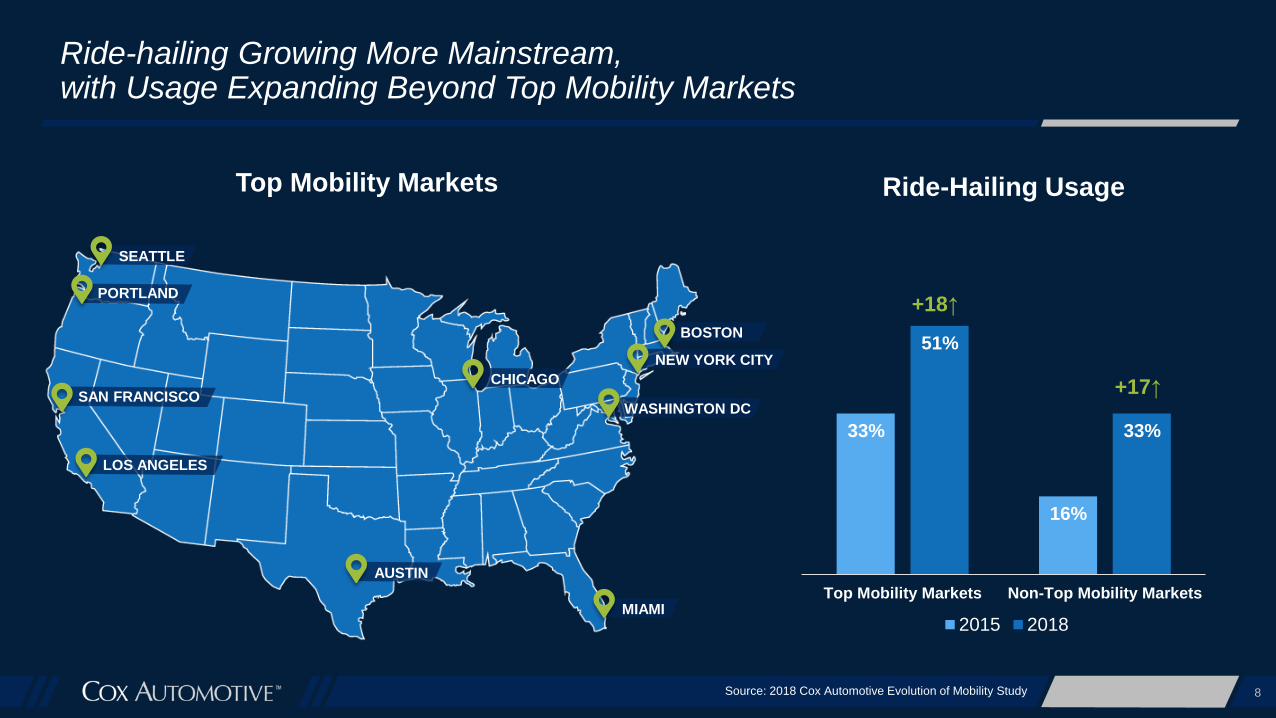
Ride-hailing Growing More Mainstream, with Usage Expanding Beyond Top Mobility Markets
Top Mobility Markets
33%
16%
51%
33%
Top Mobility Markets Non-Top Mobility Markets
2015 2018
+18↑
+17↑
Ride-Hailing Usage
LOS ANGELES
SAN FRANCISCO
SEATTLE
PORTLAND
CHICAGO
NEW YORK CITY
BOSTON
MIAMI
WASHINGTON DC
AUSTIN
9Source: 2018 Cox Automotive Evolution of Mobility Study
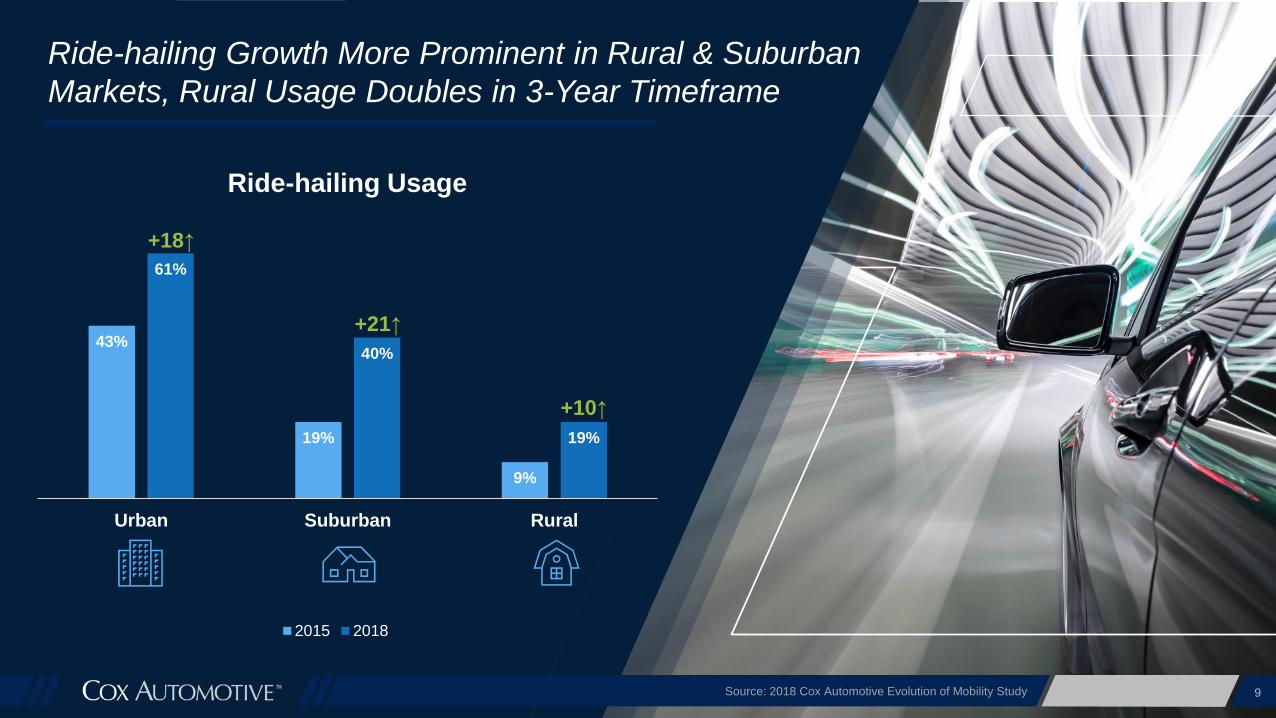
Ride-hailing Growth More Prominent in Rural & Suburban
Markets, Rural Usage Doubles in 3-Year Timeframe
43%
19%
9%
61%
40%
19%
Urban Suburban Rural
2015 2018
+18↑
+21↑
+10↑
Ride-hailing Usage
10Source: 2018 Cox Automotive Evolution of Mobility Study
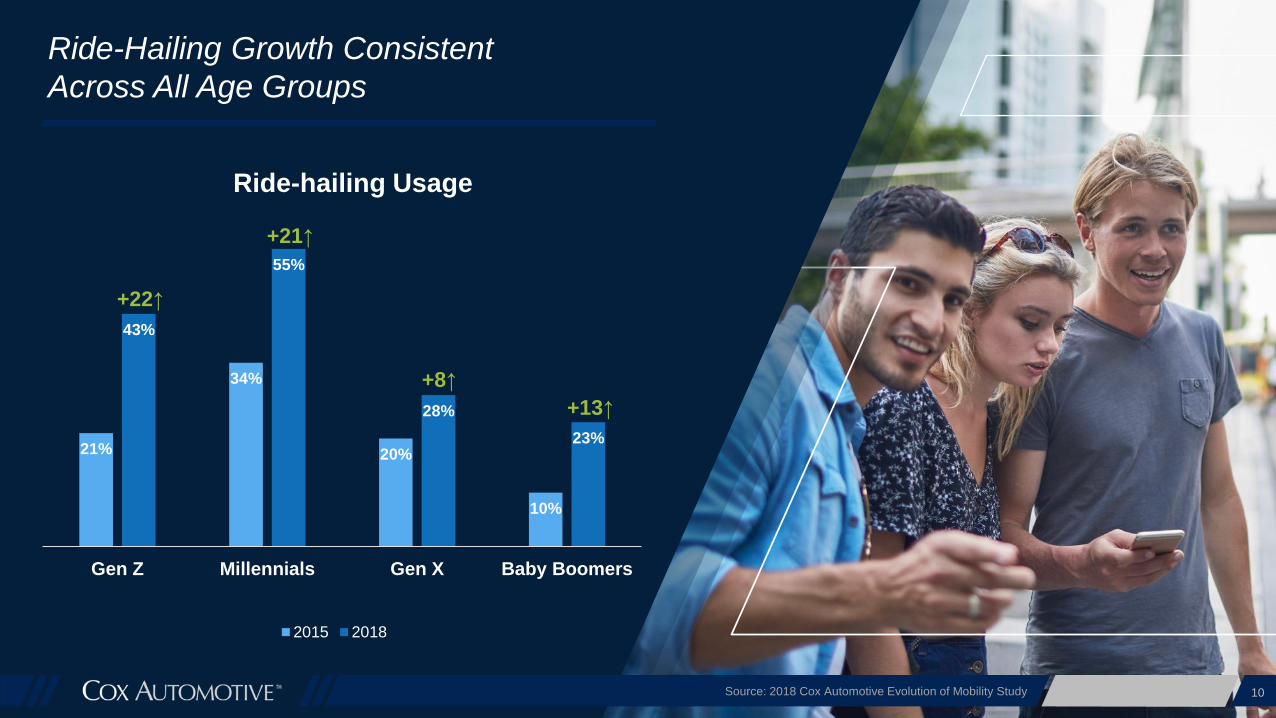
Ride-Hailing Growth Consistent
Across All Age Groups
21%
34%
20%
10%
43%
55%
28%
23%
Gen Z Millennials Gen X Baby Boomers
2015 2018
+22↑
+21↑
+8↑
+13↑
Ride-hailing Usage
Source: 2018 Cox Automotive Evolution of Mobility Study 11
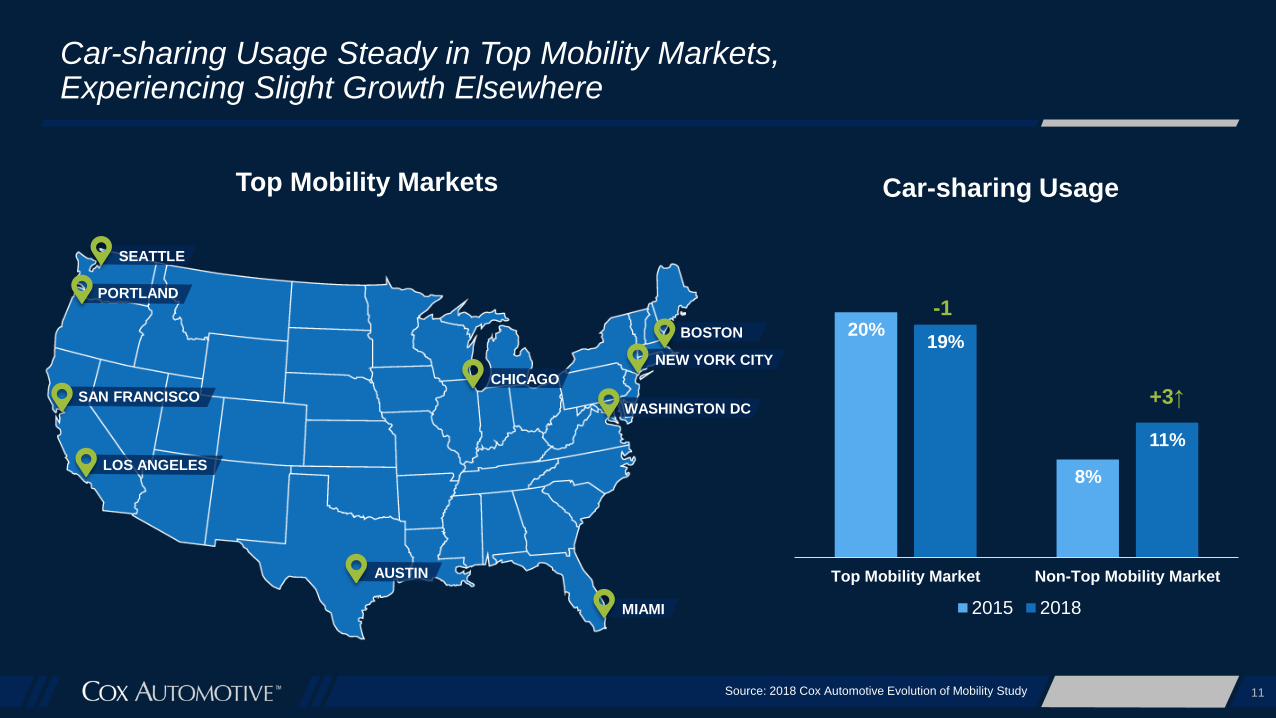
Car-sharing Usage Steady in Top Mobility Markets,Experiencing Slight Growth Elsewhere
Car-sharing UsageTop Mobility Markets
20%
8%
19%
11%
Top Mobility Market Non-Top Mobility Market
2015 2018
-1
+3↑
LOS ANGELES
SAN FRANCISCO
SEATTLE
PORTLAND
CHICAGO
NEW YORK CITY
BOSTON
MIAMI
WASHINGTON DC
AUSTIN
12Source: 2018 Cox Automotive Evolution of Mobility Study
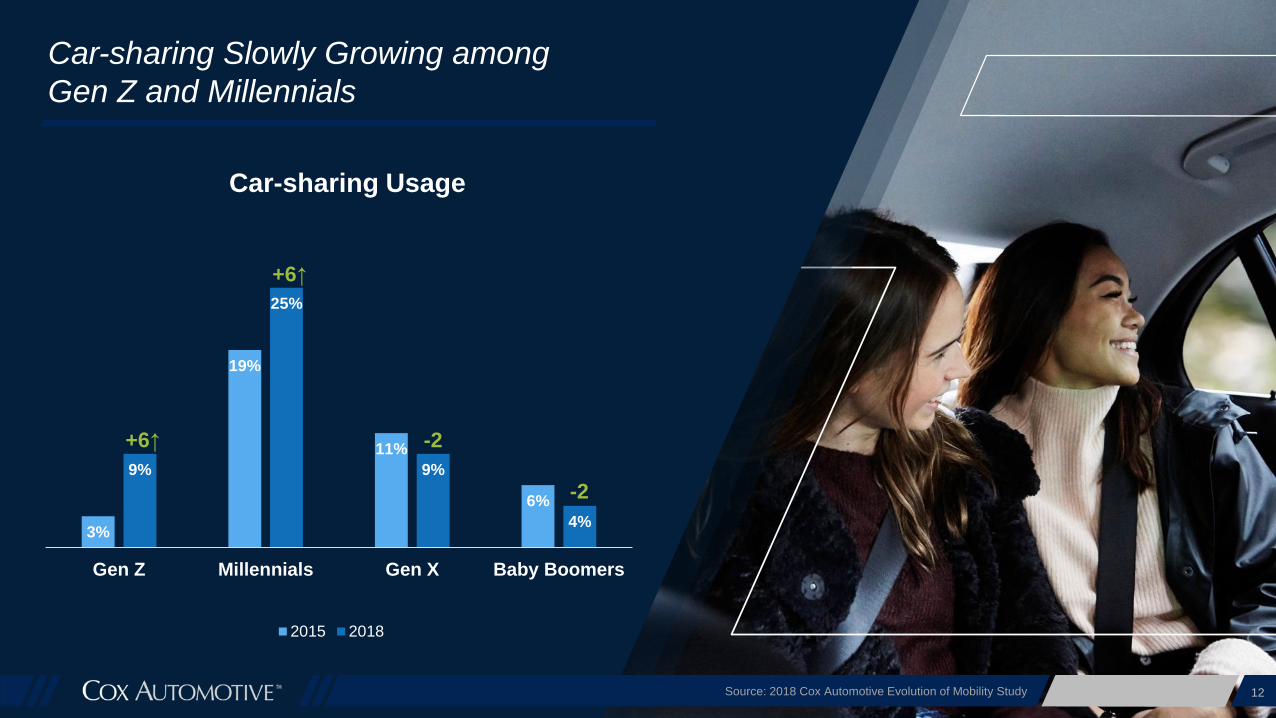
Car-sharing Slowly Growing among
Gen Z and Millennials
Car-sharing Usage
3%
19%
11%
6%
9%
25%
9%
4%
Gen Z Millennials Gen X Baby Boomers
2015 2018
+6↑
+6↑
-2
-2
13Source: 2018 Cox Automotive Evolution of Mobility Study
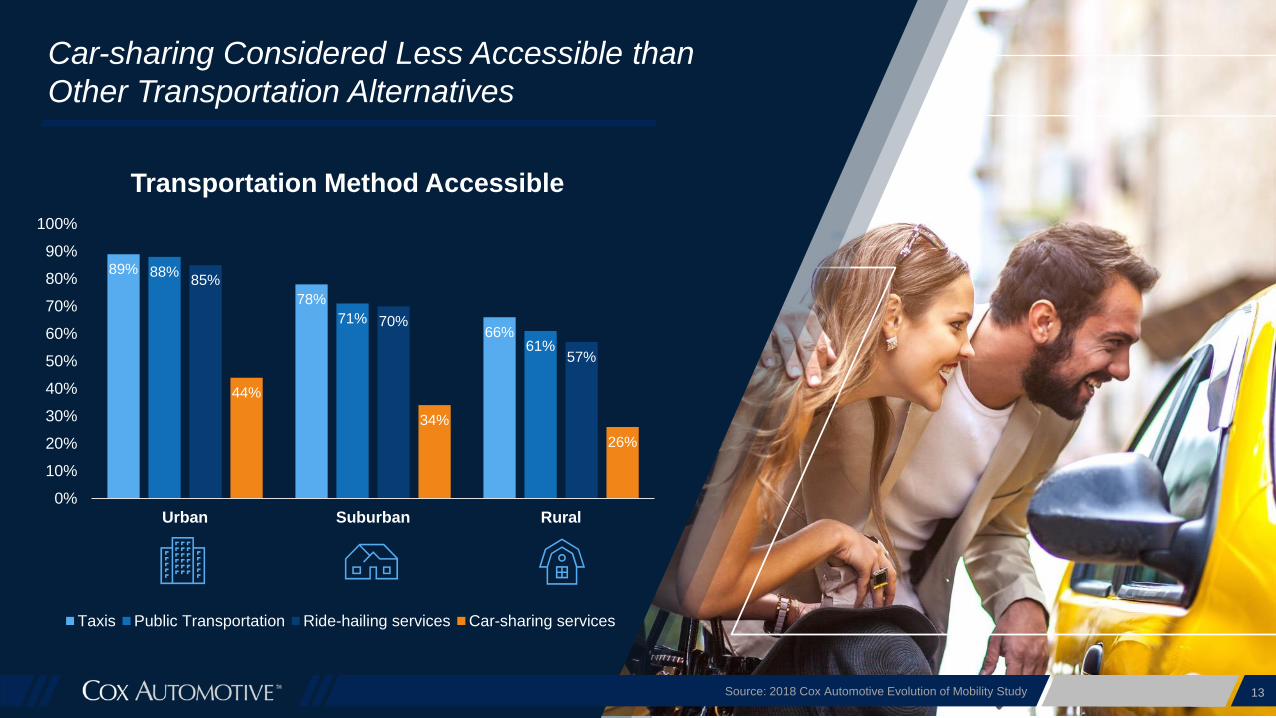
Car-sharing Considered Less Accessible than
Other Transportation Alternatives
Transportation Method Accessible
89%
78%
66%
88%
71%
61%
85%
70%
57%
44%
34%
26%
0%
10%
20%
30%
40%
50%
60%
70%
80%
90%
100%
Urban Suburban Rural
Taxis Public Transportation Ride-hailing services Car-sharing services
14Source: 2018 Cox Automotive Evolution of Mobility Study
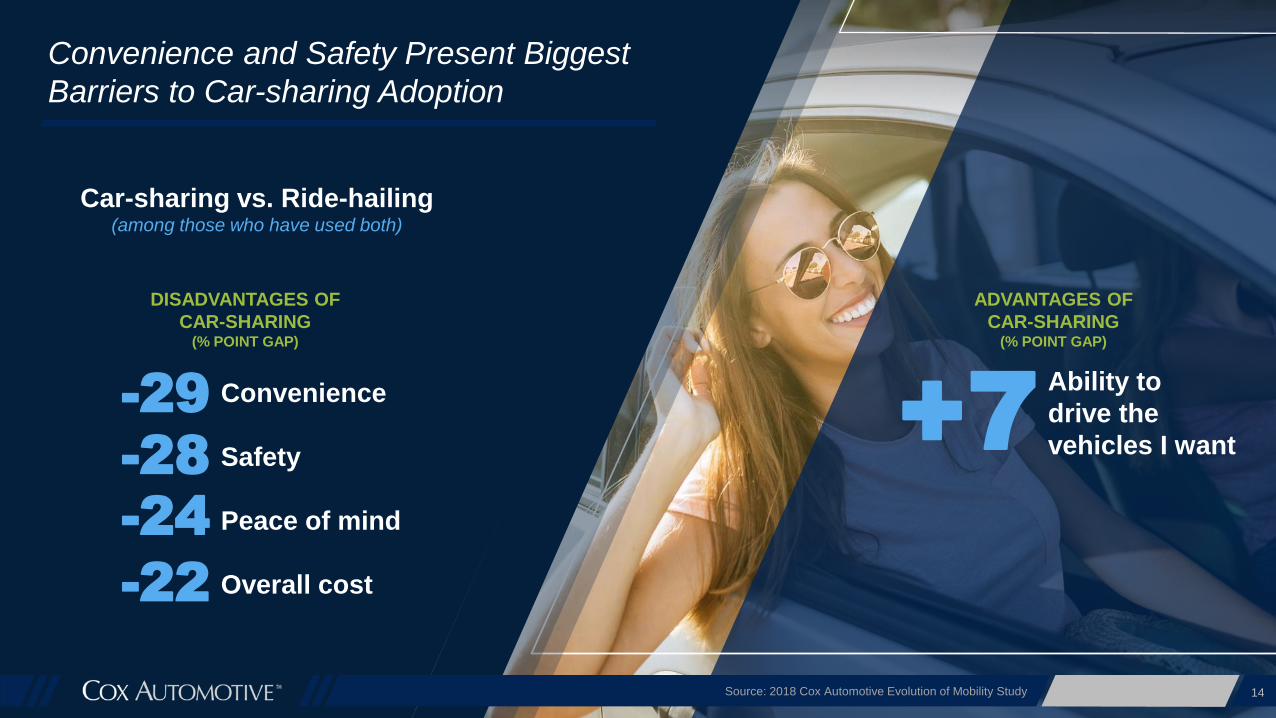
Convenience and Safety Present Biggest
Barriers to Car-sharing Adoption
DISADVANTAGES OF
CAR-SHARING (% POINT GAP)
Convenience
Safety
Peace of mind
Overall cost
-29
-28
-24
-22
Ability to
drive the
vehicles I want+7
Car-sharing vs. Ride-hailing (among those who have used both)
ADVANTAGES OF
CAR-SHARING (% POINT GAP)
Source: 2018 Cox Automotive Evolution of Mobility Study 15
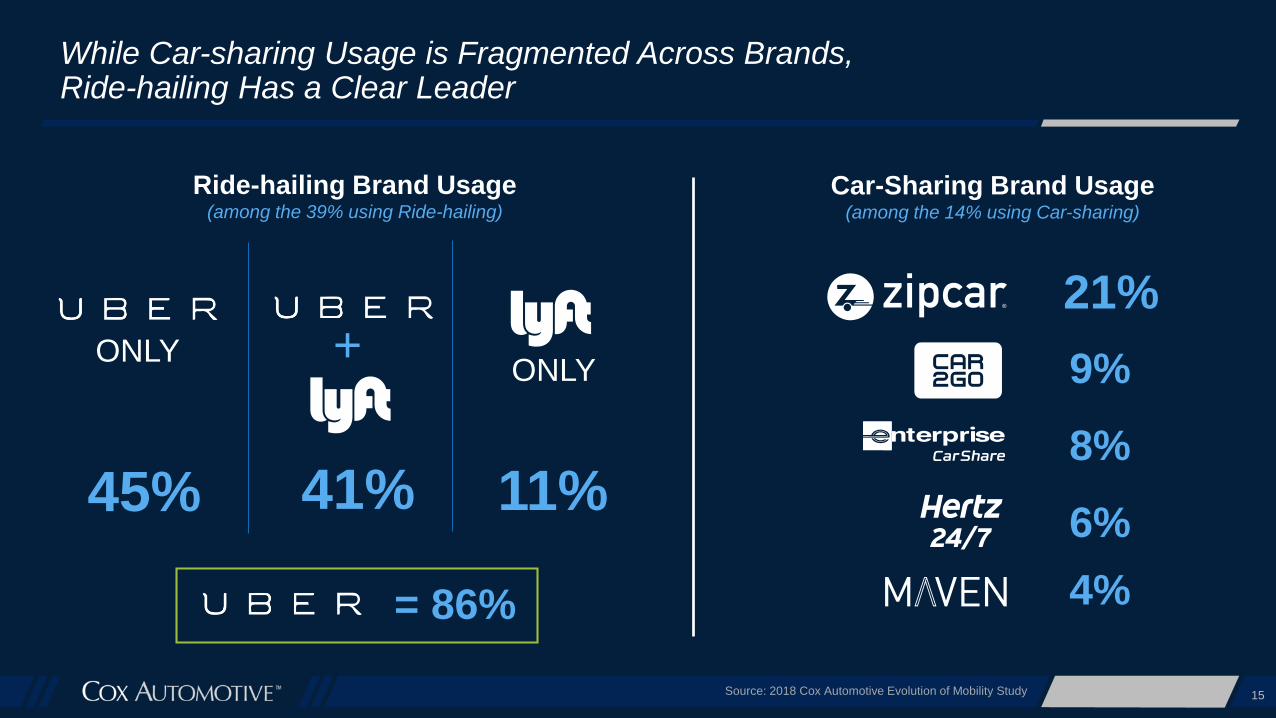
While Car-sharing Usage is Fragmented Across Brands, Ride-hailing Has a Clear Leader
Ride-hailing Brand Usage(among the 39% using Ride-hailing)
+ONLYONLY
45% 41% 11%
= 86%
Car-Sharing Brand Usage(among the 14% using Car-sharing)
21%
9%
8%
6%
4%
CAR SUBSCRIPTION IS GAINING TRACTION IN EARLY STAGE
17
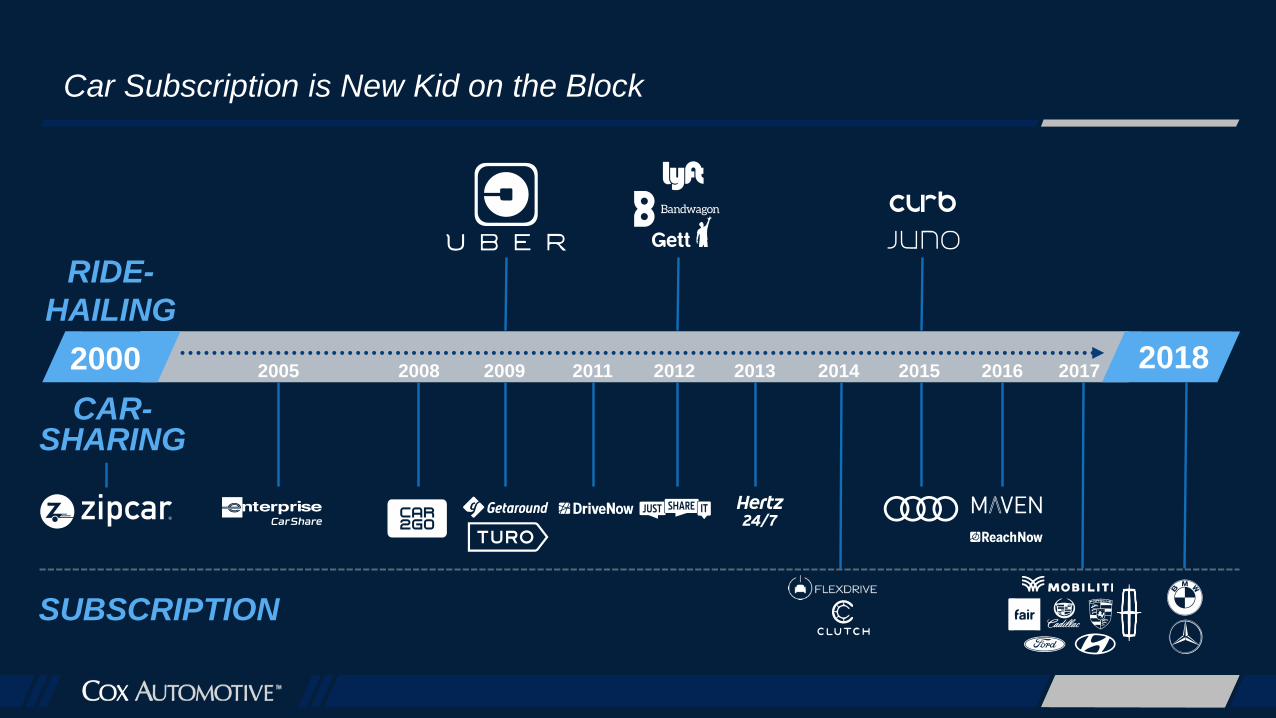
Car Subscription is New Kid on the Block
2000 20182005 2008 2009 2011 2012 2013 2015 20162014 2017
RIDE-
HAILING
CAR-SHARING
SUBSCRIPTION
18Source: 2018 Cox Automotive Evolution of Mobility Study
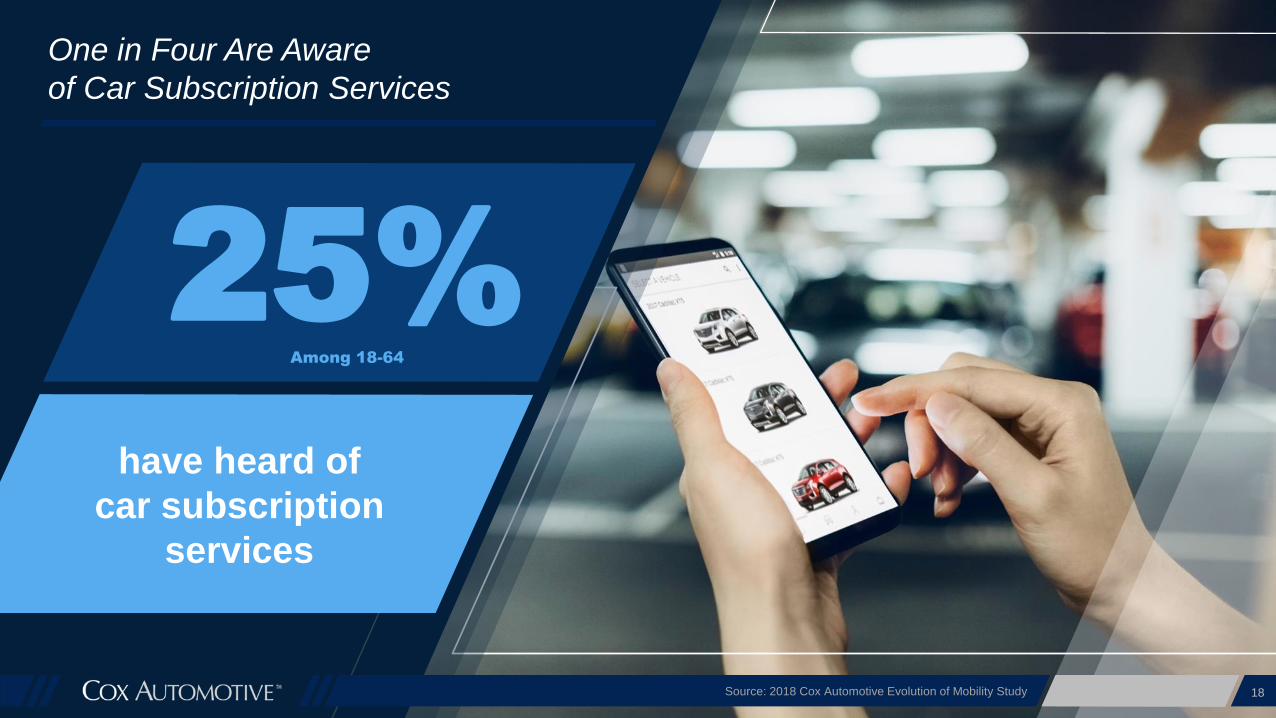
One in Four Are Aware
of Car Subscription Services
25%Among 18-64
have heard of
car subscription
services
19Source: 2018 Cox Automotive Evolution of Mobility Study
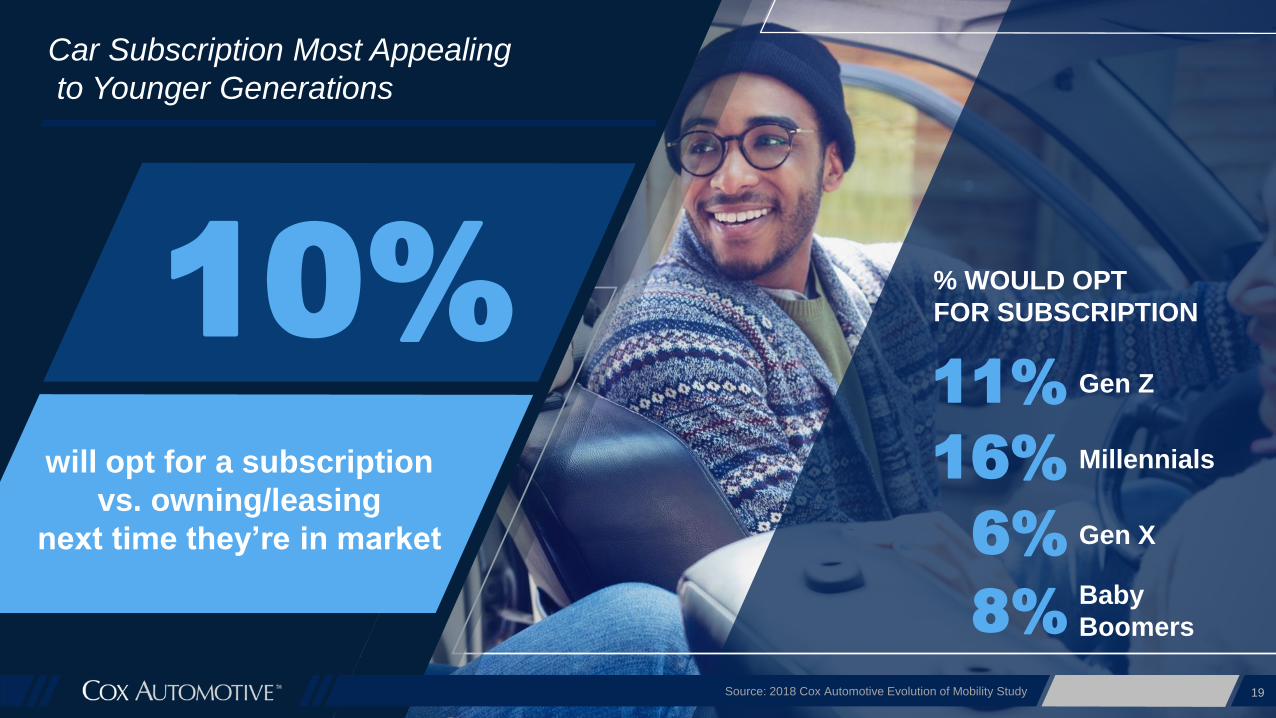
Car Subscription Most Appealing
to Younger Generations
10%
will opt for a subscription
vs. owning/leasing
next time they’re in market
8%
% WOULD OPT
FOR SUBSCRIPTION
11% Gen Z
16% Millennials
6% Gen X
Baby
Boomers
Source: 2018 Cox Automotive Evolution of Mobility Study 20
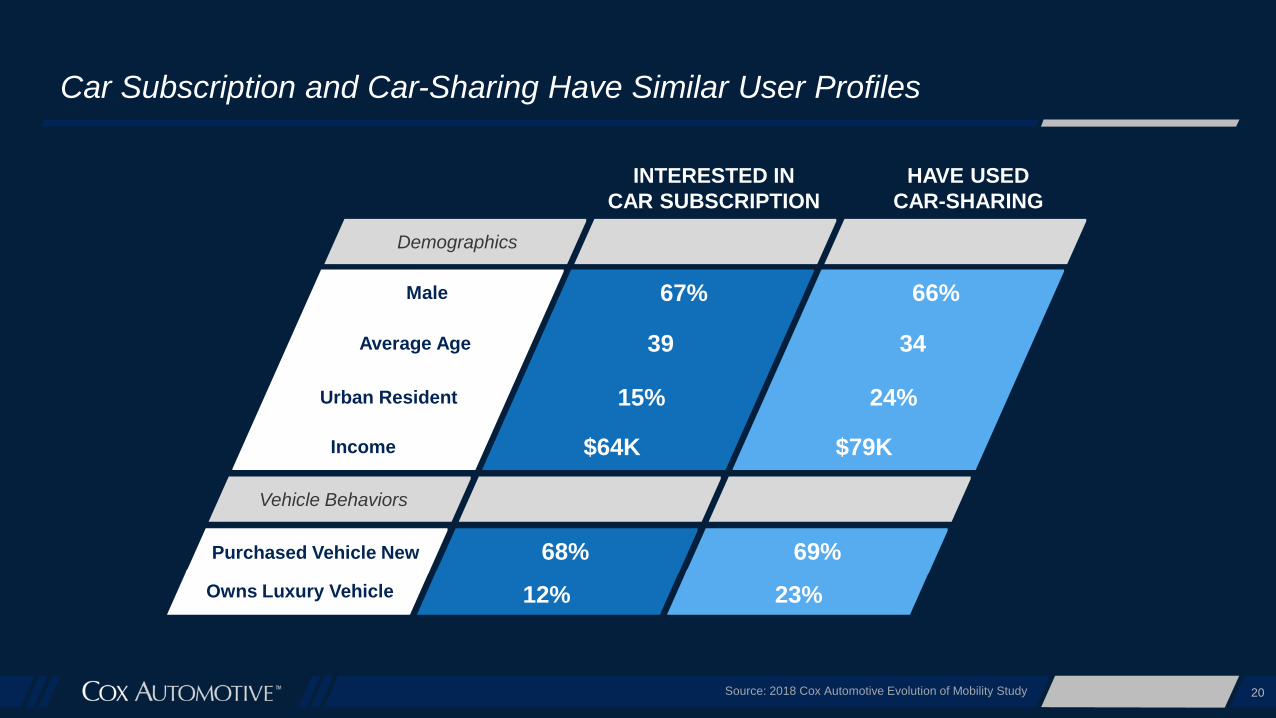
Car Subscription and Car-Sharing Have Similar User Profiles
INTERESTED IN
CAR SUBSCRIPTION
HAVE USED
CAR-SHARING
Demographics
Male
Average Age
Urban Resident
Income
Vehicle Behaviors
Purchased Vehicle New
Owns Luxury Vehicle
67%
39
15%
$64K
68%
12%
66%
34
24%
$79K
69%
23%
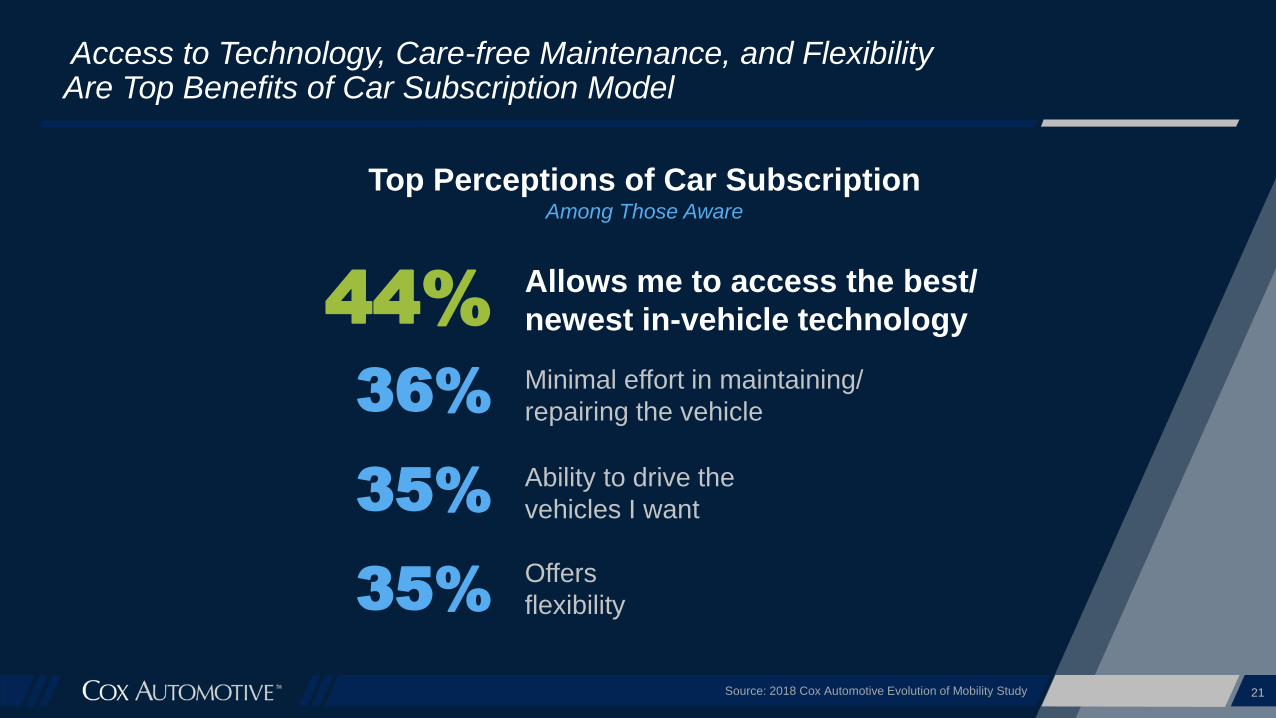
Top Perceptions of Car SubscriptionAmong Those Aware
Source: 2018 Cox Automotive Evolution of Mobility Study 21
Access to Technology, Care-free Maintenance, and Flexibility Are Top Benefits of Car Subscription Model
44%Allows me to access the best/
newest in-vehicle technology
36%Minimal effort in maintaining/
repairing the vehicle
35%Ability to drive the
vehicles I want
35%Offers
flexibility
22Source: 2018 Cox Automotive Evolution of Mobility Study
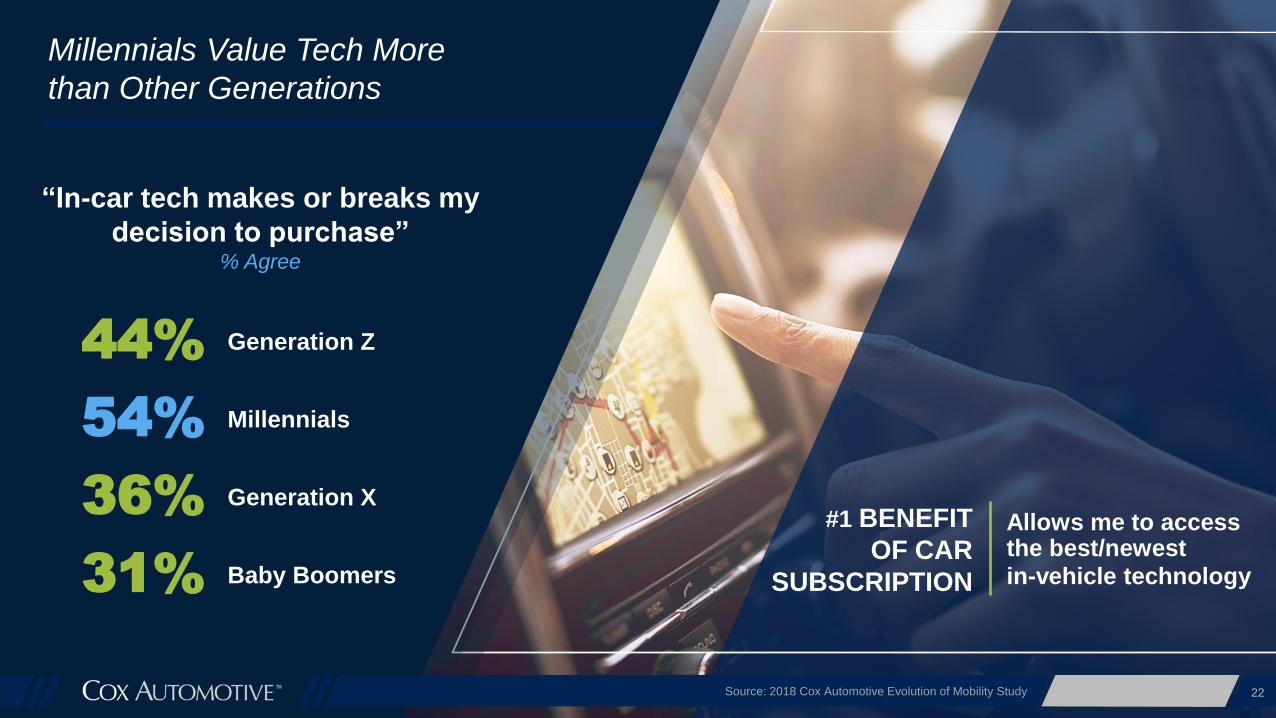
Millennials Value Tech More
than Other Generations
“In-car tech makes or breaks my
decision to purchase”% Agree
Allows me to access the best/newest
in-vehicle technology
#1 BENEFIT
OF CAR
SUBSCRIPTION
44% Generation Z
54% Millennials
36% Generation X
31% Baby Boomers
23Source: 2018 Cox Automotive Evolution of Mobility Study
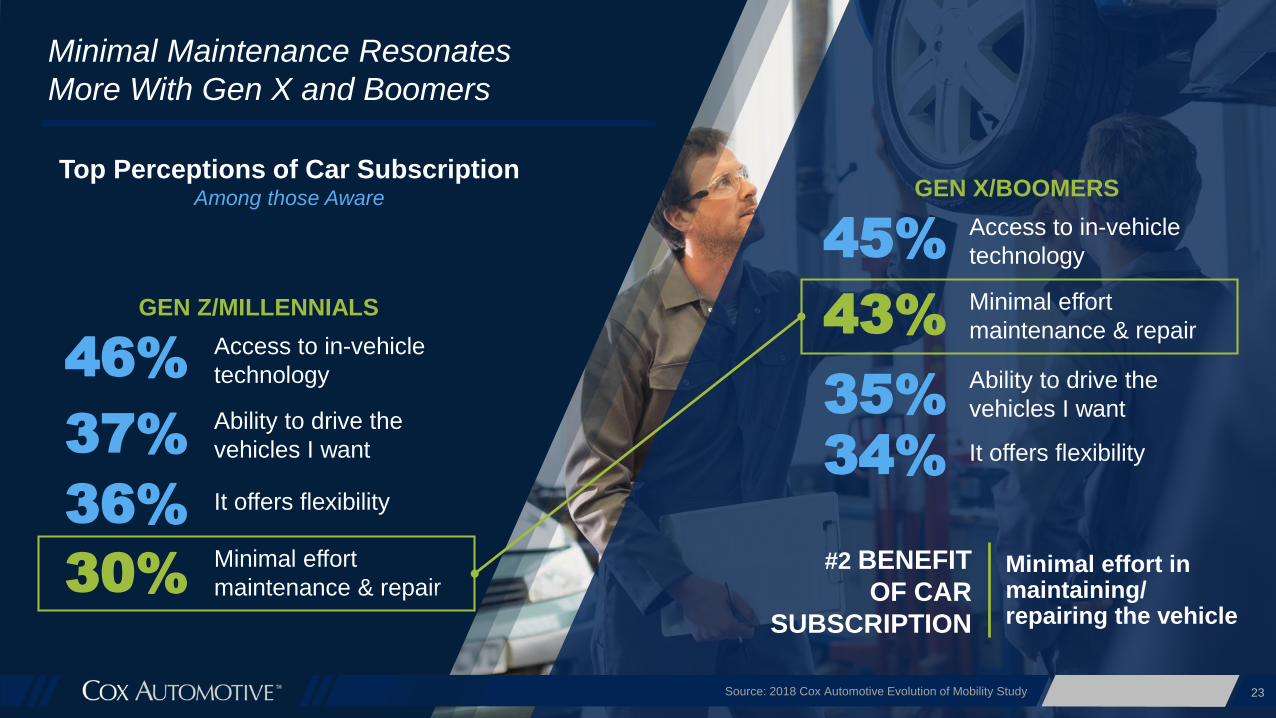
Minimal Maintenance Resonates
More With Gen X and Boomers
Minimal effort in maintaining/ repairing the vehicle
#2 BENEFIT
OF CAR
SUBSCRIPTION
Top Perceptions of Car SubscriptionAmong those Aware
46%Access to in-vehicle
technology
37%Ability to drive the
vehicles I want
36% It offers flexibility
30%Minimal effort
maintenance & repair
GEN Z/MILLENNIALS
45%Access to in-vehicle
technology
43%Minimal effort
maintenance & repair
35%Ability to drive the
vehicles I want
GEN X/BOOMERS
34% It offers flexibility
24Source: 2018 Cox Automotive Evolution of Mobility Study
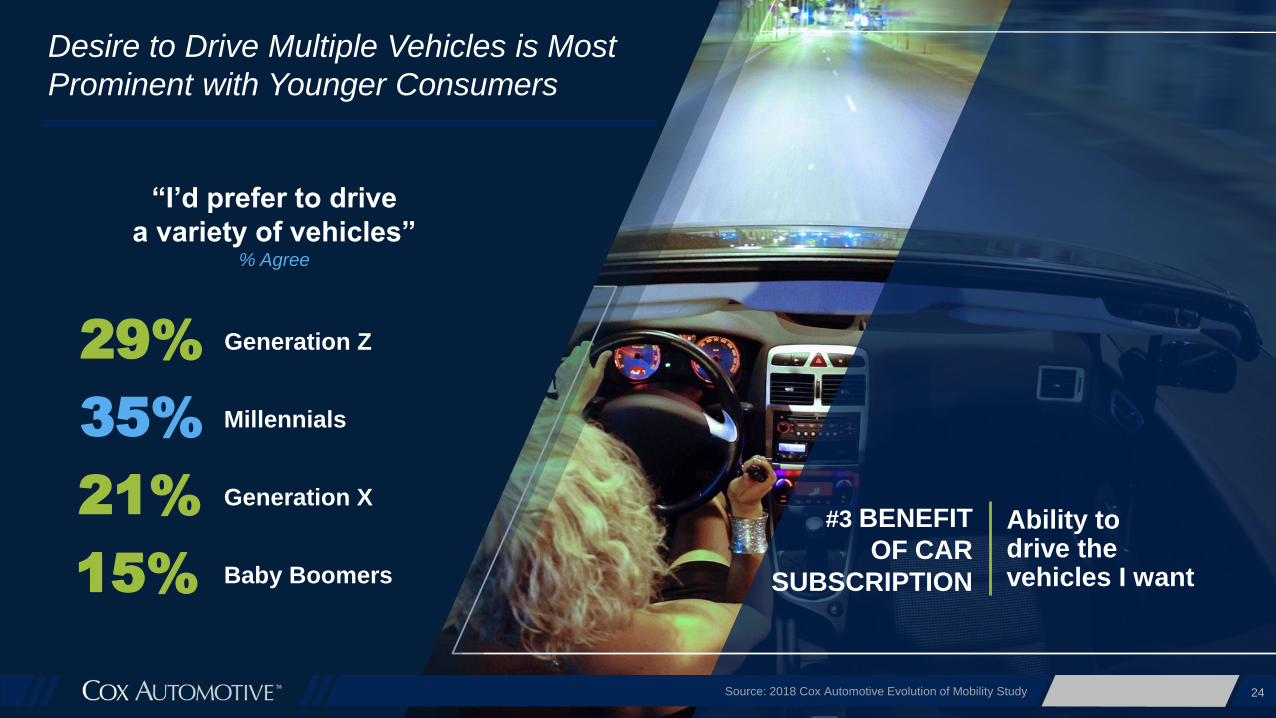
Desire to Drive Multiple Vehicles is Most
Prominent with Younger Consumers
“I’d prefer to drive
a variety of vehicles”% Agree
Ability to drive the vehicles I want
#3 BENEFIT
OF CAR
SUBSCRIPTION
29% Generation Z
35% Millennials
21% Generation X
15% Baby Boomers
25Source: 2018 Cox Automotive Evolution of Mobility Study
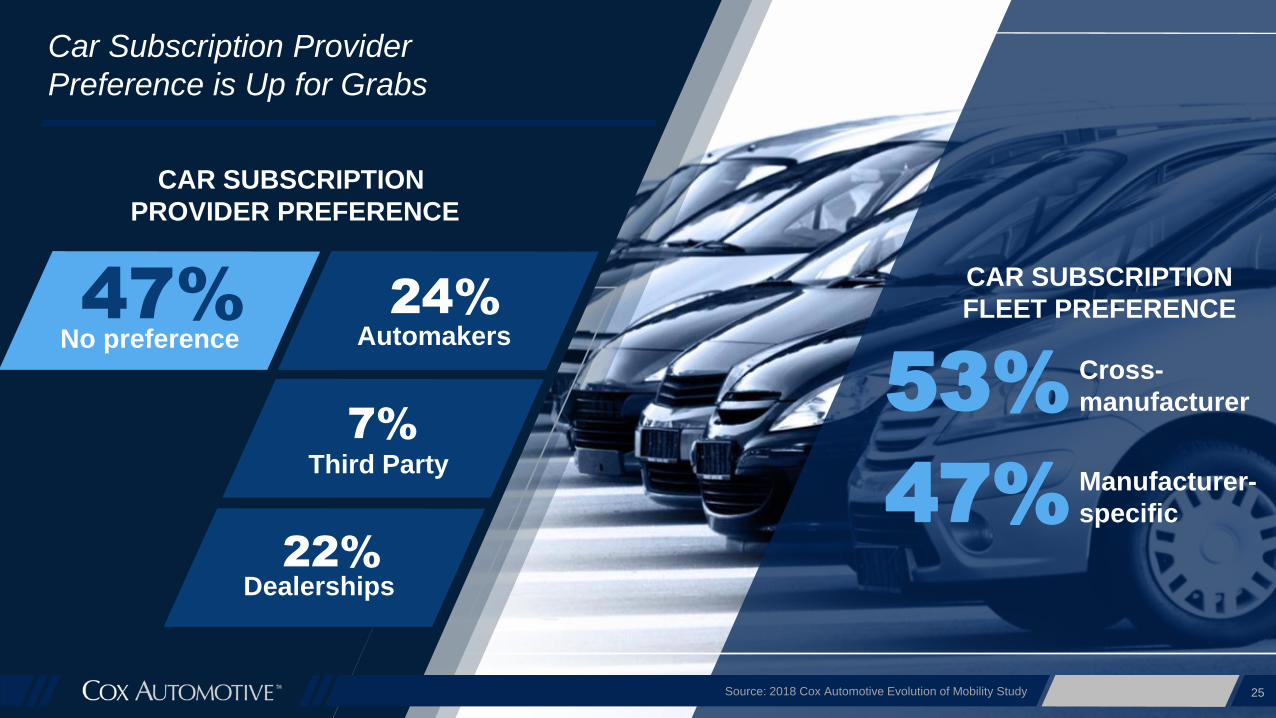
Car Subscription Provider
Preference is Up for Grabs
CAR SUBSCRIPTION
FLEET PREFERENCE
53%Cross-
manufacturer
47%Manufacturer-
specific
47%No preference
24%
Automakers
22%
Dealerships
7%
Third Party
CAR SUBSCRIPTION
PROVIDER PREFERENCE
MOBILITY SERVICES ARE CHIPPING AWAYAT OWNERSHIP
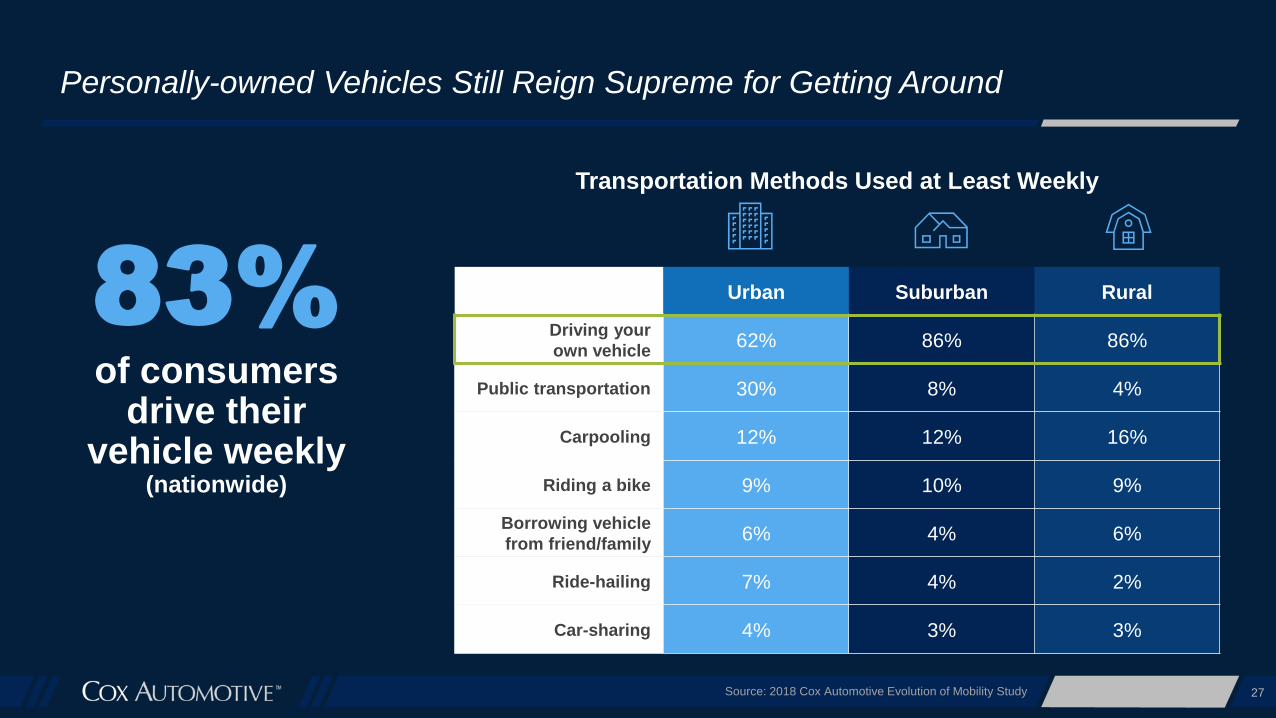
83% of consumers
drive their vehicle weekly
(nationwide)
27
Personally-owned Vehicles Still Reign Supreme for Getting Around
Urban Suburban Rural
Driving your
own vehicle62% 86% 86%
Public transportation 30% 8% 4%
Carpooling 12% 12% 16%
Riding a bike 9% 10% 9%
Borrowing vehicle
from friend/family6% 4% 6%
Ride-hailing 7% 4% 2%
Car-sharing 4% 3% 3%
Transportation Methods Used at Least Weekly
Source: 2018 Cox Automotive Evolution of Mobility Study
28Source: 2018 Cox Automotive Evolution of Mobility Study
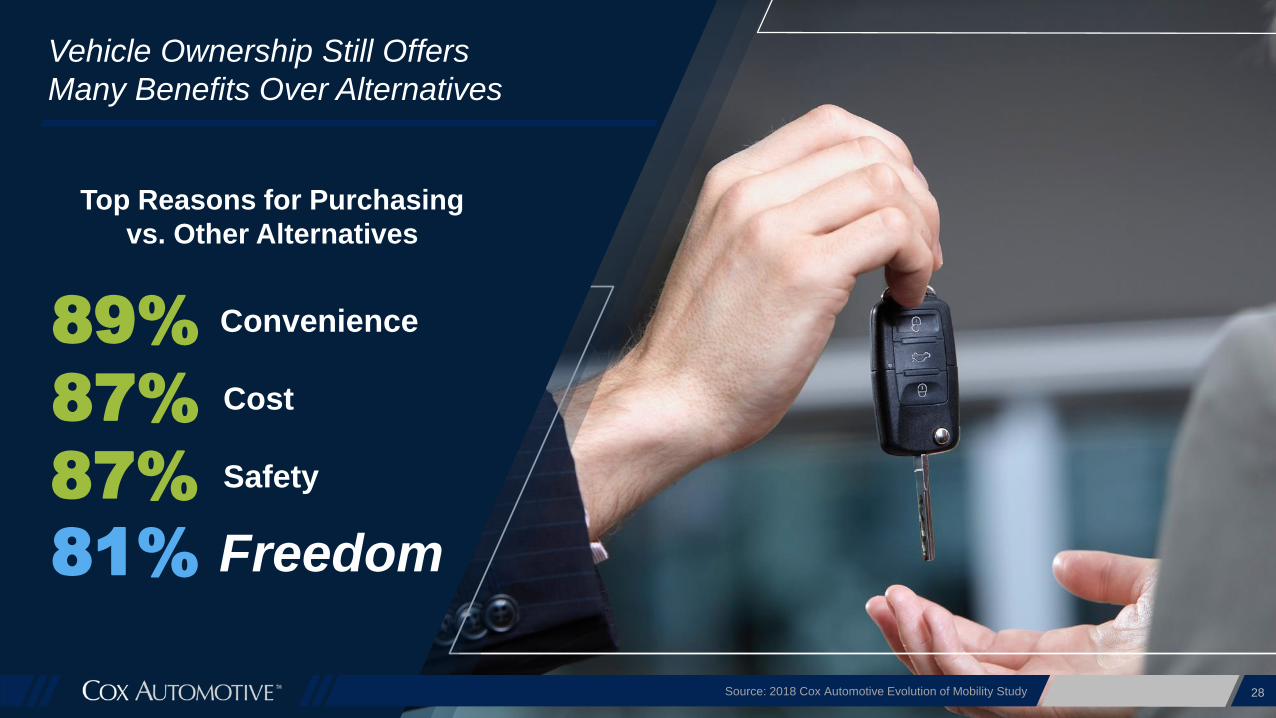
Vehicle Ownership Still Offers
Many Benefits Over Alternatives
89% Convenience
87% Cost
87% Safety
81% Freedom
Top Reasons for Purchasing
vs. Other Alternatives
Source: 2018 Cox Automotive Evolution of Mobility Study 29
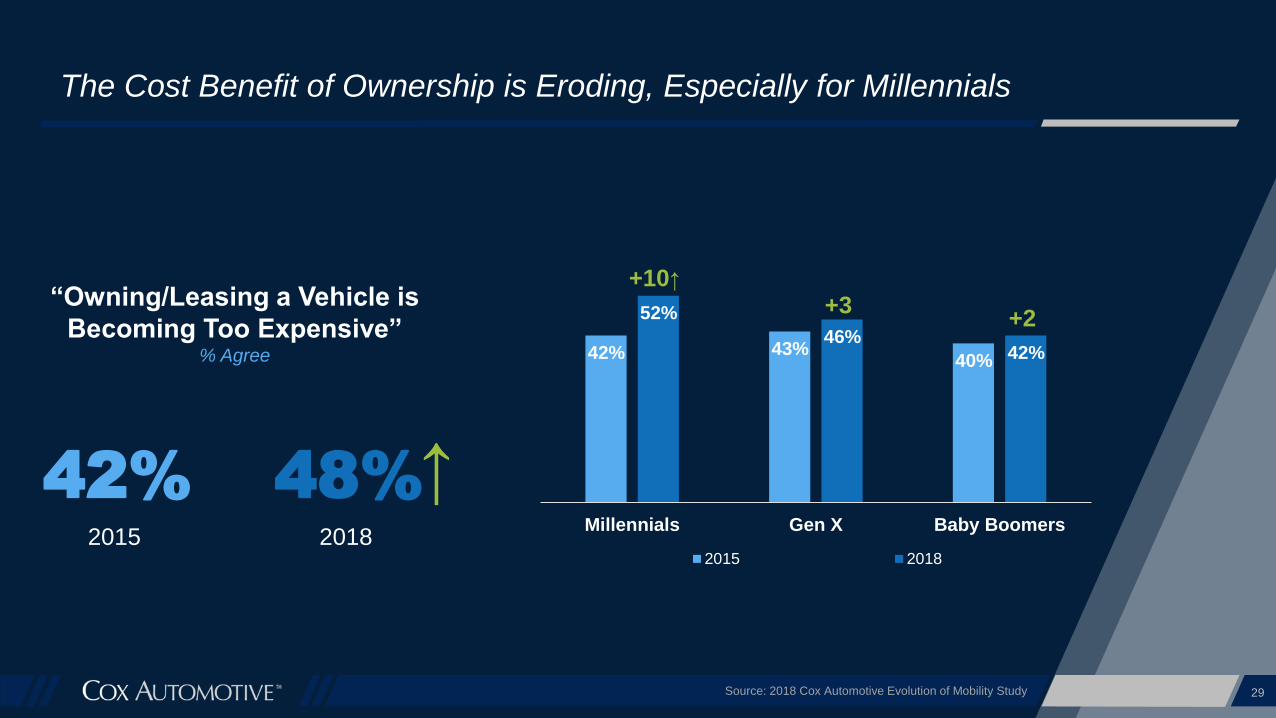
The Cost Benefit of Ownership is Eroding, Especially for Millennials
42% 43%40%
52%
46%42%
Millennials Gen X Baby Boomers
2015 2018
+10↑
+3+2
42% 48%
“Owning/Leasing a Vehicle is
Becoming Too Expensive”% Agree
2015 2018
↑
30Source: 2018 Cox Automotive Evolution of Mobility Study
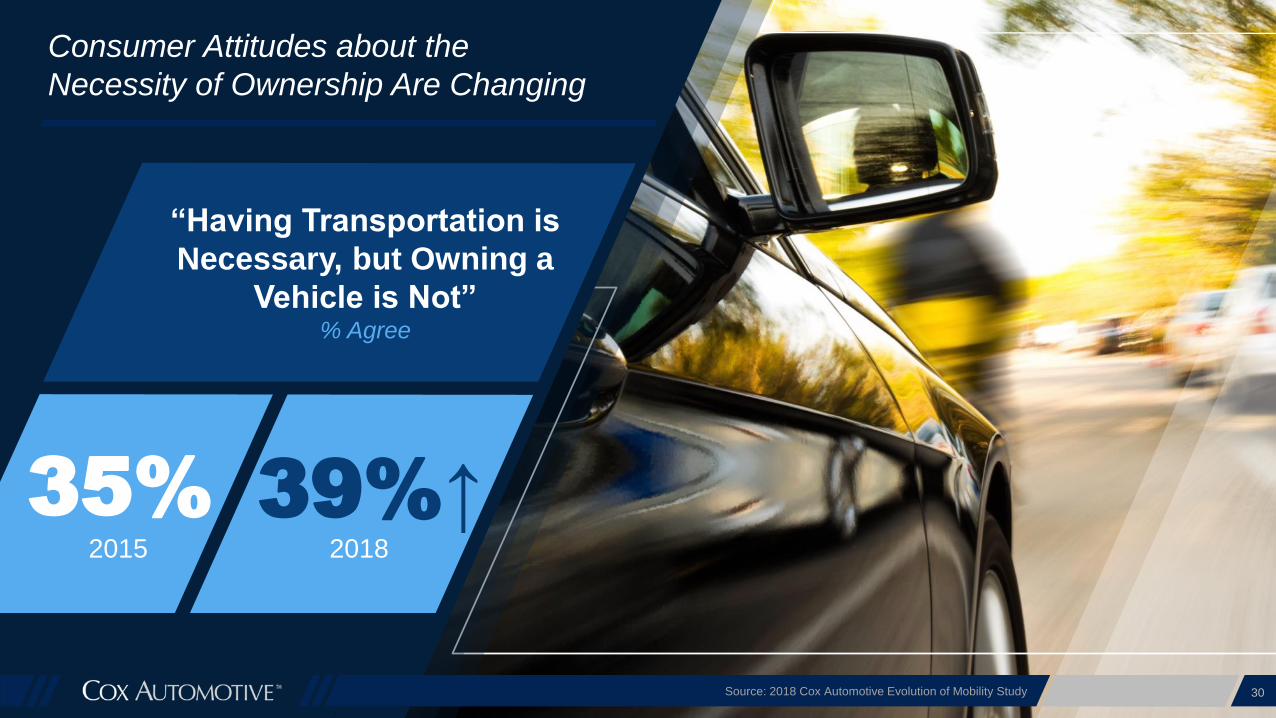
Consumer Attitudes about the
Necessity of Ownership Are Changing
“Having Transportation is
Necessary, but Owning a
Vehicle is Not”% Agree
35% 39%↑2015 2018
31Source: 2018 Cox Automotive Evolution of Mobility Study
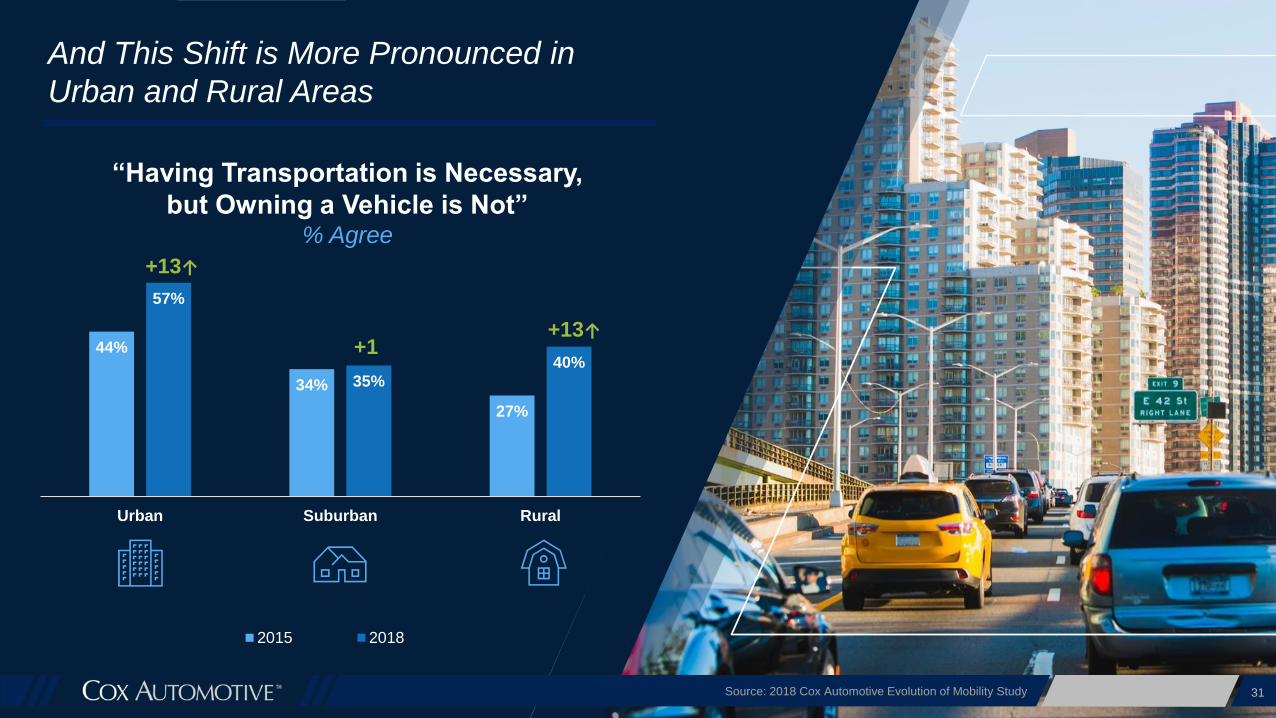
And This Shift is More Pronounced in
Urban and Rural Areas
“Having Transportation is Necessary,
but Owning a Vehicle is Not”% Agree
44%
34%
27%
57%
35%
40%
Urban Suburban Rural
2015 2018
+13↑
+1+13↑
32Source: 2018 Cox Automotive Evolution of Mobility Study
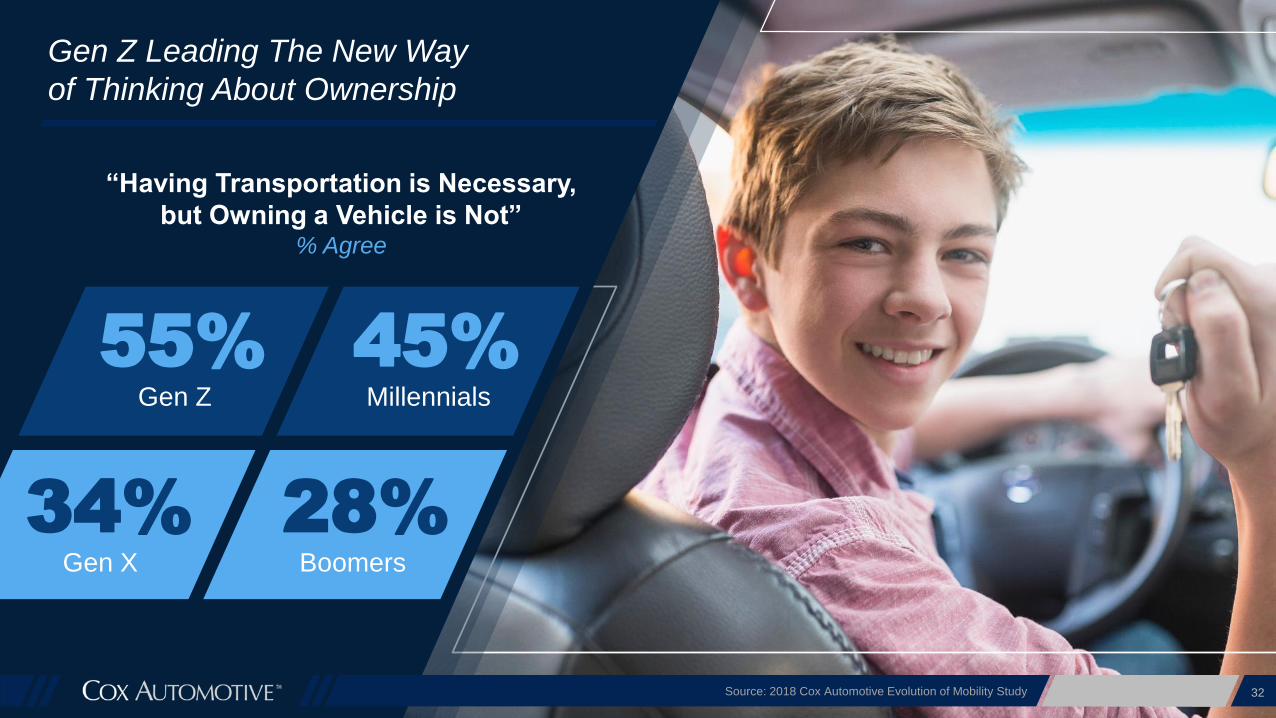
Gen Z Leading The New Way
of Thinking About Ownership
55%Gen Z
45%Millennials
28%Boomers
34%Gen X
“Having Transportation is Necessary,
but Owning a Vehicle is Not”% Agree
CONCLUSION
34
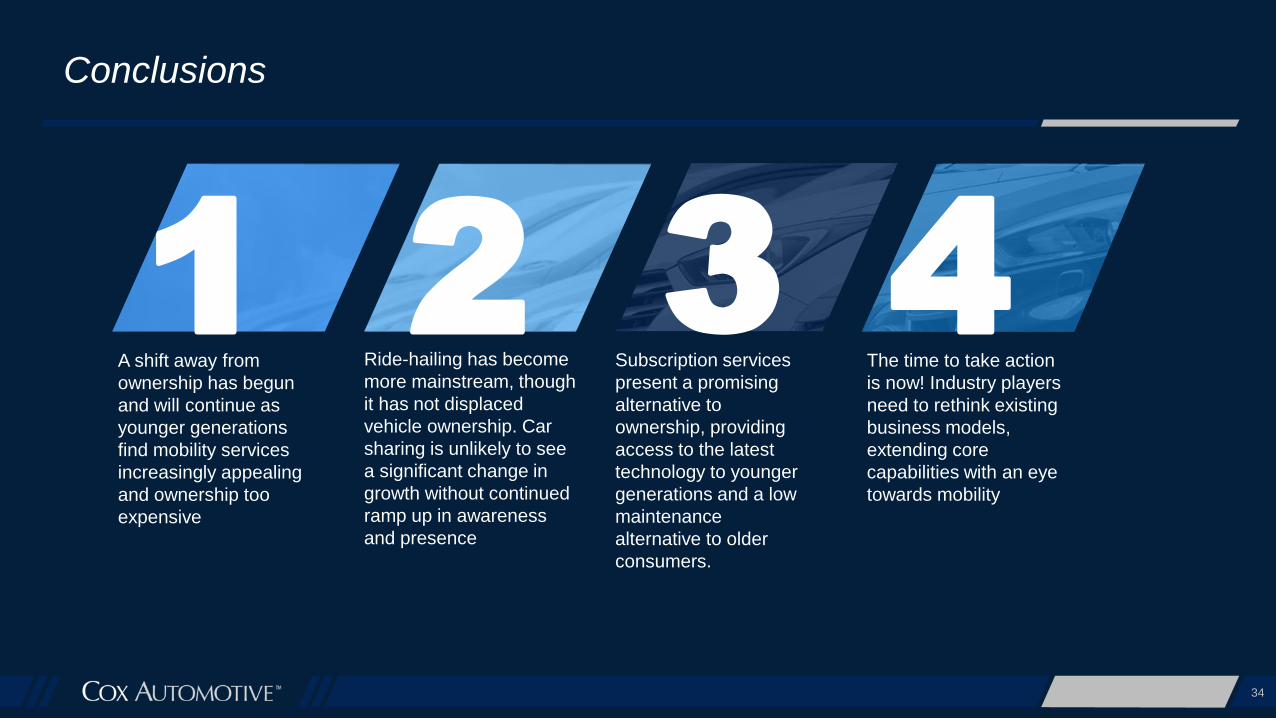
Conclusions
A shift away from
ownership has begun
and will continue as
younger generations
find mobility services
increasingly appealing
and ownership too
expensive
Ride-hailing has become
more mainstream, though
it has not displaced
vehicle ownership. Car
sharing is unlikely to see
a significant change in
growth without continued
ramp up in awareness
and presence
Subscription services
present a promising
alternative to
ownership, providing
access to the latest
technology to younger
generations and a low
maintenance
alternative to older
consumers.
The time to take action
is now! Industry players
need to rethink existing
business models,
extending core
capabilities with an eye
towards mobility
1 2 3 4
APPENDIX
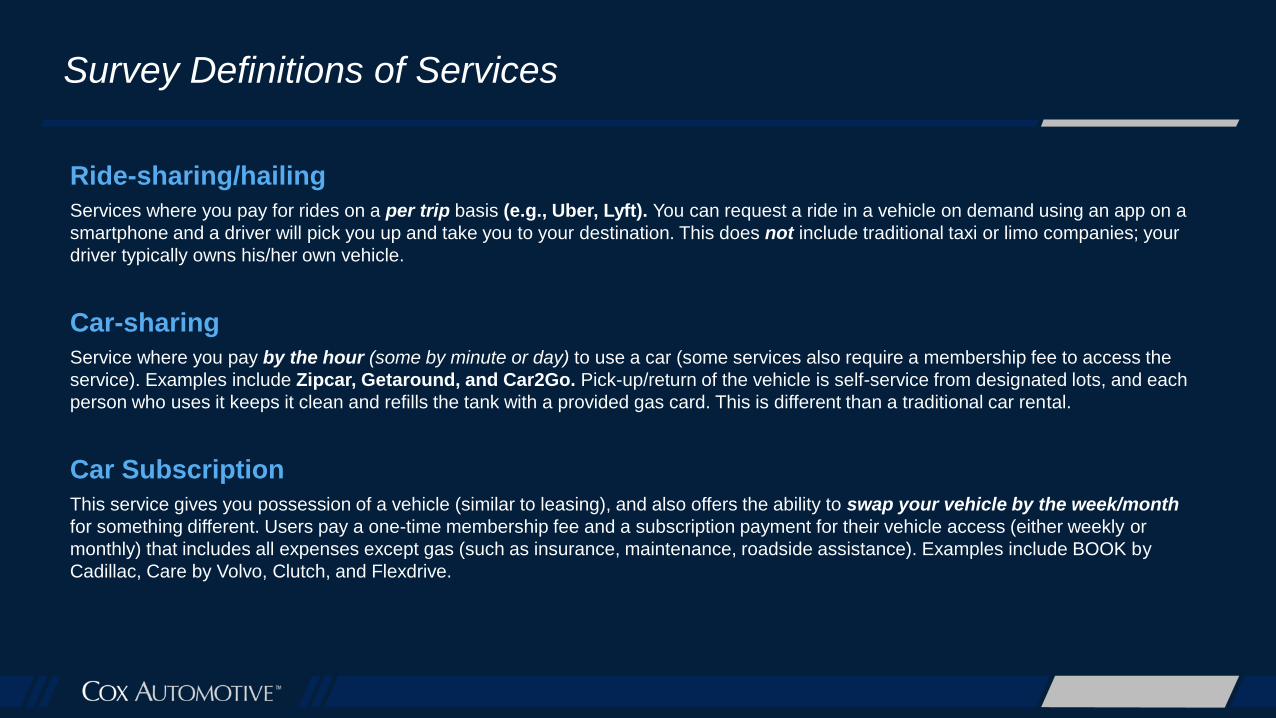
Ride-sharing/hailing
Services where you pay for rides on a per trip basis (e.g., Uber, Lyft). You can request a ride in a vehicle on demand using an app on a
smartphone and a driver will pick you up and take you to your destination. This does not include traditional taxi or limo companies; your
driver typically owns his/her own vehicle.
Car-sharing
Service where you pay by the hour (some by minute or day) to use a car (some services also require a membership fee to access the
service). Examples include Zipcar, Getaround, and Car2Go. Pick-up/return of the vehicle is self-service from designated lots, and each
person who uses it keeps it clean and refills the tank with a provided gas card. This is different than a traditional car rental.
Car Subscription
This service gives you possession of a vehicle (similar to leasing), and also offers the ability to swap your vehicle by the week/month
for something different. Users pay a one-time membership fee and a subscription payment for their vehicle access (either weekly or
monthly) that includes all expenses except gas (such as insurance, maintenance, roadside assistance). Examples include BOOK by
Cadillac, Care by Volvo, Clutch, and Flexdrive.
Survey Definitions of Services
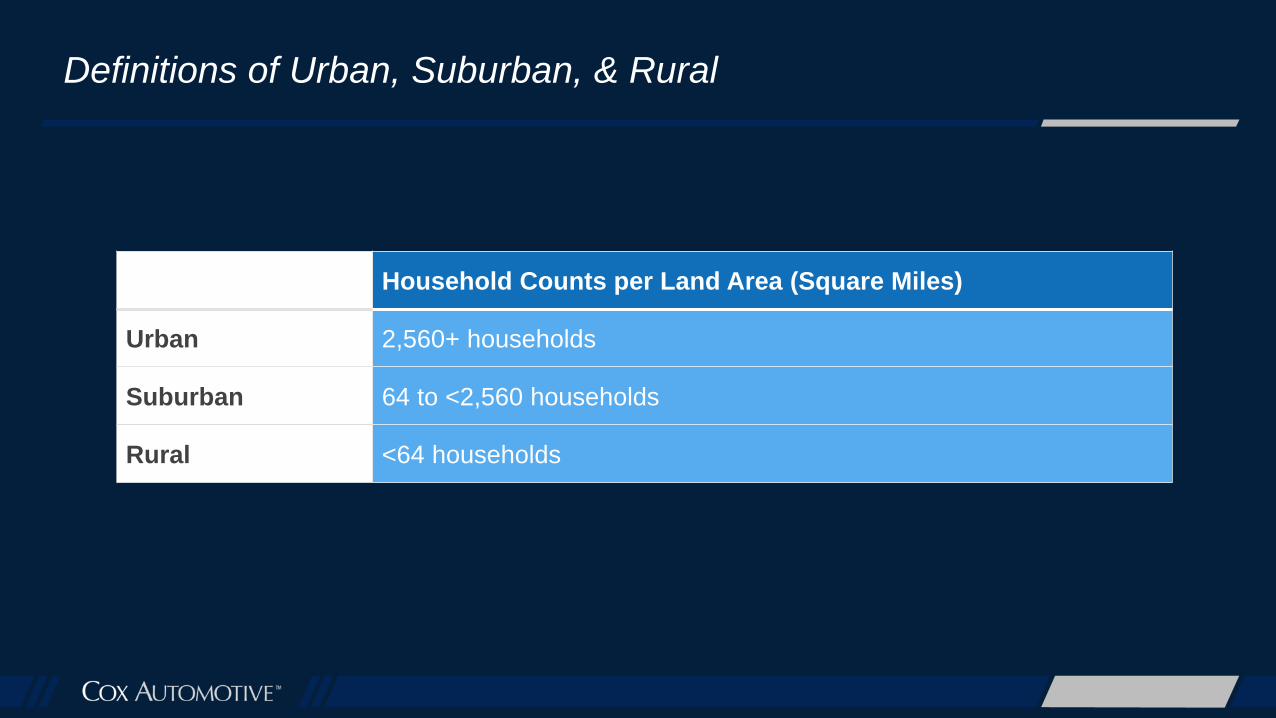
Definitions of Urban, Suburban, & Rural
Household Counts per Land Area (Square Miles)
Urban 2,560+ households
Suburban 64 to <2,560 households
Rural <64 households
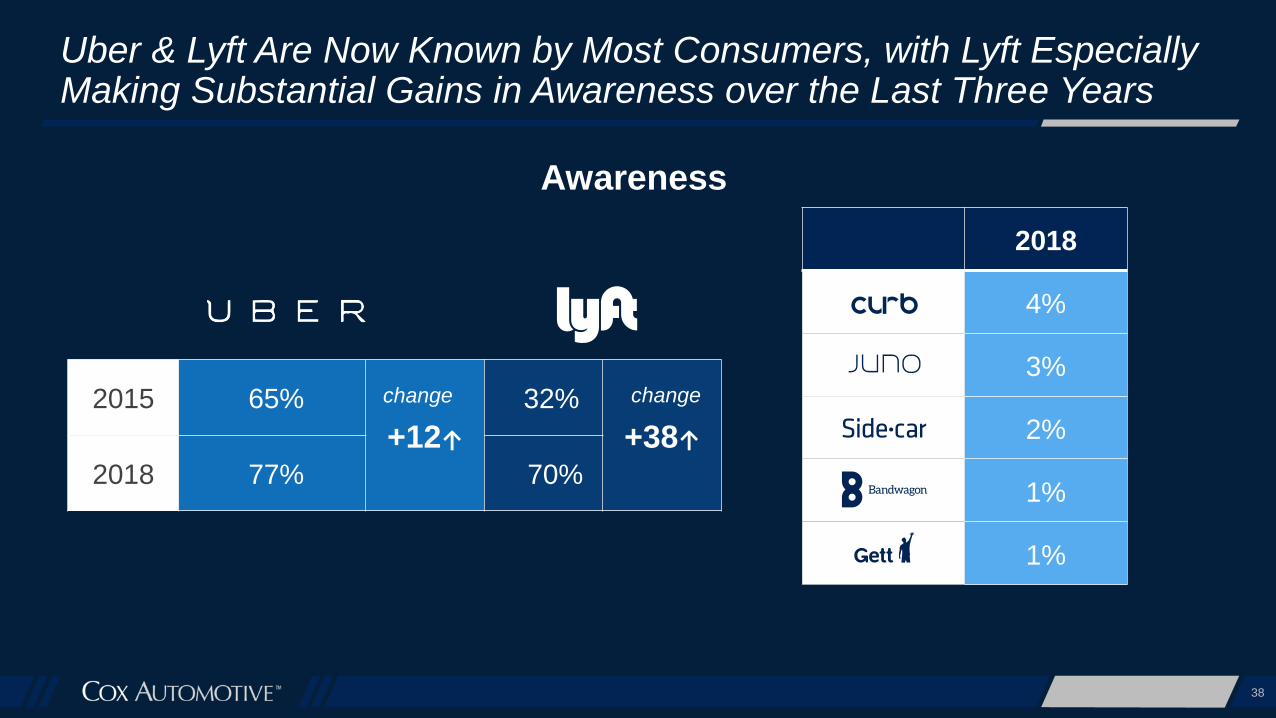
2015 65%
+12↑
32%
+38↑2018 77% 70%
38
Uber & Lyft Are Now Known by Most Consumers, with Lyft Especially Making Substantial Gains in Awareness over the Last Three Years
Awareness
2018
4%
3%
2%
1%
1%
change change
39
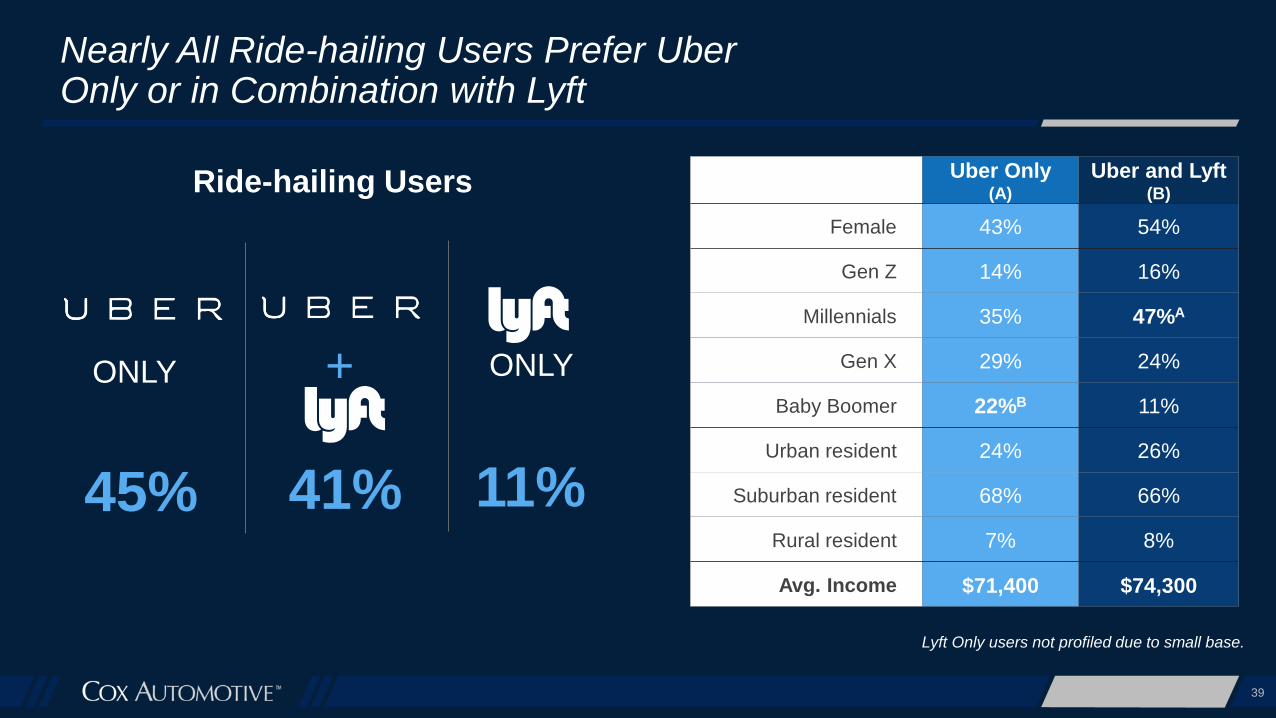
Nearly All Ride-hailing Users Prefer Uber Only or in Combination with Lyft
Uber Only(A)
Uber and Lyft(B)
Female 43% 54%
Gen Z 14% 16%
Millennials 35% 47%A
Gen X 29% 24%
Baby Boomer 22%B 11%
Urban resident 24% 26%
Suburban resident 68% 66%
Rural resident 7% 8%
Avg. Income $71,400 $74,300
Ride-hailing Users
Lyft Only users not profiled due to small base.
+ONLY ONLY
45% 41% 11%