Embed Size (px)
Citation preview
CIRED Workshop - Helsinki 14-15 June 2016
Paper 0471
Paper No 0471 Page 1 / 4
EVOLUTION OF BUSINESS MODEL IN RAILWAY INDUSTRY IN THE PRESENCE OF
ENERGY MANAGEMENT SYSTEM
Sara KHAYYAM Eduardo PILO DE LA FUENTE Valeria BAGLIANO
RWTH Aachen University, Germany FFE – Spain D’Appolonia - Italy
[email protected] [email protected] [email protected]
Zihang HUANG Ignacio GONZALEZ Antonello MONTI
RWTH Aachen University, Germany FFE- Spain RWTH Aachen University, Germany
[email protected] [email protected] [email protected]
ABSTRACT
The future railway distribution system, expected to
follow the evolution of the smart grid, is a large system
with huge amount of value flows (e.g. information,
electricity, cash) which regarding to new actors and
new roles in the system needs new business models. The
mapping of some of value flows in both conventional
and new business models will be shown in this paper to
present a comparison. Similarly, the canvases of
one/two main actors have been also given for both
models. The business models for both mapping
methodology and canvas model methods will be
described in the paper. Finally based on one real case
study information, cash flow analysis will be presented
according to the business model introduced.
INTRODUCTION
Nowadays trains are merely energy consumers, but the
tendency is to change towards railways smart grids,
where the energy consumption profiles are optimized in
real time in coordination with other trains and
substations. The development of the railway smart grid
is pushing forward a change in the paradigm in the
electricity management in railway sector, which
enriches interactions among the agents and gives rise to
new business models. This business model evolution in
railway industry has been developed in the FP7 EU
project MERLIN (http://www.merlin-rail.eu/). MERLIN
for the first time has proposed, implemented and
demonstrated an integrated approach to energy
management in railway systems to achieve a more
sustainable and optimized energy usage in European
electric mainline railways. This implies that energy
consumers, producers, and storages are not isolated
elements, but players of the global energy game. The
proposed energy management system (REM-S) to
achieve MERLIN operational objectives has hybrid
centralized-decentralized architecture [1]. Given that the
generic load “railway system” interacts with the public
grid and the electricity market, a similar time
framework for the energy optimization is applied in
REM-S, encompassing Day-Ahead, Minute-Ahead and
Real time operation modes [1].
In conventional railway industry, the involved roles and
actors are quite independent, and the value flows among
them are normally unidirectional. In order to integrate
them in the railway energy management system, the
fundamental connection method should be modified to
accommodate new partners, such as electricity market
operator, and to enable bidirectional value flows among
all actors, such as information flow, electricity flow, etc.
Therefore, the business activities in the new railway
system are expected to differ from the existing business
models of the railway industry. Concerning
conventional actors in the railway industry remain
active, but in REM-S they should be able to
communicate and interconnect to one another. In
addition, some new roles are introduced by REM-S.
In this paper mapping methodology and business model
canvas are used [2-4] to analyze new business models
for the railway systems, in presence of the new actors
proposed by REM-S. To investigate the business
activities in railway industry, a questionnaire prepared
by MERLIN researchers was filled out by MERLIN
Partners who have different roles in the railway industry
e.g. Railway Operator (RO) and Infrastructure Manager
(IM). The questionnaire surveys daily operation,
relationships, ownership categories, revenue & cost, etc.
for different actors in railway industry. The novel
business model which will be presented in this paper is
based on the gathered information through the
questionnaire. After describing both conventional and
novel business models, one cash flow analysis will be
presented at the following which shows the beneficiary
of using the proposed business model.
CONVENTIONAL RAILWAY BUSINESS
MODEL
In the conventional business model, the railway market
structure simply consists of four main actors:
Railway Operator (RO);
Infrastructure Manager (IM);
Energy Supplier;
Grid Owner.
Mapping Model
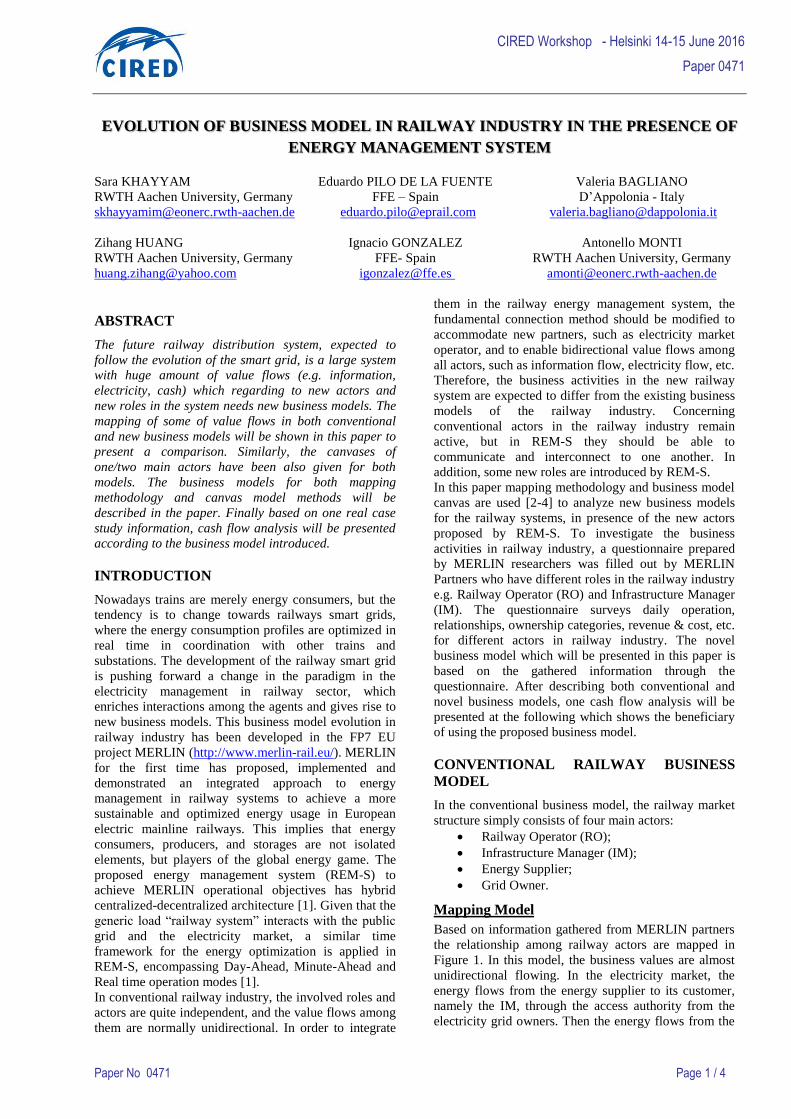
Based on information gathered from MERLIN partners
the relationship among railway actors are mapped in
Figure 1. In this model, the business values are almost
unidirectional flowing. In the electricity market, the
energy flows from the energy supplier to its customer,
namely the IM, through the access authority from the
electricity grid owners. Then the energy flows from the
CIRED Workshop - Helsinki 14-15 June 2016
Paper 0471
Paper No 0471 Page 2 / 4
IM to the RO, as the operation of rolling stocks requires
a large amount of electricity. Additionally, during the
braking of the train the regenerated energy is flowing
back to the electric grid. So the electricity flow between
RO & IM is bidirectional. The cash flows in the reverse
direction, as the payment for the service or the
commodity. The cash also flows from IM and energy
supplier to grid owner, as the charge of using the grid.
The flows in Figure 1 are representative of the most
common situation in the market today, i.e. the energy
supplier delivers electricity to the RO through the IM;
however, Directive 2012/34/EC, establishing a single
European railway area [5], ensures equitable and non-
discriminatory access to infrastructure electrical
equipment for all ROs and therefore leads to the
opening of the railway market presence of different and
many traction current suppliers. This implies the
possibility for a RO to buy directly energy from energy
suppliers other than the IM.
Figure 1: Mapping of Conventional Business Model
Canvas Model
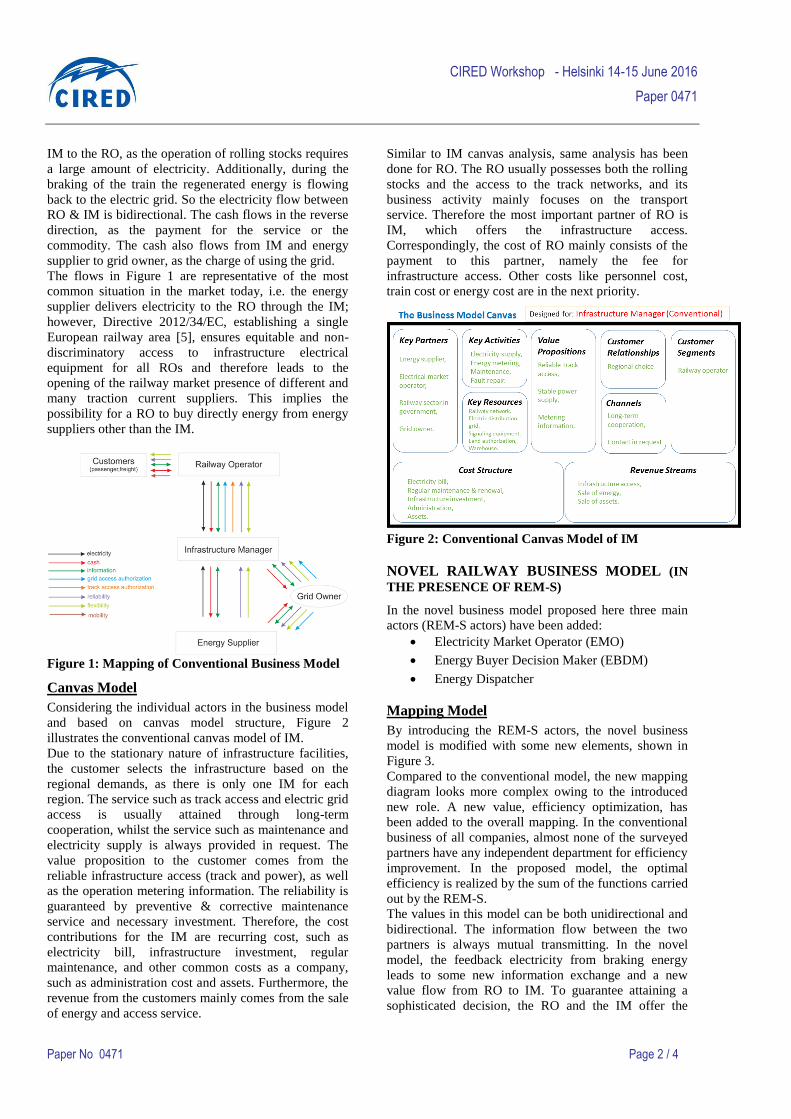
Considering the individual actors in the business model
and based on canvas model structure, Figure 2
illustrates the conventional canvas model of IM.
Due to the stationary nature of infrastructure facilities,
the customer selects the infrastructure based on the
regional demands, as there is only one IM for each
region. The service such as track access and electric grid
access is usually attained through long-term
cooperation, whilst the service such as maintenance and
electricity supply is always provided in request. The
value proposition to the customer comes from the
reliable infrastructure access (track and power), as well
as the operation metering information. The reliability is
guaranteed by preventive & corrective maintenance
service and necessary investment. Therefore, the cost
contributions for the IM are recurring cost, such as
electricity bill, infrastructure investment, regular
maintenance, and other common costs as a company,
such as administration cost and assets. Furthermore, the
revenue from the customers mainly comes from the sale
of energy and access service.
Similar to IM canvas analysis, same analysis has been
done for RO. The RO usually possesses both the rolling
stocks and the access to the track networks, and its
business activity mainly focuses on the transport
service. Therefore the most important partner of RO is
IM, which offers the infrastructure access.
Correspondingly, the cost of RO mainly consists of the
payment to this partner, namely the fee for
infrastructure access. Other costs like personnel cost,
train cost or energy cost are in the next priority.
Figure 2: Conventional Canvas Model of IM
NOVEL RAILWAY BUSINESS MODEL (IN
THE PRESENCE OF REM-S)
In the novel business model proposed here three main
actors (REM-S actors) have been added:
Electricity Market Operator (EMO)
Energy Buyer Decision Maker (EBDM)
Energy Dispatcher
Mapping Model
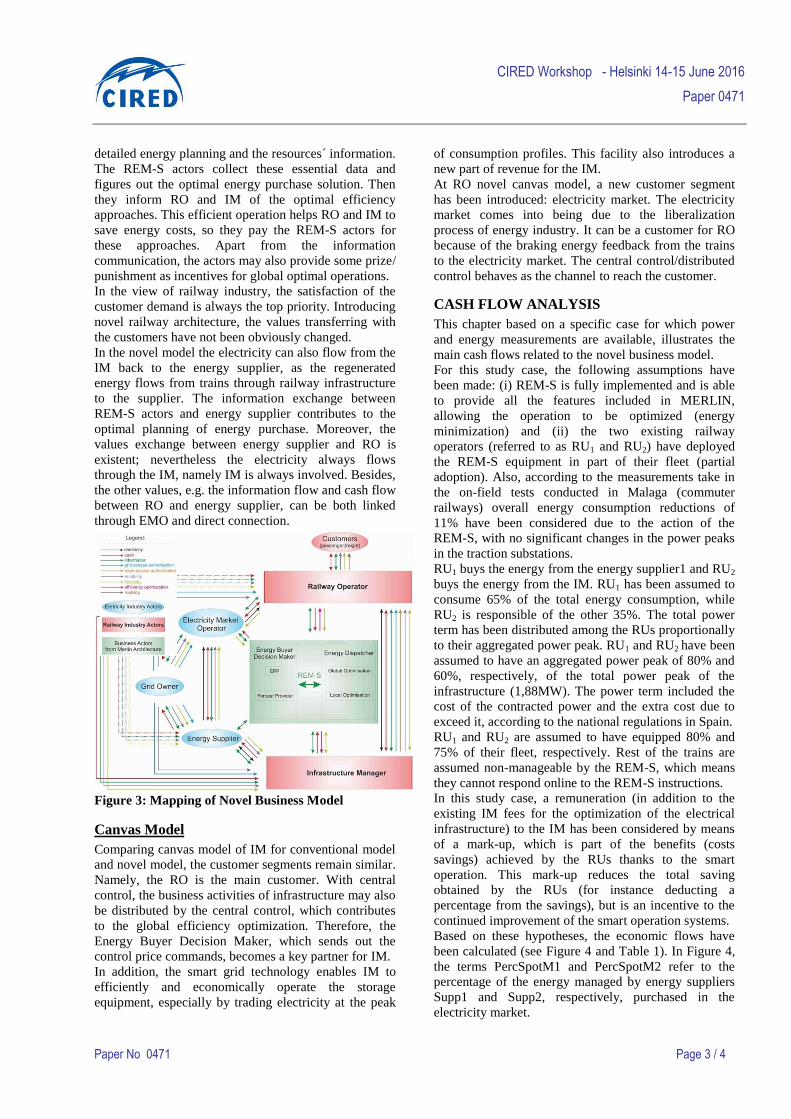
By introducing the REM-S actors, the novel business
model is modified with some new elements, shown in
Figure 3.
Compared to the conventional model, the new mapping
diagram looks more complex owing to the introduced
new role. A new value, efficiency optimization, has
been added to the overall mapping. In the conventional
business of all companies, almost none of the surveyed
partners have any independent department for efficiency
improvement. In the proposed model, the optimal
efficiency is realized by the sum of the functions carried
out by the REM-S.
The values in this model can be both unidirectional and
bidirectional. The information flow between the two
partners is always mutual transmitting. In the novel
model, the feedback electricity from braking energy
leads to some new information exchange and a new
value flow from RO to IM. To guarantee attaining a
sophisticated decision, the RO and the IM offer the
CIRED Workshop - Helsinki 14-15 June 2016
Paper 0471
Paper No 0471 Page 3 / 4
detailed energy planning and the resources´ information.
The REM-S actors collect these essential data and
figures out the optimal energy purchase solution. Then
they inform RO and IM of the optimal efficiency
approaches. This efficient operation helps RO and IM to
save energy costs, so they pay the REM-S actors for
these approaches. Apart from the information
communication, the actors may also provide some prize/
punishment as incentives for global optimal operations.
In the view of railway industry, the satisfaction of the
customer demand is always the top priority. Introducing
novel railway architecture, the values transferring with
the customers have not been obviously changed.
In the novel model the electricity can also flow from the
IM back to the energy supplier, as the regenerated
energy flows from trains through railway infrastructure
to the supplier. The information exchange between
REM-S actors and energy supplier contributes to the
optimal planning of energy purchase. Moreover, the
values exchange between energy supplier and RO is
existent; nevertheless the electricity always flows
through the IM, namely IM is always involved. Besides,
the other values, e.g. the information flow and cash flow
between RO and energy supplier, can be both linked
through EMO and direct connection.
Figure 3: Mapping of Novel Business Model
Canvas Model
Comparing canvas model of IM for conventional model
and novel model, the customer segments remain similar.
Namely, the RO is the main customer. With central
control, the business activities of infrastructure may also
be distributed by the central control, which contributes
to the global efficiency optimization. Therefore, the
Energy Buyer Decision Maker, which sends out the
control price commands, becomes a key partner for IM.
In addition, the smart grid technology enables IM to
efficiently and economically operate the storage
equipment, especially by trading electricity at the peak
of consumption profiles. This facility also introduces a
new part of revenue for the IM.
At RO novel canvas model, a new customer segment
has been introduced: electricity market. The electricity
market comes into being due to the liberalization
process of energy industry. It can be a customer for RO
because of the braking energy feedback from the trains
to the electricity market. The central control/distributed
control behaves as the channel to reach the customer.
CASH FLOW ANALYSIS
This chapter based on a specific case for which power
and energy measurements are available, illustrates the
main cash flows related to the novel business model.
For this study case, the following assumptions have
been made: (i) REM-S is fully implemented and is able
to provide all the features included in MERLIN,
allowing the operation to be optimized (energy
minimization) and (ii) the two existing railway
operators (referred to as RU1 and RU2) have deployed
the REM-S equipment in part of their fleet (partial
adoption). Also, according to the measurements take in
the on-field tests conducted in Malaga (commuter
railways) overall energy consumption reductions of
11% have been considered due to the action of the
REM-S, with no significant changes in the power peaks
in the traction substations.
RU1 buys the energy from the energy supplier1 and RU2
buys the energy from the IM. RU1 has been assumed to
consume 65% of the total energy consumption, while
RU2 is responsible of the other 35%. The total power
term has been distributed among the RUs proportionally
to their aggregated power peak. RU1 and RU2 have been
assumed to have an aggregated power peak of 80% and
60%, respectively, of the total power peak of the
infrastructure (1,88MW). The power term included the
cost of the contracted power and the extra cost due to
exceed it, according to the national regulations in Spain.
RU1 and RU2 are assumed to have equipped 80% and
75% of their fleet, respectively. Rest of the trains are
assumed non-manageable by the REM-S, which means
they cannot respond online to the REM-S instructions.
In this study case, a remuneration (in addition to the
existing IM fees for the optimization of the electrical
infrastructure) to the IM has been considered by means
of a mark-up, which is part of the benefits (costs
savings) achieved by the RUs thanks to the smart
operation. This mark-up reduces the total saving
obtained by the RUs (for instance deducting a
percentage from the savings), but is an incentive to the
continued improvement of the smart operation systems.
Based on these hypotheses, the economic flows have
been calculated (see Figure 4 and Table 1). In Figure 4,
the terms PercSpotM1 and PercSpotM2 refer to the
percentage of the energy managed by energy suppliers
Supp1 and Supp2, respectively, purchased in the
electricity market.
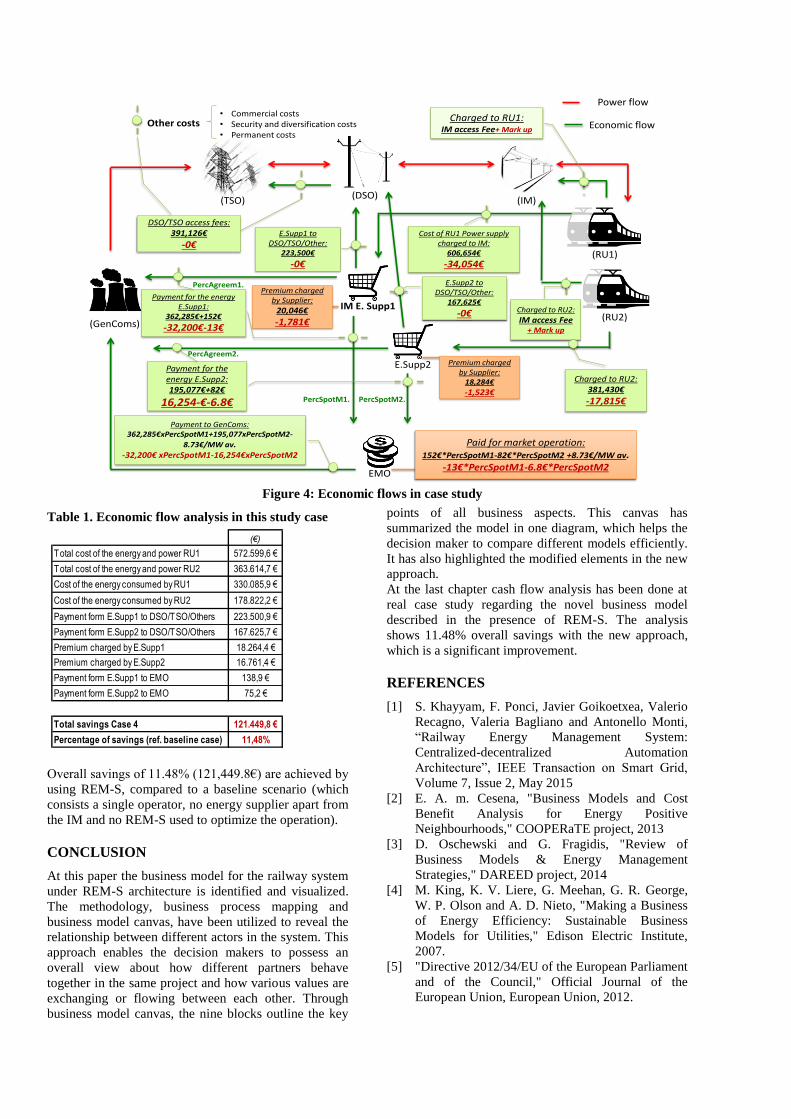
Figure 4: Economic flows in case study
Table 1. Economic flow analysis in this study case
Overall savings of 11.48% (121,449.8€) are achieved by
using REM-S, compared to a baseline scenario (which
consists a single operator, no energy supplier apart from
the IM and no REM-S used to optimize the operation).
CONCLUSION
At this paper the business model for the railway system
under REM-S architecture is identified and visualized.
The methodology, business process mapping and
business model canvas, have been utilized to reveal the
relationship between different actors in the system. This
approach enables the decision makers to possess an
overall view about how different partners behave
together in the same project and how various values are
exchanging or flowing between each other. Through
business model canvas, the nine blocks outline the key
points of all business aspects. This canvas has
summarized the model in one diagram, which helps the
decision maker to compare different models efficiently.
It has also highlighted the modified elements in the new
approach.
At the last chapter cash flow analysis has been done at
real case study regarding the novel business model
described in the presence of REM-S. The analysis
shows 11.48% overall savings with the new approach,
which is a significant improvement.
REFERENCES
[1] S. Khayyam, F. Ponci, Javier Goikoetxea, Valerio
Recagno, Valeria Bagliano and Antonello Monti,
“Railway Energy Management System:
Centralized-decentralized Automation
Architecture”, IEEE Transaction on Smart Grid,
Volume 7, Issue 2, May 2015
[2] E. A. m. Cesena, "Business Models and Cost
Benefit Analysis for Energy Positive
Neighbourhoods," COOPERaTE project, 2013
[3] D. Oschewski and G. Fragidis, "Review of
Business Models & Energy Management
Strategies," DAREED project, 2014
[4] M. King, K. V. Liere, G. Meehan, G. R. George,
W. P. Olson and A. D. Nieto, "Making a Business
of Energy Efficiency: Sustainable Business
Models for Utilities," Edison Electric Institute,
2007.
[5] "Directive 2012/34/EU of the European Parliament
and of the Council," Official Journal of the
European Union, European Union, 2012.
Premium charged by Supplier:
20,046€
-1,781€(GenComs)
(TSO) (DSO) (IM)
IM E. Supp1
EMO
Power flow
Economic flowOther costs
PercAgreem1.
PercSpotM1.
• Commercial costs• Security and diversification costs • Permanent costs
E.Supp2
PercSpotM2.
PercAgreem2.
Charged to RU1:IM access Fee+ Mark up
Charged to RU2:
IM access Fee+ Mark up
Charged to RU2:381,430€
-17,815€
E.Supp1 to DSO/TSO/Other:
223,500€
-0€
E.Supp2 to DSO/TSO/Other:
167,625€
-0€
Cost of RU1 Power supply charged to IM:
606,654€
-34,054€
Premium charged by Supplier:
18,284€
-1,523€
Paid for market operation:152€*PercSpotM1-82€*PercSpotM2 +8.73€/MW av.
-13€*PercSpotM1-6.8€*PercSpotM2
Payment for the energy E.Supp1:
362,285€+152€
-32,200€-13€
Payment for the energy E.Supp2:195,077€+82€
16,254-€-6.8€
DSO/TSO access fees:391,126€
-0€(RU1)
(RU2)
Payment to GenComs:362,285€xPercSpotM1+195,077xPercSpotM2-
8.73€/MW av.-32,200€ xPercSpotM1-16,254€xPercSpotM2
(€)
Total cost of the energy and power RU1 572.599,6 €
Total cost of the energy and power RU2 363.614,7 €
Cost of the energy consumed by RU1 330.085,9 €
Cost of the energy consumed by RU2 178.822,2 €
Payment form E.Supp1 to DSO/TSO/Others 223.500,9 €
Payment form E.Supp2 to DSO/TSO/Others 167.625,7 €
Premium charged by E.Supp1 18.264,4 €
Premium charged by E.Supp2 16.761,4 €
Payment form E.Supp1 to EMO 138,9 €
Payment form E.Supp2 to EMO 75,2 €
Total savings Case 4 121.449,8 €
Percentage of savings (ref. baseline case) 11,48%