Embed Size (px)
Citation preview
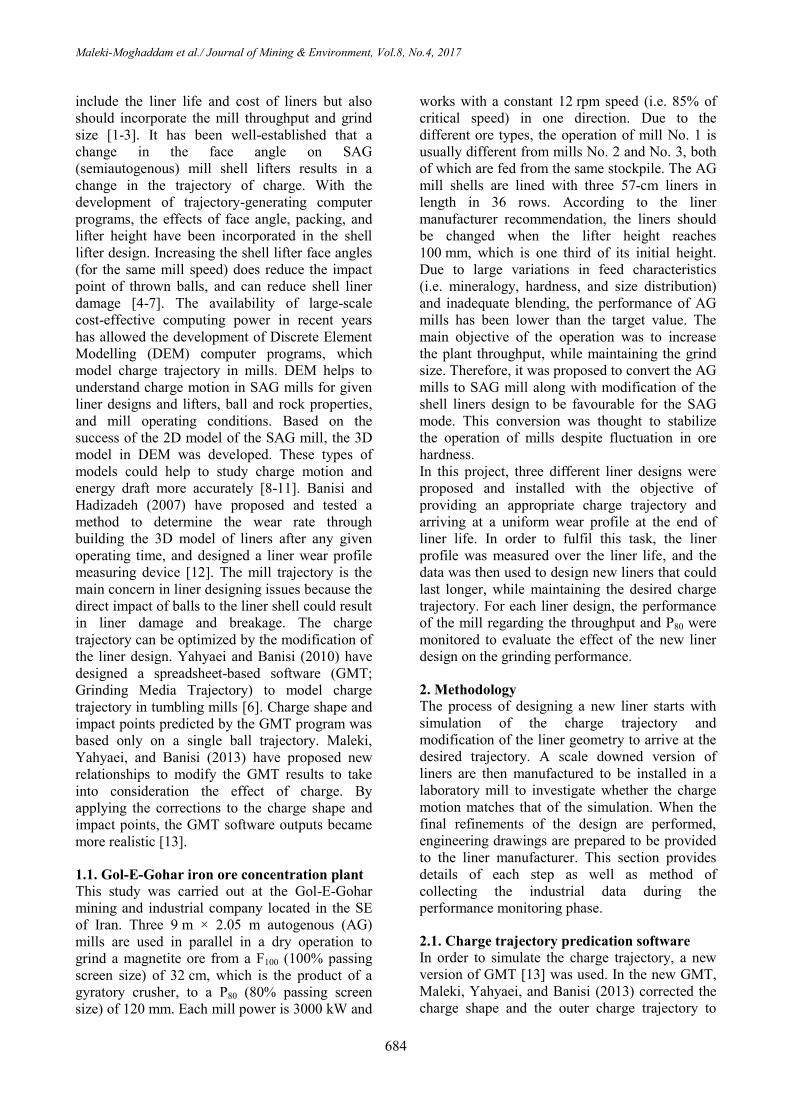
JME Journal of Mining & Environment, Vol.8, No.4, 2017, 683-691.
DOI: 10.22044/jme.2017.954
Evolution of AG mill shell liner design at Gol-E-Gohar concentration plant
M. Maleki-Moghaddam
1*, A.R. Hasankhoei
2, E. Arghavani
2, A. Haji-Zadeh
3, M. Yahyaei
2 and S. Banisi
4
1. Mineral Processing Group, Vali-e-Asr University of Rafsanjan, Rafsanjan, Iran
2. Kashigar Mineral Processing Research Center, Shahid Bahonar University of Kerman, Kerman, Iran 3. Gol-E-Gohar Mining and Industrial Company, Sirjan, Iran
4. Mining Engineering Department, Shahid Bahonar University of Kerman, Kerman, Iran
Received 22 May 2017; received in revised form 10 June 2017; accepted 15 June 2017
*Corresponding author: [email protected] (M. Maleki-Moghaddam).
Abstract
Liner design is becoming an increasingly more important tool for the AG/SAG mill performance
optimization. The Gol-E-Gohar iron ore concentration plant uses three 9 m × 2.05 m autogenous mills (AG)
in parallel in a dry operation. Due to large variations in feed characteristics and inadequate blending, the
performance of AG mills has been lower than the target value. In order to increase the circuit throughput
while maintaining the desired product size, based upon physical and numerical simulations, it was proposed
to convert the AG mills to SAG mills. Simulation of the charge trajectory indicated that increasing the liner
lifter face angle from 7 to 30° could provide an appropriate charge trajectory in the SAG mode. Installation
of the new liners and conversion of AG mill No. 2 to SAG mill, by adding 5% (v/v) balls, resulted in an
overall increase of 31% in throughput (from 419 to 548 t/h). Measurement of the wear profiles of shell liners
indicated that the wear along the liner length was not uniform. In order to arrive at a uniform wear profile, a
new liner design was proposed. Installing the second liner design in AG mill No. 1 and converting it to SAG
mill increased the mill throughput by 18% (from 413 to 489 t/h), while the liner life showed a 7% increase.
Measurement of the wear profiles of the second liner set indicate that the maximum wear occurs in the centre
of the mill. A new liner design was then designed by increasing the width of the lifter top from 12.5 to 15 cm
and increasing the lifter height from 16 to 26 cm to enhance the liner life.
Keywords: AG/SAG Mill, Shell Liner, Gol-E-Gohar Iron Ore, Wear Profile, Non-Uniform Design.
1. Introduction
Mill liner design influences the grinding
performance by affecting the charge trajectory. It
has been observed that downtime of mills for the
replacement of worn liners with new liners is the
main reason for loss of production. Hence, in
designing liners, not only the life but also the
favorable charge trajectory for a given duty
should be considered. The liner profile will
change over its life due to aggressive environment
inside the mill, which, in turn, affects the charge
trajectory resulting in the mill throughput and
grinding performance variation. Although many
research works have been carried out to model the
liner wear and predict the liner profile over the
liner life, due to the complexity of the
mechanisms involved, a comprehensive model is
yet to be proposed, which could provide reliable
results over a wide range of operating conditions.
This has made the design of liners an evolving
activity in practice. Usually by monitoring the
wear profile over few liner life times and
identifying the areas of high and low wear, design
of liner is accordingly adjusted to provide a
uniform profile at the end of liner life, while
maintaining the charge trajectory within the
desirable regime [1, 2].
There are different criteria that could be used to
evaluate the performance of liners. Liner life time
(working hours or tonnes milled) and liner
consumption (liners mass loss per ton milled) are
the two criteria that are commonly utilized.
However, the liner performance not only should
Maleki-Moghaddam et al./ Journal of Mining & Environment, Vol.8, No.4, 2017
684
include the liner life and cost of liners but also
should incorporate the mill throughput and grind
size [1-3]. It has been well-established that a
change in the face angle on SAG
(semiautogenous) mill shell lifters results in a
change in the trajectory of charge. With the
development of trajectory-generating computer
programs, the effects of face angle, packing, and
lifter height have been incorporated in the shell
lifter design. Increasing the shell lifter face angles
(for the same mill speed) does reduce the impact
point of thrown balls, and can reduce shell liner
damage [4-7]. The availability of large-scale
cost-effective computing power in recent years
has allowed the development of Discrete Element
Modelling (DEM) computer programs, which
model charge trajectory in mills. DEM helps to
understand charge motion in SAG mills for given
liner designs and lifters, ball and rock properties,
and mill operating conditions. Based on the
success of the 2D model of the SAG mill, the 3D
model in DEM was developed. These types of
models could help to study charge motion and
energy draft more accurately [8-11]. Banisi and
Hadizadeh (2007) have proposed and tested a
method to determine the wear rate through
building the 3D model of liners after any given
operating time, and designed a liner wear profile
measuring device [12]. The mill trajectory is the
main concern in liner designing issues because the
direct impact of balls to the liner shell could result
in liner damage and breakage. The charge
trajectory can be optimized by the modification of
the liner design. Yahyaei and Banisi (2010) have
designed a spreadsheet-based software (GMT;
Grinding Media Trajectory) to model charge
trajectory in tumbling mills [6]. Charge shape and
impact points predicted by the GMT program was
based only on a single ball trajectory. Maleki,
Yahyaei, and Banisi (2013) have proposed new
relationships to modify the GMT results to take
into consideration the effect of charge. By
applying the corrections to the charge shape and
impact points, the GMT software outputs became
more realistic [13].
1.1. Gol-E-Gohar iron ore concentration plant
This study was carried out at the Gol-E-Gohar
mining and industrial company located in the SE
of Iran. Three 9 m × 2.05 m autogenous (AG)
mills are used in parallel in a dry operation to
grind a magnetite ore from a F100 (100% passing
screen size) of 32 cm, which is the product of a
gyratory crusher, to a P80 (80% passing screen
size) of 120 mm. Each mill power is 3000 kW and
works with a constant 12 rpm speed (i.e. 85% of
critical speed) in one direction. Due to the
different ore types, the operation of mill No. 1 is
usually different from mills No. 2 and No. 3, both
of which are fed from the same stockpile. The AG
mill shells are lined with three 57-cm liners in
length in 36 rows. According to the liner
manufacturer recommendation, the liners should
be changed when the lifter height reaches
100 mm, which is one third of its initial height.
Due to large variations in feed characteristics
(i.e. mineralogy, hardness, and size distribution)
and inadequate blending, the performance of AG
mills has been lower than the target value. The
main objective of the operation was to increase
the plant throughput, while maintaining the grind
size. Therefore, it was proposed to convert the AG
mills to SAG mill along with modification of the
shell liners design to be favourable for the SAG
mode. This conversion was thought to stabilize
the operation of mills despite fluctuation in ore
hardness.
In this project, three different liner designs were
proposed and installed with the objective of
providing an appropriate charge trajectory and
arriving at a uniform wear profile at the end of
liner life. In order to fulfil this task, the liner
profile was measured over the liner life, and the
data was then used to design new liners that could
last longer, while maintaining the desired charge
trajectory. For each liner design, the performance
of the mill regarding the throughput and P80 were
monitored to evaluate the effect of the new liner
design on the grinding performance.
2. Methodology
The process of designing a new liner starts with
simulation of the charge trajectory and
modification of the liner geometry to arrive at the
desired trajectory. A scale downed version of
liners are then manufactured to be installed in a
laboratory mill to investigate whether the charge
motion matches that of the simulation. When the
final refinements of the design are performed,
engineering drawings are prepared to be provided
to the liner manufacturer. This section provides
details of each step as well as method of
collecting the industrial data during the
performance monitoring phase.
2.1. Charge trajectory predication software
In order to simulate the charge trajectory, a new
version of GMT [13] was used. In the new GMT,
Maleki, Yahyaei, and Banisi (2013) corrected the
charge shape and the outer charge trajectory to
Maleki-Moghaddam et al./ Journal of Mining & Environment, Vol.8, No.4, 2017
685
take into account the effect of charge on
trajectory. This was accomplished by applying the
empirical relationships to modify the impact point
angle at the end of its trajectory. The main feature
of GMT is the ability to show the crescent-like
shape of the charge along with the trajectory,
which has not been incorporated in similar
software packages. This provides an accurate
estimation of the charge that can then be used to
adjust the impact point of charge close to where
toe will retain.
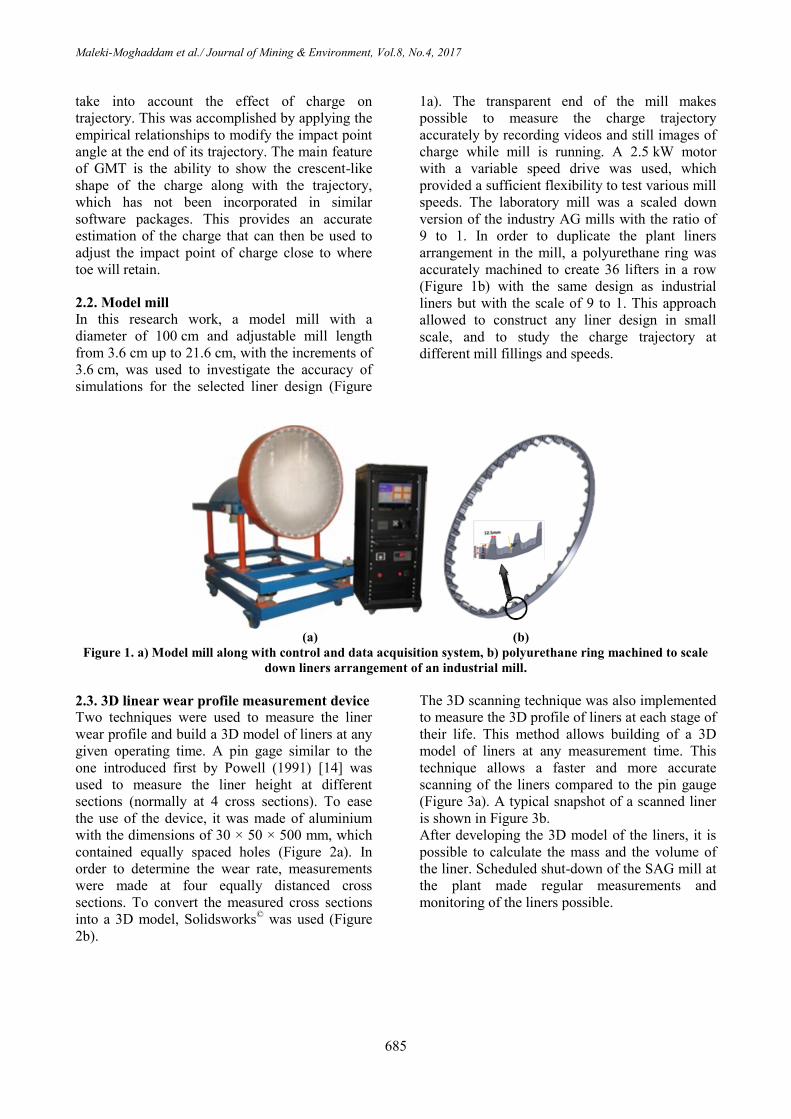
2.2. Model mill
In this research work, a model mill with a
diameter of 100 cm and adjustable mill length
from 3.6 cm up to 21.6 cm, with the increments of
3.6 cm, was used to investigate the accuracy of
simulations for the selected liner design (Figure
1a). The transparent end of the mill makes
possible to measure the charge trajectory
accurately by recording videos and still images of
charge while mill is running. A 2.5 kW motor
with a variable speed drive was used, which
provided a sufficient flexibility to test various mill
speeds. The laboratory mill was a scaled down
version of the industry AG mills with the ratio of
9 to 1. In order to duplicate the plant liners
arrangement in the mill, a polyurethane ring was
accurately machined to create 36 lifters in a row
(Figure 1b) with the same design as industrial
liners but with the scale of 9 to 1. This approach
allowed to construct any liner design in small
scale, and to study the charge trajectory at
different mill fillings and speeds.
(a) (b)
Figure 1. a) Model mill along with control and data acquisition system, b) polyurethane ring machined to scale
down liners arrangement of an industrial mill.
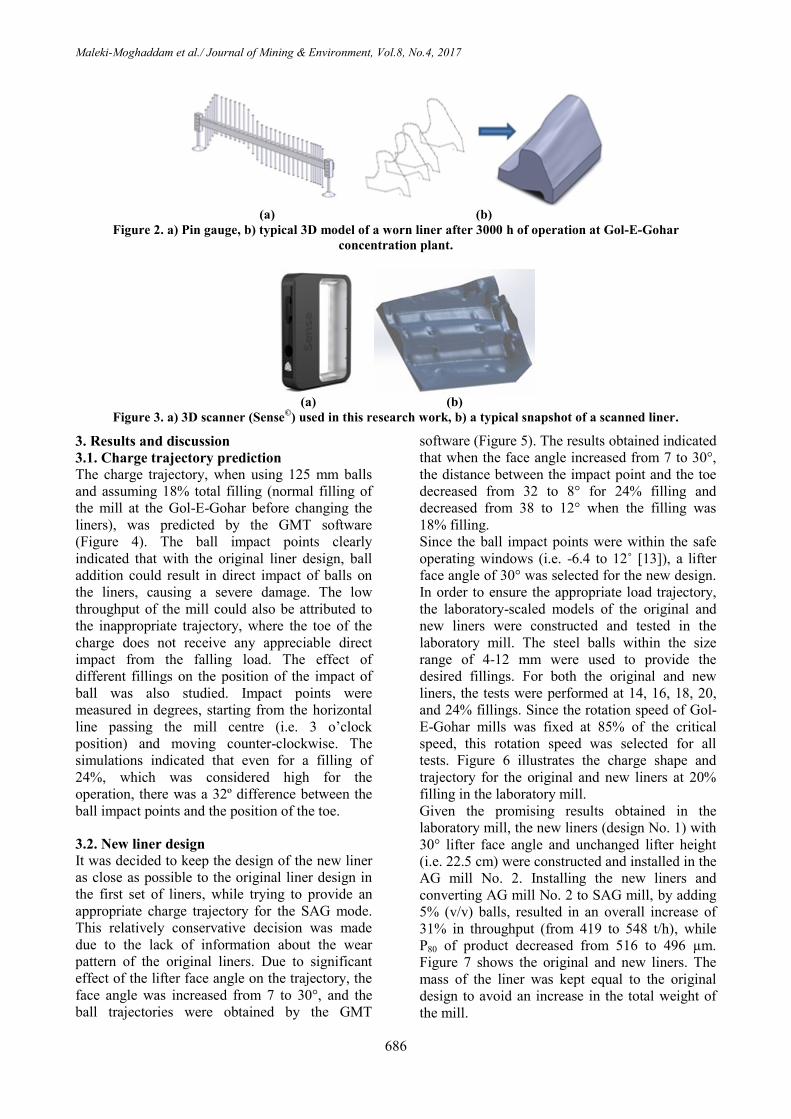
2.3. 3D linear wear profile measurement device
Two techniques were used to measure the liner
wear profile and build a 3D model of liners at any
given operating time. A pin gage similar to the
one introduced first by Powell (1991) [14] was
used to measure the liner height at different
sections (normally at 4 cross sections). To ease
the use of the device, it was made of aluminium
with the dimensions of 30 × 50 × 500 mm, which
contained equally spaced holes (Figure 2a). In
order to determine the wear rate, measurements
were made at four equally distanced cross
sections. To convert the measured cross sections
into a 3D model, Solidsworks© was used (Figure
2b).
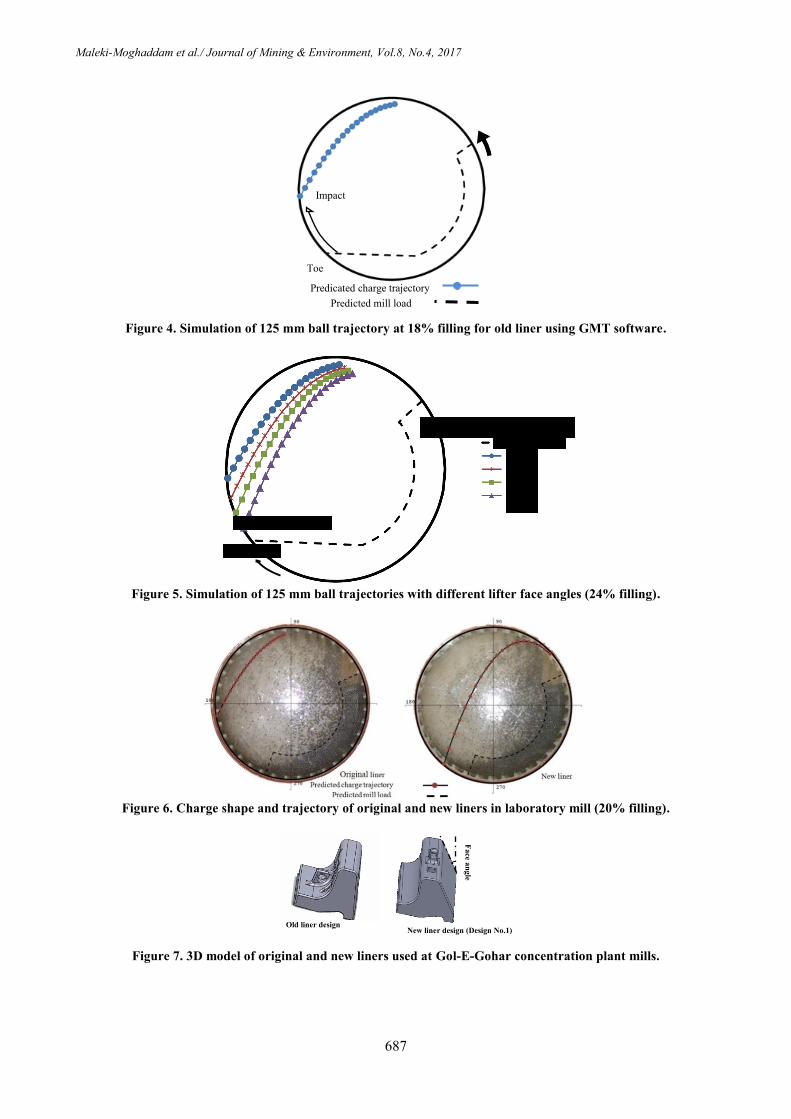
The 3D scanning technique was also implemented
to measure the 3D profile of liners at each stage of
their life. This method allows building of a 3D
model of liners at any measurement time. This
technique allows a faster and more accurate
scanning of the liners compared to the pin gauge
(Figure 3a). A typical snapshot of a scanned liner
is shown in Figure 3b.
After developing the 3D model of the liners, it is
possible to calculate the mass and the volume of
the liner. Scheduled shut-down of the SAG mill at
the plant made regular measurements and
monitoring of the liners possible.
Maleki-Moghaddam et al./ Journal of Mining & Environment, Vol.8, No.4, 2017
686
(a) (b)
Figure 2. a) Pin gauge, b) typical 3D model of a worn liner after 3000 h of operation at Gol-E-Gohar
concentration plant.
(a) (b)
Figure 3. a) 3D scanner (Sense©) used in this research work, b) a typical snapshot of a scanned liner.
3. Results and discussion
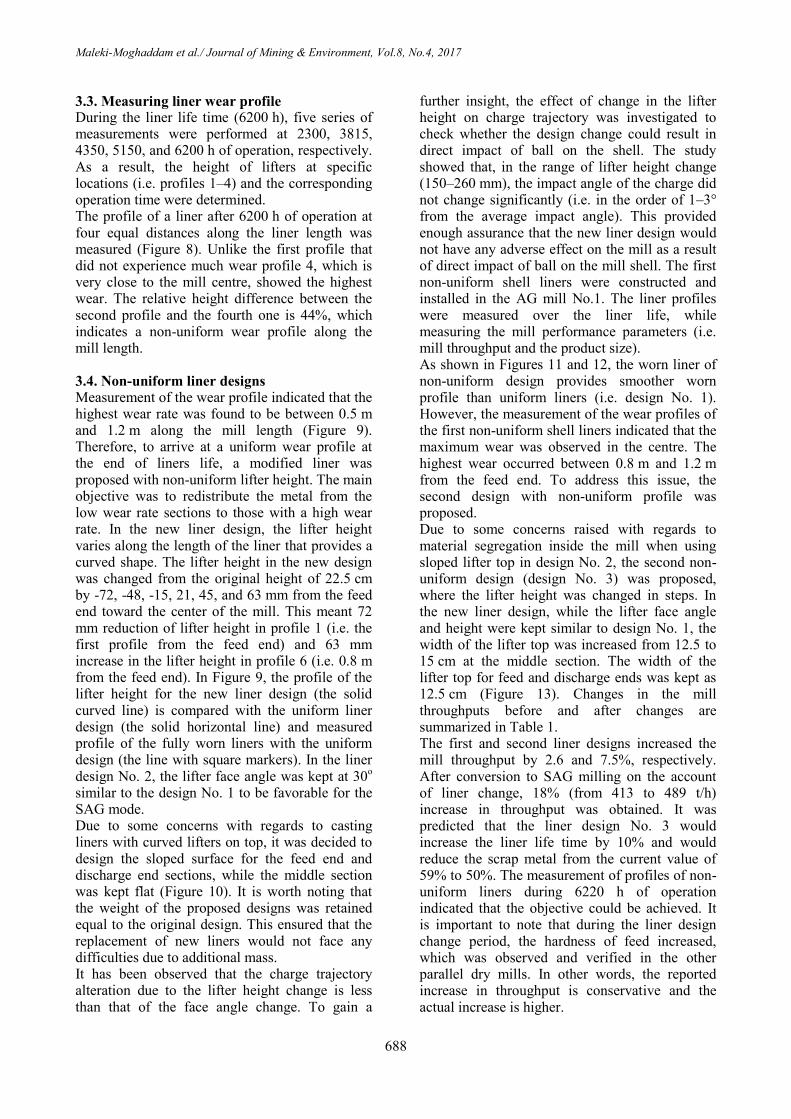
3.1. Charge trajectory prediction
The charge trajectory, when using 125 mm balls
and assuming 18% total filling (normal filling of
the mill at the Gol-E-Gohar before changing the
liners), was predicted by the GMT software
(Figure 4). The ball impact points clearly
indicated that with the original liner design, ball
addition could result in direct impact of balls on
the liners, causing a severe damage. The low
throughput of the mill could also be attributed to
the inappropriate trajectory, where the toe of the
charge does not receive any appreciable direct
impact from the falling load. The effect of
different fillings on the position of the impact of
ball was also studied. Impact points were
measured in degrees, starting from the horizontal
line passing the mill centre (i.e. 3 o’clock
position) and moving counter-clockwise. The
simulations indicated that even for a filling of
24%, which was considered high for the
operation, there was a 32º difference between the
ball impact points and the position of the toe.
3.2. New liner design
It was decided to keep the design of the new liner
as close as possible to the original liner design in
the first set of liners, while trying to provide an
appropriate charge trajectory for the SAG mode.
This relatively conservative decision was made
due to the lack of information about the wear
pattern of the original liners. Due to significant
effect of the lifter face angle on the trajectory, the
face angle was increased from 7 to 30°, and the
ball trajectories were obtained by the GMT
software (Figure 5). The results obtained indicated
that when the face angle increased from 7 to 30°,
the distance between the impact point and the toe
decreased from 32 to 8° for 24% filling and
decreased from 38 to 12° when the filling was
18% filling.
Since the ball impact points were within the safe
operating windows (i.e. -6.4 to 12˚ [13]), a lifter
face angle of 30° was selected for the new design.
In order to ensure the appropriate load trajectory,
the laboratory-scaled models of the original and
new liners were constructed and tested in the
laboratory mill. The steel balls within the size
range of 4-12 mm were used to provide the
desired fillings. For both the original and new
liners, the tests were performed at 14, 16, 18, 20,
and 24% fillings. Since the rotation speed of Gol-
E-Gohar mills was fixed at 85% of the critical
speed, this rotation speed was selected for all
tests. Figure 6 illustrates the charge shape and
trajectory for the original and new liners at 20%
filling in the laboratory mill.
Given the promising results obtained in the
laboratory mill, the new liners (design No. 1) with
30° lifter face angle and unchanged lifter height
(i.e. 22.5 cm) were constructed and installed in the
AG mill No. 2. Installing the new liners and
converting AG mill No. 2 to SAG mill, by adding
5% (v/v) balls, resulted in an overall increase of
31% in throughput (from 419 to 548 t/h), while
P80 of product decreased from 516 to 496 µm.
Figure 7 shows the original and new liners. The
mass of the liner was kept equal to the original
design to avoid an increase in the total weight of
the mill.
Maleki-Moghaddam et al./ Journal of Mining & Environment, Vol.8, No.4, 2017
687
Figure 4. Simulation of 125 mm ball trajectory at 18% filling for old liner using GMT software.
Figure 5. Simulation of 125 mm ball trajectories with different lifter face angles (24% filling).
Figure 6. Charge shape and trajectory of original and new liners in laboratory mill (20% filling).
Figure 7. 3D model of original and new liners used at Gol-E-Gohar concentration plant mills.
Lifter face angle (degrees)
Impact point
Toe
15
20
25
30
Mill load
Predicated charge trajectory
Face a
ngle
Predicted mill load
Old liner design
Toe
New liner design (Design No.1)
Impact point
Maleki-Moghaddam et al./ Journal of Mining & Environment, Vol.8, No.4, 2017
688
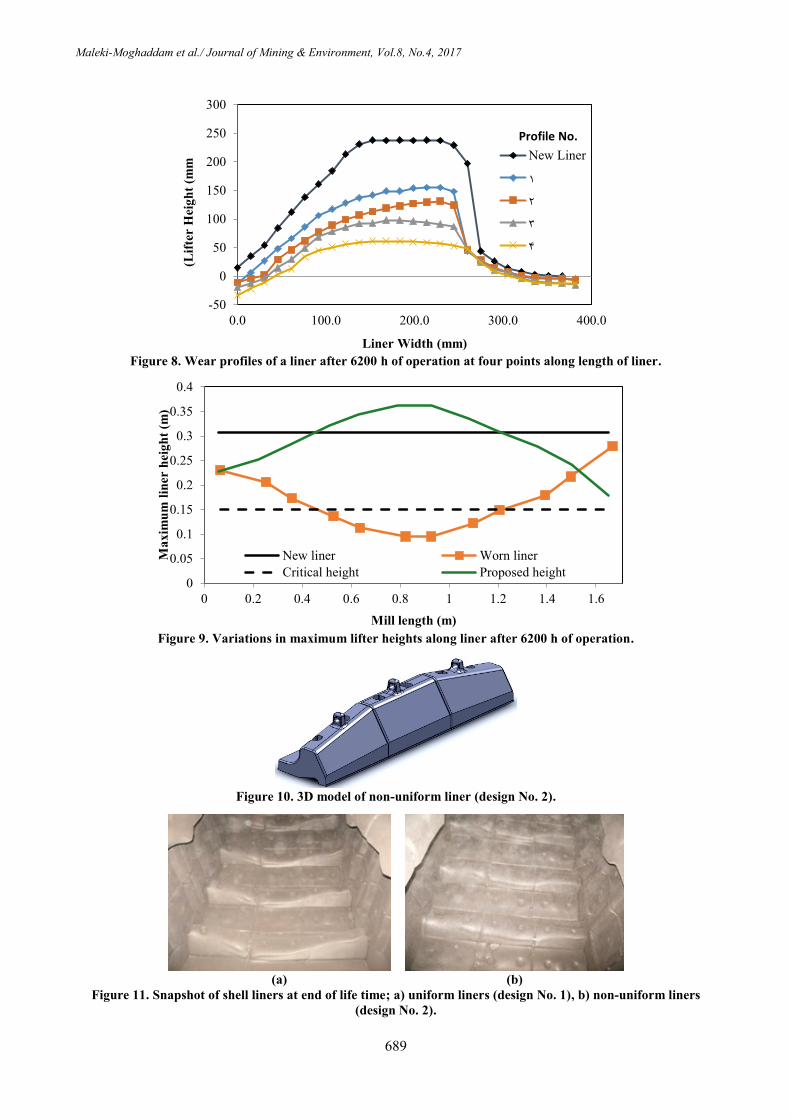
3.3. Measuring liner wear profile During the liner life time (6200 h), five series of measurements were performed at 2300, 3815, 4350, 5150, and 6200 h of operation, respectively. As a result, the height of lifters at specific locations (i.e. profiles 1–4) and the corresponding operation time were determined. The profile of a liner after 6200 h of operation at four equal distances along the liner length was measured (Figure 8). Unlike the first profile that did not experience much wear profile 4, which is very close to the mill centre, showed the highest wear. The relative height difference between the second profile and the fourth one is 44%, which indicates a non-uniform wear profile along the mill length.
3.4. Non-uniform liner designs Measurement of the wear profile indicated that the highest wear rate was found to be between 0.5 m and 1.2 m along the mill length (Figure 9). Therefore, to arrive at a uniform wear profile at the end of liners life, a modified liner was proposed with non-uniform lifter height. The main objective was to redistribute the metal from the low wear rate sections to those with a high wear rate. In the new liner design, the lifter height varies along the length of the liner that provides a curved shape. The lifter height in the new design was changed from the original height of 22.5 cm by -72, -48, -15, 21, 45, and 63 mm from the feed end toward the center of the mill. This meant 72 mm reduction of lifter height in profile 1 (i.e. the first profile from the feed end) and 63 mm increase in the lifter height in profile 6 (i.e. 0.8 m from the feed end). In Figure 9, the profile of the lifter height for the new liner design (the solid curved line) is compared with the uniform liner design (the solid horizontal line) and measured profile of the fully worn liners with the uniform design (the line with square markers). In the liner design No. 2, the lifter face angle was kept at 30
o
similar to the design No. 1 to be favorable for the SAG mode. Due to some concerns with regards to casting liners with curved lifters on top, it was decided to design the sloped surface for the feed end and discharge end sections, while the middle section was kept flat (Figure 10). It is worth noting that the weight of the proposed designs was retained equal to the original design. This ensured that the replacement of new liners would not face any difficulties due to additional mass. It has been observed that the charge trajectory alteration due to the lifter height change is less than that of the face angle change. To gain a
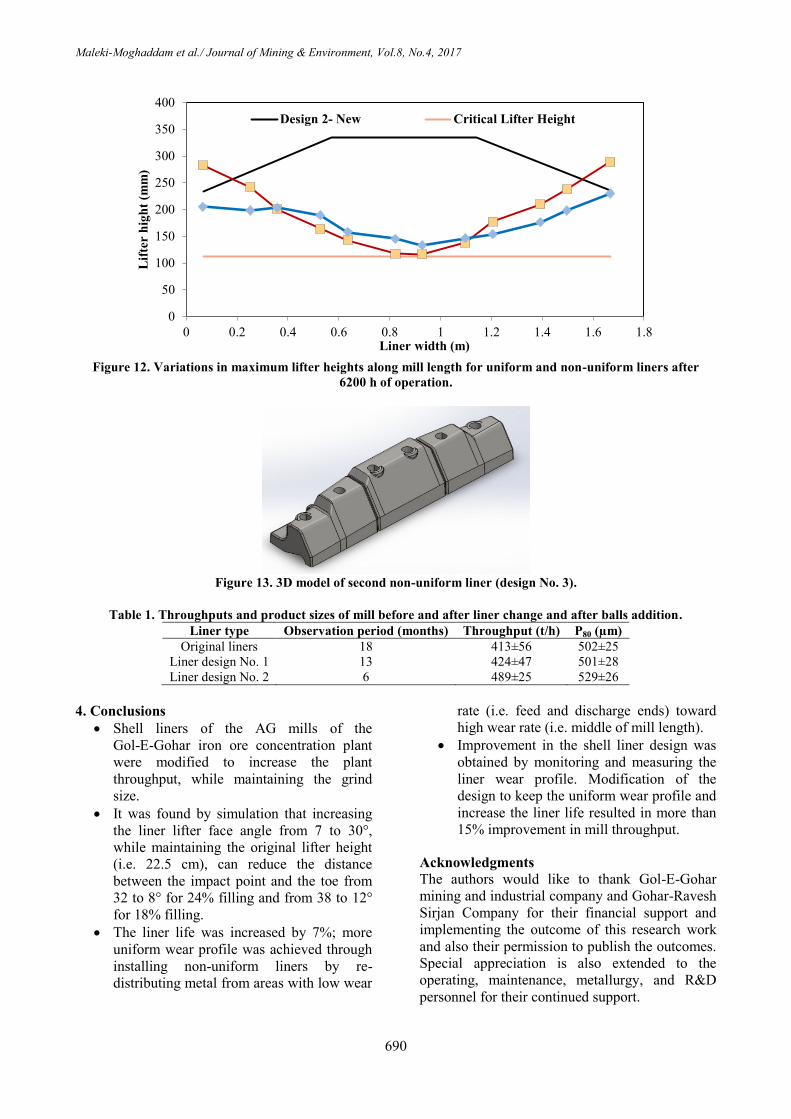
further insight, the effect of change in the lifter height on charge trajectory was investigated to check whether the design change could result in direct impact of ball on the shell. The study showed that, in the range of lifter height change (150–260 mm), the impact angle of the charge did not change significantly (i.e. in the order of 1–3° from the average impact angle). This provided enough assurance that the new liner design would not have any adverse effect on the mill as a result of direct impact of ball on the mill shell. The first non-uniform shell liners were constructed and installed in the AG mill No.1. The liner profiles were measured over the liner life, while measuring the mill performance parameters (i.e. mill throughput and the product size). As shown in Figures 11 and 12, the worn liner of non-uniform design provides smoother worn profile than uniform liners (i.e. design No. 1). However, the measurement of the wear profiles of the first non-uniform shell liners indicated that the maximum wear was observed in the centre. The highest wear occurred between 0.8 m and 1.2 m from the feed end. To address this issue, the second design with non-uniform profile was proposed. Due to some concerns raised with regards to material segregation inside the mill when using sloped lifter top in design No. 2, the second non-uniform design (design No. 3) was proposed, where the lifter height was changed in steps. In the new liner design, while the lifter face angle and height were kept similar to design No. 1, the width of the lifter top was increased from 12.5 to 15 cm at the middle section. The width of the lifter top for feed and discharge ends was kept as 12.5 cm (Figure 13). Changes in the mill throughputs before and after changes are summarized in Table 1. The first and second liner designs increased the mill throughput by 2.6 and 7.5%, respectively. After conversion to SAG milling on the account of liner change, 18% (from 413 to 489 t/h) increase in throughput was obtained. It was predicted that the liner design No. 3 would increase the liner life time by 10% and would reduce the scrap metal from the current value of 59% to 50%. The measurement of profiles of non-uniform liners during 6220 h of operation indicated that the objective could be achieved. It is important to note that during the liner design change period, the hardness of feed increased, which was observed and verified in the other parallel dry mills. In other words, the reported increase in throughput is conservative and the actual increase is higher.
Maleki-Moghaddam et al./ Journal of Mining & Environment, Vol.8, No.4, 2017
689
Figure 8. Wear profiles of a liner after 6200 h of operation at four points along length of liner.
Figure 9. Variations in maximum lifter heights along liner after 6200 h of operation.
Figure 10. 3D model of non-uniform liner (design No. 2).
(a) (b)
Figure 11. Snapshot of shell liners at end of life time; a) uniform liners (design No. 1), b) non-uniform liners
(design No. 2).
-50
0
50
100
150
200
250
300
0.0 100.0 200.0 300.0 400.0
Lif
ter H
eig
ht
(mm
)
Liner Width (mm)
New Liner
1
2
3
4
Profile No.
0
0.05
0.1
0.15
0.2
0.25
0.3
0.35
0.4
0 0.2 0.4 0.6 0.8 1 1.2 1.4 1.6
Ma
xim
um
lin
er h
eig
ht
(m)
Mill length (m)
New liner Worn liner
Critical height Proposed height
Maleki-Moghaddam et al./ Journal of Mining & Environment, Vol.8, No.4, 2017
690
Figure 12. Variations in maximum lifter heights along mill length for uniform and non-uniform liners after
6200 h of operation.
Figure 13. 3D model of second non-uniform liner (design No. 3).
Table 1. Throughputs and product sizes of mill before and after liner change and after balls addition.
Liner type Observation period (months) Throughput (t/h) P80 (µm)
Original liners 18 413±56 502±25
Liner design No. 1 13 424±47 501±28
Liner design No. 2 6 489±25 529±26
4. Conclusions
Shell liners of the AG mills of the
Gol-E-Gohar iron ore concentration plant
were modified to increase the plant
throughput, while maintaining the grind
size.
It was found by simulation that increasing
the liner lifter face angle from 7 to 30°,
while maintaining the original lifter height
(i.e. 22.5 cm), can reduce the distance
between the impact point and the toe from
32 to 8° for 24% filling and from 38 to 12°
for 18% filling.
The liner life was increased by 7%; more
uniform wear profile was achieved through
installing non-uniform liners by re-
distributing metal from areas with low wear
rate (i.e. feed and discharge ends) toward
high wear rate (i.e. middle of mill length).
Improvement in the shell liner design was
obtained by monitoring and measuring the
liner wear profile. Modification of the
design to keep the uniform wear profile and
increase the liner life resulted in more than
15% improvement in mill throughput.
Acknowledgments
The authors would like to thank Gol-E-Gohar
mining and industrial company and Gohar-Ravesh
Sirjan Company for their financial support and
implementing the outcome of this research work
and also their permission to publish the outcomes.
Special appreciation is also extended to the
operating, maintenance, metallurgy, and R&D
personnel for their continued support.
0
50
100
150
200
250
300
350
400
0 0.2 0.4 0.6 0.8 1 1.2 1.4 1.6 1.8
Lif
ter h
igh
t (m
m)
Liner width (m)
Design 2- New Critical Lifter Height
Maleki-Moghaddam et al./ Journal of Mining & Environment, Vol.8, No.4, 2017
691
References [1]. Parks, J.L. (1989). Liner design, materials and
operating practices for large primary mills. Proc,
Advances in Autogenous and Semiautogenous
Grinding Technology. Vancouver. pp. 565-580.
[2]. Yahyaei, M., Banisi, S. and Hadizadeh, M. (2009).
Modification of SAG mill liner shape based on 3-D
liner wear profile measurements. International Journal
of Mineral Processing. 91: 111-115.
[3]. Toor, P., Franke, J., Powell, M., Bird, M. and
Waters, T. (2013). Designing liners for performance
not life. Minerals Engineering. 43-44: 22-28.
[4]. Powell, M., Smit, I., Radziszewski, P., Clear, P.,
Rattray, B., Eriksson, K.G. and Schaeffert, L. (2006).
Selection and design of mill liners. Proc, Advances in
Comminution. pp. 331-376.
[5]. Rajamani, R. (2006). Semi-autogenous mill
optimization with DEM simulation software. In:
Advances in Comminution. SME Publication. Part 4.
pp. 209-214.
[6]. Yahyaei, M. and Banisi, S. (2010). Spreadsheet-
based modeling of liner wear impact on charge motion
in tumbling mills. Minerals Engineering. 23: 1213-
1219.
[7]. Maleki-Moghaddam, M., Yahyaei, M. and Banisi,
S. (2012). Converting AG to SAG mills: The Gol-E-
Gohar Iron Ore Company case. Powder Technology.
217: 100-106.
[8]. Mishra, B.K. and Rajamani, R.K. (1993).
Numerical simulation of chrage motion in ball mills-
lifter bar effect. Minerals and Metallurgical Processing.
pp. 86-90.
[9]. Cleary, P.W. (2001). Charge behavior and power
consumption in ball mills: sensitivity to mill operating
conditions, liner geometry and charge composition.
International Journal of Mineral Processing. 63: 79-
114.
[10]. Kalala, T.J., Breetzke, M. and Moys, M.H.
(2008). Study of the influence of liner wear on the load
behaviour of an industrial dry tumbling mill using the
discrete element method (DEM). International Journal
of Mineral Processing. 86 (1): 33-39.
[11]. Powell, M.S., Weerasekara, N.S., Cole, S.,
LaRoche, R.D. and Favier, J. (2011). DEM modelling
of liner evolution and its influence on grinding rate in
ball mills. Minerals Engineering. 24 (3): 341-351.
[12]. Banisi, S. and Hadizadeh, M. (2007). 3-D liner
wear profile measurement and analysis in industrial
SAG mills. Minerals Engineering. 20: 132-139.
[13]. Maleki-Moghaddam, M., Yahyaei, M. and Banisi,
S. (2013). A method to predict shape and trajectory of
charge in industrial mills. Minerals Engineering. 46-47:
157-166.
[14]. Powell, M.S. (1991). The effect of liner design on
the motion of the outer grinding elements in a rotary
mill. International Journal of Mineral Processing. 31:
163-193.
6931چهارم، سال م، شماره هشتدوره زیست، پژوهشی معدن و محیط -نشریه علمیو همکاران/ مالکی مقدم
گهر گل یصنعت و یمعدن شرکت خودشکن یاهایآس جداره یآسترها طرح روند تغییر
4یسیبن صمدو 2ییایحی محسن، 3زاده یحاج ریام، 2یارغوان احسان، 2ییحسنخو رضایعل، *1مقدم یمالک یمصطف
ایران، رفسنجان )عج( عصر یولبخش مهندسی معدن، دانشگاه -1
، ایرانکرمان باهنر دیشه دانشگاهبخش مهندسی معدن، گر، یکاش مواد یفرآور قاتیتحق مرکز -2
سیرجان، ایران گهر، گل یصنعت و یمعدن شرکت -3
، ایرانکرمان باهنر دیشه دانشگاه ،بخش مهندسی معدن -4
65/1/2067، پذیرش 22/5/2067ارسال
[email protected]* نویسنده مسئول مکاتبات:
چکیده:
خشک خودشککن یایآس سه از ،گهر گل آهن سنگ شرکت یاکنیآس مدار در. است خودشکن مهین و خودشکن یاهایآس طراحی آستر روشی برای افزایش کارایی
کمتکر ی،ورود مکواد اتیخصوص در رییتغ به توجه با اهایآس نیا در شیخردا ییکارا. کنند یم کار یمواز طور به که شود یم استفاده متر 05/2 طول و متر 3 قطر با
پیشکنهاد ی فیزیکی و عکددی ها یساز هیشبانجام با خودشکن مهین به خودشکن یایآس لیتبد ،پژوهش نیا در لذا. است هیاول طرح در شده گرفته نظر در مقدار از
بکا داد نشکان بکار حرککت ریمسک یسکاز هیشکب . ابکد ی شیافزا ایآس به یورود بار تیظرف و شده شتریزتر بیر محصول یبند دانه معدن سنگ بهتر شیخردا با تا شد
خودشککن یایآس در دیجد آستر نصب از پس. شود یم فراهم بار حرکت مناسب ریمس باالبر، ارتفاع رییتغ بدون و درجه 90 به 7 از آستر باالبر صفحه هیزاو شیافزا
دهیسکا یآسکترها یبررسک . افتی شیافزا( ساعت برتن 595به 963% )از 96 آن تیظرف ،ایآس به گلوله ٪5 کردن اضافه با خودشکن مهین به آن لیتبد و 2شماره
رسیدن به روند سایش یکنواخکت در جهت آستر کنواختیریغ طرح لذا .است کنواختیریغ خودشکن یاهایآس جداره یآسترها در شیسا یالگو که داد نشان شده
بکر تکن 953بکه 969% )از 65 آسکیا تیک ظرف ،خودشکن مهین به آن لیتبد و 6شماره خودشکن یایآسبا نصب طرح دوم آستر در .شدانتهای عمر آستر پیشنهاد
بنابراین طرح سوم آستر بکا افکزایش افتد؛ یمبررسی سایش آسترهای طرح دوم نشان داد حداکثر سایش در وسط آسیا اتفاق .افتی شیافزا% 7( و عمر آستر ساعت
ارا ه شد. متر یسانت 21تا 61ی ارتفاع باالبر از ا پلهو افزایش متر یسانت 65به 5/62عرض باالبر از
آسیاهای خودشکن و نیمه خودشکن، آستر جداره، معدن سنگ آهن گل گهر، مقطع سایش، طرح غیریکنواخت. کلمات کلیدی: