Embed Size (px)
Citation preview

1104 VOLUME 132M O N T H L Y W E A T H E R R E V I E W
q 2004 American Meteorological Society
Evolution and Structure of the Mesoscale Convection and Its Environment: A CaseStudy during the Early Onset of the Southeast Asian Summer Monsoon
JIAN-JIAN WANG
Goddard Center for Earth Science and Technology, University of Maryland, Baltimore County, Baltimore, and Mesoscale AtmosphericProcesses Branch, NASA Goddard Space Flight Center, Greenbelt, Maryland
(Manuscript received 25 February 2003, in final form 14 November 2003)
ABSTRACT
The evolution and structure of mesoscale convection in the South China Sea (SCS) region are documentedfor the first time mainly using the dual-Doppler radar dataset collected during the South China Sea MonsoonExperiment (SCSMEX) in 1998. In particular, this study focuses on the convection associated with a subtropicalfrontal passage during the early onset of the southeast Asian monsoon (SEAM).
For the case of 15 May 1998, interaction between the tropical monsoon flow and frontal circulation playedan important role in the evolution and structure of mesoscale convection. In the prefrontal region, the south-westerly monsoon flow converged with the southwesterly frontal flow to generate northeast-to-southwest-orientedconvection. In the postfrontal region, the southwesterly monsoon flow converged with the northerly frontal flowto produce a wide convective line with an east-to-west orientation. In addition, the convergence between thesoutherly monsoon flow and the northerly postfrontal flow generated deeper and stronger low-level convergence.The postfrontal convection was more intense and deeper than the prefrontal convection.
The precipitation and kinematic structure of mesoscale convection were studied with special attention tosignificant departures from archetypal tropical oceanic convection. On 15 May, prefrontal convection showeda straight upward rainfall and updraft pattern with little tilt as a result of moderate vertical wind shear. Themaximum low-level convergence and updraft were 20–30 km behind instead of within 1–2 km of the leadingedge. Although the convection was intense with maximum reflectivity over 50 dBZ, both pre- and postfrontalconvection had a very limited stratiform region as a result of a dry environmental upper layer. The observedmesoscale convection had a tendency to form stratiform rain ahead of the convective rain, and two differentmodes of leading stratiform structure were found separately in pre- and postfrontal convection.
1. Introduction
The east Asian monsoon is known to be one of themost complex monsoon systems on earth and an im-portant component of the regional and global climate.In summer, the east Asian monsoon circulation is char-acterized by southwesterly flow at low levels (e.g., 850hPa) and northeasterly flow at upper levels (e.g., 200hPa). The heavy rainfalls associated with the summermonsoon, for example, mei-yu in the Yangtze Valley ofChina and baiu in Japan, are important to many eco-nomic activities in the southeast and east Asian coun-tries.
Given the importance of the east Asian summer mon-soon, great attention has been given to its descriptionand investigation. Zhu (1934) conducted a pioneeringstudy on the relationship between the summer monsoonand the rainfall in China. Since then, numerous studieshave focused on the various aspects and components of
Corresponding author address: Dr. Jian-Jian Wang, Mesoscale At-mospheric Processes Branch, NASA Goddard Space Flight Center,Greenbelt, MD 20771.E-mail: [email protected]
the east Asian summer monsoon (e.g., Chang and Krish-namurti 1987) including the climatology of wind fields(e.g., Fu et al. 1983; Krishnamurti 1985; Tao and Chen1987), the advance and retreat of the monsoon systems(e.g., Tu and Huang 1944; Ding 1994), the seasonal andannual variation of monsoon rainfall (e.g., Ninomiyaand Murakami 1987; Lau et al. 1988), and the effectsof the Tibetan Plateau (e.g., Murakami and Ding 1982;He et al. 1987). In addition, the mei-yu and baiu frontsin the summer monsoon season are known as the mostactive subtropical fronts (Ninomiya 1984). A great dealof dedicated observational and numerical studies havebeen conducted to study the severe rainfall events as-sociated with the mei-yu and baiu fronts (e.g., Ninomiyaand Akiyama 1971; Tao and Chen 1987; Nagata andOgura 1991; Cho and Chen 1995; Kawatani and Tak-ahashi 2003). The past observational studies on the mei-yu and baiu fronts can be classified into two categories:synoptic and climatological analyses based on conven-tional surface and rawinsonde observations to documentthe associated dynamical phenomena (e.g., Akiyama1979; Ninomiya 1984; Tao and Chen 1987) and analysesusing remote sensing techniques including satellite and

MAY 2004 1105W A N G
FIG. 1. Dual-Doppler radar network over the South China Seaduring SCSMEX. The big dashed circles indicate the radar-observingdomain, while the small solid circles show the dual-Doppler radaranalysis regime.
radar observations to investigate the cloud-physical andkinematic aspects (e.g., Akiyama 1984; Fukao et al.1988).
Although the heavy rainfall in mei-yu/baiu seasonusually occurs in June and July, the summer monsoonrainfall in east Asia starts about a month earlier in theIndochina and South China Sea (SCS) area (Tao andChen 1987). This summer monsoon region includingthe SCS and surrounding landmasses is referred to asthe southeast Asian monsoon (SEAM). Better under-standing of the characteristics of the rainfall evolutionand structure in the early monsoon season will extendour knowledge of the formation and maintenance ofheavy rainfall events during the monsoon season. Nev-ertheless, compared to the numerous studies focusingon planetary-scale phenomena and mei-yu and baiufronts in the mid to late stages of the SEAM, little at-tention has been given to mesoscale aspects of precip-itating systems during its onset (transient) period. Theorganization and evolution of convection is of consid-erable interest because it lies at the heart of heat, mois-ture, and momentum fluxes. It is also believed to be azeroth-order problem that must be understood beforeappropriate parameterizations can be developed for usewith global models.
The structure and evolution of the tropical convectionhas been studied for decades by many investigators (e.g.,Houze and Cheng 1977; Jorgenson and LeMone 1989;Zipser and Lutz 1994). Since a comprehensive datasetis often necessary for detailed analysis of mesoscaleconvection, most of studies take advantage of field ex-periments that target specific locations such as the westPacific (Trier et al. 1996; Jorgenson et al. 1997; Rick-enbach and Rutledge 1998), east Atlantic (Zipser 1977;Barnes and Sieckman 1984), and Maritime Continent(Rutledge et al. 1992; Williams et al. 1992). Conversely,systematic studies on the mesoscale convection in thesummer Asian monsoon region are quite rare. A notablecontribution to this topic is the work related to the sum-mer Monsoon Experiment (MONEX, 1978–79; Fein andKuettner 1980). Although MONEX was designed pri-marily to document large-scale aspects of monsoons, itprovided an opportunity to investigate the internal struc-ture of mesoscale convection. With limited radar ob-servations, Smith and Lin (1984) developed an analyt-ical model for flow over a mountain barrier, whichcaused cumulus development over the west coast ofIndia with an offshore extension of at least 30 km.Grossman and Durran (1984) carried out a more detailedstudy to explain the rainfall maximum farther offshore.
The Australian Monsoon Experiment (AMEX, 1986–87; Holland et al. 1986) also investigated some aspectsrelated to the Asian monsoon. It was found that thestructure and evolution of north Australian cloud lineswere closely related to the characteristics of the envi-ronmental airflow in the monsoon season (Drosdowskyet al. 1989). During the first half of AMEX Phase I,summer monsoonal westerly flow prevailed in the low
levels, and the region experienced more extensive deepconvection. Tropical squall lines consisting of a sharpleading edge of deep convective cells and a trailingmesoscale stratiform anvil were observed. After the re-establishment of winter monsoonal easterly flow at thelow level in the second half of AMEX Phase I, longthin cloud lines, generally including a series of smallcumuli, often occurred. As the easterly flow strength-ened and extended farther, the lines became more in-tense.
With focus mainly on the Arabian Sea, Bay of Bengal,and northern Australian regions, neither MONEX norAMEX could explore the east Asian monsoon. Althoughthe Asian summer monsoon starts from the onset ofSEAM, the SCS area was the last area in the Asianmonsoon region without systematic observation and re-search. As traditional observational networks are farfrom being adequate, the lack of detailed observationsbecame a significant obstacle to the research on SEAMand related physical processes. The South China SeaMonsoon Experiment (SCSMEX; Lau et al. 2000) wasan international field experiment conducted in SCS andsurrounding areas during May–June 1998. The goal ofthe mesoscale program was to define the initiation,structure, evolution, and dynamics of precipitation pro-cesses associated with the onset and mature phase ofthe SEAM. To accomplish this objective, two Dopplerradars were deployed to form a dual-Doppler radar anal-ysis region (Fig. 1) in the northern SCS. Other con-ventional meteorological observational platforms in-cluding rawinsonde, surface observation network, andrain gauges were also collocated at the radar sites andsurrounding areas. These observations allowed for the

1106 VOLUME 132M O N T H L Y W E A T H E R R E V I E W
collection of a comprehensive dataset to describe theenvironment, evolution, rainfall characteristics, and ki-nematic structure of the monsoon convective systems.
In this paper, the evolution and structure of mesoscaleconvection observed by SCSMEX dual-Doppler radarnetwork on 15 May 1998 are studied. Unlike previousstudies of heavy rainfall events accompanying the quasi-stationary mei-yu/baiu fronts in the mature phase of thesummer Asian monsoon, this study focuses, for the firsttime, on the mesoscale convection associated with afront passage during the onset period of SEAM. Theinteraction between the tropical monsoon flow and thefrontal circulation and the role of such interaction onthe evolution and structure of the mesoscale convectionare investigated. The rainfall characteristics and three-dimensional kinematic structure of the pre- and post-frontal convection are also examined in detail.
2. Data analysis
The data used in this study are primarily radar datacollected during SCSMEX. During SCSMEX, the Na-tional Oceanographic and Atmospheric Administration(NOAA)/Tropical Ocean Global Atmosphere (TOGA)radar and Bureau of Meteorology Research Centre(BMRC; Australia) C-band polarimetric (C-POL) radarwere deployed to form a dual-Doppler radar network(Fig. 1). The C-POL radar was installed at DongshaIsland (20.78N, 116.78E) and operated on a 24-h basis(with several short breaks) throughout May and June1998. The TOGA radar was installed on the People’sRepublic of China Shiyan 3 research vessel (about20.48N, 116.88E) and operated continuously during thetwo intensive observing periods (IOPs; 5–25 May and5–25 June). The length of the radar baseline was about40–45 km, a frequently used range to provide a goodareal coverage with reasonable spatial resolution. Thetypical scanning procedure during SCSMEX involved10-min 3608 surveillance scans at 15 elevations from0.58 to 308. Over this period, the target mesoscale systemstudied was assumed stationary. Additional sources ofinformation on larger-scale background include synopticreanalysis charts from the National Centers for Envi-ronmental Prediction (NCEP), Geosynchronous Mete-orological Satellite-5 (GMS-5) imagery, sounding net-work, and automatic weather stations (AWS).
The main approach of the radar data analyses in thisstudy is the traditional ‘‘dual-Doppler’’ synthesis meth-ods. Those polarimetric variables collected by C-POLradar were only used to help the data quality control andcorrections for attenuation of the C-band radar data. TheC-POL data were processed to eliminate sea clutter usingthresholds in the correlation coefficient between hori-zontally and vertically polarized echo signals ( r HV) andthe total differential phase (Cdp) (Ryzhkov and Zrnic1998). To correct the reflectivity attenuation, and empir-ical method described by Carey et al. (2000) was adapted.A linear relationship between the observed differential
propagation phase (fdp, calculated from Cdp), and thepropagation-affected Z was derived by the statistical anal-ysis of the C-POL data. The estimated ‘‘correction fac-tors’’ from the above relationship were then used to es-timate the attenuation throughout the radar echo volume.For case of 15 May, the derived formula for reflectivityattenuation correction is
Z 5 Z 1 0.0623f .corrected measured dp
During IOP-1 of SCSMEX, the radar operationgroups at Dongsha Island and Shiyan 3 noticed that thereflectivity data from TOGA were much lower than thatfrom C-POL. The C-POL operation group did severalcareful calibrations before and during the experimentand believed that C-POL reflectivity data were veryreliable. On the other hand, the TOGA operation groupwas unable to do a complete calibration because of itsbroken signal generator. After the experiment, it wasdetermined that TOGA reflectivities were reduced be-cause of a misaligned bandpass filter. To quantify thedifferences, cross-correlation analyses of the reflectivityfields from both radars were performed. In general, theTOGA reflectivities were about 13–16 dBZ lower thanC-POL reflectivities. In an independent intercomparisonamong TOGA, C-POL, and spaceborne Tropical Rain-fall Measuring Mission (TRMM; Kummerow et al.2000) precipitation radar (PR), E. Anagnostou (2000,personal communication) at the University of Connect-icut found that PR’s reflectivities were about 12–13 dBZhigher than TOGA, but 1–2 dBZ lower than C-POL.Although there is no ‘‘truth’’ in these comparisons, thecloser the two measurements were to agreement, thegreater the confidence we had. Moreover, in a recentcomparison among PR, U.S. Weather Surveillance Ra-dars-1988 Doppler (WSR-88D), and research radarsfrom other TRMM field campaigns, Anagnostou et al.(2001) figured that the main candidate for systematicdifferences exceeding 1.5 dBZ is the ground radar sys-tem calibration bias. Based on these results, it was de-termined that the reflectivity data from C-POL weremuch more reliable than those from TOGA. As a result,only the reflectivity data from C-POL were used in thisstudy. An intercomparison of radial velocity fields fromthe two radars was also done in an area near the baseline.The results showed that the radial velocity fieldsmatched each other very well.
Radial velocity data were manually unfolded usingthe National Center for Atmospheric Research (NCAR)Research Data Support System (RDSS) software (Oyeand Carbone 1981). The C-POL radar reflectivity andradial velocity fields were then interpolated to a Car-tesian grid using the NCAR REORDER software (Mohret al. 1986). Three-dimensional kinematic fields wereobtained by synthesizing the radial velocity measure-ments from the two radars within the analysis domainusing NCAR Custom Editing and Display of ReducedInformation in Cartesian Space program (CEDRIC;Mohr et al. 1986). With a 40–45-km-long baseline, a

MAY 2004 1107W A N G
308 intersection angle between beams of the radar, re-quired by a good quality dual-Doppler radar analysis(Davies-Jones 1979), extended out to about 75 km fromthe baseline. The dual-Doppler radar analysis domain(shown in Fig. 1) was approximately a 150 km 3 100km area extending 15 km in the vertical. The wide beam-width of TOGA radar (1.558) compared to C-POL (1.08)resulted in a coarser resolution in dual-Doppler analysis.In our dual-Doppler radar analysis, the horizontal gridspacing was 1.5 km, and the vertical grid spacing was0.75 km. The radial velocity analysis was advected toa common time, generally close to the middle of eachvolume.
Vertical air motion was calculated from the diver-gence field at each level using the anelastic continuityequation and the upward integration method. The up-ward integration method was required mainly becauseof the poor sensitivity of TOGA radar in the upper levelswith weak reflectivity. In fact, the 13–16-dBZ low biasfrom TOGA reflectivity not only underestimated the re-flectivity, but also resulted in incomplete data coveragein the areas with weak echoes because the noise thresh-old was performed at a much higher level than expected.The incomplete data sample at the top levels made itdifficult to defining the upper-boundary condition. With-out the establishment of upper-boundary conditions,variational and downward integration are impossibleand the estimation of vertical velocity using upwardintegration in this study is subject to some uncertainty.The analysis process outlined in Wakimoto et al. (1998,their appendix) was adapted to estimate the error fromupward integration. Assuming that the standard devia-tion of the mean Doppler velocities measured by thetwo Doppler radars are 1 m s21, the standard deviationof the vertical velocity for upward integration at 1.5,4.5, and 9.0 km is about 1.5, 3.3, 6.9 m s21, respectively.Apparently, the derived vertical velocities are not reli-able in the upper regions. There are two options for thepresentation of the vertical velocity field: one is to ter-minate the syntheses at a certain level, for example, 4.5km; the other is to show the complete field with fullawareness of the possible errors at high levels. Aftercareful cross-checking of the derived vertical velocityand the reflectivity fields, it was found that at least thepattern of the vertical velocity matches the pattern ofreflectivity very well, even at high levels in most cases.Therefore, to have a better picture of the case study, thederived vertical velocities will be shown in the wholevertical cross sections. However, no conclusion will bemade from the derived vertical velocities at high levels.
To filter noise in the vertical velocities, the horizontalwind fields derived from the dual-Doppler solution arelightly smoothed with a two-pass Leise (1981) filterprior to divergence calculation and vertical integration.This procedure significantly damps wavelengths up to6.0 km and removes wavelengths of less than 4.5 km.The storm motion vector was calculated by inspection
of the leading edge of the convection in a sequentialhorizontal cross section of low-level reflectivity.
3. Synoptic conditions
Prior to 15 May 1998, the SCS region was mainlyunder the control of the subtropical high over the west-ern Pacific (Ding and Liu 2001). On the western flankof the subtropical high, low-level airflow at 850 hPaexhibited southeasterly winds in the southern SCS andsouthwesterly winds in the northern SCS (Fig. 2a). Atthe 200-hPa level, there was an anticyclone located inthe Bay of Bengal (Fig. 2b). Under its influence, north-erly flow was observed over the SCS. NCEP reanalysisrevealed low-level divergence and upper-level conver-gence over the SCS (Figs. 2a and 2b, respectively),providing an unfavorable condition for the developmentof convection. From the beginning of IOP-1 on 5 May,frontal passages from northwestern China to the coastalregions were observed periodically with an interval of2–4 days. The well-developed frontal cloud/rainbandsusually extended from south China along the coast tothe Korean peninsula and Japan. An example of thistype of frontal cloud band on 11 May is shown in Fig.3a. However, once the southern part of the frontal cloudband passed the China coast into the northern SCS, thecloud/rainbands associated with the front weakened anddissipated (Fig. 3b).
The large-scale wind fields started to change, espe-cially at low levels, in the northern SCS on 15 May. At850 hPa, compared to the wind field days before, thewestern Pacific subtropical high had retreated eastward(Johnson and Ciesielski 2002) and a cyclonic systemhad developed in eastern China. More importantly, therewere two more branches of airflow joining the existingsouthwesterly flow. The first branch originated in theBay of Bengal to the east of the equatorial twin cyclone(only the northern cyclone centered near 108N and 828Eshown in Fig. 2c). The second branch was the cross-equatorial airflow, originating in the Australian regionin the Southern Hemisphere. These two airflows are themain components forming the east Asian summer mon-soon (Tao and Chen 1987). The merging of equatorialflows into the northern SCS region also resulted in anincrease of relative humidity to over 70% (not shown),a significant mark of the onset of SEAM (Lau et al.2002). At 200 hPa, the strong anticyclone continuouslydominated the Indochina region and the surroundingSCS area to form a diffluent field (Fig. 2d). The windfields in the SCSMEX domain shifted from low-leveldivergence (2.5 3 1026 s21) and upper-level conver-gence (220 3 1026 s21) on 11 May to low-level con-vergence (25.0 3 1026 s21) and upper-level divergence(10 3 1026 s21) on 15 May (Fig. 2). On 15 May, apronounced frontal cloud band oriented from southwestto northeast covered most coastal regions of southeast-ern China (Fig. 3c). Different from the frontal cloudband reaching the coastal region 4 days earlier, this sys-

1108 VOLUME 132M O N T H L Y W E A T H E R R E V I E W
FIG. 2. NCEP constant pressure level reanalysis at (a) 850 hPa, (b) 200 hPa valid at 0000 UTC 11 May, (c) 850 hPa, and (d) 200 hPa validat 0000 UTC 15 May. The divergence is shaded as shown in the middle of the figure. The squares denote the domain shown in Fig. 1.
tem was able to move into the sea without weakening.In fact, after the start of the summer monsoon onset inthe northern SCS, the intensity and areal coverage ofthe frontal cloud bands even became enhanced in thesouthern portion (partially over the northern SCS) (Fig.3d). Similar to the observations during AMEX (Dros-dowsky et al. 1989), deep and intense convection in theSCS region also developed in the summer monsoonalwesterly regime.
The case of 15 May studied herein was the first in-tense mesoscale convection observed in the SCS regionduring SCSMEX and also recorded as the rainiest dayat Dongsha Island during IOP-1 with 43-mm precipi-tation. The AWS data (not shown) indicated that thearrival of the surface cold front in the tropical SCSregion, characterized by a mild temperature drop and aquick wind direction shift, occurred at Dongsha Islandaround 0600 UTC (LST 5 UTC 1 8 h). The prefrontalsounding taken at Shiyan 3 at 0600 UTC (Fig. 4) showedmoderate instability—the convective available potentialenergy (CAPE) was about 1690 J kg21. The low-level(surface to 800 hPa) wind shear was westerly with amagnitude of 5.4 m s21 or 2.8 3 1023 s21. The liftingcondensation level (LCL) was at 938 hPa (;0.7 km),
while the level of free convection (LFC) was at 847 hPa(;1.5 km). The postfrontal sounding launched at Dong-sha Island at 1200 UTC (Fig. 4) had a deep saturatedlayer from near surface to about 400 hPa. The post-frontal sounding showed a higher CAPE of 1950 J kg21
along with a lower LCL (1001 hPa) and LFC (973 hPa).The increased CAPE seems to be the result of less stableair coming with the tropical monsoon flow. The maindifference of the wind profile from the two soundingswas that winds at the lower levels (900–600 hPa) shiftedfrom prefrontal southwesterly to postfrontal northwest-erly.
4. The evolution of convection
When discussing mesoscale convection related to afrontal passage, terms of prefrontal and postfrontal pre-cipitation are frequently used for activities before andafter the passage of the surface front. However, fromprevious synoptic-scale analysis of east Asian monsoonconvection (e.g., Chen and Hui 1992; Ding 1994), wefound that the front at 850 hPa, characterized by a windshear line separating the southwesterly winds ahead ofit and northwesterly winds behind it, could be a better

MAY 2004 1109W A N G
FIG. 3. Infrared imageries from GMS-5 at (a) 0000 UTC 11 May, (b) 1500 UTC 11 May, (c) 0000 UTC 15 May, and (d) 1200 UTC15 May.
choice to decide the pre- and postfrontal convection.First, the front at 850 hPa has more dynamic links tothe occurrence of deep convection. As the cold air pen-etrated to the subtropical region, the cold pool behindthe surface front was rather shallow with a sharp verticaltilt. The lifting along the leading edge of the shallowcold air alone may not be adequate to initiate convec-tion, and heavy precipitation frequently occurs ahead ofthe 850-hPa trough (Chen and Hui 1992; Li et al. 1997).The vertical tilt of the front on 15 May was on the orderof 1/300 (not shown) similar to that observed during
Taiwan Mesoscale Experiment (TAMEX) (Chen andHui 1992), compared to a 1/50 to 1/100 vertical tilt ofa midlatitude cold front. Second, the front at 850 hPahas more thermodynamic significance on the develop-ment of deep convection. The low-level water vaporflux has its maximum near the front at 850 hPa, whilemost water vapor concentrates in the boundary layerbelow 850 hPa (Ding 1994). In the present study, theconvective characteristics in the pre- and postregion ofthe front at 850 hPa were quite different although theywere both behind the surface front. Hereinafter, discus-

1110 VOLUME 132M O N T H L Y W E A T H E R R E V I E W
FIG. 4. Sounding launched from research vessel Shiyan 3 at 0600UTC (solid lines) and Dongsha Island at 1200 UTC (dashed lines)15 May 1998.
FIG. 5. C-POL radar reflectivity (dBZ ) at 2.5 km MSL at (a) 0600, (b) 0700, (c) 0830, and (d) 0930 UTC 15 May1998.
sion on the evolution and structure of the mesoscaleconvection will be in the context of its relative positionto the front at 850 hPa.
At 0600 UTC, the main feature in the radar domainwas the linear northeast-to-southwest-oriented frontalrainband with a width of about 40 km (A in Fig. 5a).This rainband had a maximum radar reflectivity over 50dBZ and was close to the front at 850 hPa. Ahead ofthe convective line A, there were two groups of newlyformed convection at 50 km east to C-POL. Johnsonand Keenan (2001) noted that the convection in theprefrontal region might orient relative to the low-leveland/or midlevel wind shear. The convective line aheadof the front (B in Fig. 5a) was oriented north to south(Fig. 6a), while secondary convective lines (B1 and B2in Fig. 5a) located in the middle of east dual-Dopplerlobe were oriented east to west. In their studies on west-ern Pacific convection, LeMone et al. (1998) found theorientation of the convection tends to be perpendicularto the low-level wind shear if its magnitude is over 4m s21. They also noted that the secondary lines were
MAY 2004 1111W A N G
FIG. 6. (a) Radar reflectivity (dBZ ) and vertical air motion con-toured at an interval of 0.5 m s21 and (b) system-relative wind flowand divergence (1023 s21) at 1.5 km MSL valid at 0620 UTC. The20 m s21 scaling vector for winds is shown to the upper-right-handcorner of (b).
parallel to the low-level shear. On 15 May, the low-levelvertical wind shear in the prefrontal region is westerlywith the magnitude of 5.4 m s21 (Fig. 4). The orientationof convective lines was consistent with the conclusionmade by LeMone et al. The convection had a largerareal coverage an hour later at 0700 UTC (Fig. 5b).Meanwhile, between the two northeast-to-southwest-oriented convective lines and beyond, there was a ten-dency to form a narrow convective line (D in Fig. 5b)perpendicular to the earlier convective lines. This newline intensified and became the primary feature in thefollowing hours. Another feature at 0700 UTC was thenew developing convective line (C in Fig. 5b) in theprefrontal region with low-level southwesterly windsprevailing (not shown). The development and structureof this convective line were very similar to the earlyformed prefrontal convection (B in Fig. 5) that will beanalyzed in detail in section 5.
From continuous dual-Doppler analysis of windfields, it was found that the front at 850 hPa separatingthe prefrontal southerly and the postfrontal northerlywinds passed the C-POL at about 0730 UTC (notshown). In the next hour, the orientation of the mainconvective line exhibited a dramatic change. As shownin Fig. 5c, the main radar echo became an east–west-oriented convective line across the dual-Doppler radaranalysis region. This was the convective line that had
started to form at 0700 UTC (Fig. 5b) in the postfrontalregion. The primarily northeast-to-southwest-orientedconvective lines dominant in earlier hours weakenedduring the same period. The area with radar reflectivityover 40 dBZ reduced remarkably. Two weak north–south-oriented lines existed to the north of main con-vection as the residual from the early convection. Alarge area of stratiform precipitation of the prefrontalconvection was also observed in the northeast quadrant.During SCSMEX, this type of sharp change of convec-tive orientation in a time period of several hours wasalso frequently observed in other cases. At 0930 UTC,the north-to-south-oriented convective lines continuedto dissipate with some stratiform precipitation remain-ing. On the other hand, the primary east-to-west-ori-ented convective lines became more pronounced, show-ing increased areal coverage and enhanced intensity(Fig. 5d).
5. The structure of convection
For case of 15 May, we have performed 5-h of dual-Doppler radar analysis from 0600 to 1100 UTC whenthe frontal convection was in the dual-Doppler analysislobes. After carefully examining over 60 continuous ra-dar volumes from both C-POL and TOGA radar, we areable to study the development and evolution of everyconvective band in detail. The representative horizontaland vertical cross sections are selected and presented inthis section to illustrate the horizontal and vertical struc-ture of the pre- and postfrontal convection at their ma-ture phase.
a. Prefrontal convection
The convection that was ideally located in the dual-Doppler radar analysis lobe about 15–70 km east of C-POL (B in Fig. 5a) was chosen as a representative ofthe prefrontal convection. The system-relative windfields at 1.5 km MSL (Fig. 6b) show that low-levelinflow was from front (southeast) to rear (northwest).The system-relative wind inflow speed ahead of the con-vective lines was about 6–7 m s21. The deceleration ofthe relative southeasterly inflow ahead of the convectiveline caused a northeast-to-southwest band of low-levelconvergence up to 1.8 3 1023 s21. A cellular updraftzone corresponding to the strong low-level convergencewas located in the central portion of the reflectivity max-ima, with a maximum vertical speed over 2.0 m s21
(Fig. 6a). This updraft zone resulting from the conver-gence of the southerly flow was the key to maintain theintensity of the convection. To the northwest of (behind)the convective core, a narrow band of divergent flowand descending flow was found matching the minimumreflectivity of 15–25 dBZ (Fig. 6). The downdraft fol-lowed updraft likely as a result of a pressure deficit inthe low levels induced hydrostatically by the rearwardspreading of warm and moist air from the updraft dy-

1112 VOLUME 132M O N T H L Y W E A T H E R R E V I E W
FIG. 7. Vertical cross section of (a) reflectivity and line-normal system-relative wind and (b) vertical air motioncontoured at an interval of 1 m s21 along XY in Fig. 7 valid at 0620 UTC.
namically by the interaction of the updraft and the am-bient wind shear (Weisman 1992). Meanwhile, thedownward motion following the updraft center and re-flectivity maxima indicated a descending front-to-rearflow (Rotunno and Klemp 1982). Ahead of the reflec-tivity maximum, there was an area of weak subsidenceassociated with the weak divergent flow. As addressedin section 2, because of the low sensitivity of TOGAradar, many useful data at upper levels were lost whenthe reflectivity was weak. This restricted the ability todo quality dual-Doppler radar analysis at upper levels.Therefore, no upper-level horizontal cross section is dis-cussed.
A vertical cross section through the convective com-plex (Fig. 7) is made to characterize the structure ofairflow and vertical circulation. The echo top, denotedby 10-dBZ reflectivity isopleth, was at about 11 kmMSL. Compared to the typical rearward sloping struc-ture observed in the tropical convection (e.g., Jorgensonet al. 1997), a notable characteristic of this convectionwas that the reflectivity pattern was almost straight up-ward without much slope. When downshear tilting up-draft usually occurred in an environment with strongvertical wind shear (Rotunno et al. 1988), the convectionwith little tilt as shown in Fig. 7 was often found in anenvironment without strong vertical wind shear (Fig. 4).During the summer monsoon onset period in 1998, the
westerly winds generally dominated through the wholeconvective layer as the onset of upper-level northwest-erly winds occurred at the end of transition. As a resultof limited vertical wind shear, the straight upward echopattern with little tilt was commonly observed duringthe period. The front-to-rear low-level inflow startedfrom the lowest level with the maximum strength below1.5 km MSL. The maximum low-level convergence andupdraft were located in the rear part of the convection(45–50 km east of C-POL) about 20–30 km behind theleading edge (70–75 km east of C-POL; Fig. 7b). Thisis different from other tropical convective lines previ-ously studied (LeMone et al. 1984; Jorgenson et al.1997), which often have a maximum low-level conver-gence and updraft in a narrow ribbon within 1–2 km ofthe leading edge. Numerous studies have emphasizedthe important role played by the cold pool and the con-vective downdraft in the maintenance of the convection(e.g., Wakimoto 1982). The evaporative cooling of rain-drops results in cool air brought down to the surface inthe form of convective downdrafts. Downdrafts spreadat the ground and carry some of the momentum frommiddle levels, thereby enhancing the convergence at theoutflow boundary. For those tropical convections withmaximum updraft at the leading edge, the systematicdowndraft was located immediately following the lead-ing edge. However, in a straight upward cell with little

MAY 2004 1113W A N G
tilt (Fig. 6a), the potential downdraft near the leadingedge would encounter the low-level inflow and updraft.While the downdraft was usually weaker than the up-draft in the convective core (LeMone and Zipser 1980),the downdraft was only found farther behind, about 7–10 km from the reflectivity maxima (Figs. 6 and 7)where the updraft was weak. In addition, this structurealso implies that inflow must pass a raining area aheadof the convective core before entering the convectivetowers. From a simple 2D numerical simulation, Parker(2002) argued that the evaporative cooling actually oc-curs over a relatively deep layer, with cooling increasingwith height over the lowest 2–2.5 km. Therefore, thenet effect of this process is to further destabilize thelow levels and result in an increased CAPE. Thus, thecooling of inflow parcels ahead of the convective coredid not appear to be a detriment to long-lived systems.In addition, Parker and Johnson (2001) noted that stronglifting along the edge of the cold surface outflow (i.e.,the front) might also be helpful to bring the air parcelto the level of free convection. The updraft was mainlylocated just east of the reflectivity maxima (Fig. 7b) ata maximum speed of 6.7 m s21. This moderate updraftwas comparable to most tropical convection (Zipser andLeMone 1980; Jorgenson and LeMone 1989).
Ahead of the convective cells, system-relative west-erly rear-to-front flow was observed at the midlevels(e.g., 4.5 km MSL), blowing the particles ahead of theline (Fig. 7a). In most tropical convection, the stratiformrains were found behind their convective counterpart(trailing mode) as a result of the mid- to upper-leveloutflow in the same direction as low-level inflow (Jor-genson et al. 1997; Protat and Lemaitre 2001). However,the prefrontal convection studied here had a tendencyto form the stratiform rain ahead of the convective rain(leading mode; Figs. 6a and 7a) in response to the for-ward advection of hydrometers. In a climatologicalstudy, Parker and Johnson (2000) found that the trailingor paralleling stratiform rain occurs in over 80% of con-vective lines observed in the midlatitudes over the Unit-ed States, while the leading stratiform cases only ac-count for 19%. However, during the onset of SEAM,leading stratiform rain occurred quite often. In additionto the case of 15 May, there were other convective cases(e.g., 24 May) showing similar structure (Wang 2001).At the upper levels, strong easterly system-relativewinds dominated over the convective core (Fig. 7a).Compared to the prefrontal sounding (Fig. 4), thesehigh-level easterly winds were purely convection drivenas described in a two-dimensional theoretical model byMoncrieff (1992).
Interestingly, with such strong system-relative east-erly winds, the radar echoes at the upper levels werelimited in a small area. The hydrometers were concen-trated over the top of the intense convective core, butlacked an extension to the downwind side. The envi-ronmental conditions before the arrival of the frontshowed a very dry layer at 300 hPa (;9 km MSL; Fig.
4). The dry air in the upper levels might result in aquick evaporation and sublimation of the forming strat-iform cloud when the hydrometers were quickly blownfrom the top of the convection. The moistering at theupper levels due to the evaporation and sublimation ofthe hydrometers was also evident from the postfrontalsounding collected at 1200 UTC at Dongsha Island (Fig.4) which exhibited a much moister upper layer com-pared to 6 h earlier.
b. Postfrontal convection
The prefrontal convection observed in the radar do-main weakened after the passage of the front at 850 hPa.At 0830 UTC, the remaining stratiform rainfall fromprefrontal convection covered most of the northeastquadrant (Fig. 5c). The new east-to-west-oriented con-vection that formed after 0700 UTC in the postfrontalregion became the most active convection in the region.At 0930 UTC, the dominant features were two intenseeast-to-west-oriented convective lines (D and E in Fig.5d). The most pronounced change of postfrontal con-vection from prefrontal convection was the sharp ori-entation change along with the considerable intensifi-cation of convection (Fig. 8a). Compared to prefrontalconvection, the postfrontal convection had a much larg-er area of strong convection (reflectivity over 40 dBZ)along with several convective cores showing maximumreflectivity of 55 dBZ.
After the front passage, the northerly flow behind thefront prevailed at lower levels in the large northern do-main, while the southerly flow from the tropical regionaccompanying the monsoon onset was present in thesmall southern domain (Fig. 8b). Contrasting to the pre-frontal convection resulting from the convergence ofseveral branches of southerly flows, the enhancementand maintenance of the postfrontal convection were re-lated to the convergence generated from the postfrontalnortherly flow from midlatitudes and the southerly mon-soon flow from the Tropics. At 1.5 km MSL, a nearlyeast–west-oriented wind shear line separating the sys-tem-relative southeasterly flow from south and the sys-tem-relative northeasterly flow from north was observedat the leading (southern) edge of the radar echo (Fig.8b). As a result, a low-level convergence zone with themaximum magnitude up to 3.0 3 1023 s21 was locatednear the leading edge of the convective line. The post-frontal low-level convergence generated by two airflowsin the opposite direction was much stronger than thatof the prefrontal area with two branches of flows inalmost the same direction. The maximum updraft as-sociated with the postfrontal convergence at 1.5 kmMSL was up to 3.1 m s21. It is noted that the convectiveline and the low-level convergence zone had little move-ment in the north–south direction. This quasi-stationaryconvective line was caused by the persistent low-levelconvergence resulting from the interaction of southerlytropical monsoon airflow and the northerly midlatitude

1114 VOLUME 132M O N T H L Y W E A T H E R R E V I E W
FIG. 8. Same as Fig. 6, except valid at 0930 UTC, and vertical air motion is contoured at an interval of 1 m s 21.

MAY 2004 1115W A N G
FIG. 9. Same as Fig. 7, except along AA9 in Fig. 8 and valid at 0930 UTC.
airflow. The forming and maintenance of this stableeast–west-oriented convective line, though during a rel-atively short period, was very similar to that of the mei-yu/baiu frontal rainfall affecting mainland China andJapan since June as a result of the interaction betweenthe air mass from the midlatitudes and the tropical air-flow from the lower latitudes.
Compared to the prefrontal convection (Fig. 7), thepostfrontal convection was taller and more intense (Fig.9). The maximum reflectivity was over 55 dBZ, withan echo top surpassing 13 km MSL. The similar contrastbetween the pre- and postfrontal convection was alsofound in other cases associated with a frontal passage,for example, cases of 17 and 19 May, during the periodof summer monsoon onset. The contrast in convectiveintensity could be related to a much stronger low-levelconvergence and updraft in the postfrontal region thanthat in the prefrontal area (Figs. 6 and 8). It is alsonoticed that the postfrontal sounding at 1200 UTCshowed a higher CAPE and more instability than theprefrontal sounding at 0600 UTC (Fig. 4). This couldbe a result of more tropical airflows coming to the regionassociated with the onset of the summer monsoon. Thehigher CAPE and more instability may also contributeto a more intense postfrontal convection as well. Thestructure of the postfrontal convection (Fig. 9) containssome common characteristics of tropical convection.
The low-level inflow was from the warm and moisttropical air ahead of the leading edge. With the maxi-mum low-level convergence near the narrow leadingedge of the convective line, the center of the updraftwas in front of the convective core. There was a rapidreflectivity reduction with height above the melting level(;4.5 km MSL) as a result of relatively weak updraftvelocities in the Tropics (Zipser and LeMone 1980). Themaximum updraft velocity was recorded over the con-vective core at an elevated height (7.5 km MSL) witha magnitude of 5.5 m s21 (Fig. 9b). However, departuresfrom the typical tropical convection were also evident.The upward inflow did not go through to the rear partat the upper levels. Instead, it turned to a rear-to-frontflow above 7.5 km MSL. As a result, a stratiform echoformed at upper levels ahead of the convective line re-sulting from the frontward advection of hydrometerscontributed by the relative flow across the leading edge.While both the prefrontal and postfrontal convectionexhibited a formation of leading stratiform region aheadof the convective counterpart, there was different ki-nematic structure behind them. In the prefrontal con-vection, the stratiform rain up-front was caused by themidlevel rear-to-front flow. Although strong front-to-rear flow dominated at upper levels in prefrontal con-vection, the dry environmental air near 300 hPa at 0600UTC (Fig. 4) prevented the stratiform rain from forming
1116 VOLUME 132M O N T H L Y W E A T H E R R E V I E W
FIG. 10. CFADs and mean profiles of radar reflectivity, system-relative u and y components, and divergence at (left)0620 and (right) 0930 UTC 15 May. Bin size is 4 dBZ for reflectivity, 1 m s21 for u and y components, and 1 3 1023
s21 for divergence. Note the change in scale in the divergence CFADs and mean profiles.
in the trailing area. In the postfrontal convection, theleading stratiform rain was caused by strong rear-to-front upper-level outflow.
Following the 20–30-km-wide convective area wasan area of minimum reflectivity with descending airflowin the region. Farther north (right-hand side of Fig. 9)
was a patch of stratiform rain. This stratiform rain wasnot the trailing part from the convective portion but wasthe residual from the earlier convection. A brightbandstructure (;4.5 km MSL; Fig. 9a) in the reflectivitydata was located at and below the melting layer. In moststratiform regions, mesoscale updraft exists above the

MAY 2004 1117W A N G
bright band while mesoscale downdraft is present belowthe bright band (e.g., Biggerstaff and Houze 1991).However, at the time shown here, the descending flowexisted throughout the whole layer of the stratiform re-gion. This was consistent with the fact that the stratiformrain was from decaying convection rather than the dy-namically active trailing stratiform echo. A much lowerecho top in the stratiform region than that in the con-vective region (Fig. 9a) provided more evidence for theexistence of descending flow at mid- to upper levels.
c. Statistical vertical structure
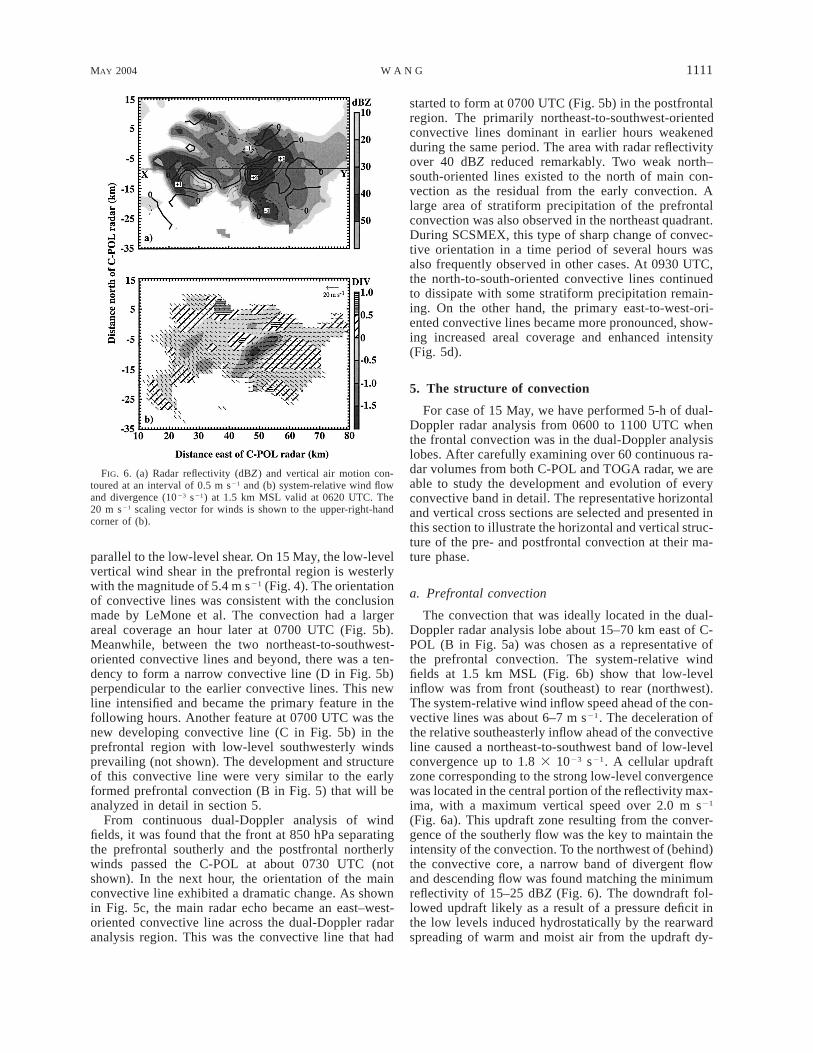
The contoured frequency by altitude diagrams(CFADs; Yuter and Houze 1995) is a convenient toolfor displaying multiple histograms in a two-dimensionalformat. The relative frequency of occurrence of a givenparameter can be shown at each height. To study andcompare the vertical structure of the prefrontal and post-frontal convection, we examine mean profiles andCFADs of reflectivity, system-relative u component(eastward) and y component (northward), and diver-gence at 0620 and 0930 UTC (Fig. 10). At the lowestlevel, the occurrence of reflectivity over 30 dBZ wasidentical at 0620 and 0930 UTC (Figs. 10a and 10b).However, from 0.75 to 5 km MSL, both the mean profileand the 10% contour show that the reflectivity at 0620UTC had a much higher decrease rate with the increaseof height. At 5 km MSL, the mean profile of radarreflectivity dropped to slightly over 30 dBZ at 0620UTC, but reached near 40 dBZ at 0930 UTC. At upperlevels, the convection at 0930 UTC also had a signifi-cantly higher frequency of occurrence of intense echofeatures. The probability of occurrence of 30-dBZ echofell below 10% at about 9.5 km MSL at 0930 UTCcompared to 7 km MSL at 0620 UTC. DeMott andRutledge (1998) suggested that the rainfall productionis larger for radar echoes with higher maximum 30-dBZecho heights. Therefore, it was likely that the postfrontalconvection would produce higher rain rates. Overall, theconvective activity at 0930 was taller with more inten-sity than that at 0620 UTC. We have compared theresults from this study to the median vertical profiles ofradar reflectivity of convective cells in the Global At-mospheric Research Program (GARP) Atlantic TropicalExperiment (GATE) and with the top 10% of convectivecells from TAMEX (Zipser and Lutz 1994) and foundthat the variation of radar reflectivity with height at 0930UTC was very similar to the previous studies.
The system-relative u component was negative at thelowest levels at both 0620 and 0930 UTC (Figs. 10c).For the north–south-oriented and eastward moving pre-frontal convection, it indicated the front-to-rear low-level inflows. Not surprisingly, the system-relative ycomponent was at the opposite sign at the low levelsin the pre- and postfrontal regions (Figs. 10e and 10f).The southerly winds controlled the low levels at 0620UTC, and the northerly winds dominated the low levels
at 0930 UTC. At both times, the mean system-relativeu and y components were weak at midlevel (4–6 kmMSL), showing a system propagation speed close to themidlevel winds. The apparent differences between thesystem-relative flows were found at levels above 6 kmMSL, especially at high levels (;10 km MSL), for theprefrontal and postfrontal convection. At 0620 UTC,strong front-to-rear outflow was evident with the highprobability of occurrence of negative relative u com-ponent. The mean system-relative y component exhib-ited strong convective-driven southerly winds at the lev-els over 7 km MSL (refer to the prefrontal sounding inFig. 4). At 0930 UTC, the mean profile of the u com-ponent at the upper level oscillated around 0. Weak rear-to-front flows had the highest probability of the occur-rence, while a small portion of front-to-rear flows alsoexisted. A closer examination found that the strongerfront-to-rear outflow usually occurred over the top ofthe convective cores while the weaker rear-to-front out-flow dominated over the rest of the areas including thestratiform region (not shown). The net effect of the high-frequency weak front-to-rear outflows and the low-fre-quency strong rear-to-front outflows was to offset themagnitude of the mean profile.
Because of the uncertainty of vertical velocity at high-er elevations, only CFAD and mean profiles of the hor-izontal divergence field will be discussed. Comparingthe divergence CFADs, we found the modes of the dis-tributions were identical for the convection in the pre-and postfrontal region (Figs. 10g and 10h). When thelow-level convergence is very important to the devel-opment of convection, it was noticed that the low-leveldivergence field had a wider distribution at 0930 UTC.This indicated a higher relative frequency of occurrenceof intense convergence at low levels at that time. Themean divergence profiles showed that the layer of av-erage convergence was shallower (;4.5 km MSL) at0620 UTC and deeper (;9 km MSL) at 0930 UTC(Figs. 10i and 10j). The deeper layer of average con-vergence in the postfrontal region attributed to thestrong interaction between the northerly frontal airflowfrom the midlatitude and the southerly monsoon flowfrom the Tropics. The deeper and stronger low-levelaverage convergence may also contribute to a muchtaller convection in the postfrontal region.
6. Summary
In this study, the evolution and structure of mesoscaleconvection in the SCS region are documented for thefirst time. In particular, this paper focuses on the con-vection associated with the frontal passage at the earlystage of the summer SEAM onset. From the case of 15May 1998, it was found that the interaction between thetropical monsoon flow and the frontal circulation playedan important role in the evolution and structure of themesoscale convection. In the prefrontal region, themaintenance and intensification of the convection relied

1118 VOLUME 132M O N T H L Y W E A T H E R R E V I E W
on the low-level convergence of the different componentof the southwesterly winds including the southwesterlymonsoon flow and the prefrontal southwesterly flow.The north-to-south-oriented primary convective linewas perpendicular to the low-level wind shear, and theeast–west-oriented secondary convective lines were par-allel to the low-level shear. This was in agreement withthe conclusion made by LeMone et al. (1998) from theirstudies of western Pacific convection when the low-levelwind shear is over 4 m s21. In the postfrontal region,strong convection formed in an east-to-west zone wherethe southwesterly monsoon flow converged with thenortherly postfrontal flow. The strong low-level con-vergence generated by the two branches of airflow atthe opposite direction may help the postfrontal convec-tion to be more intense and taller than the prefrontalconvection.
The structure of the mesoscale convection observedon 15 May shared some similarities with archetypaltropical oceanic convection documented in other geo-graphical regions: 1) the low-level inflow from the warmand moist air ahead of the leading edge, 2) the maximumradar reflectivity at the lowest levels, 3) the strong re-flectivity gradient above the 08C isotherm implying arelative weak updraft, 4) generally an elevated (over 7.5km MSL) vertical velocity maximum. However, signif-icant departures were also evident: 1) a more verticalradar echo and updraft pattern with little tilt in the pre-frontal region with a moderate vertical wind shear, 2)very limited stratiform rain in an intense convection dueto a very dry mid to upper layer resulting in a quickevaporation and sublimation, 3) a leading stratiformmode instead of the more frequent trailing stratiformmode (Houze 1977; Protat and Lemaitre 2001), and 4)a maximum low-level convergence and updraft in therear portion of the prefrontal convection related to themore vertical convection. It is interesting to note thatthe kinematic structures resulting in the leading strati-form rain were different from prefrontal to postfrontalconvection. In the prefrontal region, the leading strati-form rain was caused by a rear-to-front midlevel outflowblowing hydrometers forward, and the dry environ-mental air in upper levels also prevented the formationof stratiform rain there. In the postfrontal region, incontrast to most tropical convection (Lewis et al. 1998),the low-level inflow did not go to the upper-rear partof convection but turned forward at the layer above 7.5km. Thus, the leading stratiform rain formed as a resultof forward advection of the hydrometers.
From a statistical viewpoint, similarities and differ-ences also existed between the pre- and postfrontal con-vection as well as compared to other tropical oceanicconvection. The distribution and mean profile of theradar reflectivity for these convective systems were verysimilar at the lowest levels with the maximum reflec-tivity recorded. However, in the prefrontal region, themean radar reflectivity had a higher decrease rate withheight in the layers below the freezing level. Above the
freezing level, a rapid decrease in reflectivity was found,as in other tropical monsoon convections (Williams etal. 1992; Zipser and Lutz 1994), suggesting a mild up-draft in the convection. The postfrontal convection hada significantly higher frequency of occurrence of intenseechoes at the upper level, implying that the postfrontalconvection would likely produce a higher rain rate.Compared to the results from GATE and TAMEX, themean radar reflectivity profile of the postfrontal con-vection was very similar to that documented in earlierstudies. Obvious differences in system-relative windsexisted at the upper levels for the pre- and postfrontalconvection. For the prefrontal convection, the convec-tive-driven outflows at the upper level were very strong.For the postfrontal convection, the system-relative flowsat the upper level consisted of relatively weak front-to-rear winds over the large stratiform region and relativelystrong rear-to-front winds over the small convective re-gion. Strong low-level convergence had a higher prob-ability of occurrence for the postfrontal convection. Thepostfrontal convection also had a deep 9-km conver-gence layer, compared to only a 4-km convergence layerfor the prefrontal convection. Apparently, the low-levelconvergence generated by the northerly frontal flowsand southerly monsoon flows in the postfrontal regimeis more pronounced than the convergence produced bytwo branches of southwesterly flows in the prefrontalregime.
Acknowledgments. The author would like to acknowl-edge those who participated in SCSMEX, especiallyDrs. Thomas Rickenbach (NASA GSFC), Robert Cifelli(Colorado State University), Paul Kucera (University ofIowa), Tom Keenan (BMRC, Australia), and John Ger-lach (NASA WSFC) for their involvement in the radarobservations and preliminary data processing. The au-thor is very grateful to Prof. Lawrence Carey (TexasA&M University) who provided the program to com-plete the quality control process of C-POL radar andDr. Robert Cifelli who helped the plots of CFAD figures.Appreciation is extended to Drs. Robert Adler, W.-K.Tao, K.-M. Lau, C.-L. Shie (NASA GSFC), Profs. Rich-ard Johnson and Steve Rutledge (Colorado State Uni-versity), Y.-L. Chen (University of Hawaii at Manoa),and Robert Houze (University of Washington) for manystimulating discussions about the nature and establish-ment of the Asian monsoon as well as the mesoscaleconvection associated with monsoon circulation.Thanks also go to Prof. Matthew Parker (University ofNebraska) for his discussions on the systems with lead-ing stratiform precipitation. The careful review by Prof.Carey and two anonymous reviewers also substantiallyimproved the presentation of the paper. This researchwas sponsored by National Aeronautics and Space Ad-ministration (NASA) under TRMM Grant NAG5-9699.
MAY 2004 1119W A N G
REFERENCES
Akiyama, T., 1979: Thermal stratification in baiu frontal medium-scale disturbances with heavy rainfalls. J. Meteor. Soc. Japan,57, 267–283.
——, 1984: A medium-scale cloud cluster in a baiu front. Part I:Evolution process and fine structure. J. Meteor. Soc. Japan, 62,485–504.
Anagnostou, E. N., C. A. Morales, and T. Dinku, 2001: The use ofTRMM Precipitation Radar observations in determining groundradar calibration biases. J. Atmos. Oceanic Technol., 18, 616–628.
Barnes, G. M., and K. Sieckman, 1984: The environment of fast- andslow-moving tropical mesoscale convective cloud lines. Mon.Wea. Rev., 112, 1782–1794.
Biggerstaff, M. I., and R. A. Houze Jr., 1991: Kinematic and pre-cipitation structure of the 10–11 June 1985 squall line. Mon.Wea. Rev., 119, 3035–3065.
Carey, L. D., S. A. Rutledge, D. A. Ahijevych, and T. D. Keenan,2000: Correcting propagation effects in C-band polarimetric ra-dar observation of tropical convection using differential prop-agation phase. J. Appl. Meteor., 39, 1405–1433.
Chang, C.-P., and T. N. Krishnamurti, 1987: Monsoon Meteorology,Oxford University Press, 353 pp.
Chen, Y.-L., and N. B.-F. Hui, 1992: Analysis of a relatively dry frontduring the Taiwan Area Mesoscale Experiment. Mon. Wea. Rev.,120, 2442–2468.
Cho, H.-R., and G. T. J. Chen, 1995: Mei-yu frontogenesis. J. Atmos.Sci., 52, 2109–2120.
Davies-Jones, R. P., 1979: Dual-Doppler radar coverage area as afunction of measurement accuracy and spatial resolution. J. Appl.Meteor., 18, 1229–1233.
DeMott, C. A., and S. A. Rutledge, 1998: The vertical structure ofTOGA COARE convection. Part I: Radar echo distributions. J.Atmos. Sci., 55, 2730–2747.
Ding, Y., 1994: Monsoons over China. Kluwer Academic, 419 pp.——, and Y. Liu, 2001: Onset and the evolution of the summer
monsoon over the South China Sea during SCSMEX field ex-periment in 1998. J. Meteor. Soc. Japan, 79, 255–276.
Drosdowsky, W., G. J. Holland, and R. K. Smith, 1989: Structureand evolution of north Australian cloud lines observed duringAMEX phase I. Mon. Wea. Rev., 117, 1181–1192.
Fein, J. S., and J. P. Kuettner, 1980: Report on the summer MONEXfield phase. Bull. Amer. Meteor. Soc., 61, 461–474.
Fu, C.-B., J. Fletcher, and R. Slutz, 1983: The structure of the Asianmonsoon surface wind field over the ocean. J. Climate Appl.Meteor., 22, 1242–1252.
Fukao, S., M. D. Yamanaka, T. Sato, T. Tsuda, and S. Kato, 1988:Three-dimensional air motions over the baiu front observed bya VHF-band Doppler radar: A case study. Mon. Wea. Rev., 116,281–292.
Grossman, R. L., and D. R. Durran, 1984: Interaction of low-levelflow with the western Ghat Mountains and offshore convectionin the summer monsoon. Mon. Wea. Rev., 112, 652–672.
He, H., J. W. McGinnis, Z. S. Song, and M. Yanai, 1987: Onset ofthe Asian summer monsoon in 1979 and the effect of the TibetanPlateau. Mon. Wea. Rev., 115, 1966–1995.
Holland, G. J., J. L. McBride, R. K. Smith, D. Jasper, and T. D.Keenan, 1986: The BMRC Australian Monsoon Experiment:AMEX. Bull. Amer. Meteor. Soc., 67, 1466–1472.
Houze, R. A., Jr., 1977: Structure and dynamics of a tropical squall-line system. Mon. Wea. Rev., 105, 1540–1567.
——, and C.-P. Cheng, 1977: Radar characteristics of tropical con-vection observed during GATE: Mean properties and trends overthe summer monsoon. Mon. Wea. Rev., 105, 964–980.
Johnson, R. H., and P. E. Ciesielski, 2002: Characteristics of the 1998summer monsoon onset over the northern South China Sea. J.Meteor. Soc. Japan, 80, 561–578.
——, and T. Keenan, 2001: Organization of oceanic convection dur-ing the onset of the 1998 east Asia summer monsoon. Preprints,
30th Int. Conf. on Radar Meteorology, Munich, Germany, Amer.Meteor. Soc., 679–681.
Jorgensen, D. P., and M. A. LeMone, 1989: Vertical velocity char-acteristics of oceanic convection. J. Atmos. Sci., 46, 621–640.
——, ——, and S. B. Trier, 1997: Structure and evolution of the 22February 1993 TOGA COARE squall line: Aircraft observationsof precipitation, circulation, and surface energy fluxes. J. Atmos.Sci., 54, 1961–1985.
Kawatani, Y., and M. Takahashi, 2003: Simulation of the baiu frontin a high resolution AGCM. J. Meteor. Soc. Japan, 81, 113–126.
Krishnamurti, T. N., 1985: Summer monsoon experiment—A review.Mon. Wea. Rev., 113, 1590–1626.
Kummerow, C., and Coauthors, 2000: The status of the TropicalRainfall Measuring Mission (TRMM) after two years in orbit.J. Appl. Meteor., 39, 1965–1982.
Lau, K.-M., G. J. Yang, and S. H. Shen, 1988: Seasonal and intra-seasonal climatology of summer monsoon rainfall over east Asia.Mon. Wea. Rev., 116, 18–37.
——, and Coauthors, 2000: Report of the field operations and earlyresults of the South China Sea Monsoon Experiment (SCSMEX).Bull. Amer. Meteor. Soc., 81, 1261–1270.
——, X. Li, and H.-T. Wu, 2002: Evolution of the large scale cir-culation, cloud structure and regional water cycle associated withthe South China Sea monsoon during May–June, 1998. J. Me-teor. Soc. Japan, 80, 1129–1147.
Leise, J. A., 1981: A multidimensional scale-telescoped filter anddata extension package. NOAA Tech. Memo. ERL WPL-82, 18pp.
LeMone, M. A., and E. J. Zipser, 1980: Cumulonimbus vertical ve-locity events in GATE. Part I: Diameter, intensity and mass flux.Mon. Wea. Rev., 108, 2444–2457.
——, G. M. Barnes, E. J. Szoke, and E. J. Zipser, 1984: The tilt ofthe leading edge of mesoscale tropical convective lines. Mon.Wea. Rev., 112, 510–519.
——, E. J. Zipser, and S. B. Trier, 1998: The role of environmentalshear and thermodynamic conditions in determining the structureand evolution of mesoscale convective systems during TOGACOARE. J. Atmos. Sci., 55, 3493–3518.
Lewis, S. A., M. A. LeMone, and D. P. Jorgensen, 1998: Evolutionand dynamics of a late-stage squall line that occurred on 20February 1993 during TOGA COARE. Mon. Wea. Rev., 126,3189–3212.
Li, J., Y.-L. Chen, and W.-C. Lee, 1997: Analysis of a heavy rainfallevent during TAMEX. Mon. Wea. Rev., 125, 1060–1082.
Mohr, C. G., L. J. Miller, R. L. Vaughan, and H. W. Frank, 1986:The merger of mesoscale datasets into a common Cartesian for-mat for efficient and systematic analyses. J. Atmos. OceanicTechnol., 3, 143–161.
Moncrieff, M. W., 1992: Organized convective systems: Archetypaldynamical models, mass and momentum flux theory, and pa-rameterization. Quart. J. Roy. Meteor. Soc., 118, 819–850.
Murakami, T., and Y. H. Ding, 1982: Wind and temperature changesover Eurasia during the early summer of 1979. J. Meteor. Soc.Japan, 60, 183–196.
Nagata, M., and Y. Ogura, 1991: A modeling case study of interactionbetween heavy precipitation and a low-level jet over Japan inthe baiu season. Mon. Wea. Rev., 119, 1309–1336.
Ninomiya, N., 1984: Characteristics of baiu front as a predominantsubtropical front in the summer Northern Hemisphere. J. Meteor.Soc. Japan, 62, 880–894.
——, and T. Akiyama, 1971: The development of the medium-scaledisturbance in the baiu front. J. Meteor. Soc. Japan, 49, 663–677.
——, and T. Murakami, 1987: The early summer rainy season (baiu)over Japan. Monsoon Meteorology, C.-P. Chang, and T. N. Krish-namurti, Eds., Oxford University Press, 93–121.
Oye, R., and R. E. Carbone, 1981: Interactive Doppler editing soft-ware. Preprints, 20th Conf. on Radar Meteorology, Boston, MA,Amer. Meteor. Soc., 683–689.

1120 VOLUME 132M O N T H L Y W E A T H E R R E V I E W
Parker, M. D., 2002: Dynamics of convective lines with leading pre-cipitation. Preprints, 21st Conf. on Severe Local Storms, SanAntonio, TX, Amer. Meteor. Soc., 5–8.
——, and R. H. Johnson, 2000: Organizational modes of midlatitudemesoscale convective systems. Mon. Wea. Rev., 128, 3413–3436.
——, and ——, 2001: Simple numerical simulation of convectivelines with leading stratiform precipitation. Preprints, Ninth Conf.on Mesoscale Processes, Fort Lauderdale, FL, Amer. Meteor.Soc., 283–287.
Protat, A., and Y. Lemaitre, 2001: Scale interaction involved in theinitiation, structure, and evolution of the 15 December 1992MCS observed during TOGA COARE. Part II: Mesoscale andconvective-scale processes. Mon. Wea. Rev., 129, 1779–1808.
Rickenbach, T. M., and S. A. Rutledge, 1998: Convection in TOGACOARE: Horizontal scale, morphology, and rainfall production.J. Atmos. Sci., 55, 2715–2729.
Rotunno, R., and J. B. Klemp, 1982: The influence of the shearinduced pressure gradient on thunderstorm motion. Mon. Wea.Rev., 110, 136–151.
——, ——, and M. L. Weisman, 1988: A theory for strong, long-lived squall lines. J. Atmos. Sci., 45, 463–485.
Rutledge, S. A., E. R. Williams, and T. D. Keenan, 1992: The DownUnder Doppler and Electricity Experiment (DUNDEE): Over-view and preliminary results. Bull. Amer. Meteor. Soc., 73, 3–16.
Ryzhkov, A. V., and D. S. Zrnic, 1998: Polarimetric rainfall estimationin the presence of anomalous propagation. J. Atmos. OceanicTechnol., 15, 1320–1330.
Smith, R. B., and Y. Lin, 1984: Orographic rain on the western Ghats.Proceedings of the First Sino-American Workshop on MountainMeteorology, E. R. Reiter, B. Zhu, and Y. Qian, Eds., SciencePress and Amer. Meteor. Soc., 71–94.
Tao, S., and L. Chen, 1987: A review of recent research on the eastAsian summer monsoon in China. Monsoon Meteorology, C.-P.Chang, and T. N. Krishnamurti, Eds., Oxford University Press,60–92.
Trier, S. B., W. C. Skamarock, M. A. LeMone, D. B. Parsons, andD. P. Jorgensen, 1996: Structure and evolution of the 22 February1993 TOGA COARE squall line: Numerical simulations. J. At-mos. Sci., 53, 2861–2886.
Tu, Z.-W., and S.-S. Huang, 1944: The advance and retreat of thesummer monsoon. Meteor. Mag., 18, 1–20.
Wakimoto, R. M., 1982: The life cycle of thunderstorm gust frontsas viewed with Doppler radar and rawinsonde data. Mon. Wea.Rev., 110, 1060–1082.
——, C. Liu, and H. Cai, 1998: The Garden City, Kansas, stormduring VORTEX 95. Part I: Overview of the storm’s life cycleand mesocyclogenesis. Mon. Wea. Rev., 126, 372–392.
Wang, J.-J., 2001: The development and structure of an oceanic squallline systems during the South China Sea Summer Monsoon Ex-periment. Preprints, 30th Int. Conf. on Radar Meteorology, Mu-nich, Germany, Amer. Meteor. Soc., 400–402.
Weisman, M. L., 1992: The role of convectively generated rear-inflowjets in the evolution of long-lived mesoconvective systems. J.Atmos. Sci., 49, 1826–1847.
Williams, E. R., S. A. Rutledge, S. G. Geotis, N. Renno, E. Ras-mussen, and T. Rickenbach, 1992: A radar and electrical studyof tropical ‘‘hot towers.’’ J. Atmos. Sci., 49, 1386–1395.
Yuter, S. E., and R. A. Houze, Jr., 1995: Three-dimensional kinematicand microphysical evolution of Florida cumulonimbus. Part II:Frequency distributions of vertical velocity, reflectivity, and dif-ferential reflectivity. Mon. Wea. Rev., 123, 1941–1963.
Zhu, K., 1934: Monsoon in southeast Asia and rainfall amount inChina. Acta Geogr. Sin., 1, 1–27.
Zipser, E. J., 1977: Mesoscale and convective-scale downdrafts asdistinct components of squall-line structure. Mon. Wea. Rev.,105, 1568–1589.
——, and M. A. LeMone, 1980: Cumulonimbus vertical velocityevents in GATE. Part II: Synthesis and model core structure. J.Atmos. Sci., 37, 2458–2469.
——, and K. Lutz, 1994: The vertical profile of radar reflectivity ofconvective cells: A strong indicator of storm intensity and light-ning probability? Mon. Wea. Rev., 122, 1751–1759.