Embed Size (px)
Citation preview
EVOLUTION
Ancient convergent losses ofParaoxonase 1 yield potential risksfor modern marine mammalsWynn K. Meyer1, Jerrica Jamison2, Rebecca Richter3, Stacy E. Woods4*,Raghavendran Partha1, Amanda Kowalczyk1, Charles Kronk2, Maria Chikina1,Robert K. Bonde5, Daniel E. Crocker6, Joseph Gaspard7, Janet M. Lanyon8,Judit Marsillach3, Clement E. Furlong3,9, Nathan L. Clark1,10†
Mammals diversified by colonizing drastically different environments, with each transitionyielding numerous molecular changes, including losses of protein function. Though notinitially deleterious, these losses could subsequently carry deleterious pleiotropicconsequences. We have used phylogenetic methods to identify convergent functionallosses across independent marine mammal lineages. In one extreme case,Paraoxonase 1 (PON1) accrued lesions in all marine lineages, while remaining intactin all terrestrial mammals. These lesions coincide with PON1 enzymatic activity loss inmarine species’ blood plasma. This convergent loss is likely explained by parallelshifts in marine ancestors’ lipid metabolism and/or bloodstream oxidative environmentaffecting PON1’s role in fatty acid oxidation. PON1 loss also eliminates marine mammals’main defense against neurotoxicity from specific man-made organophosphoruscompounds, implying potential risks in modern environments.
As the ancestors of aquatic marine mam-mals adopted obligate aquatic lifestyles,they evolved many adaptive changes, suchas those that improved locomotion andrespiration in and perception of their new
environment (1–3). Many of these morphologicaland physiological changes occurred in parallel indistinct lineages of marine mammals, includingcetaceans, pinnipeds, and sirenians. Althoughconvergent trait changes are frequently adaptive,environmental transitions can also result in non-adaptive convergent trait loss due to release fromfunctional constraint. Examples of convergentlyreduced or lost traits include olfaction in marinemammals (4–6), bitter taste receptors in car-nivorous tetrapods (7), and eyes in subterraneanspecies (8–10). Any convergent evolutionary
change in the context of a given environmentcan carry negative consequences in a differentenvironment as a result of pleiotropy (one ge-netic locus influencing multiple phenotypes).To characterize how mammals responded to
selective pressures imposed by the marine envi-ronment, we identified genes that convergentlylost function in marine mammals. We identifiedcandidate pseudogenes with observed early stopcodons and/or frameshifts (genetic lesions) in58 eutherian mammals’ genomes in a 100-wayvertebrate alignment (11). Using our predictedpseudogene calls, we then tested, for each gene,whether its pattern of functional loss was betterexplained by a model with one loss rate through-out the mammalian phylogeny or by amodel inwhich the loss rate was dependent upon the ter-
restrial or marine state of a given branch in alikelihood ratio test (LRT) (12). To ensure that ourresults were not strongly influenced by errors inpseudogene calling, we performedmanual checksof lesion calls against reference genomes forour top genes, along with comparisons of pseudo-gene calls at highly conserved genes for marineand terrestrial species (13).We used simulationsto estimate empirical gene-specific P values andstudy-wide (multiple-test-corrected) false dis-covery rates (FDR) for all genes (13) (Table 1 andtable S1). The set of genes with the strongestevidence for a higher loss rate onmarine lineageswas strongly enriched for functions related tochemosensation, driven by many olfactory andtaste receptors (tables S2 to S5). These resultsare consistentwith previous behavioral, anatom-ical, and genetic studies indicating a reduction ofsmell and taste in marine mammals (5, 14, 15).We also observed a notable pattern of con-
vergent loss in the marine environment atParaoxonase 1 (PON1) (Table 1) (13). PON1 en-codes a bloodstream enzyme that reduces oxida-tive damage to lipids in low- and high-densitylipoprotein (LDL and HDL) particles, poten-tially preventing atherosclerotic plaque forma-tion (16, 17) (Fig. 1A). PON1 also hydrolyzes theoxon forms of specific organophosphate com-pounds, such that it is the main line of defenseagainst some man-made pesticide by-products,
RESEARCH
Meyer et al., Science 361, 591–594 (2018) 10 August 2018 1 of 4
Table 1. Top 10 manually validated genes with evidence for marine-specific loss. Loss rates represent the inferred instantaneous rates of transition from
functional gene (1) to pseudogene (0) per unit branch length under the relevant model in BayesTraits (12, 13), restricted to a maximum value of 100 (the default).
Gene
Loss rate
(independent)
Marine
loss rate
(dependent)
Terrestrial
loss rate
(dependent)
LRT
statistic
Empirical
P value FDR Description of gene product
PON1 0.672 49.7 0 22.24 3.08 × 10⁻⁶ 0.0154 Paraoxonase 1.. .. ... ... .. ... .. ... ... .. ... ... .. ... .. ... ... .. ... ... .. ... ... .. ... .. ... ... .. ... ... .. ... .. ... ... .. ... ... .. ... ... .. ... .. ... ... .. ... ... .. ... .. ... ... .. ... ... .. ... ... .. ... .. ... ... .. ... ... .. ... .. ... ... .. ... ... .. ... ... .. ... .. ... ... .. ... ... .. ... .. ... ... .. ... ... .. ... ... .. ... .. ... ... .. ... ... .. ... .. ... ... .. ... ... .. ... ... .. ... .. ... ... .. ... ... .
OR10Z1 1.15 100 0.467 19.99 7.25 × 10⁻⁶ 0.0201 Olfactory receptor.. .. ... ... .. ... .. ... ... .. ... ... .. ... .. ... ... .. ... ... .. ... ... .. ... .. ... ... .. ... ... .. ... .. ... ... .. ... ... .. ... ... .. ... .. ... ... .. ... ... .. ... .. ... ... .. ... ... .. ... ... .. ... .. ... ... .. ... ... .. ... .. ... ... .. ... ... .. ... ... .. ... .. ... ... .. ... ... .. ... .. ... ... .. ... ... .. ... ... .. ... .. ... ... .. ... ... .. ... .. ... ... .. ... ... .. ... ... .. ... .. ... ... .. ... ... .
OR8D4 1.25 100 0.510 19.21 1.60 × 10⁻⁵ 0.0201 Olfactory receptor.. .. ... ... .. ... .. ... ... .. ... ... .. ... .. ... ... .. ... ... .. ... ... .. ... .. ... ... .. ... ... .. ... .. ... ... .. ... ... .. ... ... .. ... .. ... ... .. ... ... .. ... .. ... ... .. ... ... .. ... ... .. ... .. ... ... .. ... ... .. ... .. ... ... .. ... ... .. ... ... .. ... .. ... ... .. ... ... .. ... .. ... ... .. ... ... .. ... ... .. ... .. ... ... .. ... ... .. ... .. ... ... .. ... ... .. ... ... .. ... .. ... ... .. ... ... .
TAS2R1 1.32 100 0.535 19.20 1.60 × 10⁻⁵ 0.0201 Taste receptor.. .. ... ... .. ... .. ... ... .. ... ... .. ... .. ... ... .. ... ... .. ... ... .. ... .. ... ... .. ... ... .. ... .. ... ... .. ... ... .. ... ... .. ... .. ... ... .. ... ... .. ... .. ... ... .. ... ... .. ... ... .. ... .. ... ... .. ... ... .. ... .. ... ... .. ... ... .. ... ... .. ... .. ... ... .. ... ... .. ... .. ... ... .. ... ... .. ... ... .. ... .. ... ... .. ... ... .. ... .. ... ... .. ... ... .. ... ... .. ... .. ... ... .. ... ... .
OR1F2P 2.03 100 1.18 15.86 5.40 × 10⁻⁵ 0.0831 Olfactory receptor.. .. ... ... .. ... .. ... ... .. ... ... .. ... .. ... ... .. ... ... .. ... ... .. ... .. ... ... .. ... ... .. ... .. ... ... .. ... ... .. ... ... .. ... .. ... ... .. ... ... .. ... .. ... ... .. ... ... .. ... ... .. ... .. ... ... .. ... ... .. ... .. ... ... .. ... ... .. ... ... .. ... .. ... ... .. ... ... .. ... .. ... ... .. ... ... .. ... ... .. ... .. ... ... .. ... ... .. ... .. ... ... .. ... ... .. ... ... .. ... .. ... ... .. ... ... .
GSTM1 1.48 100 0.762 15.82 3.90 × 10⁻⁵ 0.0831 Glutathione S-transferase mu 1.. .. ... ... .. ... .. ... ... .. ... ... .. ... .. ... ... .. ... ... .. ... ... .. ... .. ... ... .. ... ... .. ... .. ... ... .. ... ... .. ... ... .. ... .. ... ... .. ... ... .. ... .. ... ... .. ... ... .. ... ... .. ... .. ... ... .. ... ... .. ... .. ... ... .. ... ... .. ... ... .. ... .. ... ... .. ... ... .. ... .. ... ... .. ... ... .. ... ... .. ... .. ... ... .. ... ... .. ... .. ... ... .. ... ... .. ... ... .. ... .. ... ... .. ... ... .
OR6K2 2.02 100 1.22 15.79 4.50 × 10⁻⁵ 0.0831 Olfactory receptor.. .. ... ... .. ... .. ... ... .. ... ... .. ... .. ... ... .. ... ... .. ... ... .. ... .. ... ... .. ... ... .. ... .. ... ... .. ... ... .. ... ... .. ... .. ... ... .. ... ... .. ... .. ... ... .. ... ... .. ... ... .. ... .. ... ... .. ... ... .. ... .. ... ... .. ... ... .. ... ... .. ... .. ... ... .. ... ... .. ... .. ... ... .. ... ... .. ... ... .. ... .. ... ... .. ... ... .. ... .. ... ... .. ... ... .. ... ... .. ... .. ... ... .. ... ... .
OR51D1 1.13 49.3 0.466 15.59 8.60 × 10⁻⁵ 0.0831 Olfactory receptor.. .. ... ... .. ... .. ... ... .. ... ... .. ... .. ... ... .. ... ... .. ... ... .. ... .. ... ... .. ... ... .. ... .. ... ... .. ... ... .. ... ... .. ... .. ... ... .. ... ... .. ... .. ... ... .. ... ... .. ... ... .. ... .. ... ... .. ... ... .. ... .. ... ... .. ... ... .. ... ... .. ... .. ... ... .. ... ... .. ... .. ... ... .. ... ... .. ... ... .. ... .. ... ... .. ... ... .. ... .. ... ... .. ... ... .. ... ... .. ... .. ... ... .. ... ... .
TAAR5 1.17 48.2 0.484 15.16 9.90 × 10⁻⁵ 0.0936 Trace amine–associated receptor 5.. .. ... ... .. ... .. ... ... .. ... ... .. ... .. ... ... .. ... ... .. ... ... .. ... .. ... ... .. ... ... .. ... .. ... ... .. ... ... .. ... ... .. ... .. ... ... .. ... ... .. ... .. ... ... .. ... ... .. ... ... .. ... .. ... ... .. ... ... .. ... .. ... ... .. ... ... .. ... ... .. ... .. ... ... .. ... ... .. ... .. ... ... .. ... ... .. ... ... .. ... .. ... ... .. ... ... .. ... .. ... ... .. ... ... .. ... ... .. ... .. ... ... .. ... ... .
OR4C13 1.77 100 0.915 14.88 7.00 × 10⁻⁵ 0.0972 Olfactory receptor.. .. ... ... .. ... .. ... ... .. ... ... .. ... .. ... ... .. ... ... .. ... ... .. ... .. ... ... .. ... ... .. ... .. ... ... .. ... ... .. ... ... .. ... .. ... ... .. ... ... .. ... .. ... ... .. ... ... .. ... ... .. ... .. ... ... .. ... ... .. ... .. ... ... .. ... ... .. ... ... .. ... .. ... ... .. ... ... .. ... .. ... ... .. ... ... .. ... ... .. ... .. ... ... .. ... ... .. ... .. ... ... .. ... ... .. ... ... .. ... .. ... ... .. ... ... .
1Department of Computational and Systems Biology, Universityof Pittsburgh, Pittsburgh, PA, USA. 2Dietrich School of Artsand Sciences, University of Pittsburgh, Pittsburgh, PA, USA.3Division of Medical Genetics, Department of Medicine,University of Washington, Seattle, WA, USA. 4Bloomberg Schoolof Public Health, Johns Hopkins University, Baltimore, MD, USA.5Wetland and Aquatic Research Center, U.S. Geological Survey,Gainesville, FL, USA. 6Department of Biology, Sonoma StateUniversity, Rohnert Park, CA, USA. 7Pittsburgh Zoo and PPGAquarium, Pittsburgh, PA, USA. 8School of Biological Sciences,The University of Queensland, St. Lucia, QLD 4072, Australia.9Department of Genome Sciences, University of Washington,Seattle, WA, USA. 10Pittsburgh Center for Evolutionary Biologyand Medicine, University of Pittsburgh, Pittsburgh, PA, USA.*Present address: Natural Resources Defense Council, Washington,DC, USA.†Corresponding author. Email: [email protected]
on August 13, 2018
http://science.sciencem
ag.org/D
ownloaded from
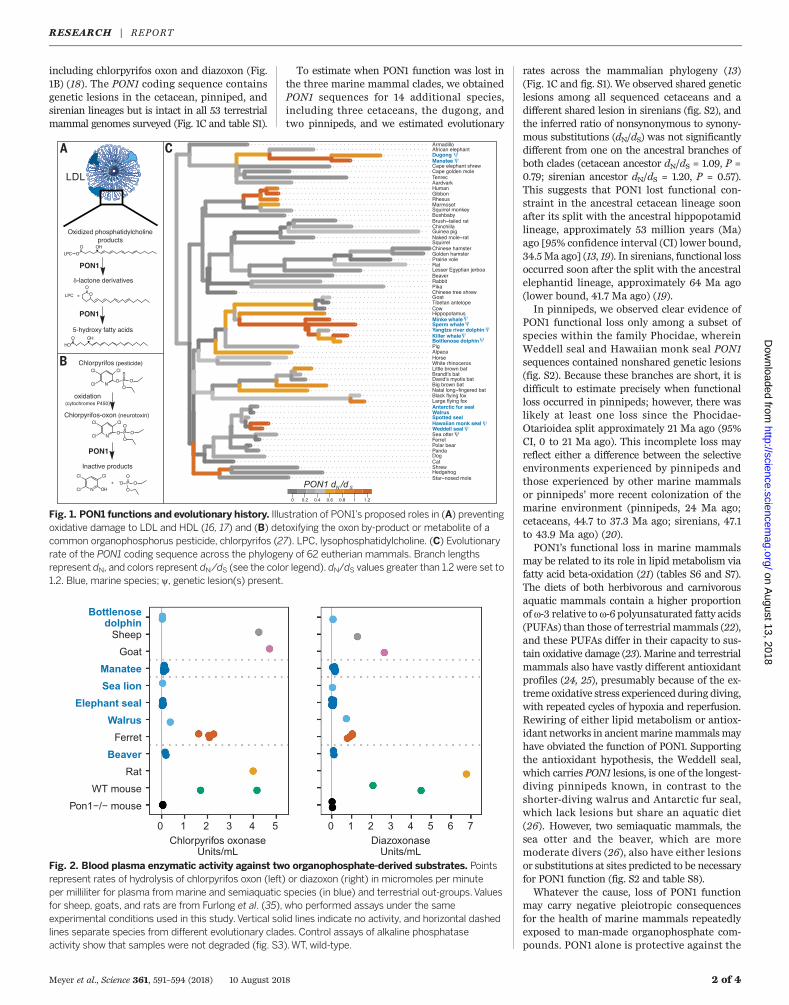
including chlorpyrifos oxon and diazoxon (Fig.1B) (18). The PON1 coding sequence containsgenetic lesions in the cetacean, pinniped, andsirenian lineages but is intact in all 53 terrestrialmammal genomes surveyed (Fig. 1C and table S1).
To estimate when PON1 function was lost inthe three marine mammal clades, we obtainedPON1 sequences for 14 additional species,including three cetaceans, the dugong, andtwo pinnipeds, and we estimated evolutionary
rates across the mammalian phylogeny (13)(Fig. 1C and fig. S1). We observed shared geneticlesions among all sequenced cetaceans and adifferent shared lesion in sirenians (fig. S2), andthe inferred ratio of nonsynonymous to synony-mous substitutions (dN/dS) was not significantlydifferent from one on the ancestral branches ofboth clades (cetacean ancestor dN/dS = 1.09, P =0.79; sirenian ancestor dN/dS = 1.20, P = 0.57).This suggests that PON1 lost functional con-straint in the ancestral cetacean lineage soonafter its split with the ancestral hippopotamidlineage, approximately 53 million years (Ma)ago [95% confidence interval (CI) lower bound,34.5Ma ago] (13, 19). In sirenians, functional lossoccurred soon after the split with the ancestralelephantid lineage, approximately 64 Ma ago(lower bound, 41.7 Ma ago) (19).In pinnipeds, we observed clear evidence of
PON1 functional loss only among a subset ofspecies within the family Phocidae, whereinWeddell seal and Hawaiian monk seal PON1sequences contained nonshared genetic lesions(fig. S2). Because these branches are short, it isdifficult to estimate precisely when functionalloss occurred in pinnipeds; however, there waslikely at least one loss since the Phocidae-Otarioidea split approximately 21 Ma ago (95%CI, 0 to 21 Ma ago). This incomplete loss mayreflect either a difference between the selectiveenvironments experienced by pinnipeds andthose experienced by other marine mammalsor pinnipeds’ more recent colonization of themarine environment (pinnipeds, 24 Ma ago;cetaceans, 44.7 to 37.3 Ma ago; sirenians, 47.1to 43.9 Ma ago) (20).PON1’s functional loss in marine mammals
may be related to its role in lipid metabolism viafatty acid beta-oxidation (21) (tables S6 and S7).The diets of both herbivorous and carnivorousaquatic mammals contain a higher proportionofw-3 relative tow-6 polyunsaturated fatty acids(PUFAs) than those of terrestrial mammals (22),and these PUFAs differ in their capacity to sus-tain oxidative damage (23). Marine and terrestrialmammals also have vastly different antioxidantprofiles (24, 25), presumably because of the ex-treme oxidative stress experienced during diving,with repeated cycles of hypoxia and reperfusion.Rewiring of either lipid metabolism or antiox-idant networks in ancientmarinemammalsmayhave obviated the function of PON1. Supportingthe antioxidant hypothesis, the Weddell seal,which carries PON1 lesions, is one of the longest-diving pinnipeds known, in contrast to theshorter-diving walrus and Antarctic fur seal,which lack lesions but share an aquatic diet(26). However, two semiaquatic mammals, thesea otter and the beaver, which are moremoderate divers (26), also have either lesionsor substitutions at sites predicted to be necessaryfor PON1 function (fig. S2 and table S8).Whatever the cause, loss of PON1 function
may carry negative pleiotropic consequencesfor the health of marine mammals repeatedlyexposed to man-made organophosphate com-pounds. PON1 alone is protective against the
Meyer et al., Science 361, 591–594 (2018) 10 August 2018 2 of 4
Fig. 1. PON1 functions and evolutionary history. Illustration of PON1’s proposed roles in (A) preventingoxidative damage to LDL and HDL (16, 17) and (B) detoxifying the oxon by-product or metabolite of acommon organophosphorus pesticide, chlorpyrifos (27). LPC, lysophosphatidylcholine. (C) Evolutionaryrate of the PON1 coding sequence across the phylogeny of 62 eutherian mammals. Branch lengthsrepresent dN, and colors represent dN/dS (see the color legend). dN/dS values greater than 1.2 were set to1.2. Blue, marine species; y, genetic lesion(s) present.
Fig. 2. Blood plasma enzymatic activity against two organophosphate-derived substrates. Pointsrepresent rates of hydrolysis of chlorpyrifos oxon (left) or diazoxon (right) in micromoles per minuteper milliliter for plasma from marine and semiaquatic species (in blue) and terrestrial out-groups.Valuesfor sheep, goats, and rats are from Furlong et al. (35), who performed assays under the sameexperimental conditions used in this study.Vertical solid lines indicate no activity, and horizontal dashedlines separate species from different evolutionary clades. Control assays of alkaline phosphataseactivity show that samples were not degraded (fig. S3).WT, wild-type.
RESEARCH | REPORTon A
ugust 13, 2018
http://science.sciencemag.org/
Dow
nloaded from
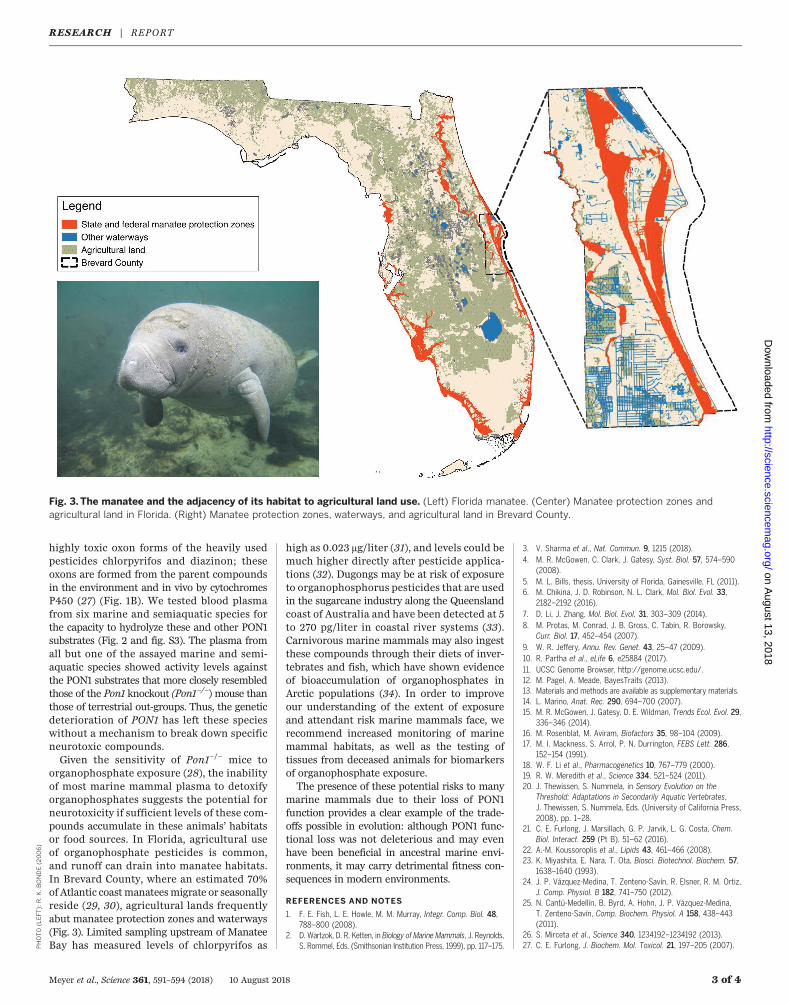
highly toxic oxon forms of the heavily usedpesticides chlorpyrifos and diazinon; theseoxons are formed from the parent compoundsin the environment and in vivo by cytochromesP450 (27) (Fig. 1B). We tested blood plasmafrom six marine and semiaquatic species forthe capacity to hydrolyze these and other PON1substrates (Fig. 2 and fig. S3). The plasma fromall but one of the assayed marine and semi-aquatic species showed activity levels againstthe PON1 substrates that more closely resembledthose of the Pon1 knockout (Pon1−/−) mouse thanthose of terrestrial out-groups. Thus, the geneticdeterioration of PON1 has left these specieswithout a mechanism to break down specificneurotoxic compounds.Given the sensitivity of Pon1−/− mice to
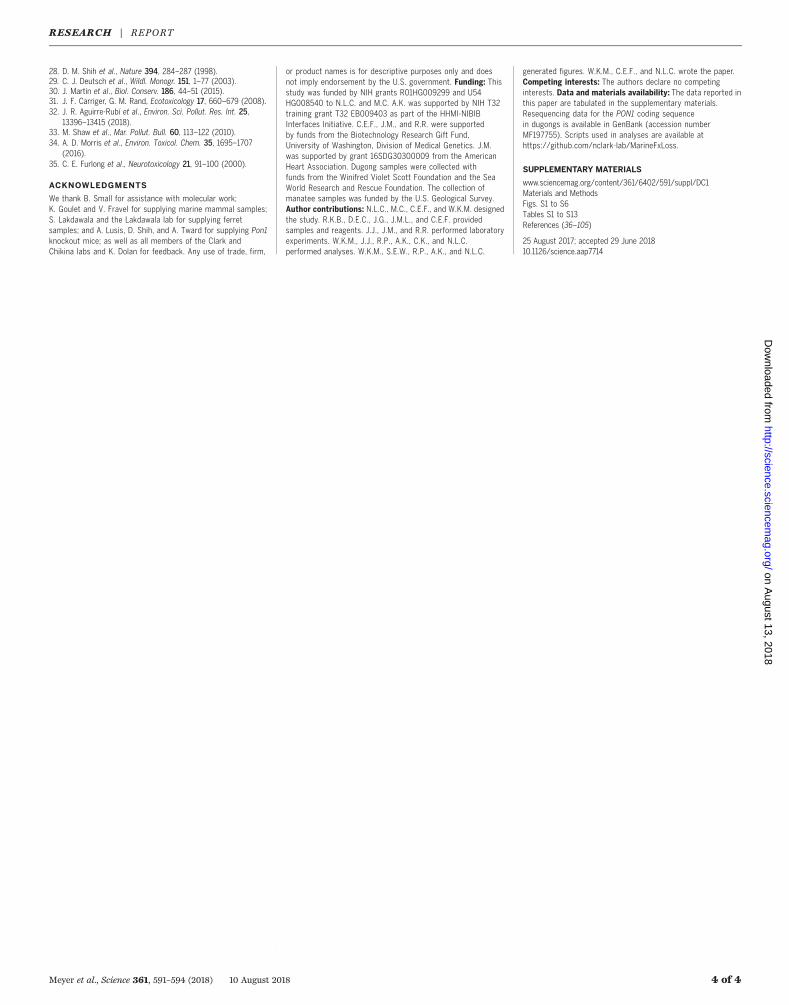
organophosphate exposure (28), the inabilityof most marine mammal plasma to detoxifyorganophosphates suggests the potential forneurotoxicity if sufficient levels of these com-pounds accumulate in these animals’ habitatsor food sources. In Florida, agricultural useof organophosphate pesticides is common,and runoff can drain into manatee habitats.In Brevard County, where an estimated 70%of Atlantic coast manateesmigrate or seasonallyreside (29, 30), agricultural lands frequentlyabut manatee protection zones and waterways(Fig. 3). Limited sampling upstream of ManateeBay has measured levels of chlorpyrifos as
high as 0.023 mg/liter (31), and levels could bemuch higher directly after pesticide applica-tions (32). Dugongs may be at risk of exposureto organophosphorus pesticides that are usedin the sugarcane industry along the Queenslandcoast of Australia and have been detected at 5to 270 pg/liter in coastal river systems (33).Carnivorous marine mammals may also ingestthese compounds through their diets of inver-tebrates and fish, which have shown evidenceof bioaccumulation of organophosphates inArctic populations (34). In order to improveour understanding of the extent of exposureand attendant risk marine mammals face, werecommend increased monitoring of marinemammal habitats, as well as the testing oftissues from deceased animals for biomarkersof organophosphate exposure.The presence of these potential risks to many
marine mammals due to their loss of PON1function provides a clear example of the trade-offs possible in evolution: although PON1 func-tional loss was not deleterious and may evenhave been beneficial in ancestral marine envi-ronments, it may carry detrimental fitness con-sequences in modern environments.
REFERENCES AND NOTES
1. F. E. Fish, L. E. Howle, M. M. Murray, Integr. Comp. Biol. 48,788–800 (2008).
2. D. Wartzok, D. R. Ketten, in Biology of Marine Mammals, J. Reynolds,S. Rommel, Eds. (Smithsonian Institution Press, 1999), pp. 117–175.
3. V. Sharma et al., Nat. Commun. 9, 1215 (2018).4. M. R. McGowen, C. Clark, J. Gatesy, Syst. Biol. 57, 574–590
(2008).5. M. L. Bills, thesis, University of Florida, Gainesville, FL (2011).6. M. Chikina, J. D. Robinson, N. L. Clark, Mol. Biol. Evol. 33,
2182–2192 (2016).7. D. Li, J. Zhang, Mol. Biol. Evol. 31, 303–309 (2014).8. M. Protas, M. Conrad, J. B. Gross, C. Tabin, R. Borowsky,
Curr. Biol. 17, 452–454 (2007).9. W. R. Jeffery, Annu. Rev. Genet. 43, 25–47 (2009).10. R. Partha et al., eLife 6, e25884 (2017).11. UCSC Genome Browser, http://genome.ucsc.edu/.12. M. Pagel, A. Meade, BayesTraits (2013).13. Materials and methods are available as supplementary materials.14. L. Marino, Anat. Rec. 290, 694–700 (2007).15. M. R. McGowen, J. Gatesy, D. E. Wildman, Trends Ecol. Evol. 29,
336–346 (2014).16. M. Rosenblat, M. Aviram, Biofactors 35, 98–104 (2009).17. M. I. Mackness, S. Arrol, P. N. Durrington, FEBS Lett. 286,
152–154 (1991).18. W. F. Li et al., Pharmacogenetics 10, 767–779 (2000).19. R. W. Meredith et al., Science 334, 521–524 (2011).20. J. Thewissen, S. Nummela, in Sensory Evolution on the
Threshold: Adaptations in Secondarily Aquatic Vertebrates,J. Thewissen, S. Nummela, Eds. (University of California Press,2008), pp. 1–28.
21. C. E. Furlong, J. Marsillach, G. P. Jarvik, L. G. Costa, Chem.Biol. Interact. 259 (Pt B), 51–62 (2016).
22. A.-M. Koussoroplis et al., Lipids 43, 461–466 (2008).23. K. Miyashita, E. Nara, T. Ota, Biosci. Biotechnol. Biochem. 57,
1638–1640 (1993).24. J. P. Vázquez-Medina, T. Zenteno-Savín, R. Elsner, R. M. Ortiz,
J. Comp. Physiol. B 182, 741–750 (2012).25. N. Cantú-Medellín, B. Byrd, A. Hohn, J. P. Vázquez-Medina,
T. Zenteno-Savín, Comp. Biochem. Physiol. A 158, 438–443(2011).
26. S. Mirceta et al., Science 340, 1234192–1234192 (2013).27. C. E. Furlong, J. Biochem. Mol. Toxicol. 21, 197–205 (2007).
Meyer et al., Science 361, 591–594 (2018) 10 August 2018 3 of 4
Fig. 3. The manatee and the adjacency of its habitat to agricultural land use. (Left) Florida manatee. (Center) Manatee protection zones andagricultural land in Florida. (Right) Manatee protection zones, waterways, and agricultural land in Brevard County.
RESEARCH | REPORTPHOTO
(LEFT
):R.K.BONDE(2
006)
on August 13, 2018
http://science.sciencem
ag.org/D
ownloaded from
28. D. M. Shih et al., Nature 394, 284–287 (1998).29. C. J. Deutsch et al., Wildl. Monogr. 151, 1–77 (2003).30. J. Martin et al., Biol. Conserv. 186, 44–51 (2015).31. J. F. Carriger, G. M. Rand, Ecotoxicology 17, 660–679 (2008).32. J. R. Aguirre-Rubí et al., Environ. Sci. Pollut. Res. Int. 25,
13396–13415 (2018).33. M. Shaw et al., Mar. Pollut. Bull. 60, 113–122 (2010).34. A. D. Morris et al., Environ. Toxicol. Chem. 35, 1695–1707
(2016).35. C. E. Furlong et al., Neurotoxicology 21, 91–100 (2000).
ACKNOWLEDGMENTS
We thank B. Small for assistance with molecular work;K. Goulet and V. Fravel for supplying marine mammal samples;S. Lakdawala and the Lakdawala lab for supplying ferretsamples; and A. Lusis, D. Shih, and A. Tward for supplying Pon1knockout mice; as well as all members of the Clark andChikina labs and K. Dolan for feedback. Any use of trade, firm,
or product names is for descriptive purposes only and doesnot imply endorsement by the U.S. government. Funding: Thisstudy was funded by NIH grants R01HG009299 and U54HG008540 to N.L.C. and M.C. A.K. was supported by NIH T32training grant T32 EB009403 as part of the HHMI-NIBIBInterfaces Initiative. C.E.F., J.M., and R.R. were supportedby funds from the Biotechnology Research Gift Fund,University of Washington, Division of Medical Genetics. J.M.was supported by grant 16SDG30300009 from the AmericanHeart Association. Dugong samples were collected withfunds from the Winifred Violet Scott Foundation and the SeaWorld Research and Rescue Foundation. The collection ofmanatee samples was funded by the U.S. Geological Survey.Author contributions: N.L.C., M.C., C.E.F., and W.K.M. designedthe study. R.K.B., D.E.C., J.G., J.M.L., and C.E.F. providedsamples and reagents. J.J., J.M., and R.R. performed laboratoryexperiments. W.K.M., J.J., R.P., A.K., C.K., and N.L.C.performed analyses. W.K.M., S.E.W., R.P., A.K., and N.L.C.
generated figures. W.K.M., C.E.F., and N.L.C. wrote the paper.Competing interests: The authors declare no competinginterests. Data and materials availability: The data reported inthis paper are tabulated in the supplementary materials.Resequencing data for the PON1 coding sequencein dugongs is available in GenBank (accession numberMF197755). Scripts used in analyses are available athttps://github.com/nclark-lab/MarineFxLoss.
SUPPLEMENTARY MATERIALS
www.sciencemag.org/content/361/6402/591/suppl/DC1Materials and MethodsFigs. S1 to S6Tables S1 to S13References (36–105)
25 August 2017; accepted 29 June 201810.1126/science.aap7714
Meyer et al., Science 361, 591–594 (2018) 10 August 2018 4 of 4
RESEARCH | REPORTon A
ugust 13, 2018
http://science.sciencemag.org/
Dow
nloaded from
mammals yield potential risks for modern marineParaoxonase 1Ancient convergent losses of
Furlong and Nathan L. ClarkKronk, Maria Chikina, Robert K. Bonde, Daniel E. Crocker, Joseph Gaspard, Janet M. Lanyon, Judit Marsillach, Clement E. Wynn K. Meyer, Jerrica Jamison, Rebecca Richter, Stacy E. Woods, Raghavendran Partha, Amanda Kowalczyk, Charles
DOI: 10.1126/science.aap7714 (6402), 591-594.361Science
, this issue p. 591Sciencerun-off of this agricultural product into the marine environment continues.defense against organophosphorus toxicity. Marine mammals may be at a great disadvantage in the Anthropocene if
is the primary mammalianParaoxonase 1of this loss of function across taxa indicate an evolutionary benefit. However, marine mammals, likely resulting from remodeling of lipid metabolism or antioxidant networks. The multiple occurrences
gene are evident inParaoxonase 1mammal species to identify regions of convergent change. Multiple losses of the surveyed the genomes of several marineet al.the particular selective pressures that this environment imposes. Meyer
Mammals evolved in terrestrial environments. Those that now live in the marine environment have had to adapt toAdaptive conflicts with the modern world
ARTICLE TOOLS http://science.sciencemag.org/content/361/6402/591
MATERIALSSUPPLEMENTARY http://science.sciencemag.org/content/suppl/2018/08/08/361.6402.591.DC1
REFERENCES
http://science.sciencemag.org/content/361/6402/591#BIBLThis article cites 88 articles, 9 of which you can access for free
PERMISSIONS http://www.sciencemag.org/help/reprints-and-permissions
Terms of ServiceUse of this article is subject to the
is a registered trademark of AAAS.Sciencelicensee American Association for the Advancement of Science. No claim to original U.S. Government Works. The title Science, 1200 New York Avenue NW, Washington, DC 20005. 2017 © The Authors, some rights reserved; exclusive
(print ISSN 0036-8075; online ISSN 1095-9203) is published by the American Association for the Advancement ofScience
on August 13, 2018
http://science.sciencem
ag.org/D
ownloaded from

![1 IntroductiontoEmergingAreasinBioengineering › books › sample › 3527340882_c01.pdf · markets [6]. Biotechnology markets can be divided into three sectors: biologics ($91 billion(B)),industrial(greaterthan$105B),andGMcrops($128B)[Figure1.3]](https://img.pdfslide.us/doc/110x75/5f0479dc7e708231d40e2863/1-introductiontoemergingareasinbioengineering-a-books-a-sample-a-3527340882c01pdf.jpg)


![Paraoxonase: The boon against oxidative stress and lipid...may play a role in its pathogenesis, low PON1 activity could be an independent risk factor [2]. Paraoxonase activity is in-versely](https://img.pdfslide.us/doc/110x75/5f8d3577e0ed9638c7379069/paraoxonase-the-boon-against-oxidative-stress-and-lipid-may-play-a-role-in.jpg)


![Distribution of Paraoxonase-1 (PON-1) and Lipoprotein ...downloads.hindawi.com/journals/omcl/2018/1752940.pdf · Lp-PLA2 and PON1 [19–22]. A limited number of studies addressed](https://img.pdfslide.us/doc/110x75/5d3f2f8c88c9937e518cc10e/distribution-of-paraoxonase-1-pon-1-and-lipoprotein-lp-pla2-and-pon1-1922.jpg)