Embed Size (px)
Citation preview
Prepared by Susanna Gotsch
EVOLUTI2021 CRASH COURSEMidyear Report
TABLE OFCONTENTS
EXECUTIVE SUMMARY
INDUSTRY EVOLUTION ACCELERATED
DRIVERS’ PERSPECTIVE OF ADAS
THE ROAD AHEAD
03
04
14
93
EXECUTIVE SUMMARYAs the pace of innovation and market-changing dynamics accelerate, our need for insights strengthens.
Early CY 2021 began a lot like the end of CY 2020, when many states were still under shelter-at-home directives, so traffic and congestion levels remained down. By March however, there were signs of emergence. Falling U.S. COVID-19 case counts, strong vaccination rates, pickups in airline traffic and in-person restaurant use, and schools meeting in-person pointed to a second half of the year that more closely resembled the period pre-COVID-19, with an important exception: sustained changes in the desires and expectations of consumers. These shifts in expectations have embedded technologies like AI, mobile and digitization more firmly into our daily experiences.
Another technology getting a lot of attention is ADAS. In previous issues of Crash Course, CCC has provided data and insights on the safety and cost implications of these features. And while extremely important there is more to consider. CCC recently commissioned a study that explores drivers’ familiarity, expectations, and behaviors surrounding these technology-driven features. The results of that research can be found in a special section of this report.
Also in this update, we'll look at leading indicators that may tell us about how our industry will emerge from the COVID-19 pandemic.
5© 2021 CCC Intelligent Solutions Inc. All Rights Reserved.
CRASH
COURSE 2021 | EVOLUTION
TECHNOLOGIES NEWLY ADOPTED DURING THE PANDEMIC CHANGED CONSUMER EXPECTATIONS PERMANENTLY
Companies like Netflix, Spotify, Disney, DoorDash, and more experienced strong growth during the pandemic, as consumers looked for ways to entertain themselves at home. Streaming entertainment became the new norm. Even the Academy of Motion Picture Arts and Sciences lifted the requirement during the pandemic that a film have at least a week in the theaters to be considered for an Oscar (and has yet to indicate whether the requirement will return next year).¹ As a result, Netflix won seven Oscars from five films, Amazon Prime Video picked up two Oscars, and films from Disney+, HBO Max, Apple TV+ and Hulu earned nominations.²
Companies like Spotify that reported its monthly active users grew 24 percent to 356 million in Q1 2021 face some uncertainty ahead as consumption habits change as we emerge from the pandemic.³ Introduction of a new device supporting voice-activated access to Spotify's playlists and a podcast called "Car Thing", anticipates more in-car listening,⁴ and illustrates how the company built on its growth during the pandemic, but is also adapting and innovating as we emerge. DoorDash is another company that built on its growth during the pandemic but is also adapting to anticipated change post-COVID. Its early strategy to focus on the suburbs has paid off, as consumers migrated from big urban areas to suburban areas during the pandemic.⁵ An early focus on customer loyalty has also led to strong adoption of its food-delivery subscription program DashPass, which is expected to keep customers coming back even as food delivery slows post-pandemic.⁶
E-commerce sales surged nearly 30 percent during the pandemic. McKinsey estimated growth between CY 2019-2020 was 3.3 times more than between CY 2015-2019.⁷ The U.S. Commerce Department reported e-commerce sales in the U.S. were up 39 percent in Q1 2021 versus Q1 2020, down from the 44 percent increase in Q1 2020, but still significantly higher than the 15 percent growth rate pre-COVID.⁸ As vaccinations rise and new COVID-19 cases fall, people will likely return to in-person shopping. Yet an AlixPartners LLP survey of 1000 consumers conducted late Mar'21 and early Apr'21 showed one-third of U.S. shoppers plan to continue buying clothing online, while 25 percent intend to keep ordering groceries that way.⁹ Brick-and-mortar retailers that expanded their online presence during the pandemic may see more sales shift in-store, but the creation of an additional channel where customers can discover their business and purchase from them will continue to be of value.
Within the automotive retail environment, consumers have come to expect some level of digitization of the vehicle purchase process due to changes during the pandemic. According to Cox Automotive ‘s "Digitization of End-to-End Retail" from January 2021, 69 percent of franchise dealers added at least one digital step due to COVID-19, and 74 percent say their customers have used digital retailing tools more since COVID-19.¹0 Over the last year, the percent of buyers highly
EVOLUTIINDUSTRY
ACCELERATED
Customer trust and reliance on technology has grown exponentially over the last year and continues to create expectations that technology will be universally available. Consumers now expect companies to provide curated, self-directed experiences, enabled by technology and AI that anticipate individual desires and needs.
7© 2021 CCC Intelligent Solutions Inc. All Rights Reserved.
CRASH
COURSE 2021 | EVOLUTION
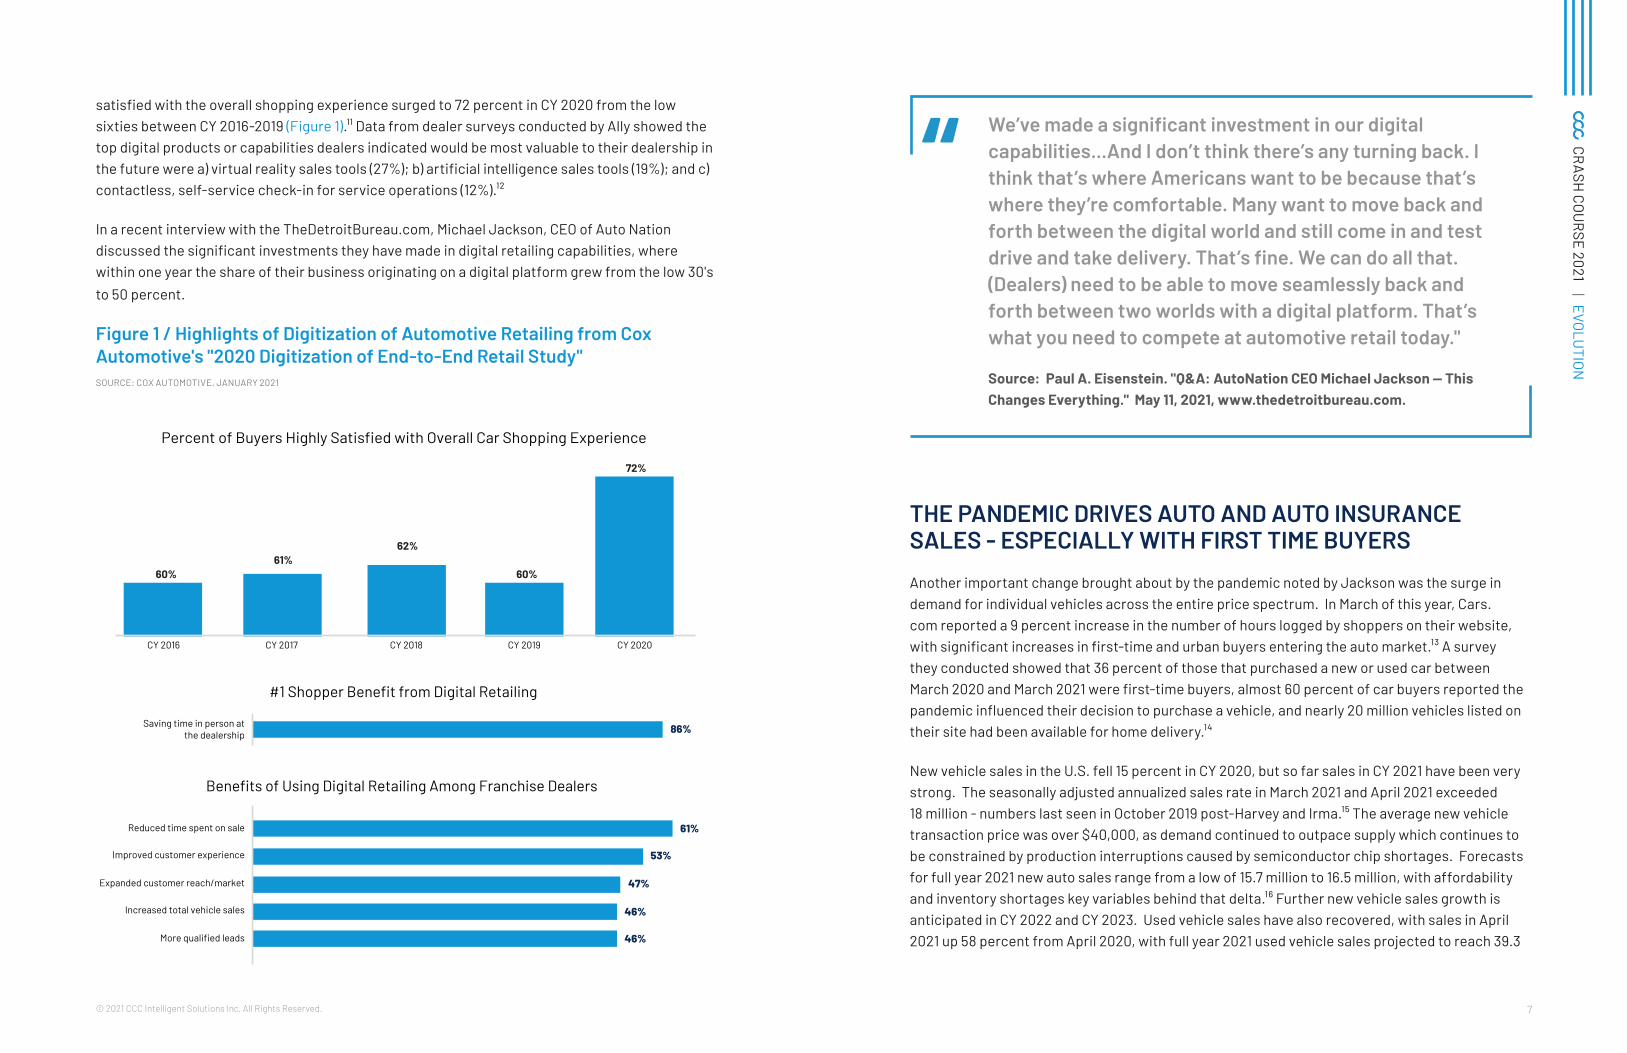
satisfied with the overall shopping experience surged to 72 percent in CY 2020 from the low sixties between CY 2016-2019 (Figure 1).¹¹ Data from dealer surveys conducted by Ally showed the top digital products or capabilities dealers indicated would be most valuable to their dealership in the future were a) virtual reality sales tools (27%); b) artificial intelligence sales tools (19%); and c) contactless, self-service check-in for service operations (12%).¹²
In a recent interview with the TheDetroitBureau.com, Michael Jackson, CEO of Auto Nation discussed the significant investments they have made in digital retailing capabilities, where within one year the share of their business originating on a digital platform grew from the low 30's to 50 percent.
Figure 1 / Highlights of Digitization of Automotive Retailing from Cox Automotive's "2020 Digitization of End-to-End Retail Study"SOURCE: COX AUTOMOTIVE, JANUARY 2021
60%61%
62%
60%
72%
CY 2016 CY 2017 CY 2018 CY 2019 CY 2020
86%Saving time in person atthe dealership
#1 Shopper Benefit from Digital Retailing
46%
46%
47%
53%
61%
More qualified leads
Increased total vehicle sales
Expanded customer reach/market
Improved customer experience
Reduced time spent on sale
Benefits of Using Digital Retailing Among Franchise Dealers
Percent of Buyers Highly Satisfied with Overall Car Shopping Experience
We’ve made a significant investment in our digital capabilities...And I don’t think there’s any turning back. I think that’s where Americans want to be because that’s where they’re comfortable. Many want to move back and forth between the digital world and still come in and test drive and take delivery. That’s fine. We can do all that. (Dealers) need to be able to move seamlessly back and forth between two worlds with a digital platform. That’s what you need to compete at automotive retail today."
Source: Paul A. Eisenstein. "Q&A: AutoNation CEO Michael Jackson — This Changes Everything." May 11, 2021, www.thedetroitbureau.com.
THE PANDEMIC DRIVES AUTO AND AUTO INSURANCE SALES - ESPECIALLY WITH FIRST TIME BUYERS
Another important change brought about by the pandemic noted by Jackson was the surge in demand for individual vehicles across the entire price spectrum. In March of this year, Cars.com reported a 9 percent increase in the number of hours logged by shoppers on their website, with significant increases in first-time and urban buyers entering the auto market.¹³ A survey they conducted showed that 36 percent of those that purchased a new or used car between March 2020 and March 2021 were first-time buyers, almost 60 percent of car buyers reported the pandemic influenced their decision to purchase a vehicle, and nearly 20 million vehicles listed on their site had been available for home delivery.¹⁴
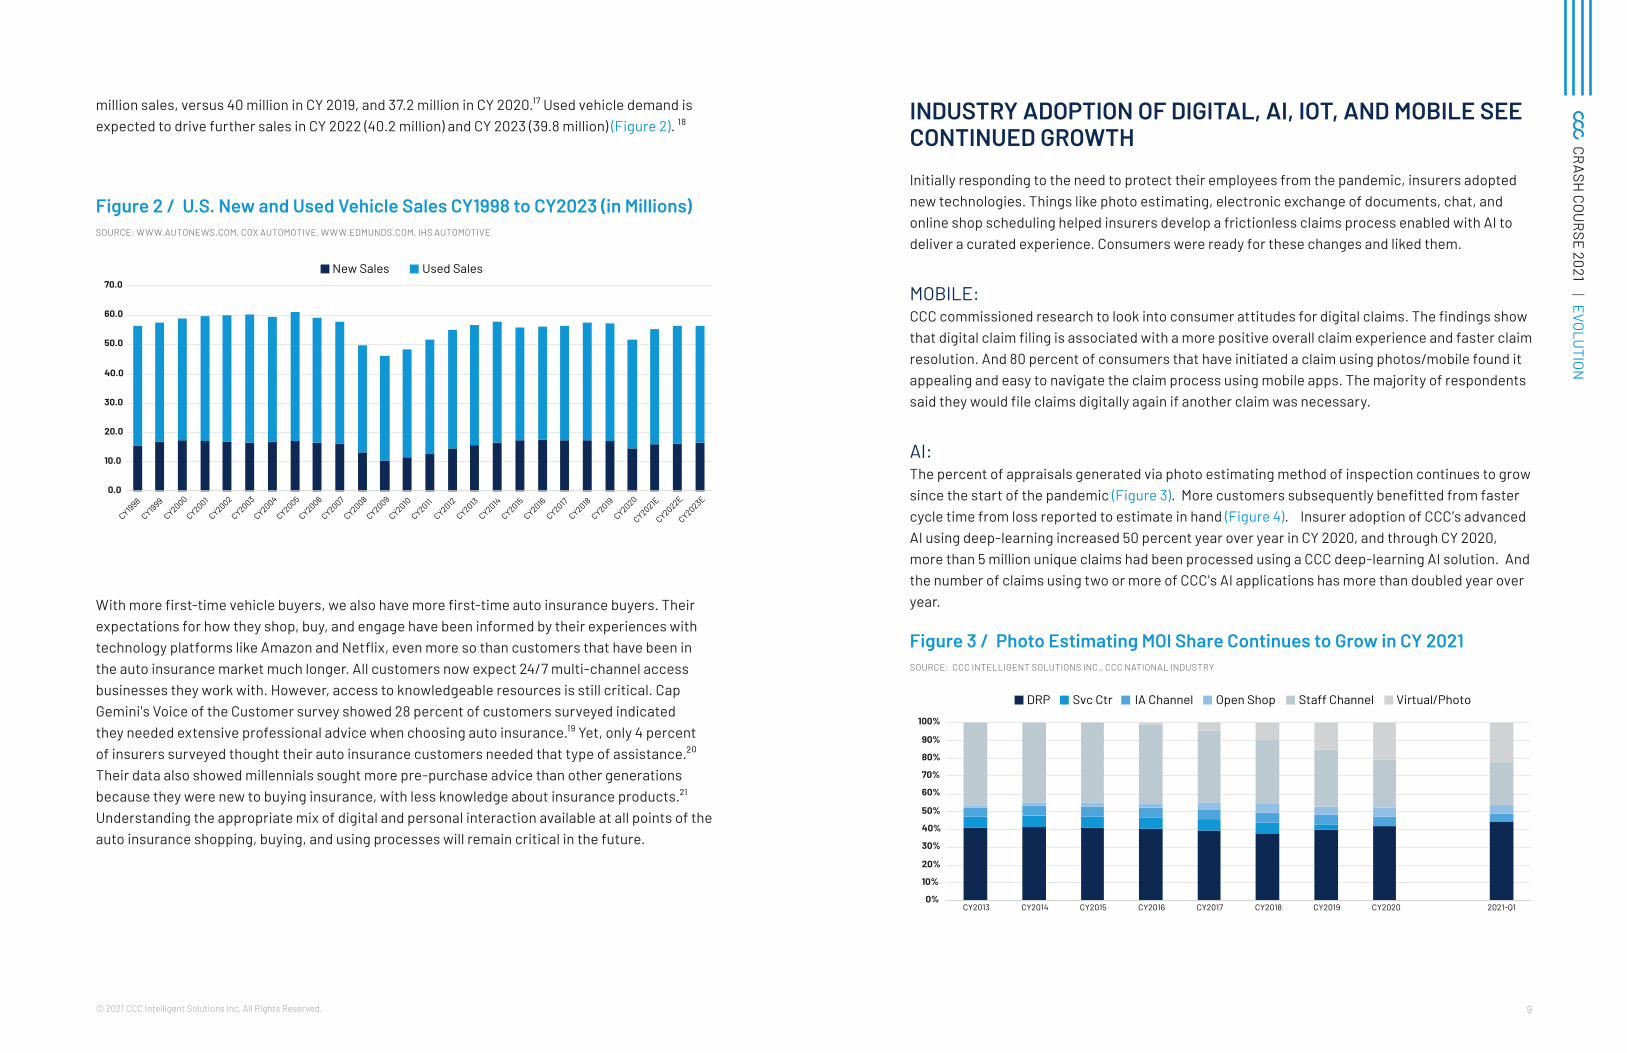
New vehicle sales in the U.S. fell 15 percent in CY 2020, but so far sales in CY 2021 have been very strong. The seasonally adjusted annualized sales rate in March 2021 and April 2021 exceeded 18 million - numbers last seen in October 2019 post-Harvey and Irma.¹⁵ The average new vehicle transaction price was over $40,000, as demand continued to outpace supply which continues to be constrained by production interruptions caused by semiconductor chip shortages. Forecasts for full year 2021 new auto sales range from a low of 15.7 million to 16.5 million, with affordability and inventory shortages key variables behind that delta.¹⁶ Further new vehicle sales growth is anticipated in CY 2022 and CY 2023. Used vehicle sales have also recovered, with sales in April 2021 up 58 percent from April 2020, with full year 2021 used vehicle sales projected to reach 39.3
“
9© 2021 CCC Intelligent Solutions Inc. All Rights Reserved.
CRASH
COURSE 2021 | EVOLUTION
million sales, versus 40 million in CY 2019, and 37.2 million in CY 2020.¹⁷ Used vehicle demand is expected to drive further sales in CY 2022 (40.2 million) and CY 2023 (39.8 million) (Figure 2). ¹⁸
Figure 2 / U.S. New and Used Vehicle Sales CY1998 to CY2023 (in Millions) SOURCE: WWW.AUTONEWS.COM, COX AUTOMOTIVE, WWW.EDMUNDS.COM, IHS AUTOMOTIVE
0.0
10.0
20.0
30.0
40.0
50.0
60.0
70.0
CY1998
CY1999
CY2000
CY2001
CY2002
CY2003
CY2004
CY2005
CY2006
CY2007
CY2008
CY2009
CY2010
CY2011
CY2012
CY2013
CY2014
CY2015
CY2016
CY2017
CY2018
CY2019
CY2020
CY2021E
CY2022E
CY2023E
New Sales Used Sales
With more first-time vehicle buyers, we also have more first-time auto insurance buyers. Their expectations for how they shop, buy, and engage have been informed by their experiences with technology platforms like Amazon and Netflix, even more so than customers that have been in the auto insurance market much longer. All customers now expect 24/7 multi-channel access businesses they work with. However, access to knowledgeable resources is still critical. Cap Gemini's Voice of the Customer survey showed 28 percent of customers surveyed indicated they needed extensive professional advice when choosing auto insurance.¹⁹ Yet, only 4 percent of insurers surveyed thought their auto insurance customers needed that type of assistance.²0 Their data also showed millennials sought more pre-purchase advice than other generations because they were new to buying insurance, with less knowledge about insurance products.²¹ Understanding the appropriate mix of digital and personal interaction available at all points of the auto insurance shopping, buying, and using processes will remain critical in the future.
INDUSTRY ADOPTION OF DIGITAL, AI, IOT, AND MOBILE SEE CONTINUED GROWTH
Initially responding to the need to protect their employees from the pandemic, insurers adopted new technologies. Things like photo estimating, electronic exchange of documents, chat, and online shop scheduling helped insurers develop a frictionless claims process enabled with AI to deliver a curated experience. Consumers were ready for these changes and liked them.
MOBILE: CCC commissioned research to look into consumer attitudes for digital claims. The findings show that digital claim filing is associated with a more positive overall claim experience and faster claim resolution. And 80 percent of consumers that have initiated a claim using photos/mobile found it appealing and easy to navigate the claim process using mobile apps. The majority of respondents said they would file claims digitally again if another claim was necessary.
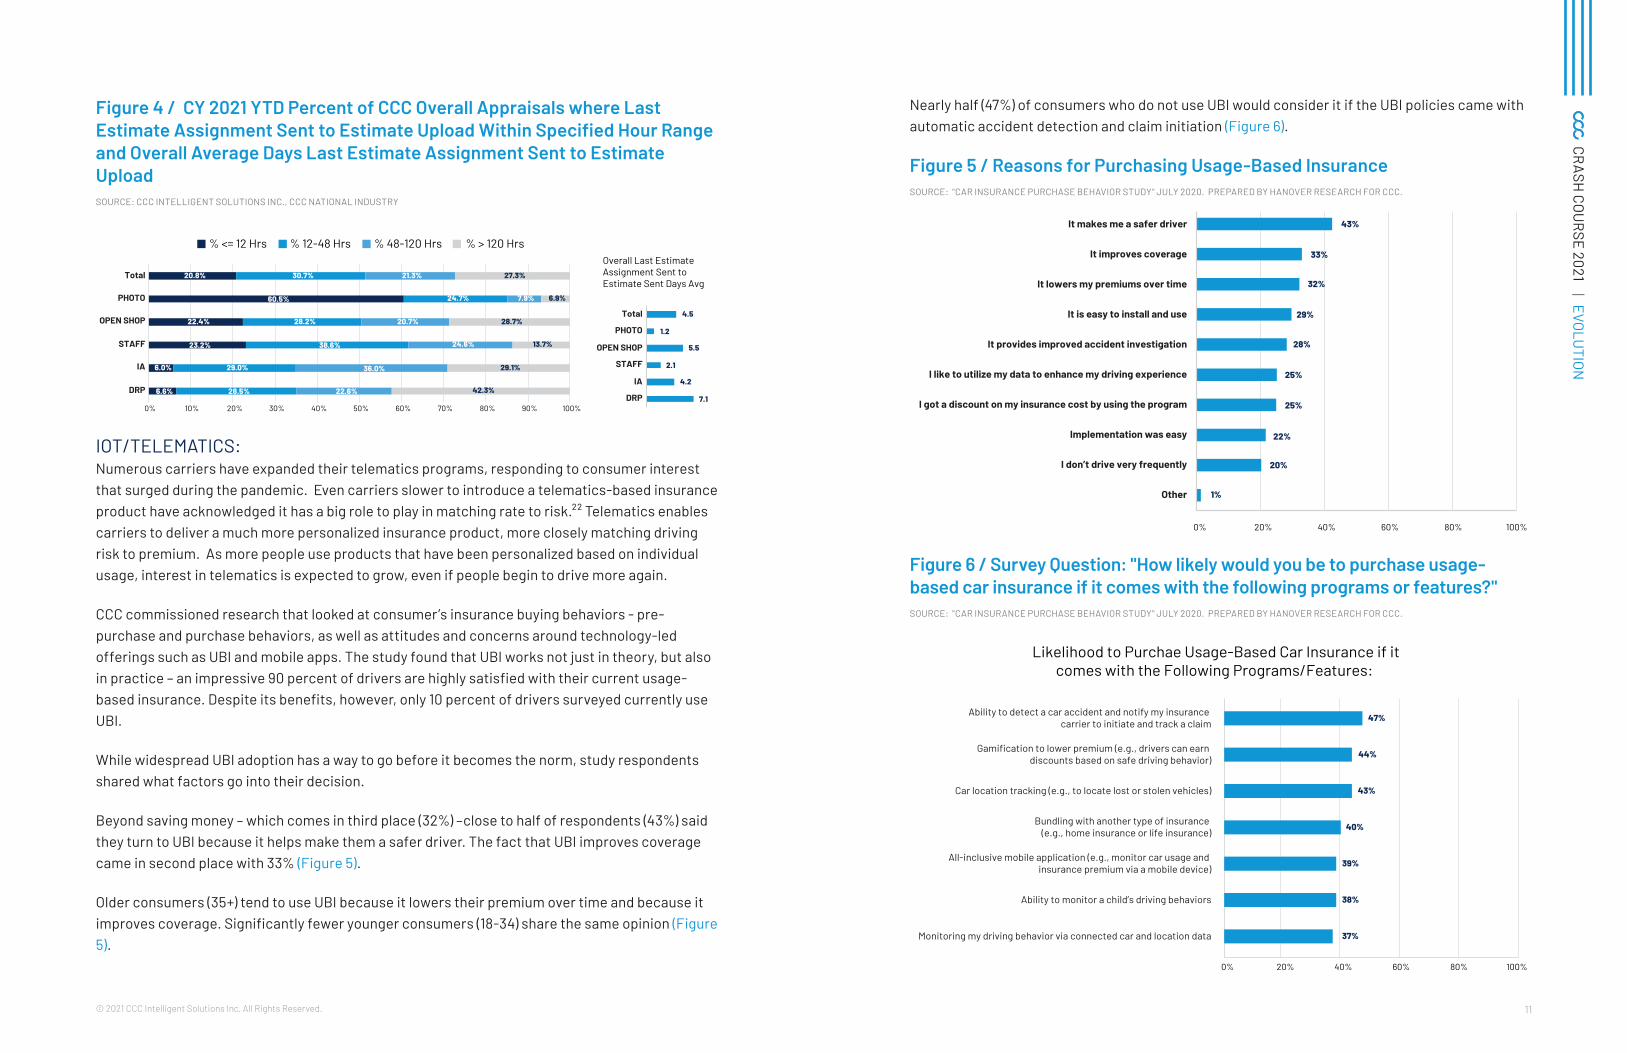
AI: The percent of appraisals generated via photo estimating method of inspection continues to grow since the start of the pandemic (Figure 3). More customers subsequently benefitted from faster cycle time from loss reported to estimate in hand (Figure 4). Insurer adoption of CCC’s advanced AI using deep-learning increased 50 percent year over year in CY 2020, and through CY 2020, more than 5 million unique claims had been processed using a CCC deep-learning AI solution. And the number of claims using two or more of CCC's AI applications has more than doubled year over year.
Figure 3 / Photo Estimating MOI Share Continues to Grow in CY 2021SOURCE: CCC INTELLIGENT SOLUTIONS INC., CCC NATIONAL INDUSTRY
0%
10%
20%
30%
40%
50%
60%
70%
80%
90%
100%
CY2013 CY2014 CY2015 CY2016 CY2017 CY2018 CY2019 CY2020 2021-Q1
DRP Svc Ctr IA Channel Open Shop Staff Channel Virtual/Photo
11© 2021 CCC Intelligent Solutions Inc. All Rights Reserved.
CRASH
COURSE 2021 | EVOLUTION
Nearly half (47%) of consumers who do not use UBI would consider it if the UBI policies came with automatic accident detection and claim initiation (Figure 6).
Figure 5 / Reasons for Purchasing Usage-Based InsuranceSOURCE: "CAR INSURANCE PURCHASE BEHAVIOR STUDY" JULY 2020. PREPARED BY HANOVER RESEARCH FOR CCC.
Figure 6 / Survey Question: "How likely would you be to purchase usage-based car insurance if it comes with the following programs or features?"SOURCE: "CAR INSURANCE PURCHASE BEHAVIOR STUDY" JULY 2020. PREPARED BY HANOVER RESEARCH FOR CCC.
Ability to detect a car accident and notify my insurance carrier to initiate and track a claim
Gamification to lower premium (e.g., drivers can earn discounts based on safe driving behavior)
Car location tracking (e.g., to locate lost or stolen vehicles)
Bundling with another type of insurance (e.g., home insurance or life insurance)
All-inclusive mobile application (e.g., monitor car usage and insurance premium via a mobile device)
Ability to monitor a child’s driving behaviors
Monitoring my driving behavior via connected car and location data
47%
44%
43%
40%
39%
38%
37%
0% 20% 40% 60% 80% 100%
Likelihood to Purchae Usage-Based Car Insurance if itcomes with the Following Programs/Features:
Figure 4 / CY 2021 YTD Percent of CCC Overall Appraisals where Last Estimate Assignment Sent to Estimate Upload Within Specified Hour Range and Overall Average Days Last Estimate Assignment Sent to Estimate UploadSOURCE: CCC INTELLIGENT SOLUTIONS INC., CCC NATIONAL INDUSTRY
6.6%
6.0%
23.2%
22.4%
60.5%
20.8%
28.5%
29.0%
38.6%
28.2%
24.7%
30.7%
22.6%
36.0%
24.6%
20.7%
7.9%
21.3%
42.3%
29.1%
13.7%
28.7%
6.9%
27.3%
0% 10% 20% 30% 40% 50% 60% 70% 80% 90% 100%
DRP
IA
STAFF
OPEN SHOP
PHOTO
Total
% <= 12 Hrs % 12-48 Hrs % 48-120 Hrs % > 120 Hrs
7.1
4.2
2.1
5.5
1.2
4.5
DRP
IA
STAFF
OPEN SHOP
PHOTO
Total
Overall Last EstimateAssignment Sent toEstimate Sent Days Avg
IOT/TELEMATICS: Numerous carriers have expanded their telematics programs, responding to consumer interest that surged during the pandemic. Even carriers slower to introduce a telematics-based insurance product have acknowledged it has a big role to play in matching rate to risk.²² Telematics enables carriers to deliver a much more personalized insurance product, more closely matching driving risk to premium. As more people use products that have been personalized based on individual usage, interest in telematics is expected to grow, even if people begin to drive more again.
CCC commissioned research that looked at consumer’s insurance buying behaviors - pre-purchase and purchase behaviors, as well as attitudes and concerns around technology-led offerings such as UBI and mobile apps. The study found that UBI works not just in theory, but also in practice – an impressive 90 percent of drivers are highly satisfied with their current usage-based insurance. Despite its benefits, however, only 10 percent of drivers surveyed currently use UBI.
While widespread UBI adoption has a way to go before it becomes the norm, study respondents shared what factors go into their decision.
Beyond saving money – which comes in third place (32%) –close to half of respondents (43%) said they turn to UBI because it helps make them a safer driver. The fact that UBI improves coverage came in second place with 33% (Figure 5).
Older consumers (35+) tend to use UBI because it lowers their premium over time and because it improves coverage. Significantly fewer younger consumers (18-34) share the same opinion (Figure 5).
It makes me a safer driver
It improves coverage
It lowers my premiums over time
It is easy to install and use
It provides improved accident investigation
I like to utilize my data to enhance my driving experience
I got a discount on my insurance cost by using the program
Implementation was easy
I don’t drive very frequently
Other
43%
33%
32%
29%
28%
25%
25%
22%
20%
1%
0% 20% 40% 60% 80% 100%
13© 2021 CCC Intelligent Solutions Inc. All Rights Reserved.
CRASH
COURSE 2021 | EVOLUTION
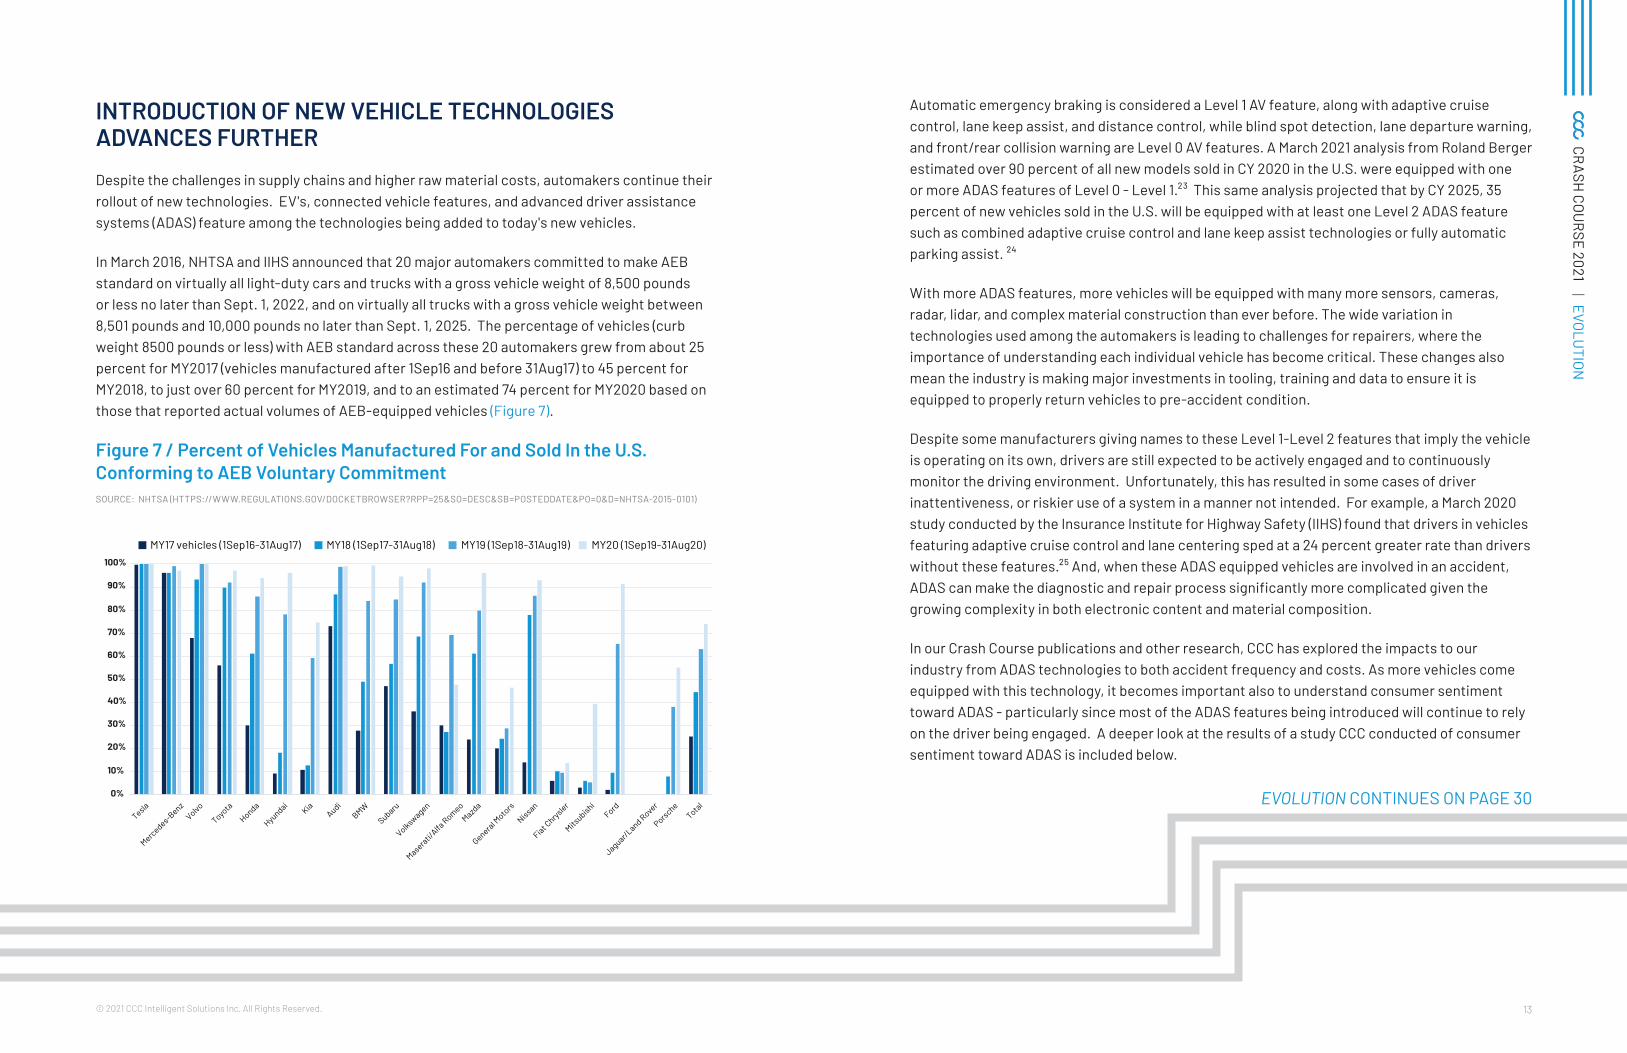
Automatic emergency braking is considered a Level 1 AV feature, along with adaptive cruise control, lane keep assist, and distance control, while blind spot detection, lane departure warning, and front/rear collision warning are Level 0 AV features. A March 2021 analysis from Roland Berger estimated over 90 percent of all new models sold in CY 2020 in the U.S. were equipped with one or more ADAS features of Level 0 - Level 1.²³ This same analysis projected that by CY 2025, 35 percent of new vehicles sold in the U.S. will be equipped with at least one Level 2 ADAS feature such as combined adaptive cruise control and lane keep assist technologies or fully automatic parking assist. ²⁴
With more ADAS features, more vehicles will be equipped with many more sensors, cameras, radar, lidar, and complex material construction than ever before. The wide variation in technologies used among the automakers is leading to challenges for repairers, where the importance of understanding each individual vehicle has become critical. These changes also mean the industry is making major investments in tooling, training and data to ensure it is equipped to properly return vehicles to pre-accident condition.
Despite some manufacturers giving names to these Level 1-Level 2 features that imply the vehicle is operating on its own, drivers are still expected to be actively engaged and to continuously monitor the driving environment. Unfortunately, this has resulted in some cases of driver inattentiveness, or riskier use of a system in a manner not intended. For example, a March 2020 study conducted by the Insurance Institute for Highway Safety (IIHS) found that drivers in vehicles featuring adaptive cruise control and lane centering sped at a 24 percent greater rate than drivers without these features.²⁵ And, when these ADAS equipped vehicles are involved in an accident, ADAS can make the diagnostic and repair process significantly more complicated given the growing complexity in both electronic content and material composition.
In our Crash Course publications and other research, CCC has explored the impacts to our industry from ADAS technologies to both accident frequency and costs. As more vehicles come equipped with this technology, it becomes important also to understand consumer sentiment toward ADAS - particularly since most of the ADAS features being introduced will continue to rely on the driver being engaged. A deeper look at the results of a study CCC conducted of consumer sentiment toward ADAS is included below.
EVOLUTION CONTINUES ON PAGE 30
INTRODUCTION OF NEW VEHICLE TECHNOLOGIES ADVANCES FURTHER
Despite the challenges in supply chains and higher raw material costs, automakers continue their rollout of new technologies. EV's, connected vehicle features, and advanced driver assistance systems (ADAS) feature among the technologies being added to today's new vehicles.
In March 2016, NHTSA and IIHS announced that 20 major automakers committed to make AEB standard on virtually all light-duty cars and trucks with a gross vehicle weight of 8,500 pounds or less no later than Sept. 1, 2022, and on virtually all trucks with a gross vehicle weight between 8,501 pounds and 10,000 pounds no later than Sept. 1, 2025. The percentage of vehicles (curb weight 8500 pounds or less) with AEB standard across these 20 automakers grew from about 25 percent for MY2017 (vehicles manufactured after 1Sep16 and before 31Aug17) to 45 percent for MY2018, to just over 60 percent for MY2019, and to an estimated 74 percent for MY2020 based on those that reported actual volumes of AEB-equipped vehicles (Figure 7).
Figure 7 / Percent of Vehicles Manufactured For and Sold In the U.S. Conforming to AEB Voluntary CommitmentSOURCE: NHTSA (HTTPS://WWW.REGULATIONS.GOV/DOCKETBROWSER?RPP=25&SO=DESC&SB=POSTEDDATE&PO=0&D=NHTSA-2015-0101)
0%
10%
20%
30%
40%
50%
60%
70%
80%
90%
100%
Tesla
Mercedes-Benz
Volvo
Toyota
Honda
HyundaiKia
AudiBMW
Subaru
Volkswagen
Maserati/Alfa
RomeoMazda
General Moto
rs
Nissan
Fiat Chrysler
Mitsubishi
Ford
Jaguar/Land Rover
PorscheTotal
MY17 vehicles (1Sep16-31Aug17) MY18 (1Sep17-31Aug18) MY19 (1Sep18-31Aug19) MY20 (1Sep19-31Aug20)
15© 2021 CCC Intelligent Solutions Inc. All Rights Reserved.
CRASH
COURSE 2021 | ADAS
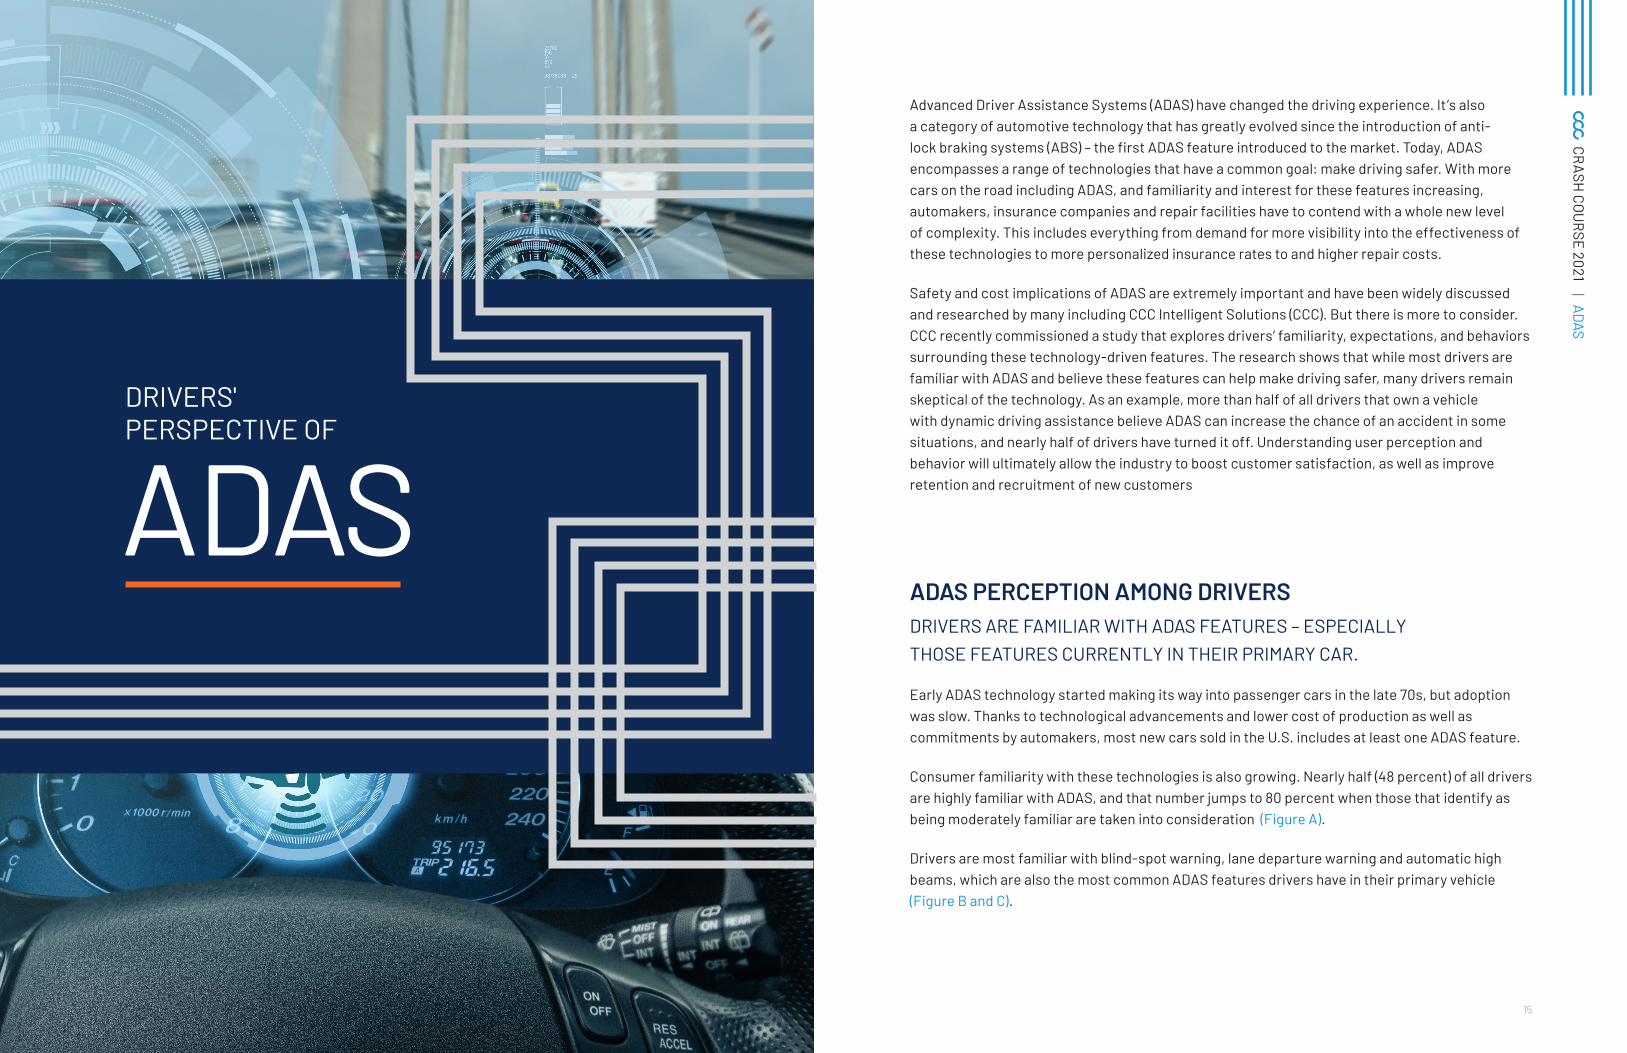
Advanced Driver Assistance Systems (ADAS) have changed the driving experience. It’s also a category of automotive technology that has greatly evolved since the introduction of anti-lock braking systems (ABS) – the first ADAS feature introduced to the market. Today, ADAS encompasses a range of technologies that have a common goal: make driving safer. With more cars on the road including ADAS, and familiarity and interest for these features increasing, automakers, insurance companies and repair facilities have to contend with a whole new level of complexity. This includes everything from demand for more visibility into the effectiveness of these technologies to more personalized insurance rates to and higher repair costs.
Safety and cost implications of ADAS are extremely important and have been widely discussed and researched by many including CCC Intelligent Solutions (CCC). But there is more to consider. CCC recently commissioned a study that explores drivers’ familiarity, expectations, and behaviors surrounding these technology-driven features. The research shows that while most drivers are familiar with ADAS and believe these features can help make driving safer, many drivers remain skeptical of the technology. As an example, more than half of all drivers that own a vehicle with dynamic driving assistance believe ADAS can increase the chance of an accident in some situations, and nearly half of drivers have turned it off. Understanding user perception and behavior will ultimately allow the industry to boost customer satisfaction, as well as improve retention and recruitment of new customers
ADAS PERCEPTION AMONG DRIVERSDRIVERS ARE FAMILIAR WITH ADAS FEATURES – ESPECIALLY THOSE FEATURES CURRENTLY IN THEIR PRIMARY CAR.
Early ADAS technology started making its way into passenger cars in the late 70s, but adoption was slow. Thanks to technological advancements and lower cost of production as well as commitments by automakers, most new cars sold in the U.S. includes at least one ADAS feature.
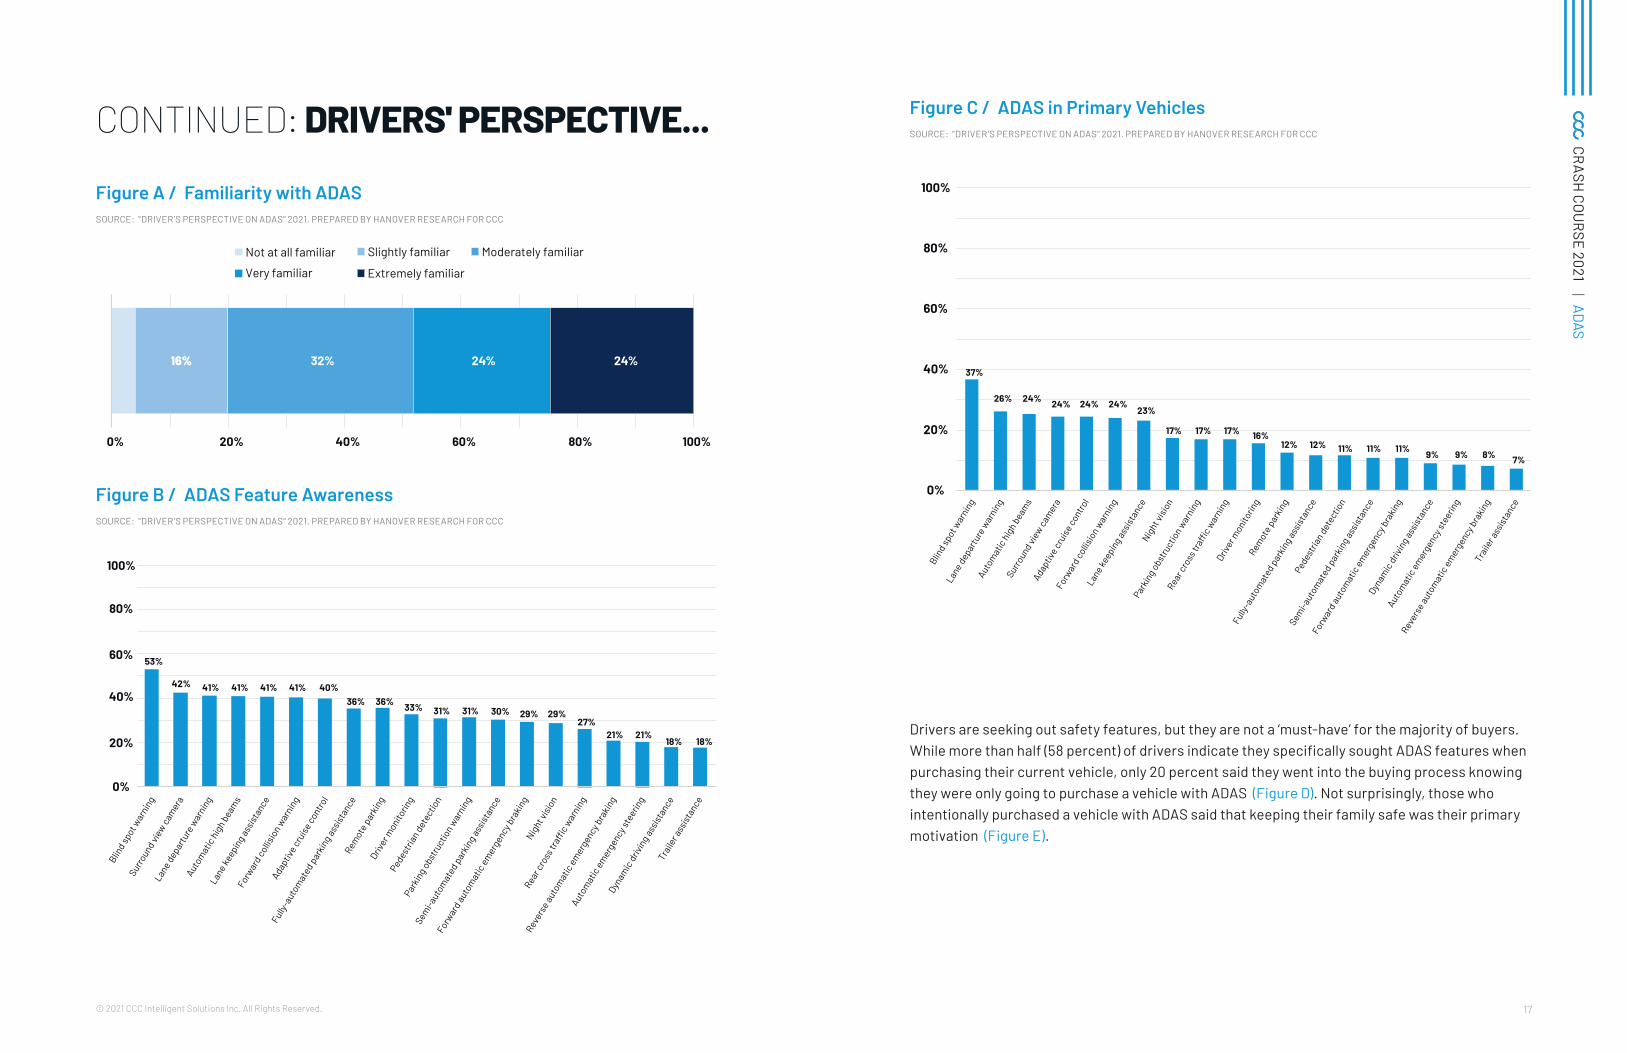
Consumer familiarity with these technologies is also growing. Nearly half (48 percent) of all drivers are highly familiar with ADAS, and that number jumps to 80 percent when those that identify as being moderately familiar are taken into consideration (Figure A).
Drivers are most familiar with blind-spot warning, lane departure warning and automatic high beams, which are also the most common ADAS features drivers have in their primary vehicle (Figure B and C).
ADASDRIVERS'PERSPECTIVE OF
17© 2021 CCC Intelligent Solutions Inc. All Rights Reserved.
CRASH
COURSE 2021 | ADAS
Figure A / Familiarity with ADASSOURCE: "DRIVER'S PERSPECTIVE ON ADAS" 2021. PREPARED BY HANOVER RESEARCH FOR CCC
1166%% 32% 24% 24%
0% 20% 40% 60% 80% 100%
Extremely familiarVery familiar
Moderately familiarSlightly familiarNot at all familiar
Figure B / ADAS Feature AwarenessSOURCE: "DRIVER'S PERSPECTIVE ON ADAS" 2021. PREPARED BY HANOVER RESEARCH FOR CCC
0%
20%
40%
60%
80%
100%
Traile
r ass
istan
ce
Dynam
ic dr
iving
assis
tanc
e
Autom
atic
emer
genc
y ste
erin
g
Rever
se au
tom
atic
emer
genc
y bra
king
Rear c
ross
traffi
c war
ning
Night
visio
n
Forwar
d aut
omat
ic em
erge
ncy b
rakin
g
Semi-a
utom
ated
park
ing a
ssist
ance
Parkin
g obs
truct
ion w
arni
ng
Pedes
trian
dete
ctio
n
Driver
mon
itorin
g
Remot
e par
king
Fully-
auto
mat
ed pa
rkin
g ass
istan
ce
Adapt
ive cr
uise
cont
rol
Forwar
d col
lisio
n war
ning
Lane k
eepi
ng as
sista
nce
Autom
atic
high
beam
s
Lane d
epar
ture
war
ning
Surro
und v
iew ca
mer
a
Blind s
pot w
arni
ng
53%
42% 41% 41% 41% 41% 40%36% 36% 33% 31% 31% 30% 29% 29%
27%21% 21%
18% 18%
CONTINUED: DRIVERS' PERSPECTIVE... Figure C / ADAS in Primary VehiclesSOURCE: "DRIVER'S PERSPECTIVE ON ADAS" 2021. PREPARED BY HANOVER RESEARCH FOR CCC
0%
20%
40%
60%
80%
100%
Traile
r ass
istan
ce
Rever
se au
tom
atic
emer
genc
y bra
king
Autom
atic
emer
genc
y ste
erin
g
Dynam
ic dr
iving
assis
tanc
e
Forwar
d aut
omat
ic em
erge
ncy b
rakin
g
Semi-a
utom
ated
park
ing a
ssist
ance
Pedes
trian
dete
ctio
n
Fully-
auto
mat
ed pa
rkin
g ass
istan
ce
Remot
e par
king
Driver
mon
itorin
g
Rear c
ross
traffi
c war
ning
Parkin
g obs
truct
ion w
arni
ng
Night
visio
n
Lane k
eepi
ng as
sista
nce
Forwar
d col
lisio
n war
ning
Adapt
ive cr
uise
cont
rol
Surro
und v
iew ca
mer
a
Autom
atic
high
beam
s
Lane d
epar
ture
war
ning
Blind s
pot w
arni
ng
37%
26% 24% 24% 24% 24%23%
17% 17% 17% 16%12% 12% 11% 11% 11% 9% 9% 8% 7%
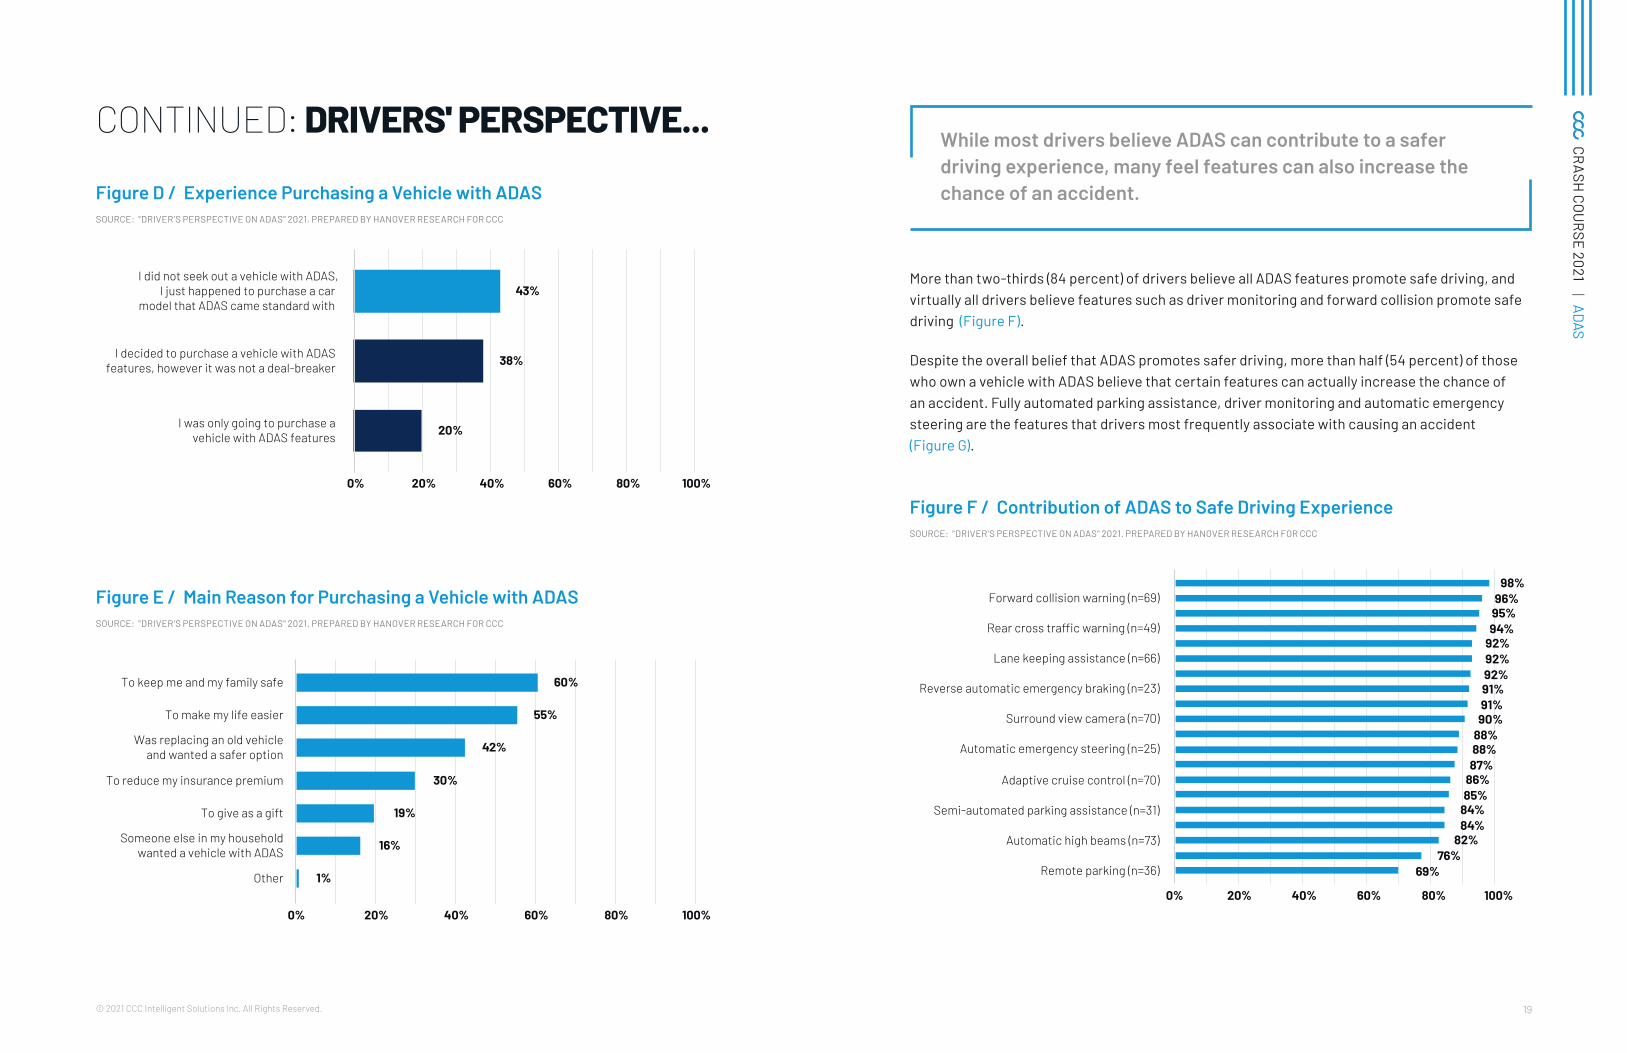
Drivers are seeking out safety features, but they are not a ‘must-have’ for the majority of buyers. While more than half (58 percent) of drivers indicate they specifically sought ADAS features when purchasing their current vehicle, only 20 percent said they went into the buying process knowing they were only going to purchase a vehicle with ADAS (Figure D). Not surprisingly, those who intentionally purchased a vehicle with ADAS said that keeping their family safe was their primary motivation (Figure E).
19© 2021 CCC Intelligent Solutions Inc. All Rights Reserved.
CRASH
COURSE 2021 | ADAS
Figure D / Experience Purchasing a Vehicle with ADAS SOURCE: "DRIVER'S PERSPECTIVE ON ADAS" 2021. PREPARED BY HANOVER RESEARCH FOR CCC
20%
38%
43%
0% 20% 40% 60% 80% 100%
I was only going to purchase avehicle with ADAS features
I decided to purchase a vehicle with ADASfeatures, however it was not a deal-breaker
I did not seek out a vehicle with ADAS,I just happened to purchase a car
model that ADAS came standard with
Figure E / Main Reason for Purchasing a Vehicle with ADAS SOURCE: "DRIVER'S PERSPECTIVE ON ADAS" 2021. PREPARED BY HANOVER RESEARCH FOR CCC
1%
16%
19%
30%
42%
55%
60%
0% 20% 40% 60% 80% 100%
Other
Someone else in my householdwanted a vehicle with ADAS
To give as a gift
To reduce my insurance premium
Was replacing an old vehicleand wanted a safer option
To make my life easier
To keep me and my family safe
CONTINUED: DRIVERS' PERSPECTIVE...While most drivers believe ADAS can contribute to a safer driving experience, many feel features can also increase the chance of an accident.
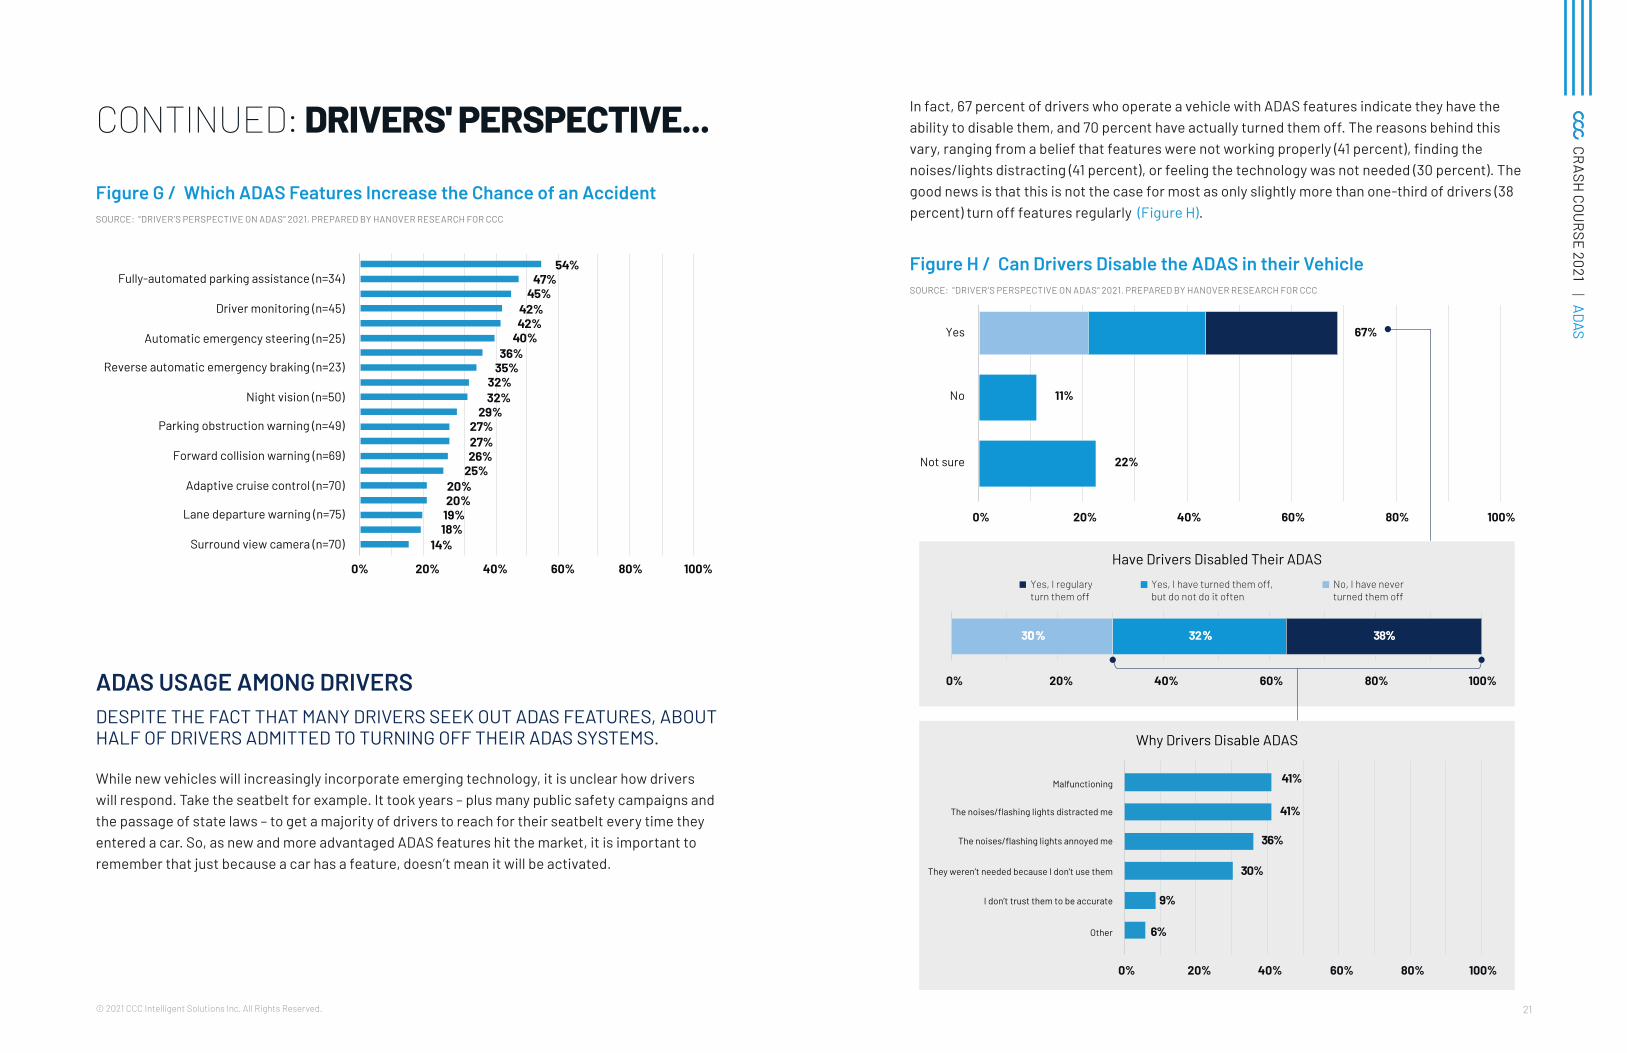
More than two-thirds (84 percent) of drivers believe all ADAS features promote safe driving, and virtually all drivers believe features such as driver monitoring and forward collision promote safe driving (Figure F).
Despite the overall belief that ADAS promotes safer driving, more than half (54 percent) of those who own a vehicle with ADAS believe that certain features can actually increase the chance of an accident. Fully automated parking assistance, driver monitoring and automatic emergency steering are the features that drivers most frequently associate with causing an accident (Figure G).
Figure F / Contribution of ADAS to Safe Driving Experience SOURCE: "DRIVER'S PERSPECTIVE ON ADAS" 2021. PREPARED BY HANOVER RESEARCH FOR CCC
69%76%
82%84%84%85%86%87%88%88%90%91%91%92%92%92%94%95%96%
98%
0% 20% 40% 60% 80% 100%
Remote parking (n=36)
Automatic high beams (n=73)
Semi-automated parking assistance (n=31)
Adaptive cruise control (n=70)
Automatic emergency steering (n=25)
Surround view camera (n=70)
Reverse automatic emergency braking (n=23)
Lane keeping assistance (n=66)
Rear cross traffic warning (n=49)
Forward collision warning (n=69)
21© 2021 CCC Intelligent Solutions Inc. All Rights Reserved.
CRASH
COURSE 2021 | ADAS
CONTINUED: DRIVERS' PERSPECTIVE...
Figure G / Which ADAS Features Increase the Chance of an AccidentSOURCE: "DRIVER'S PERSPECTIVE ON ADAS" 2021. PREPARED BY HANOVER RESEARCH FOR CCC
14%18%19%20%20%
25%26%27%27%
29%32%32%
35%36%
40%42%42%
45%47%
54%
0% 20% 40% 60% 80% 100%
Surround view camera (n=70)
Lane departure warning (n=75)
Adaptive cruise control (n=70)
Forward collision warning (n=69)
Parking obstruction warning (n=49)
Night vision (n=50)
Reverse automatic emergency braking (n=23)
Automatic emergency steering (n=25)
Driver monitoring (n=45)
Fully-automated parking assistance (n=34)
ADAS USAGE AMONG DRIVERSDESPITE THE FACT THAT MANY DRIVERS SEEK OUT ADAS FEATURES, ABOUT HALF OF DRIVERS ADMITTED TO TURNING OFF THEIR ADAS SYSTEMS.
While new vehicles will increasingly incorporate emerging technology, it is unclear how drivers will respond. Take the seatbelt for example. It took years – plus many public safety campaigns and the passage of state laws – to get a majority of drivers to reach for their seatbelt every time they entered a car. So, as new and more advantaged ADAS features hit the market, it is important to remember that just because a car has a feature, doesn’t mean it will be activated.
In fact, 67 percent of drivers who operate a vehicle with ADAS features indicate they have the ability to disable them, and 70 percent have actually turned them off. The reasons behind this vary, ranging from a belief that features were not working properly (41 percent), finding the noises/lights distracting (41 percent), or feeling the technology was not needed (30 percent). The good news is that this is not the case for most as only slightly more than one-third of drivers (38 percent) turn off features regularly (Figure H).
Figure H / Can Drivers Disable the ADAS in their VehicleSOURCE: "DRIVER'S PERSPECTIVE ON ADAS" 2021. PREPARED BY HANOVER RESEARCH FOR CCC
22%
11%
67%
0% 20% 40% 60% 80% 100%
Not sure
No
Yes
Have Drivers Disabled Their ADAS
0% 20% 40% 60% 80% 100%
38%%32%%300%%
Yes, I regulary turn them off
Yes, I have turned them off,but do not do it often
No, I have neverturned them off
6%
9%
30%
36%
41%
41%
0% 20% 40% 60% 80% 100%
Other
I don’t trust them to be accurate
They weren’t needed because I don’t use them
The noises/flashing lights annoyed me
The noises/flashing lights distracted me
Malfunctioning
Why Drivers Disable ADAS
23© 2021 CCC Intelligent Solutions Inc. All Rights Reserved.
CRASH
COURSE 2021 | ADAS
CONTINUED: DRIVERS' PERSPECTIVE...
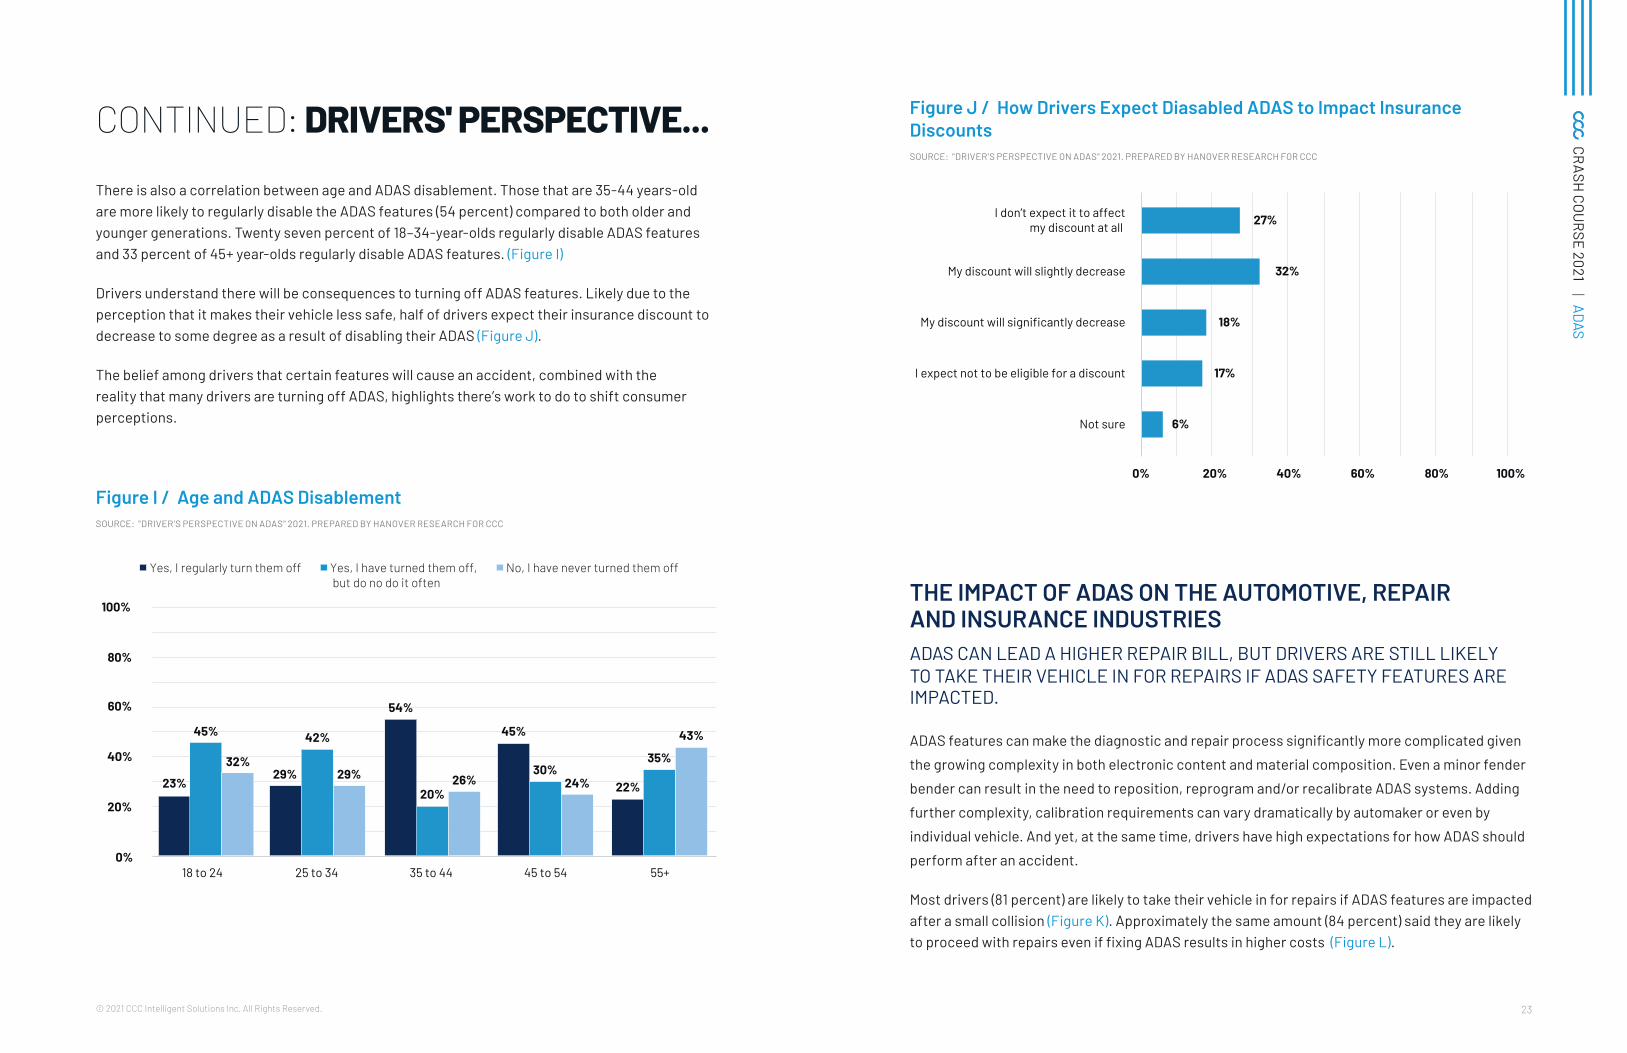
There is also a correlation between age and ADAS disablement. Those that are 35-44 years-old are more likely to regularly disable the ADAS features (54 percent) compared to both older and younger generations. Twenty seven percent of 18–34-year-olds regularly disable ADAS features and 33 percent of 45+ year-olds regularly disable ADAS features. (Figure I)
Drivers understand there will be consequences to turning off ADAS features. Likely due to the perception that it makes their vehicle less safe, half of drivers expect their insurance discount to decrease to some degree as a result of disabling their ADAS (Figure J).
The belief among drivers that certain features will cause an accident, combined with the reality that many drivers are turning off ADAS, highlights there’s work to do to shift consumer perceptions.
Figure I / Age and ADAS DisablementSOURCE: "DRIVER'S PERSPECTIVE ON ADAS" 2021. PREPARED BY HANOVER RESEARCH FOR CCC
0%
20%
40%
60%
80%
100%
18 to 24 25 to 34 35 to 44 45 to 54 55+
22%24%
35%
43%
30%
45%
26%20%
54%
29%
42%
29%32%
45%
23%
Yes, I regularly turn them off Yes, I have turned them off, but do no do it often
No, I have never turned them off
Figure J / How Drivers Expect Diasabled ADAS to Impact Insurance DiscountsSOURCE: "DRIVER'S PERSPECTIVE ON ADAS" 2021. PREPARED BY HANOVER RESEARCH FOR CCC
6%
17%
18%
32%
27%
0% 20% 40% 60% 80% 100%
Not sure
I expect not to be eligible for a discount
My discount will significantly decrease
My discount will slightly decrease
I don’t expect it to affectmy discount at all
THE IMPACT OF ADAS ON THE AUTOMOTIVE, REPAIR AND INSURANCE INDUSTRIESADAS CAN LEAD A HIGHER REPAIR BILL, BUT DRIVERS ARE STILL LIKELY TO TAKE THEIR VEHICLE IN FOR REPAIRS IF ADAS SAFETY FEATURES ARE IMPACTED.
ADAS features can make the diagnostic and repair process significantly more complicated given
the growing complexity in both electronic content and material composition. Even a minor fender
bender can result in the need to reposition, reprogram and/or recalibrate ADAS systems. Adding
further complexity, calibration requirements can vary dramatically by automaker or even by
individual vehicle. And yet, at the same time, drivers have high expectations for how ADAS should
perform after an accident.
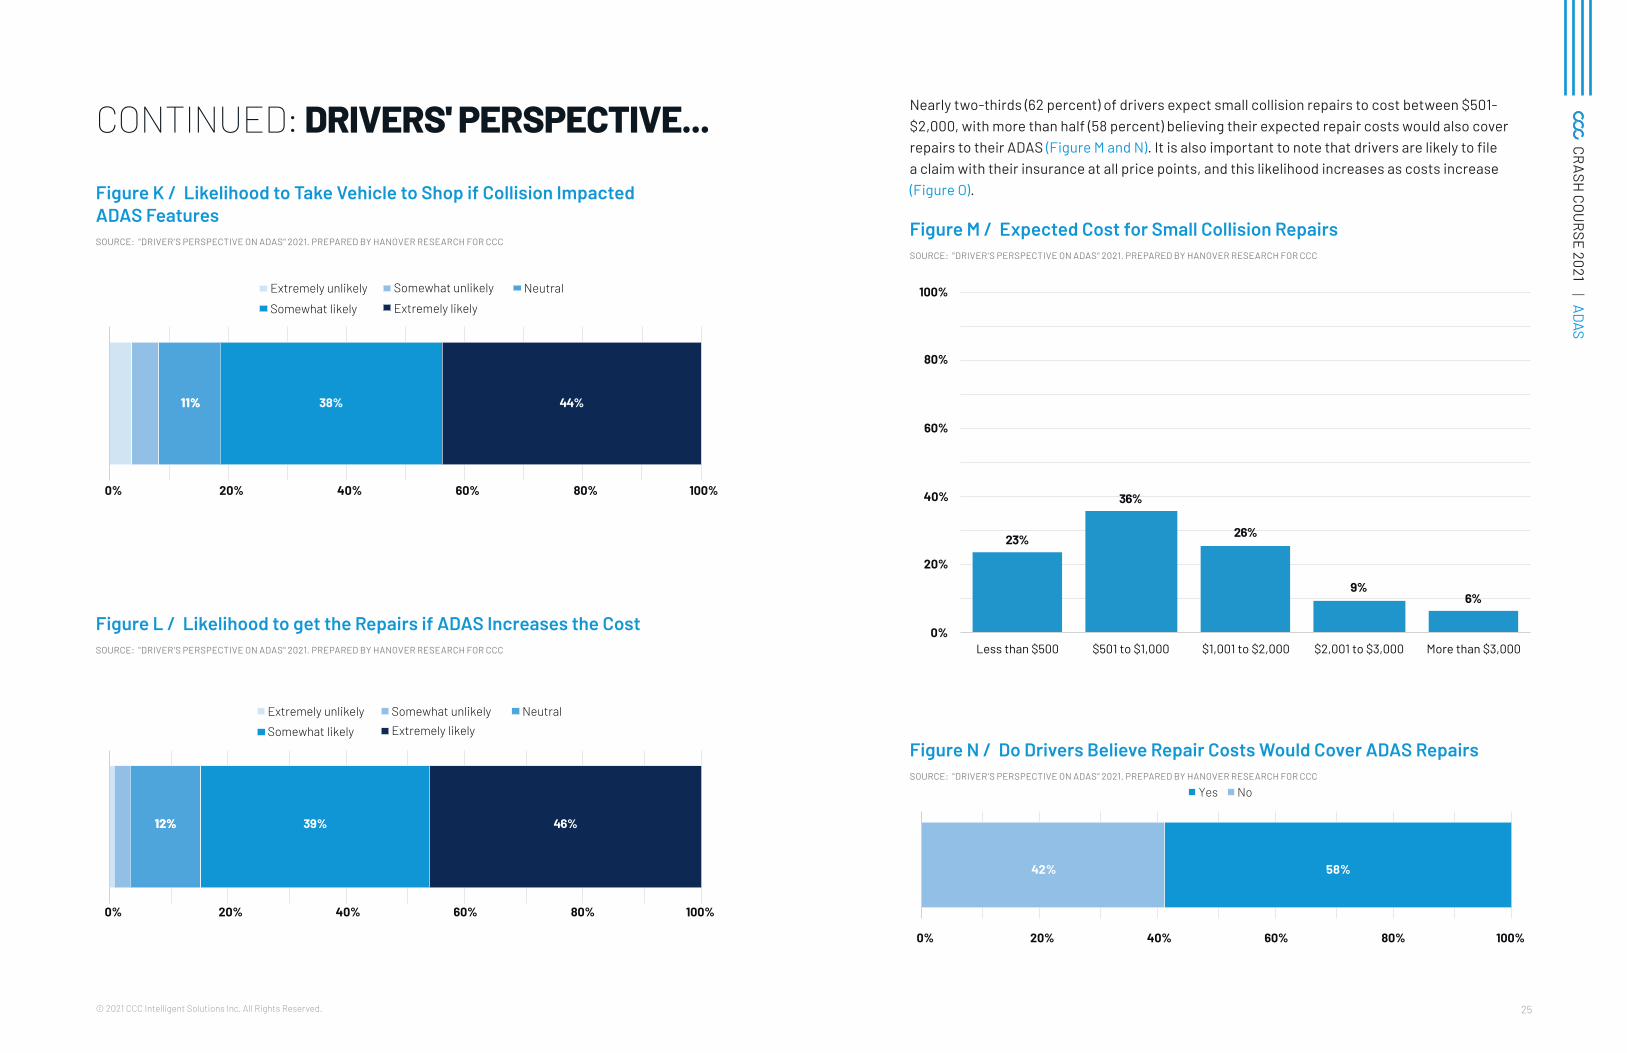
Most drivers (81 percent) are likely to take their vehicle in for repairs if ADAS features are impacted after a small collision (Figure K). Approximately the same amount (84 percent) said they are likely to proceed with repairs even if fixing ADAS results in higher costs (Figure L).
25© 2021 CCC Intelligent Solutions Inc. All Rights Reserved.
CRASH
COURSE 2021 | ADAS
CONTINUED: DRIVERS' PERSPECTIVE...
Figure K / Likelihood to Take Vehicle to Shop if Collision Impacted ADAS FeaturesSOURCE: "DRIVER'S PERSPECTIVE ON ADAS" 2021. PREPARED BY HANOVER RESEARCH FOR CCC
1111%% 38% 44%
0% 20% 40% 60% 80% 100%
Extremely likelySomewhat likely
NeutralSomewhat unlikelyExtremely unlikely
Figure L / Likelihood to get the Repairs if ADAS Increases the Cost SOURCE: "DRIVER'S PERSPECTIVE ON ADAS" 2021. PREPARED BY HANOVER RESEARCH FOR CCC
1122%% 39% 46%
0% 20% 40% 60% 80% 100%
Extremely likelySomewhat likely
NeutralSomewhat unlikelyExtremely unlikely
Nearly two-thirds (62 percent) of drivers expect small collision repairs to cost between $501-$2,000, with more than half (58 percent) believing their expected repair costs would also cover repairs to their ADAS (Figure M and N). It is also important to note that drivers are likely to file a claim with their insurance at all price points, and this likelihood increases as costs increase (Figure O).
Figure M / Expected Cost for Small Collision RepairsSOURCE: "DRIVER'S PERSPECTIVE ON ADAS" 2021. PREPARED BY HANOVER RESEARCH FOR CCC
23%
36%
26%
9%6%
0%
20%
40%
60%
80%
100%
Less than $500 $501 to $1,000 $1,001 to $2,000 $2,001 to $3,000 More than $3,000
Figure N / Do Drivers Believe Repair Costs Would Cover ADAS Repairs SOURCE: "DRIVER'S PERSPECTIVE ON ADAS" 2021. PREPARED BY HANOVER RESEARCH FOR CCC
0% 20% 40% 60% 80% 100%
58%42%
Yes No
27© 2021 CCC Intelligent Solutions Inc. All Rights Reserved.
CRASH
COURSE 2021 | ADAS
CONTINUED: DRIVERS' PERSPECTIVE...
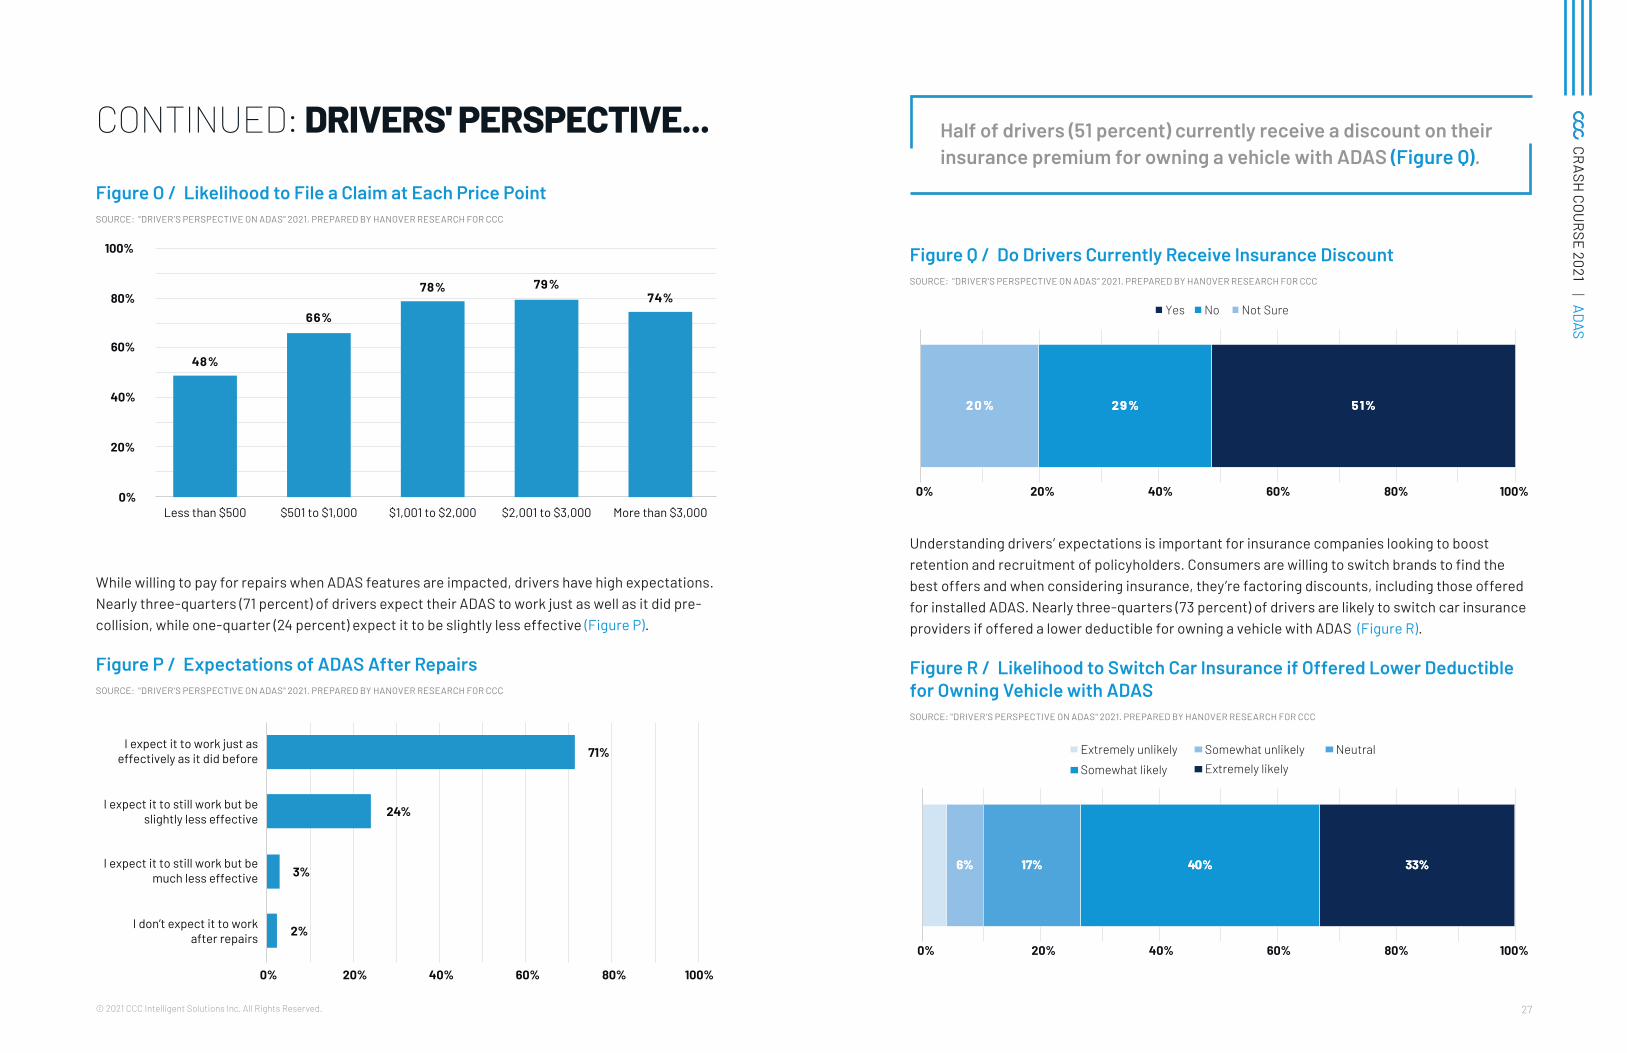
Figure O / Likelihood to File a Claim at Each Price Point SOURCE: "DRIVER'S PERSPECTIVE ON ADAS" 2021. PREPARED BY HANOVER RESEARCH FOR CCC
48%
66%
78% 79%74%
0%
20%
40%
60%
80%
100%
Less than $500 $501 to $1,000 $1,001 to $2,000 $2,001 to $3,000 More than $3,000
While willing to pay for repairs when ADAS features are impacted, drivers have high expectations. Nearly three-quarters (71 percent) of drivers expect their ADAS to work just as well as it did pre-collision, while one-quarter (24 percent) expect it to be slightly less effective (Figure P).
Figure P / Expectations of ADAS After RepairsSOURCE: "DRIVER'S PERSPECTIVE ON ADAS" 2021. PREPARED BY HANOVER RESEARCH FOR CCC
2%
3%
24%
71%
0% 20% 40% 60% 80% 100%
I don’t expect it to workafter repairs
I expect it to still work but bemuch less effective
I expect it to still work but beslightly less effective
I expect it to work just aseffectively as it did before
Half of drivers (51 percent) currently receive a discount on their insurance premium for owning a vehicle with ADAS (Figure Q).
Figure Q / Do Drivers Currently Receive Insurance DiscountSOURCE: "DRIVER'S PERSPECTIVE ON ADAS" 2021. PREPARED BY HANOVER RESEARCH FOR CCC
0% 20% 40% 60% 80% 100%
Yes No Not Sure
5511%%2299 %%2200 %%
Understanding drivers’ expectations is important for insurance companies looking to boost retention and recruitment of policyholders. Consumers are willing to switch brands to find the best offers and when considering insurance, they’re factoring discounts, including those offered for installed ADAS. Nearly three-quarters (73 percent) of drivers are likely to switch car insurance providers if offered a lower deductible for owning a vehicle with ADAS (Figure R).
Figure R / Likelihood to Switch Car Insurance if Offered Lower Deductible for Owning Vehicle with ADASSOURCE: "DRIVER'S PERSPECTIVE ON ADAS" 2021. PREPARED BY HANOVER RESEARCH FOR CCC
0% 20% 40% 60% 80% 100%
Extremely likelySomewhat likely
NeutralSomewhat unlikelyExtremely unlikely
66%% 1177%% 4400%% 3333%%
29© 2021 CCC Intelligent Solutions Inc. All Rights Reserved.
CRASH
COURSE 2021 | ADAS
CONTINUED: DRIVERS' PERSPECTIVE...
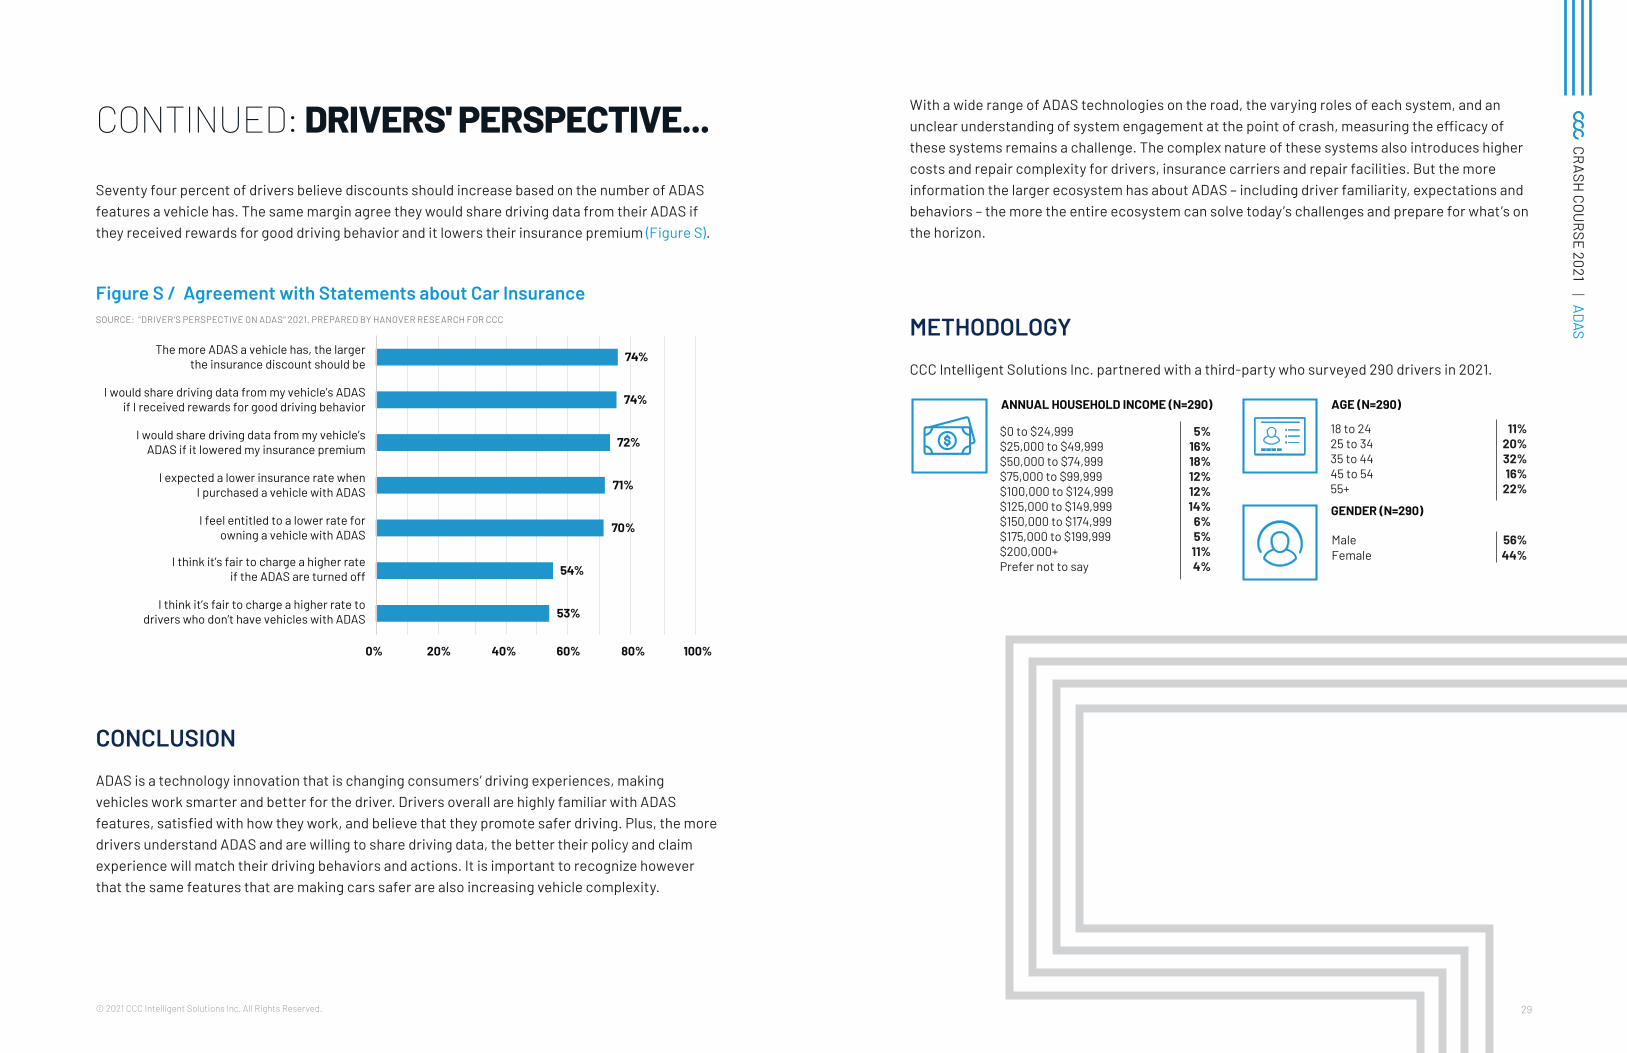
Seventy four percent of drivers believe discounts should increase based on the number of ADAS features a vehicle has. The same margin agree they would share driving data from their ADAS if they received rewards for good driving behavior and it lowers their insurance premium (Figure S).
Figure S / Agreement with Statements about Car Insurance SOURCE: "DRIVER'S PERSPECTIVE ON ADAS" 2021. PREPARED BY HANOVER RESEARCH FOR CCC
53%
54%
70%
71%
72%
74%
74%
0% 20% 40% 60% 80% 100%
I think it’s fair to charge a higher rate todrivers who don’t have vehicles with ADAS
I think it’s fair to charge a higher rateif the ADAS are turned off
I feel entitled to a lower rate forowning a vehicle with ADAS
I expected a lower insurance rate whenI purchased a vehicle with ADAS
I would share driving data from my vehicle’sADAS if it lowered my insurance premium
I would share driving data from my vehicle’s ADASif I received rewards for good driving behavior
The more ADAS a vehicle has, the largerthe insurance discount should be
CONCLUSION
ADAS is a technology innovation that is changing consumers’ driving experiences, making vehicles work smarter and better for the driver. Drivers overall are highly familiar with ADAS features, satisfied with how they work, and believe that they promote safer driving. Plus, the more drivers understand ADAS and are willing to share driving data, the better their policy and claim experience will match their driving behaviors and actions. It is important to recognize however that the same features that are making cars safer are also increasing vehicle complexity.
With a wide range of ADAS technologies on the road, the varying roles of each system, and an unclear understanding of system engagement at the point of crash, measuring the efficacy of these systems remains a challenge. The complex nature of these systems also introduces higher costs and repair complexity for drivers, insurance carriers and repair facilities. But the more information the larger ecosystem has about ADAS – including driver familiarity, expectations and behaviors – the more the entire ecosystem can solve today’s challenges and prepare for what’s on the horizon.
METHODOLOGY
CCC Intelligent Solutions Inc. partnered with a third-party who surveyed 290 drivers in 2021.
18 to 2425 to 3435 to 4445 to 5455+
11%20%32%16%
22%
Male 56%Female 44%
AGE (N=290)
GENDER (N=290)
$0 to $24,999$25,000 to $49,999$50,000 to $74,999$75,000 to $99,999$100,000 to $124,999$125,000 to $149,999$150,000 to $174,999$175,000 to $199,999$200,000+Prefer not to say
5%16%18%12%12%14%
6%5%11%4%
ANNUAL HOUSEHOLD INCOME (N=290)
31© 2021 CCC Intelligent Solutions Inc. All Rights Reserved.
CRASH
COURSE 2021 | EVOLUTION
EVOLUTION CONTINUED
DRIVING PATTERNS HAVE CHANGED - BUT ARE THEY PERMANENT?
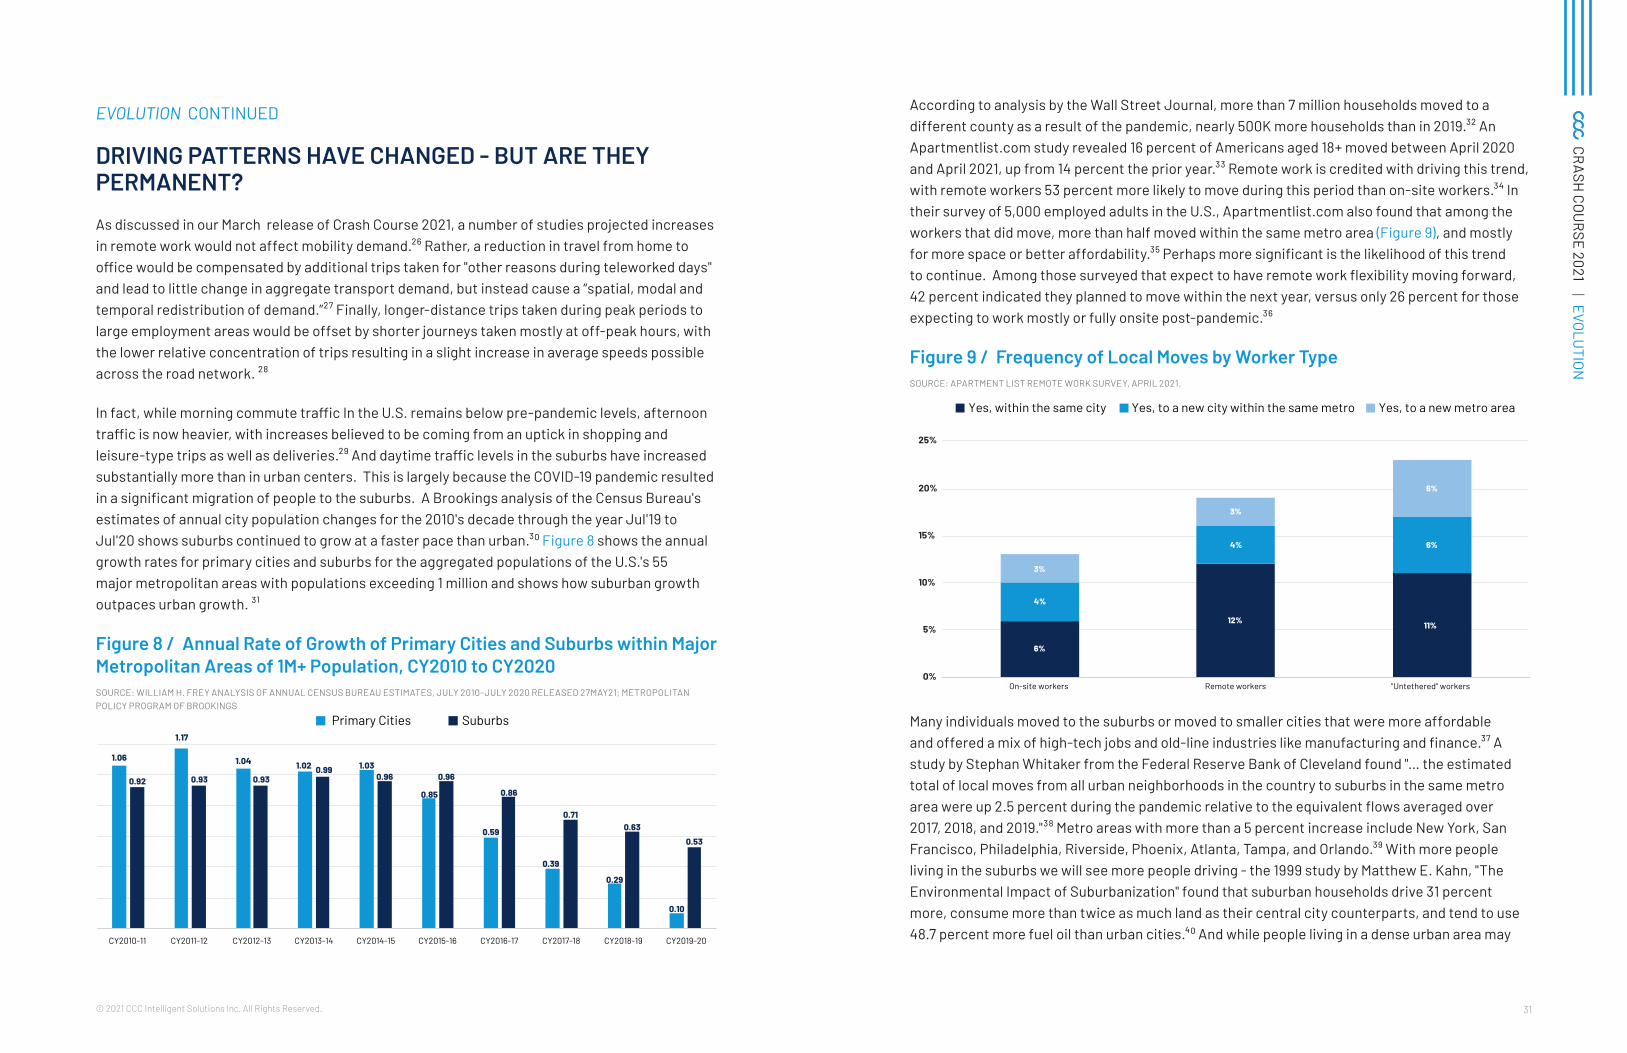
As discussed in our March release of Crash Course 2021, a number of studies projected increases in remote work would not affect mobility demand.²⁶ Rather, a reduction in travel from home to office would be compensated by additional trips taken for "other reasons during teleworked days" and lead to little change in aggregate transport demand, but instead cause a “spatial, modal and temporal redistribution of demand.”²⁷ Finally, longer-distance trips taken during peak periods to large employment areas would be offset by shorter journeys taken mostly at off-peak hours, with the lower relative concentration of trips resulting in a slight increase in average speeds possible across the road network. ²⁸
In fact, while morning commute traffic In the U.S. remains below pre-pandemic levels, afternoon traffic is now heavier, with increases believed to be coming from an uptick in shopping and leisure-type trips as well as deliveries.²⁹ And daytime traffic levels in the suburbs have increased substantially more than in urban centers. This is largely because the COVID-19 pandemic resulted in a significant migration of people to the suburbs. A Brookings analysis of the Census Bureau's estimates of annual city population changes for the 2010's decade through the year Jul'19 to Jul'20 shows suburbs continued to grow at a faster pace than urban.³0 Figure 8 shows the annual growth rates for primary cities and suburbs for the aggregated populations of the U.S.'s 55 major metropolitan areas with populations exceeding 1 million and shows how suburban growth outpaces urban growth. ³1
Figure 8 / Annual Rate of Growth of Primary Cities and Suburbs within Major Metropolitan Areas of 1M+ Population, CY2010 to CY2020 SOURCE: WILLIAM H. FREY ANALYSIS OF ANNUAL CENSUS BUREAU ESTIMATES, JULY 2010-JULY 2020 RELEASED 27MAY21; METROPOLITAN POLICY PROGRAM OF BROOKINGS
1.06
1.17
1.04 1.02 1.03
0.85
0.59
0.39
0.29
0.10
0.92 0.93 0.930.99
0.96 0.96
0.86
0.710.63
0.53
CY2010-11 CY2011-12 CY2012-13 CY2013-14 CY2014-15 CY2015-16 CY2016-17 CY2017-18 CY2018-19 CY2019-20
Primary Cities Suburbs
According to analysis by the Wall Street Journal, more than 7 million households moved to a different county as a result of the pandemic, nearly 500K more households than in 2019.³² An Apartmentlist.com study revealed 16 percent of Americans aged 18+ moved between April 2020 and April 2021, up from 14 percent the prior year.³³ Remote work is credited with driving this trend, with remote workers 53 percent more likely to move during this period than on-site workers.³⁴ In their survey of 5,000 employed adults in the U.S., Apartmentlist.com also found that among the workers that did move, more than half moved within the same metro area (Figure 9), and mostly for more space or better affordability.³⁵ Perhaps more significant is the likelihood of this trend to continue. Among those surveyed that expect to have remote work flexibility moving forward, 42 percent indicated they planned to move within the next year, versus only 26 percent for those expecting to work mostly or fully onsite post-pandemic.³⁶
Figure 9 / Frequency of Local Moves by Worker Type SOURCE: APARTMENT LIST REMOTE WORK SURVEY, APRIL 2021.
6%
12% 11%
4%
4% 6%
3%
3%
6%
0%
5%
10%
15%
20%
25%
On-site workers Remote workers "Untethered" workers
Yes, within the same city Yes, to a new city within the same metro Yes, to a new metro area
Many individuals moved to the suburbs or moved to smaller cities that were more affordable and offered a mix of high-tech jobs and old-line industries like manufacturing and finance.³⁷ A study by Stephan Whitaker from the Federal Reserve Bank of Cleveland found "… the estimated total of local moves from all urban neighborhoods in the country to suburbs in the same metro area were up 2.5 percent during the pandemic relative to the equivalent flows averaged over 2017, 2018, and 2019."³⁸ Metro areas with more than a 5 percent increase include New York, San Francisco, Philadelphia, Riverside, Phoenix, Atlanta, Tampa, and Orlando.³⁹ With more people living in the suburbs we will see more people driving - the 1999 study by Matthew E. Kahn, "The Environmental Impact of Suburbanization" found that suburban households drive 31 percent more, consume more than twice as much land as their central city counterparts, and tend to use 48.7 percent more fuel oil than urban cities.⁴0 And while people living in a dense urban area may
77© 2021 CCC Intelligent Solutions Inc. All Rights Reserved.
CRASH
COURSE 2021 | EVOLUTION
have foregone automobile ownership, once they relocate to the suburbs they would likely find they need a car, driving up the demand for new or used vehicles at a time when supply has already been constrained.
It remains to be seen how remote work and migration patterns will impact traffic congestion, miles driven, and vehicle accident counts in the U.S. post-pandemic. If we consider approximately 30-40 percent of jobs could be done fully remote, but workers chose to do so only one day per week, there would still potentially be an impact to daily travel, especially during historically congested rush hour periods. Overall miles driven and trips taken might not see a significant decline, but more telework would still lead to fewer rush-hour trips, less congestion in urban areas, more travel in suburban areas, and freer movement of remaining traffic.
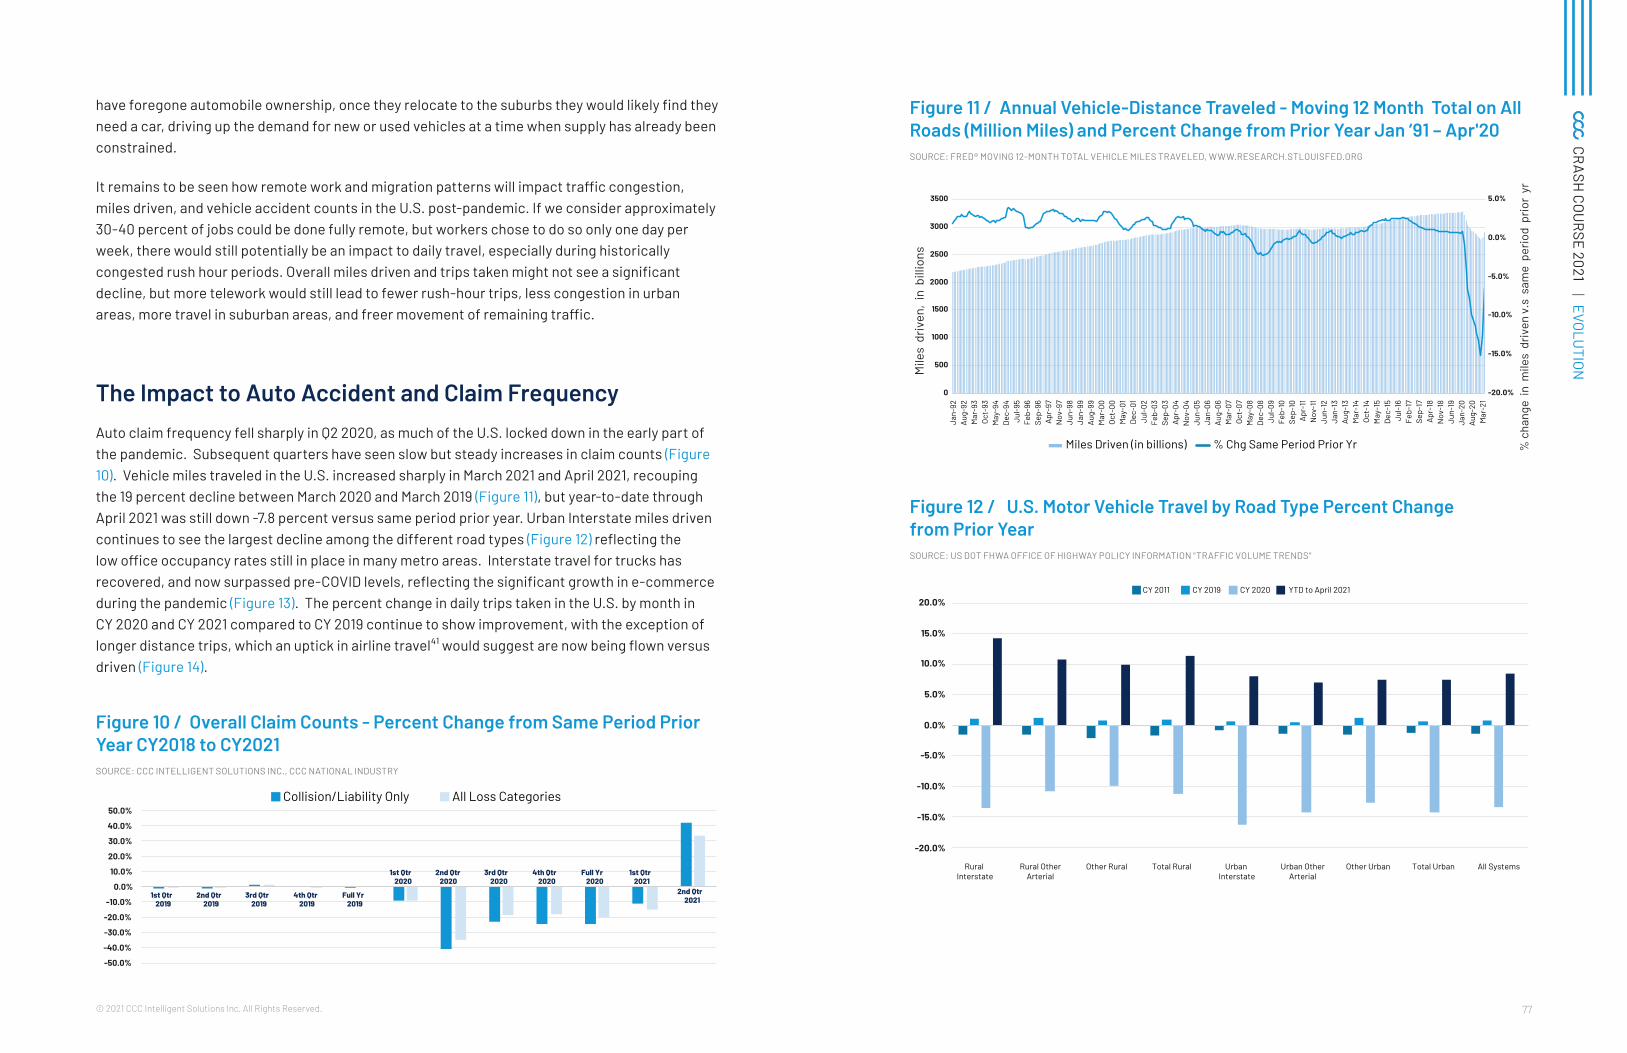
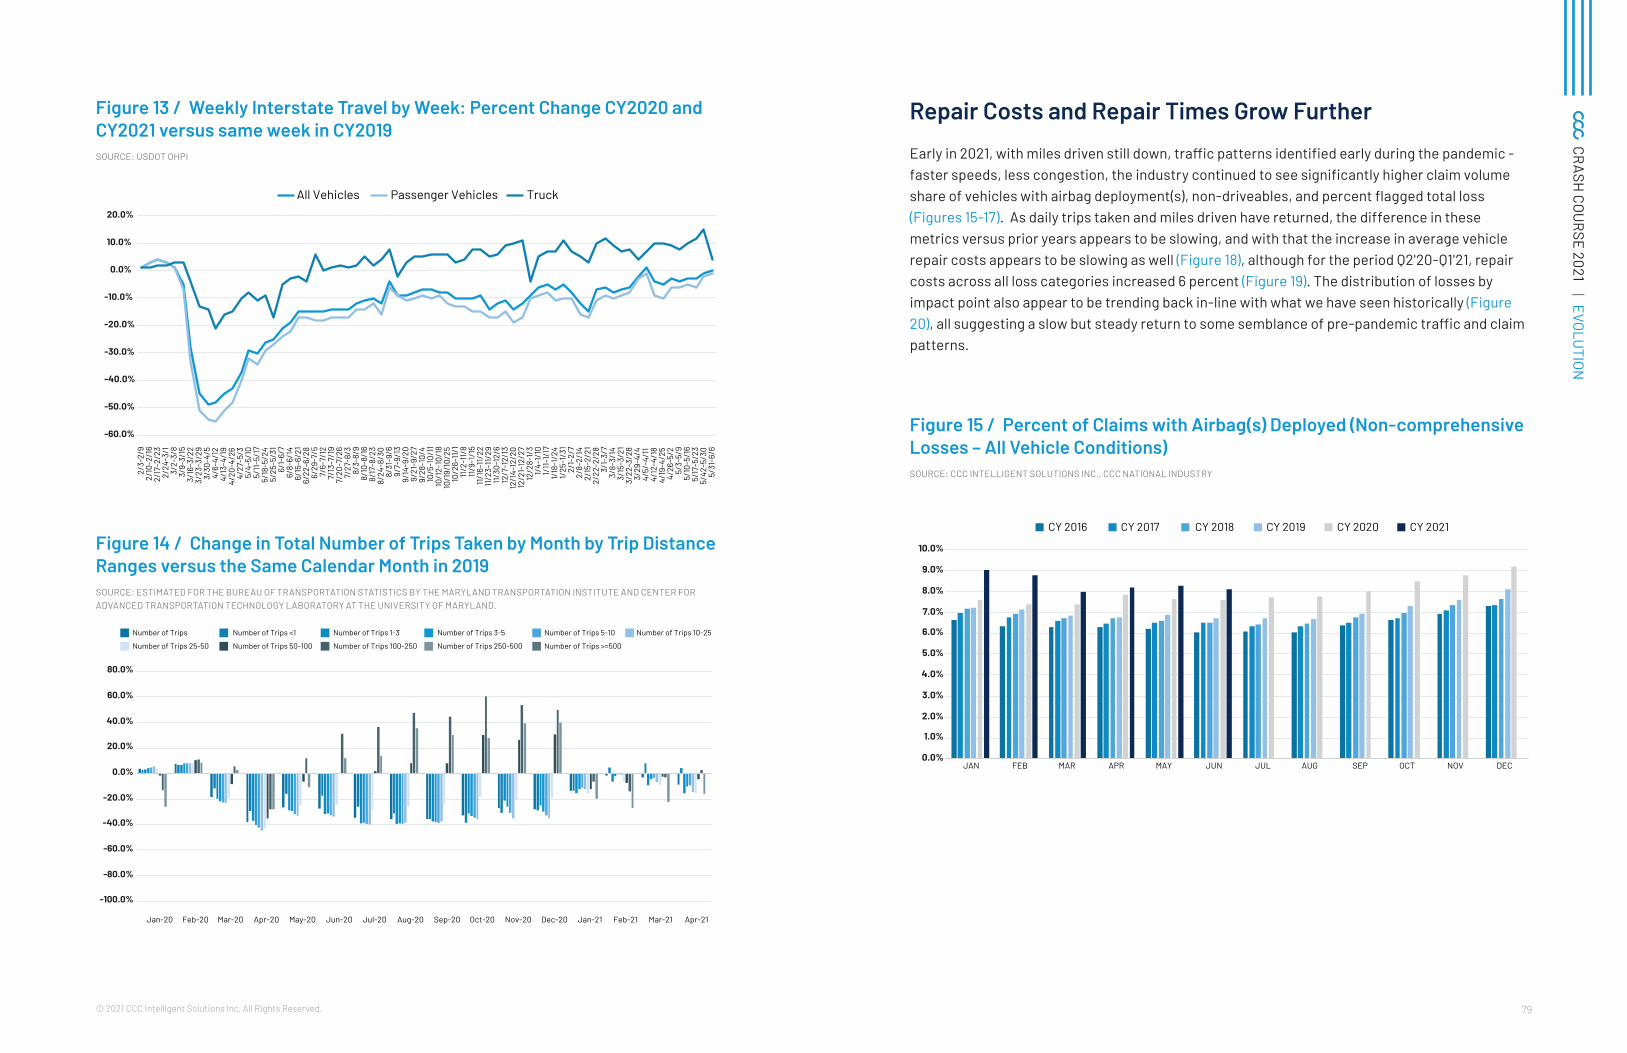
The Impact to Auto Accident and Claim Frequency Auto claim frequency fell sharply in Q2 2020, as much of the U.S. locked down in the early part of the pandemic. Subsequent quarters have seen slow but steady increases in claim counts (Figure 10). Vehicle miles traveled in the U.S. increased sharply in March 2021 and April 2021, recouping the 19 percent decline between March 2020 and March 2019 (Figure 11), but year-to-date through April 2021 was still down -7.8 percent versus same period prior year. Urban Interstate miles driven continues to see the largest decline among the different road types (Figure 12) reflecting the low office occupancy rates still in place in many metro areas. Interstate travel for trucks has recovered, and now surpassed pre-COVID levels, reflecting the significant growth in e-commerce during the pandemic (Figure 13). The percent change in daily trips taken in the U.S. by month in CY 2020 and CY 2021 compared to CY 2019 continue to show improvement, with the exception of longer distance trips, which an uptick in airline travel⁴1 would suggest are now being flown versus driven (Figure 14).
Figure 10 / Overall Claim Counts - Percent Change from Same Period Prior Year CY2018 to CY2021SOURCE: CCC INTELLIGENT SOLUTIONS INC., CCC NATIONAL INDUSTRY
-50.0%
-40.0%
-30.0%
-20.0%
-10.0%
0.0%
10.0%
20.0%
30.0%
40.0%
50.0%
1st Qtr2019
2nd Qtr2019
3rd Qtr2019
4th Qtr2019
Full Yr2019
1st Qtr2020
2nd Qtr 3rd Qtr2020
4th Qtr2020
Full Yr2020
1st Qtr2021
2nd Qtr2021
Collision/Liability Only All Loss Categories
2020
Figure 11 / Annual Vehicle-Distance Traveled - Moving 12 Month Total on All Roads (Million Miles) and Percent Change from Prior Year Jan ‘91 – Apr'20 SOURCE: FRED® MOVING 12-MONTH TOTAL VEHICLE MILES TRAVELED, WWW.RESEARCH.STLOUISFED.ORG
-20.0%
-15.0%
-10.0%
-5.0%
0.0%
5.0%
0
500
1000
1500
2000
2500
3000
3500
Jan-
92Au
g-92
Mar
-93
Oct-
93M
ay-9
4De
c-94
Jul-9
5Fe
b-96
Sep-
96Ap
r-97
Nov
-97
Jun-
98Ja
n-99
Aug-
99M
ar-0
0Oc
t-00
May
-01
Dec-
01Ju
l-02
Feb-
03Se
p-03
Apr-
04N
ov-0
4Ju
n-05
Jan-
06Au
g-06
Mar
-07
Oct-
07M
ay-0
8De
c-08
Jul-0
9Fe
b-10
Sep-
10Ap
r-11
Nov
-11
Jun-
12Ja
n-13
Aug-
13M
ar-1
4Oc
t-14
May
-15
Dec-
15Ju
l-16
Feb-
17Se
p-17
Apr-
18N
ov-1
8Ju
n-19
Jan-
20Au
g-20
Mar
-21
Miles Driven (in billions) % Chg Same Period Prior Yr % c
hang
e in
mile
s d
riven
v.s
sam
e p
erio
d p
rior
yr
Mile
s d
riven
, in
bill
ions
Figure 12 / U.S. Motor Vehicle Travel by Road Type Percent Change from Prior YearSOURCE: US DOT FHWA OFFICE OF HIGHWAY POLICY INFORMATION "TRAFFIC VOLUME TRENDS"
-20.0%
-15.0%
-10.0%
-5.0%
0.0%
5.0%
10.0%
15.0%
20.0%CY 2011 CY 2019 CY 2020 YTD to April 2021
Rural Interstate
Rural OtherArterial
Other Rural Total Rural Urban Interstate
Urban OtherArterial
Other Urban Total Urban All Systems
79© 2021 CCC Intelligent Solutions Inc. All Rights Reserved.
CRASH
COURSE 2021 | EVOLUTION
Figure 13 / Weekly Interstate Travel by Week: Percent Change CY2020 and CY2021 versus same week in CY2019 SOURCE: USDOT OHPI
-60.0%
-50.0%
-40.0%
-30.0%
-20.0%
-10.0%
0.0%
10.0%
20.0%
2/3-
2/9
2/10
-2/1
62/
17-2
/23
2/24
-3/1
3/2-
3/8
3/9-
3/15
3/16
-3/2
23/
23-3
/29
3/30
-4/5
4/6-
4/12
4/13
-4/1
94/
20-4
/26
4/27
-5/3
5/4-
5/10
5/11
-5/1
75/
18-5
/24
5/25
-5/3
16/
1-6/
76/
8-6/
146/
15-6
/21
6/22
-6/2
86/
29-7
/57/
6-7/
127/
13-7
/19
7/20
-7/2
67/
27-8
/38/
3-8/
98/
10-8
/16
8/17
-8/2
38/
24-8
/30
8/31
-9/6
9/7-
9/13
9/14
-9/2
09/
21-9
/27
9/28
-10/
410
/5-1
0/11
10/1
2-10
/18
10/1
9/10
/25
10/2
6-11
/111
/2-1
1/8
11/9
-1/1
511
/16-
11/2
211
/23-
11/2
911
/30-
12/6
12/7
-12/
1312
/14-
12/2
012
/21-
12/2
712
/28-
1/3
1/4-
1/10
1/11
-1/1
71/
18-1
/24
1/25
-1/3
12/
1-2/
72/
8-2/
142/
15-2
/21
2/22
-2/2
83/
1-3/
73/
8-3/
143/
15-3
/21
3/22
-3/2
83/
29-4
/44/
5/-4
/11
4/12
-4/1
84/
19-4
/25
4/26
-5/2
5/3-
5/9
5/10
-5/1
65/
17-5
/23
5/42
-5/3
05/
31-6
/6
All Vehicles Passenger Vehicles Truck
Figure 14 / Change in Total Number of Trips Taken by Month by Trip Distance Ranges versus the Same Calendar Month in 2019 SOURCE: ESTIMATED FOR THE BUREAU OF TRANSPORTATION STATISTICS BY THE MARYLAND TRANSPORTATION INSTITUTE AND CENTER FOR ADVANCED TRANSPORTATION TECHNOLOGY LABORATORY AT THE UNIVERSITY OF MARYLAND.
-100.0%
-80.0%
-60.0%
-40.0%
-20.0%
0.0%
20.0%
40.0%
60.0%
80.0%
Jan-20 Feb-20 Mar-20 Apr-20 May-20 Jun-20 Jul-20 Aug-20 Sep-20 Oct-20 Nov-20 Dec-20 Jan-21 Feb-21 Mar-21 Apr-21
Number of Trips Number of Trips <1 Number of Trips 1-3 Number of Trips 3-5 Number of Trips 5-10 Number of Trips 10-25
Number of Trips 25-50 Number of Trips 50-100 Number of Trips 100-250 Number of Trips 250-500 Number of Trips >=500
Repair Costs and Repair Times Grow Further
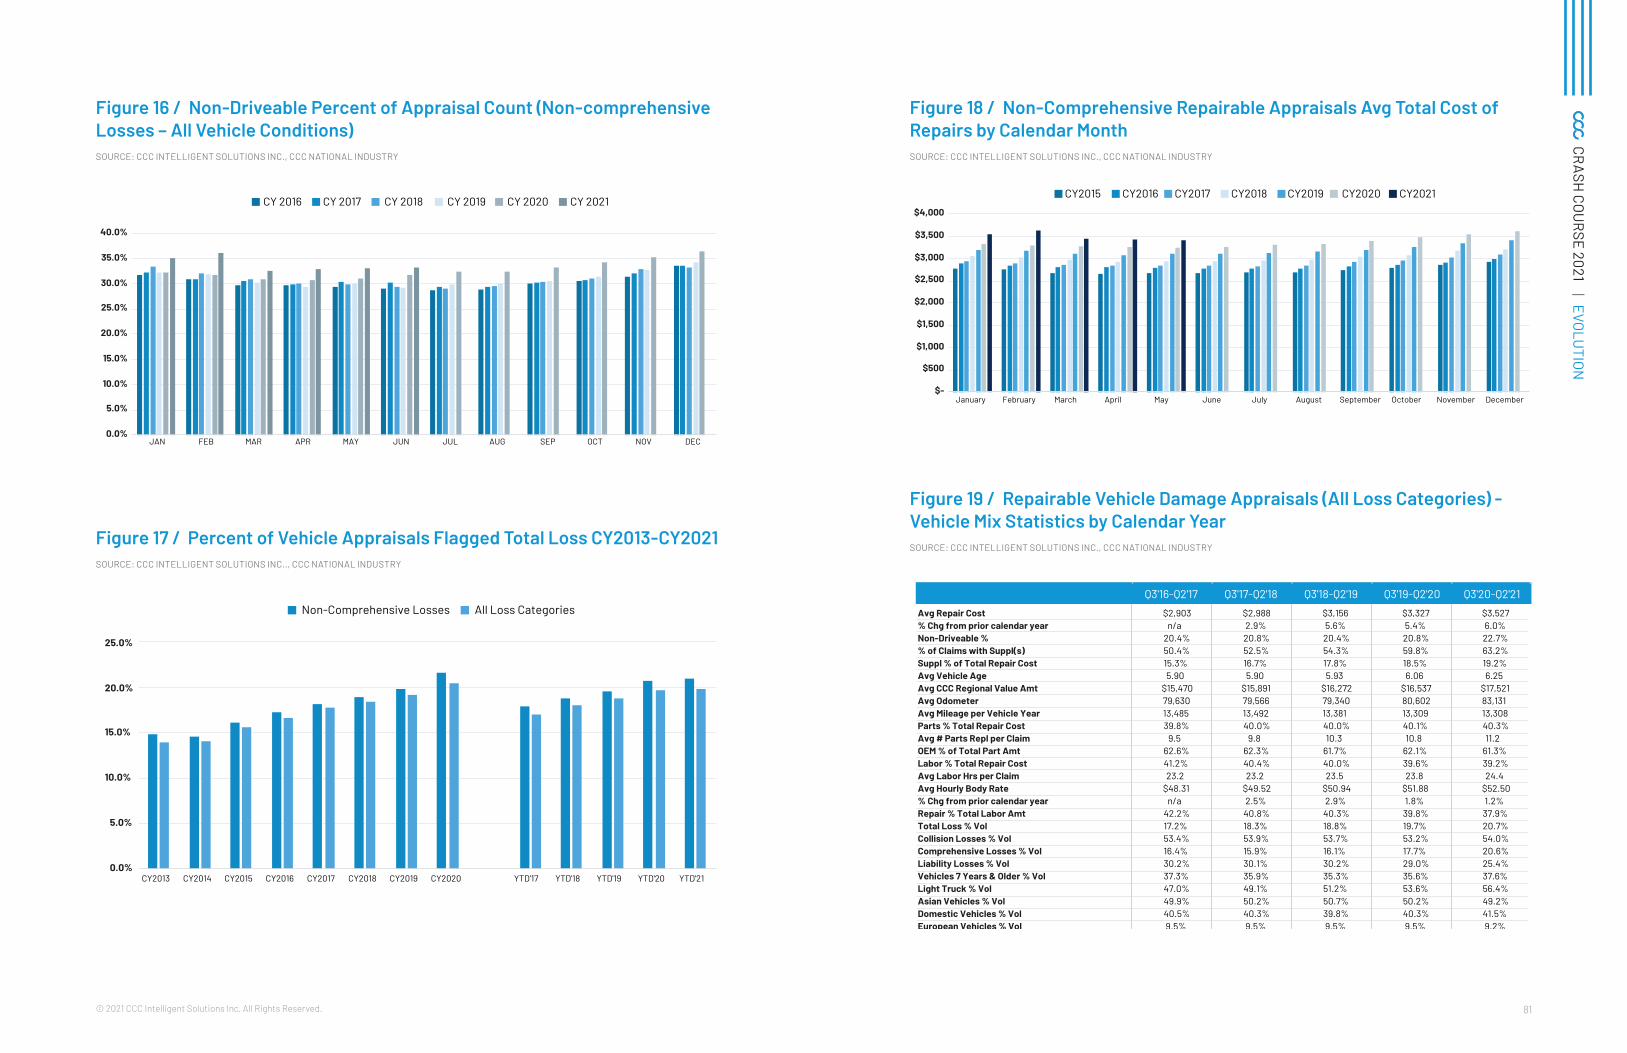
Early in 2021, with miles driven still down, traffic patterns identified early during the pandemic - faster speeds, less congestion, the industry continued to see significantly higher claim volume share of vehicles with airbag deployment(s), non-driveables, and percent flagged total loss (Figures 15-17). As daily trips taken and miles driven have returned, the difference in these metrics versus prior years appears to be slowing, and with that the increase in average vehicle repair costs appears to be slowing as well (Figure 18), although for the period Q2'20-Q1'21, repair costs across all loss categories increased 6 percent (Figure 19). The distribution of losses by impact point also appear to be trending back in-line with what we have seen historically (Figure 20), all suggesting a slow but steady return to some semblance of pre-pandemic traffic and claim patterns.
Figure 15 / Percent of Claims with Airbag(s) Deployed (Non-comprehensive Losses – All Vehicle Conditions) SOURCE: CCC INTELLIGENT SOLUTIONS INC., CCC NATIONAL INDUSTRY
0.0%
1.0%
2.0%
3.0%
4.0%
5.0%
6.0%
7.0%
8.0%
9.0%
10.0%
JAN FEB MAR APR MAY JUN JUL AUG SEP OCT NOV DEC
CY 2016 CY 2017 CY 2018 CY 2019 CY 2020 CY 2021
81© 2021 CCC Intelligent Solutions Inc. All Rights Reserved.
CRASH
COURSE 2021 | EVOLUTION
Figure 16 / Non-Driveable Percent of Appraisal Count (Non-comprehensive Losses – All Vehicle Conditions) SOURCE: CCC INTELLIGENT SOLUTIONS INC., CCC NATIONAL INDUSTRY
0.0%
5.0%
10.0%
15.0%
20.0%
25.0%
30.0%
35.0%
40.0%
JAN FEB MAR APR MAY JUN JUL AUG SEP OCT NOV DEC
CY 2016 CY 2017 CY 2018 CY 2019 CY 2020 CY 2021
Figure 17 / Percent of Vehicle Appraisals Flagged Total Loss CY2013-CY2021 SOURCE: CCC INTELLIGENT SOLUTIONS INC.., CCC NATIONAL INDUSTRY
0.0%
5.0%
10.0%
15.0%
20.0%
25.0%
CY2013 CY2014 CY2015 CY2016 CY2017 CY2018 CY2019 CY2020 YTD'17 YTD'18 YTD'19 YTD'20 YTD'21
Non-Comprehensive Losses All Loss Categories
Figure 18 / Non-Comprehensive Repairable Appraisals Avg Total Cost of Repairs by Calendar Month SOURCE: CCC INTELLIGENT SOLUTIONS INC., CCC NATIONAL INDUSTRY
$-
$500
$1,000
$1,500
$2,000
$2,500
$3,000
$3,500
$4,000
January February March April May June July August September October November December
CY2015 CY2016 CY2017 CY2018 CY2019 CY2020 CY2021
Figure 19 / Repairable Vehicle Damage Appraisals (All Loss Categories) - Vehicle Mix Statistics by Calendar Year SOURCE: CCC INTELLIGENT SOLUTIONS INC., CCC NATIONAL INDUSTRY
Avg Repair Cost $2,903 $2,988 $3,156 $3,327 $3,527% Chg from prior calendar year n/a 2.9% 5.6% 5.4% 6.0%Non-Driveable % 20.4% 20.8% 20.4% 20.8% 22.7%% of Claims with Suppl(s) 50.4% 52.5% 54.3% 59.8% 63.2%Suppl % of Total Repair Cost 15.3% 16.7% 17.8% 18.5% 19.2%Avg Vehicle Age 5.90 5.90 5.93 6.06 6.25Avg CCC Regional Value Amt $15,470 $15,891 $16,272 $16,537 $17,521Avg Odometer 79,630 79,566 79,340 80,602 83,131Avg Mileage per Vehicle Year 13,485 13,492 13,381 13,309 13,308Parts % Total Repair Cost 39.8% 40.0% 40.0% 40.1% 40.3%Avg # Parts Repl per Claim 9.5 9.8 10.3 10.8 11.2OEM % of Total Part Amt 62.6% 62.3% 61.7% 62.1% 61.3%Labor % Total Repair Cost 41.2% 40.4% 40.0% 39.6% 39.2%Avg Labor Hrs per Claim 23.2 23.2 23.5 23.8 24.4Avg Hourly Body Rate $48.31 $49.52 $50.94 $51.88 $52.50% Chg from prior calendar year n/a 2.5% 2.9% 1.8% 1.2%Repair % Total Labor Amt 42.2% 40.8% 40.3% 39.8% 37.9%Total Loss % Vol 17.2% 18.3% 18.8% 19.7% 20.7%Collision Losses % Vol 53.4% 53.9% 53.7% 53.2% 54.0%Comprehensive Losses % Vol 16.4% 15.9% 16.1% 17.7% 20.6%Liability Losses % Vol 30.2% 30.1% 30.2% 29.0% 25.4%Vehicles 7 Years & Older % Vol 37.3% 35.9% 35.3% 35.6% 37.6%Light Truck % Vol 47.0% 49.1% 51.2% 53.6% 56.4%Asian Vehicles % Vol 49.9% 50.2% 50.7% 50.2% 49.2%Domestic Vehicles % Vol 40.5% 40.3% 39.8% 40.3% 41.5%European Vehicles % Vol 9.5% 9.5% 9.5% 9.5% 9.2%
Q3'16-Q2'17 Q3'17-Q2'18 Q3'18-Q2'19 Q3'19-Q2'20 Q3'20-Q2'21
83© 2021 CCC Intelligent Solutions Inc. All Rights Reserved.
CRASH
COURSE 2021 | EVOLUTION
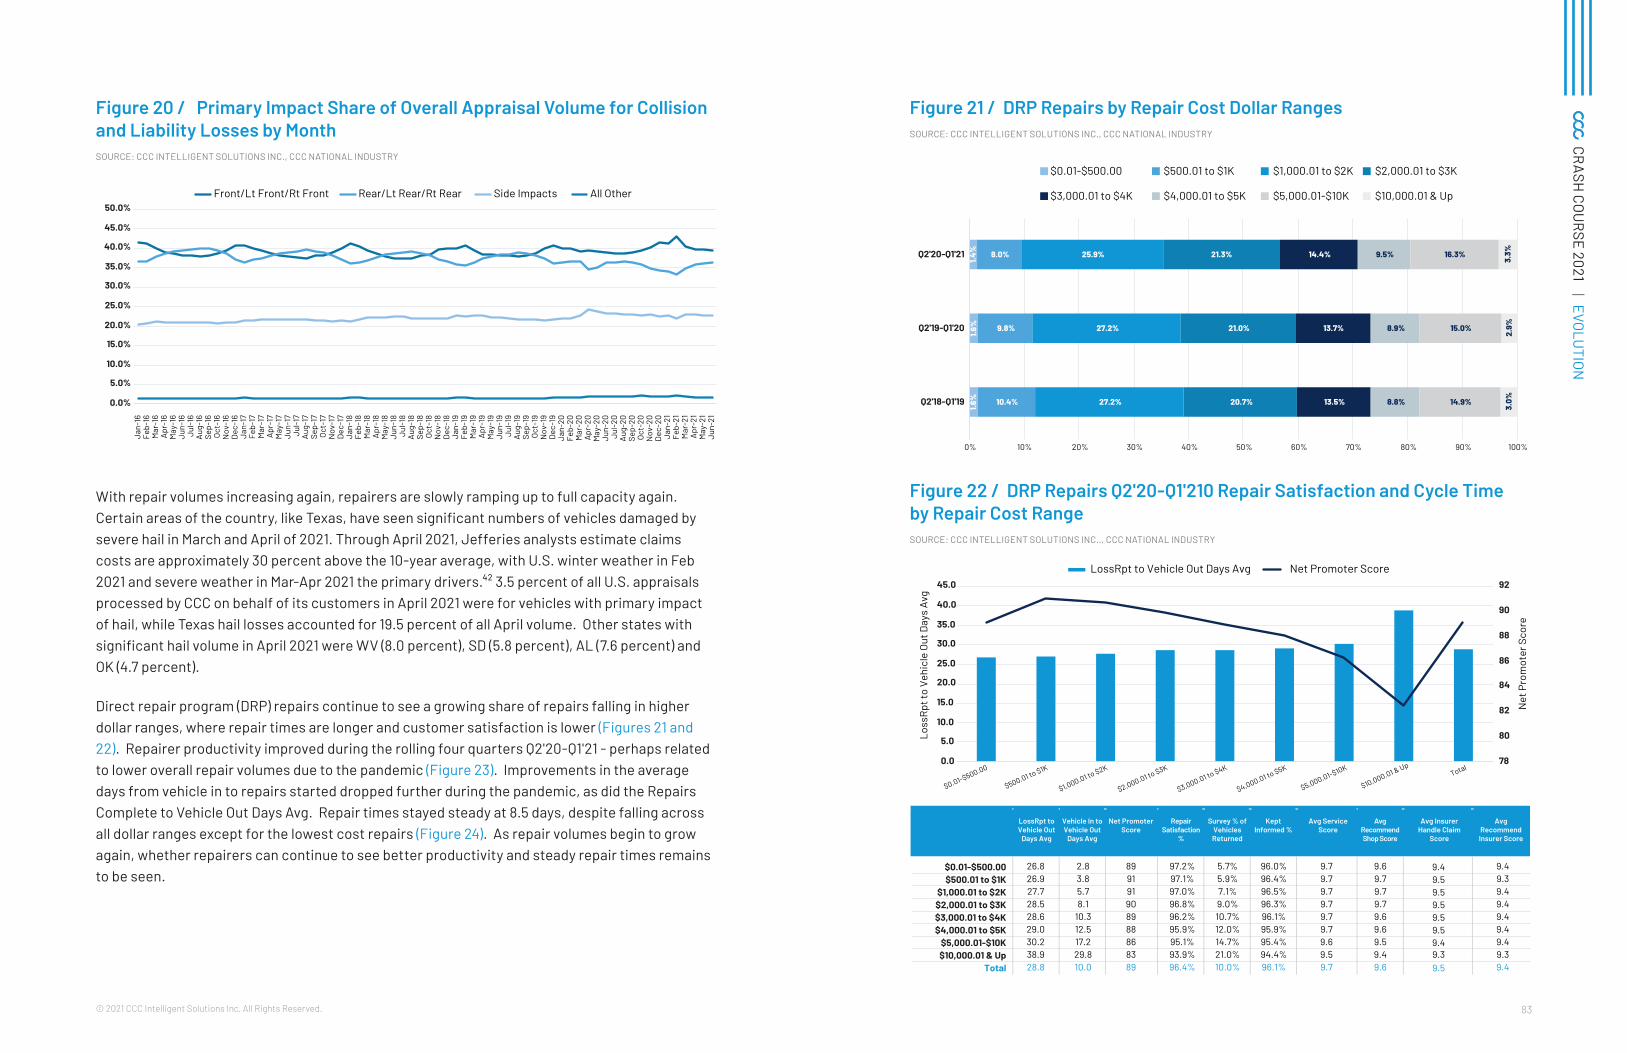
Figure 20 / Primary Impact Share of Overall Appraisal Volume for Collision and Liability Losses by Month SOURCE: CCC INTELLIGENT SOLUTIONS INC., CCC NATIONAL INDUSTRY
0.0%
5.0%
10.0%
15.0%
20.0%
25.0%
30.0%
35.0%
40.0%
45.0%
50.0%
Jan-
16Fe
b-16
Mar
-16
Apr-
16M
ay-1
6Ju
n-16
Jul-1
6Au
g-16
Sep-
16Oc
t-16
Nov
-16
Dec-
16Ja
n-17
Feb-
17M
ar-1
7Ap
r-17
May
-17
Jun-
17Ju
l-17
Aug-
17Se
p-17
Oct-
17N
ov-1
7De
c-17
Jan-
18Fe
b-18
Mar
-18
Apr-
18M
ay-1
8Ju
n-18
Jul-1
8Au
g-18
Sep-
18Oc
t-18
Nov
-18
Dec-
18Ja
n-19
Feb-
19M
ar-1
9Ap
r-19
May
-19
Jun-
19Ju
l-19
Aug-
19Se
p-19
Oct-
19N
ov-1
9De
c-19
Jan-
20Fe
b-20
Mar
-20
Apr-
20M
ay-2
0Ju
n-20
Jul-2
0Au
g-20
Sep-
20Oc
t-20
Nov
-20
Dec-
20Ja
n-21
Feb-
21M
ar-2
1Ap
r-21
May
-21
Jun-
21
Front/Lt Front/Rt Front Rear/Lt Rear/Rt Rear Side Impacts All Other
With repair volumes increasing again, repairers are slowly ramping up to full capacity again. Certain areas of the country, like Texas, have seen significant numbers of vehicles damaged by severe hail in March and April of 2021. Through April 2021, Jefferies analysts estimate claims costs are approximately 30 percent above the 10-year average, with U.S. winter weather in Feb 2021 and severe weather in Mar-Apr 2021 the primary drivers.⁴² 3.5 percent of all U.S. appraisals processed by CCC on behalf of its customers in April 2021 were for vehicles with primary impact of hail, while Texas hail losses accounted for 19.5 percent of all April volume. Other states with significant hail volume in April 2021 were WV (8.0 percent), SD (5.8 percent), AL (7.6 percent) and OK (4.7 percent).
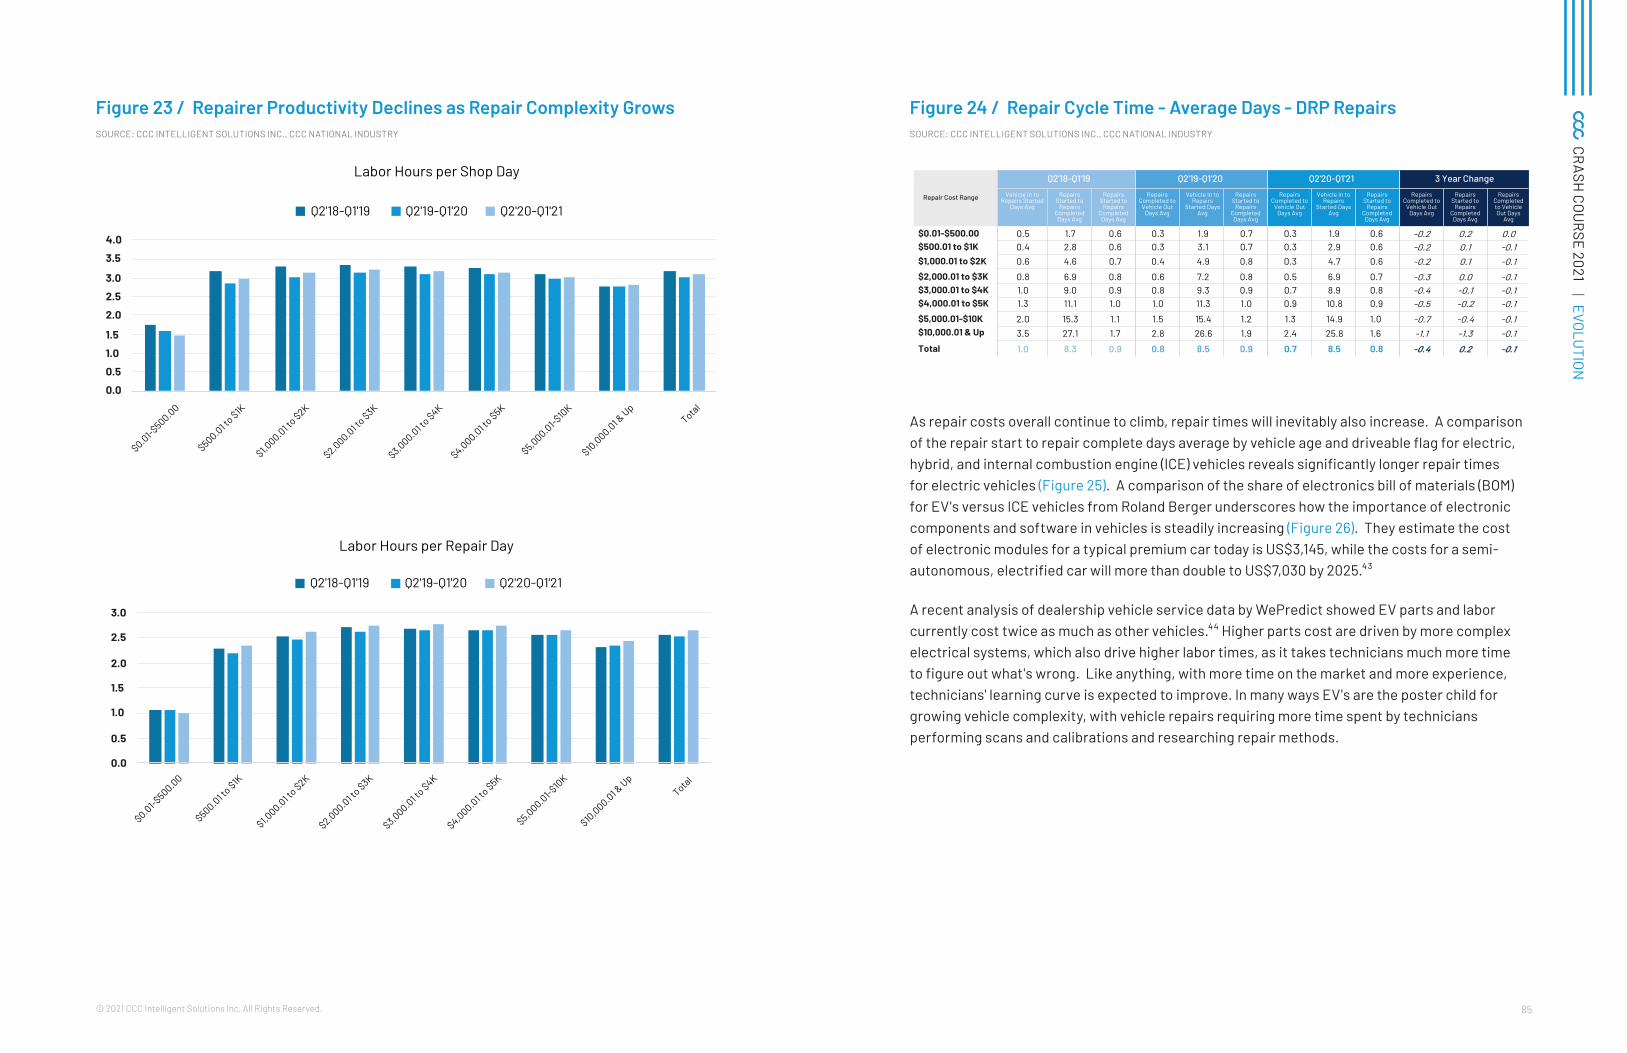
Direct repair program (DRP) repairs continue to see a growing share of repairs falling in higher dollar ranges, where repair times are longer and customer satisfaction is lower (Figures 21 and 22). Repairer productivity improved during the rolling four quarters Q2'20-Q1'21 - perhaps related to lower overall repair volumes due to the pandemic (Figure 23). Improvements in the average days from vehicle in to repairs started dropped further during the pandemic, as did the Repairs Complete to Vehicle Out Days Avg. Repair times stayed steady at 8.5 days, despite falling across all dollar ranges except for the lowest cost repairs (Figure 24). As repair volumes begin to grow again, whether repairers can continue to see better productivity and steady repair times remains to be seen.
Figure 21 / DRP Repairs by Repair Cost Dollar Ranges SOURCE: CCC INTELLIGENT SOLUTIONS INC., CCC NATIONAL INDUSTRY
1.6%
1.6%
1.4%
10.4%
9.8%
8.0%
27.2%
27.2%
25.9%
20.7%
21.0%
21.3%
13.5%
13.7%
14.4%
8.8%
8.9%
9.5%
14.9%
15.0%
16.3%
3.0%
2.9%
3.3%
0% 10% 20% 30% 40% 50% 60% 70% 80% 90% 100%
Q2'18-Q1'19
Q2'19-Q1'20
Q2'20-Q1'21
$0.01-$500.00 $500.01 to $1K $1,000.01 to $2K $2,000.01 to $3K
$3,000.01 to $4K $4,000.01 to $5K $5,000.01-$10K $10,000.01 & Up
Figure 22 / DRP Repairs Q2'20-Q1'210 Repair Satisfaction and Cycle Time by Repair Cost Range SOURCE: CCC INTELLIGENT SOLUTIONS INC.., CCC NATIONAL INDUSTRY
78
80
82
84
86
88
90
92
0.0
5.0
10.0
15.0
20.0
25.0
30.0
35.0
40.0
45.0
$0.01-$500.00
$500.01 to $1K
$1,000.01 to $2K
$2,000.01 to $3K
$3,000.01 to $4K
$4,000.01 to $5K
$5,000.01-$10K
$10,000.01 & UpTotal
Net
Pro
mot
er S
core
Loss
Rpt t
o Ve
hicl
e Ou
t Day
s Av
g
LossRpt to Vehicle Out Days Avg Net Promoter Score
$0.01-$500.00 26.8 2.8 89 97.2% 5.7% 96.0% 9.7 9.6 9.4 9.4$500.01 to $1K 26.9 3.8 91 97.1% 5.9% 96.4% 9.7 9.7 9.5 9.3
$1,000.01 to $2K 27.7 5.7 91 97.0% 7.1% 96.5% 9.7 9.7 9.5 9.4$2,000.01 to $3K 28.5 8.1 90 96.8% 9.0% 96.3% 9.7 9.7 9.5 9.4$3,000.01 to $4K 28.6 10.3 89 96.2% 10.7% 96.1% 9.7 9.6 9.5 9.4$4,000.01 to $5K 29.0 12.5 88 95.9% 12.0% 95.9% 9.7 9.6 9.5 9.4
$5,000.01-$10K 30.2 17.2 86 95.1% 14.7% 95.4% 9.6 9.5 9.4 9.4$10,000.01 & Up 38.9 29.8 83 93.9% 21.0% 94.4% 9.5 9.4 9.3 9.3
Total 28.8 10.0 89 96.4% 10.0% 96.1% 9.7 9.6 9.5 9.4
LossRpt to Vehicle Out
Days Avg
Vehicle In to Vehicle Out
Days Avg
Net Promoter Score
Repair Satisfaction
%
Survey % of Vehicles Returned
Kept Informed %
Avg Service Score
AvgRecommend Shop Score
Avg Insurer Handle Claim
Score
Avg Recommend Insurer Score
85© 2021 CCC Intelligent Solutions Inc. All Rights Reserved.
CRASH
COURSE 2021 | EVOLUTION
Figure 23 / Repairer Productivity Declines as Repair Complexity Grows SOURCE: CCC INTELLIGENT SOLUTIONS INC., CCC NATIONAL INDUSTRY
0.0
0.5
1.0
1.5
2.0
2.5
3.0
3.5
4.0
$0.01-$500.00
$500.01 to $1K
$1,000.01 t
o $2K
$2,000.01 to $3K
$3,000.01 to $4K
$4,000.01 to $5K
$5,000.01-$10
K
$10,000.01 &
UpTotal
Labor Hours per Shop Day
Q2'18-Q1'19 Q2'19-Q1'20 Q2'20-Q1'21
0.0
0.5
1.0
1.5
2.0
2.5
3.0
$0.01-$500.00
$500.01 to $1K
$1,000.01 t
o $2K
$2,000.01 to $3K
$3,000.01 to $4K
$4,000.01 to $5K
$5,000.01-$10
K
$10,000.01 &
UpTotal
Labor Hours per Repair Day
Q2'18-Q1'19 Q2'19-Q1'20 Q2'20-Q1'21
Figure 24 / Repair Cycle Time - Average Days - DRP Repairs SOURCE: CCC INTELLIGENT SOLUTIONS INC., CCC NATIONAL INDUSTRY
$0.01-$500.00 0.5 1.7 0.6 0.3 1.9 0.7 0.3 1.9 0.6 -0.2 0.2 0.0$500.01 to $1K 0.4 2.8 0.6 0.3 3.1 0.7 0.3 2.9 0.6 -0.2 0.1 -0.1$1,000.01 to $2K 0.6 4.6 0.7 0.4 4.9 0.8 0.3 4.7 0.6 -0.2 0.1 -0.1$2,000.01 to $3K 0.8 6.9 0.8 0.6 7.2 0.8 0.5 6.9 0.7 -0.3 0.0 -0.1$3,000.01 to $4K 1.0 9.0 0.9 0.8 9.3 0.9 0.7 8.9 0.8 -0.4 -0.1 -0.1$4,000.01 to $5K 1.3 11.1 1.0 1.0 11.3 1.0 0.9 10.8 0.9 -0.5 -0.2 -0.1$5,000.01-$10K 2.0 15.3 1.1 1.5 15.4 1.2 1.3 14.9 1.0 -0.7 -0.4 -0.1$10,000.01 & Up 3.5 27.1 1.7 2.8 26.6 1.9 2.4 25.8 1.6 -1.1 -1.3 -0.1
Total 1.0 8.3 0.9 0.8 8.5 0.9 0.7 8.5 0.8 -0.4 0.2 -0.1
Vehicle In to Repairs Started
Days Avg
Repairs Started to
Repairs Completed
Days Avg
Repairs Started to
Repairs Completed
Days Avg
Repairs Completed to
Vehicle Out Days Avg
Vehicle In to Repairs
Started Days Avg
Repairs Started to
Repairs Completed
Days Avg
Repairs Completed to
Vehicle Out Days Avg
Vehicle In to Repairs
Started Days Avg
Repairs Started to
Repairs Completed
Days Avg
Repairs Completed to
Vehicle Out Days Avg
RepairsStarted to
Repairs Completed
Days Avg
Repairs Completed to Vehicle Out Days
Avg
Repair Cost Range
Q2'18-Q1'19 Q2'19-Q1'20 Q2'20-Q1'21 3 Year Change
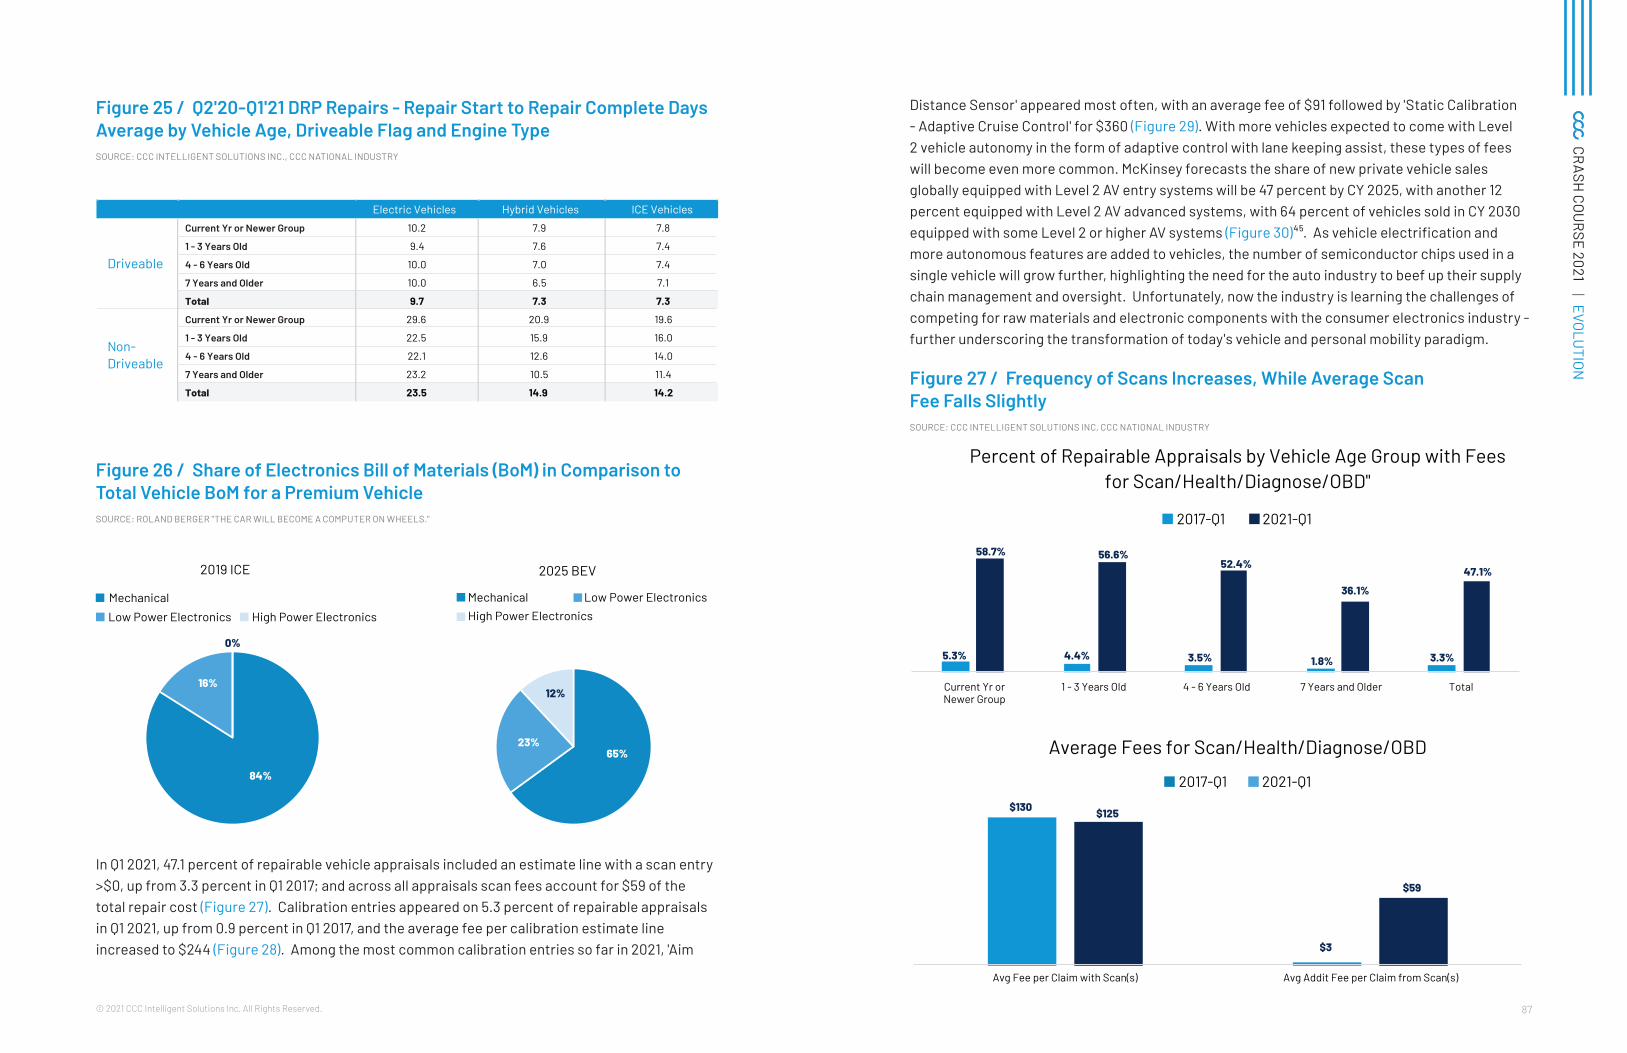
As repair costs overall continue to climb, repair times will inevitably also increase. A comparison of the repair start to repair complete days average by vehicle age and driveable flag for electric, hybrid, and internal combustion engine (ICE) vehicles reveals significantly longer repair times for electric vehicles (Figure 25). A comparison of the share of electronics bill of materials (BOM) for EV's versus ICE vehicles from Roland Berger underscores how the importance of electronic components and software in vehicles is steadily increasing (Figure 26). They estimate the cost of electronic modules for a typical premium car today is US$3,145, while the costs for a semi-autonomous, electrified car will more than double to US$7,030 by 2025.⁴³
A recent analysis of dealership vehicle service data by WePredict showed EV parts and labor currently cost twice as much as other vehicles.⁴⁴ Higher parts cost are driven by more complex electrical systems, which also drive higher labor times, as it takes technicians much more time to figure out what's wrong. Like anything, with more time on the market and more experience, technicians' learning curve is expected to improve. In many ways EV's are the poster child for growing vehicle complexity, with vehicle repairs requiring more time spent by technicians performing scans and calibrations and researching repair methods.
87© 2021 CCC Intelligent Solutions Inc. All Rights Reserved.
CRASH
COURSE 2021 | EVOLUTION
Figure 25 / Q2'20-Q1'21 DRP Repairs - Repair Start to Repair Complete Days Average by Vehicle Age, Driveable Flag and Engine Type SOURCE: CCC INTELLIGENT SOLUTIONS INC., CCC NATIONAL INDUSTRY
Electric Vehicles Hybrid Vehicles ICE Vehicles
Current Yr or Newer Group 10.2 7.9 7.8
1 - 3 Years Old 9.4 7.6 7.4
4 - 6 Years Old 10.0 7.0 7.4
7 Years and Older 10.0 6.5 7.1
Total 9.7 7.3 7.3
Current Yr or Newer Group 29.6 20.9 19.6
1 - 3 Years Old 22.5 15.9 16.0
4 - 6 Years Old 22.1 12.6 14.0
7 Years and Older 23.2 10.5 11.4
Total 23.5 14.9 14.2
Driveable
Non-Driveable
Figure 26 / Share of Electronics Bill of Materials (BoM) in Comparison to Total Vehicle BoM for a Premium Vehicle SOURCE: ROLAND BERGER "THE CAR WILL BECOME A COMPUTER ON WHEELS."
84%
16%
0%
2019 ICE
MechanicalLow Power Electronics High Power Electronics
65%23%
12%
2025 BEV
Mechanical Low Power ElectronicsHigh Power Electronics
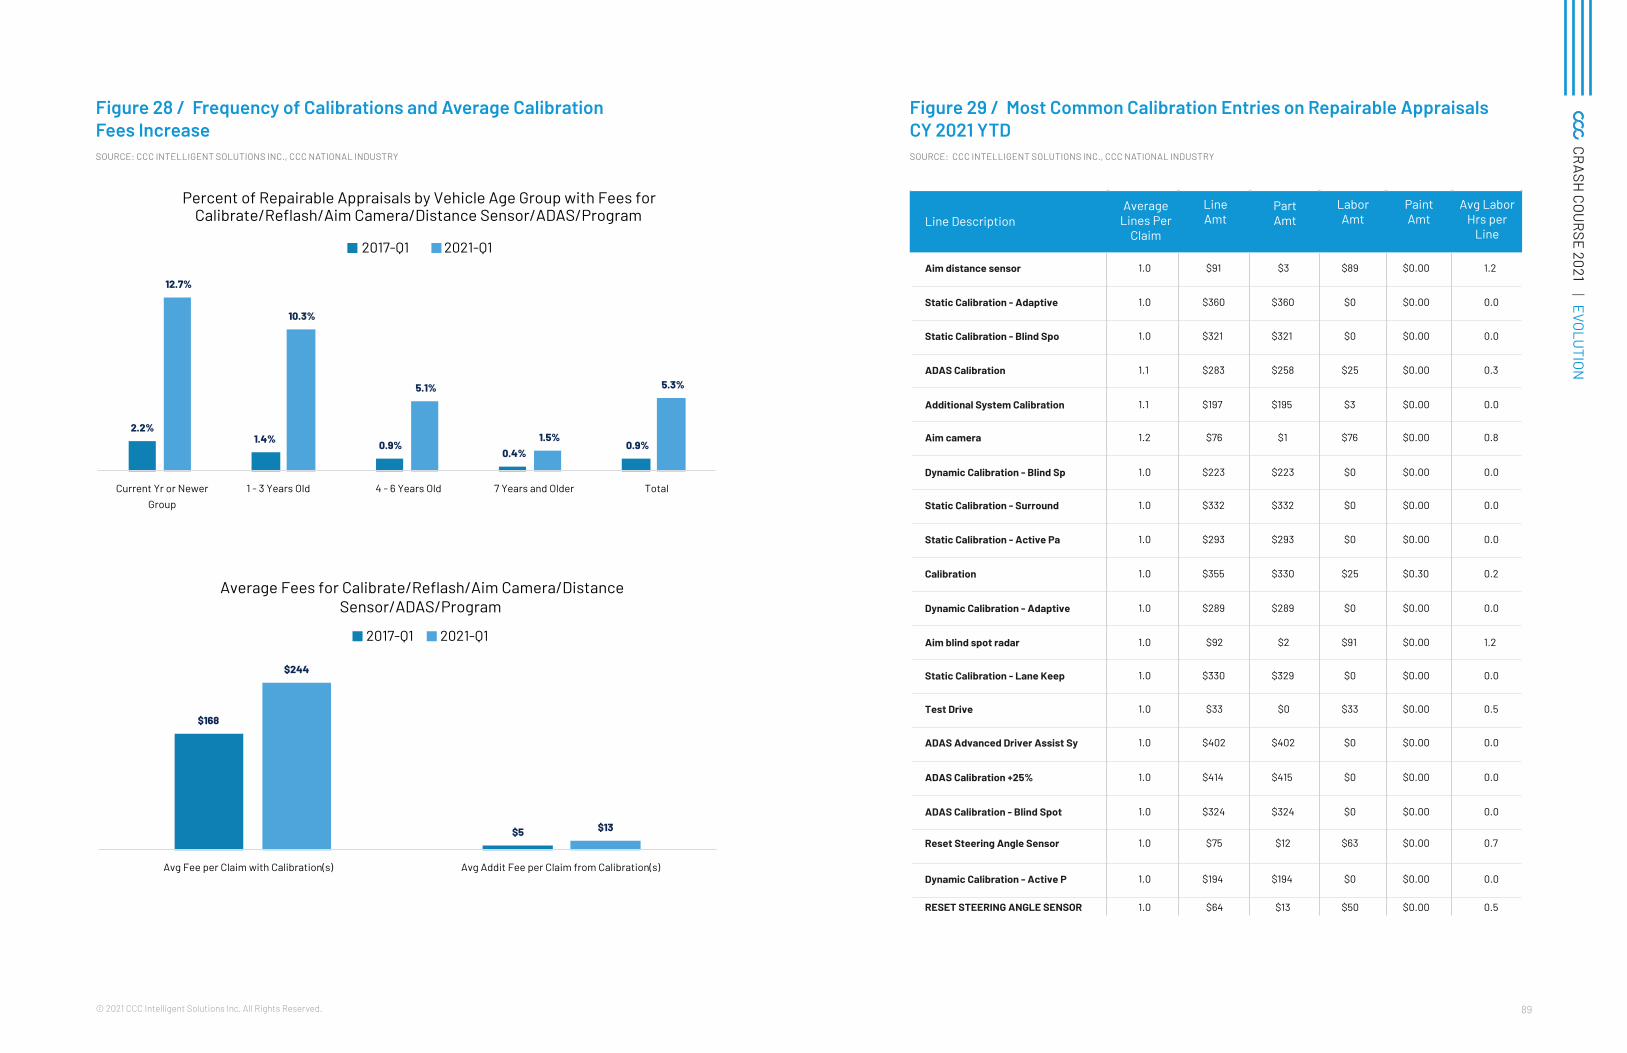
In Q1 2021, 47.1 percent of repairable vehicle appraisals included an estimate line with a scan entry >$0, up from 3.3 percent in Q1 2017; and across all appraisals scan fees account for $59 of the total repair cost (Figure 27). Calibration entries appeared on 5.3 percent of repairable appraisals in Q1 2021, up from 0.9 percent in Q1 2017, and the average fee per calibration estimate line increased to $244 (Figure 28). Among the most common calibration entries so far in 2021, 'Aim
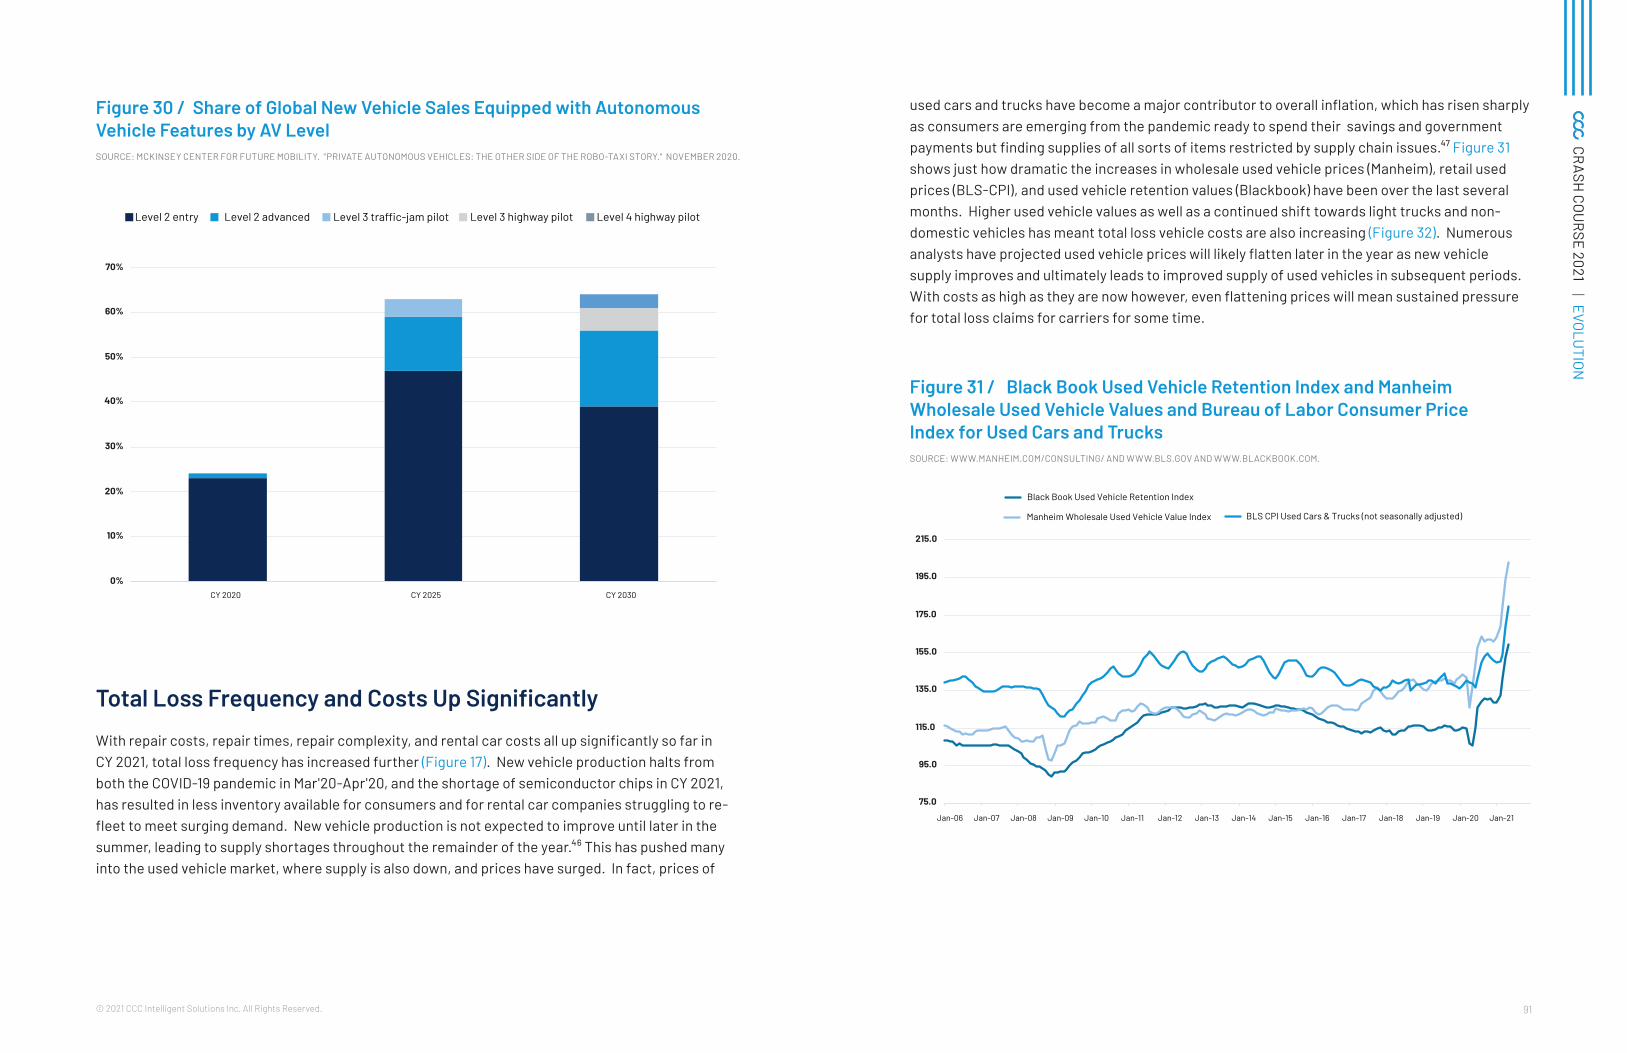
Distance Sensor' appeared most often, with an average fee of $91 followed by 'Static Calibration - Adaptive Cruise Control' for $360 (Figure 29). With more vehicles expected to come with Level 2 vehicle autonomy in the form of adaptive control with lane keeping assist, these types of fees will become even more common. McKinsey forecasts the share of new private vehicle sales globally equipped with Level 2 AV entry systems will be 47 percent by CY 2025, with another 12 percent equipped with Level 2 AV advanced systems, with 64 percent of vehicles sold in CY 2030 equipped with some Level 2 or higher AV systems (Figure 30)⁴⁵. As vehicle electrification and more autonomous features are added to vehicles, the number of semiconductor chips used in a single vehicle will grow further, highlighting the need for the auto industry to beef up their supply chain management and oversight. Unfortunately, now the industry is learning the challenges of competing for raw materials and electronic components with the consumer electronics industry - further underscoring the transformation of today's vehicle and personal mobility paradigm.
Figure 27 / Frequency of Scans Increases, While Average Scan Fee Falls Slightly SOURCE: CCC INTELLIGENT SOLUTIONS INC, CCC NATIONAL INDUSTRY
5.3% 4.4% 3.5% 1.8% 3.3%
58.7% 56.6%52.4%
36.1%
47.1%
Current Yr orNewer Group
1 - 3 Years Old 4 - 6 Years Old 7 Years and Older Total
Percent of Repairable Appraisals by Vehicle Age Group with Fees for Scan/Health/Diagnose/OBD"
2017-Q1 2021-Q1
$130
$3
$125
$59
Avg Fee per Claim with Scan(s) Avg Addit Fee per Claim from Scan(s)
Average Fees for Scan/Health/Diagnose/OBD
2017-Q1 2021-Q1
89© 2021 CCC Intelligent Solutions Inc. All Rights Reserved.
CRASH
COURSE 2021 | EVOLUTION
Figure 28 / Frequency of Calibrations and Average Calibration Fees Increase SOURCE: CCC INTELLIGENT SOLUTIONS INC., CCC NATIONAL INDUSTRY
2.2%1.4% 0.9%
0.4%0.9%
12.7%
10.3%
5.1%
1.5%
5.3%
Current Yr or NewerGroup
1 - 3 Years Old 4 - 6 Years Old 7 Years and Older Total
Percent of Repairable Appraisals by Vehicle Age Group with Fees for Calibrate/Reflash/Aim Camera/Distance Sensor/ADAS/Program
2017-Q1 2021-Q1
$168
$5
$244
$13
Avg Fee per Claim with Calibration(s) Avg Addit Fee per Claim from Calibration(s)
Average Fees for Calibrate/Reflash/Aim Camera/Distance Sensor/ADAS/Program
2017-Q1 2021-Q1
Figure 29 / Most Common Calibration Entries on Repairable Appraisals CY 2021 YTD SOURCE: CCC INTELLIGENT SOLUTIONS INC., CCC NATIONAL INDUSTRY
Aim distance sensor 1.0 $91 $3 $89 $0.00 1.2
Static Calibration - Adaptive 1.0 $360 $360 $0 $0.00 0.0
Static Calibration - Blind Spo 1.0 $321 $321 $0 $0.00 0.0
ADAS Calibration 1.1 $283 $258 $25 $0.00 0.3
Additional System Calibration 1.1 $197 $195 $3 $0.00 0.0
Aim camera 1.2 $76 $1 $76 $0.00 0.8
Dynamic Calibration - Blind Sp 1.0 $223 $223 $0 $0.00 0.0
Static Calibration - Surround 1.0 $332 $332 $0 $0.00 0.0
Static Calibration - Active Pa 1.0 $293 $293 $0 $0.00 0.0
Calibration 1.0 $355 $330 $25 $0.30 0.2
Dynamic Calibration - Adaptive 1.0 $289 $289 $0 $0.00 0.0
Aim blind spot radar 1.0 $92 $2 $91 $0.00 1.2
Static Calibration - Lane Keep 1.0 $330 $329 $0 $0.00 0.0
Test Drive 1.0 $33 $0 $33 $0.00 0.5
ADAS Advanced Driver Assist Sy 1.0 $402 $402 $0 $0.00 0.0
ADAS Calibration +25% 1.0 $414 $415 $0 $0.00 0.0
ADAS Calibration - Blind Spot 1.0 $324 $324 $0 $0.00 0.0
Reset Steering Angle Sensor 1.0 $75 $12 $63 $0.00 0.7
Dynamic Calibration - Active P 1.0 $194 $194 $0 $0.00 0.0
RESET STEERING ANGLE SENSOR 1.0 $64 $13 $50 $0.00 0.5
Line DescriptionAverage
Lines Per Claim
LineAmt
PartAmt
LaborAmt
Paint Amt
Avg Labor Hrs per
Line
91© 2021 CCC Intelligent Solutions Inc. All Rights Reserved.
CRASH
COURSE 2021 | EVOLUTION
Figure 30 / Share of Global New Vehicle Sales Equipped with Autonomous Vehicle Features by AV Level SOURCE: MCKINSEY CENTER FOR FUTURE MOBILITY. "PRIVATE AUTONOMOUS VEHICLES: THE OTHER SIDE OF THE ROBO-TAXI STORY." NOVEMBER 2020.
0%
10%
20%
30%
40%
50%
60%
70%
CY 2020 CY 2025 CY 2030
Level 2 entry Level 2 advanced Level 3 traffic-jam pilot Level 3 highway pilot Level 4 highway pilot
Total Loss Frequency and Costs Up Significantly
With repair costs, repair times, repair complexity, and rental car costs all up significantly so far in CY 2021, total loss frequency has increased further (Figure 17). New vehicle production halts from both the COVID-19 pandemic in Mar'20-Apr'20, and the shortage of semiconductor chips in CY 2021, has resulted in less inventory available for consumers and for rental car companies struggling to re-fleet to meet surging demand. New vehicle production is not expected to improve until later in the summer, leading to supply shortages throughout the remainder of the year.⁴⁶ This has pushed many into the used vehicle market, where supply is also down, and prices have surged. In fact, prices of
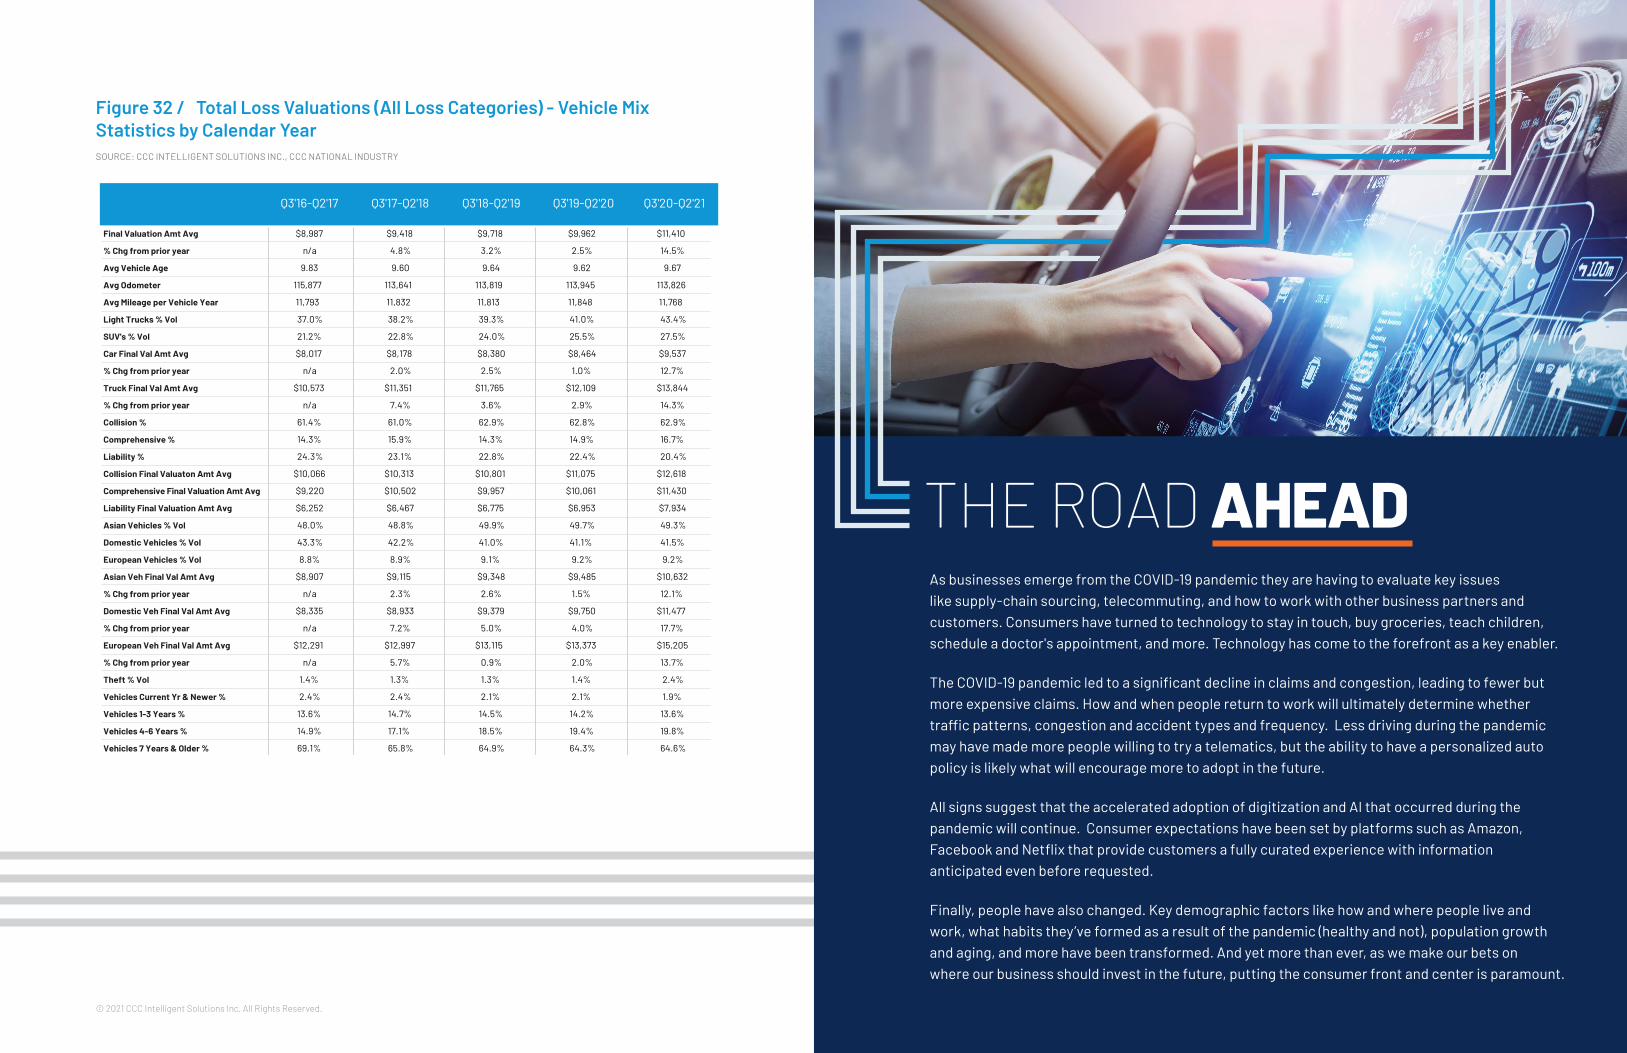
used cars and trucks have become a major contributor to overall inflation, which has risen sharply as consumers are emerging from the pandemic ready to spend their savings and government payments but finding supplies of all sorts of items restricted by supply chain issues.⁴⁷ Figure 31 shows just how dramatic the increases in wholesale used vehicle prices (Manheim), retail used prices (BLS-CPI), and used vehicle retention values (Blackbook) have been over the last several months. Higher used vehicle values as well as a continued shift towards light trucks and non-domestic vehicles has meant total loss vehicle costs are also increasing (Figure 32). Numerous analysts have projected used vehicle prices will likely flatten later in the year as new vehicle supply improves and ultimately leads to improved supply of used vehicles in subsequent periods. With costs as high as they are now however, even flattening prices will mean sustained pressure for total loss claims for carriers for some time.
Figure 31 / Black Book Used Vehicle Retention Index and Manheim Wholesale Used Vehicle Values and Bureau of Labor Consumer Price Index for Used Cars and Trucks SOURCE: WWW.MANHEIM.COM/CONSULTING/ AND WWW.BLS.GOV AND WWW.BLACKBOOK.COM.
75.0
95.0
115.0
135.0
155.0
175.0
195.0
215.0
Jan-06 Jan-07 Jan-08 Jan-09 Jan-10 Jan-11 Jan-12 Jan-13 Jan-14 Jan-15 Jan-16 Jan-17 Jan-18 Jan-19 Jan-20 Jan-21
Black Book Used Vehicle Retention Index
Manheim Wholesale Used Vehicle Value Index BLS CPI Used Cars & Trucks (not seasonally adjusted)
93© 2021 CCC Intelligent Solutions Inc. All Rights Reserved.
CRASH
COURSE 2021 | THE ROAD AH
EAD
Figure 32 / Total Loss Valuations (All Loss Categories) - Vehicle Mix Statistics by Calendar Year SOURCE: CCC INTELLIGENT SOLUTIONS INC., CCC NATIONAL INDUSTRY
Q3'16-Q2'17 Q3'17-Q2'18 Q3'18-Q2'19 Q3'19-Q2'20 Q3'20-Q2'21
Final Valuation Amt Avg $8,987 $9,418 $9,718 $9,962 $11,410
% Chg from prior year n/a 4.8% 3.2% 2.5% 14.5%
Avg Vehicle Age 9.83 9.60 9.64 9.62 9.67
Avg Odometer 115,877 113,641 113,819 113,945 113,826
Avg Mileage per Vehicle Year 11,793 11,832 11,813 11,848 11,768
Light Trucks % Vol 37.0% 38.2% 39.3% 41.0% 43.4%
SUV's % Vol 21.2% 22.8% 24.0% 25.5% 27.5%
Car Final Val Amt Avg $8,017 $8,178 $8,380 $8,464 $9,537
% Chg from prior year n/a 2.0% 2.5% 1.0% 12.7%
Truck Final Val Amt Avg $10,573 $11,351 $11,765 $12,109 $13,844
% Chg from prior year n/a 7.4% 3.6% 2.9% 14.3%
Collision % 61.4% 61.0% 62.9% 62.8% 62.9%
Comprehensive % 14.3% 15.9% 14.3% 14.9% 16.7%
Liability % 24.3% 23.1% 22.8% 22.4% 20.4%
Collision Final Valuaton Amt Avg $10,066 $10,313 $10,801 $11,075 $12,618
Comprehensive Final Valuation Amt Avg $9,220 $10,502 $9,957 $10,061 $11,430
Liability Final Valuation Amt Avg $6,252 $6,467 $6,775 $6,953 $7,934
Asian Vehicles % Vol 48.0% 48.8% 49.9% 49.7% 49.3%
Domestic Vehicles % Vol 43.3% 42.2% 41.0% 41.1% 41.5%
European Vehicles % Vol 8.8% 8.9% 9.1% 9.2% 9.2%
Asian Veh Final Val Amt Avg $8,907 $9,115 $9,348 $9,485 $10,632
% Chg from prior year n/a 2.3% 2.6% 1.5% 12.1%
Domestic Veh Final Val Amt Avg $8,335 $8,933 $9,379 $9,750 $11,477
% Chg from prior year n/a 7.2% 5.0% 4.0% 17.7%
European Veh Final Val Amt Avg $12,291 $12,997 $13,115 $13,373 $15,205
% Chg from prior year n/a 5.7% 0.9% 2.0% 13.7%
Theft % Vol 1.4% 1.3% 1.3% 1.4% 2.4%
Vehicles Current Yr & Newer % 2.4% 2.4% 2.1% 2.1% 1.9%
Vehicles 1-3 Years % 13.6% 14.7% 14.5% 14.2% 13.6%
Vehicles 4-6 Years % 14.9% 17.1% 18.5% 19.4% 19.8%
Vehicles 7 Years & Older % 69.1% 65.8% 64.9% 64.3% 64.6%
As businesses emerge from the COVID-19 pandemic they are having to evaluate key issues like supply-chain sourcing, telecommuting, and how to work with other business partners and customers. Consumers have turned to technology to stay in touch, buy groceries, teach children, schedule a doctor's appointment, and more. Technology has come to the forefront as a key enabler.
The COVID-19 pandemic led to a significant decline in claims and congestion, leading to fewer but more expensive claims. How and when people return to work will ultimately determine whether traffic patterns, congestion and accident types and frequency. Less driving during the pandemic may have made more people willing to try a telematics, but the ability to have a personalized auto policy is likely what will encourage more to adopt in the future.
All signs suggest that the accelerated adoption of digitization and AI that occurred during the pandemic will continue. Consumer expectations have been set by platforms such as Amazon, Facebook and Netflix that provide customers a fully curated experience with information anticipated even before requested.
Finally, people have also changed. Key demographic factors like how and where people live and work, what habits they’ve formed as a result of the pandemic (healthy and not), population growth and aging, and more have been transformed. And yet more than ever, as we make our bets on where our business should invest in the future, putting the consumer front and center is paramount.
THE ROAD AHEAD
95
CRASH
COURSE 2021 | EVOLUTION
1. https://deadline.com/2021/04/2021-oscars-most-streaming-film-wins-ever-1234743184/.
2. Ibid.
3. Anne Steele. “Spotify Adds Subscribers, Says Joe Rogan Drawing More Users Than Expected.” April 28, 2021, www.wsj.com.
4. Ibid.
5. Laura Forman. “DoorDash Loves the ‘Burbs as Much as You Do.” Nov. 17, 2020, www.wsj.com.
6. Laura Forman. “DoorDash Loyalty Program Should Deliver.” Dec. 2, 2020, www.wsj.com.
7. https://www.mckinsey.com/featured-insights/future-of-work/whats-next-for-consumers-workers-and-companies-in-the-post-covid-19-recovery.
8. https://www.wsj.com/articles/online-sales-party-starts-winding-down-11621361023.
9. Jennifer Smith. “Logistics Providers See E-Commerce Momentum Continuing Post-Pandemic.” www.wsj.com, June 9, 2021.
10. Cox Automotive. “Digitization of End-to-End Retail.” January 2021.
11. Ibid.
12. https://www.wardsauto.com/dealers/how-digital-sales-will-reshape-automobile-sales-service-and-showrooms.
13. “Cars.com Shoppers Logged a Record 30 Million Hours on the Platform Last Year, as More Americans Turn to Car Ownership.” March 20, 2021. https://www.cars.com/articles/cars-com-data-survey-shows-pan-demic-spurred-car-buying-433268/.
14. Ibid.
15. Dave Leggett. “US vehicle market surged in March.” 8 April 2021. https://www.just-auto.com/news/us-vehicle-market-surged-in-march_id201171.aspx.
16. https://www.forbes.com/sites/jimhenry/2021/03/15/sunny-2021-au-to-sales-forecast--contains-black-clouds-high-prices-low-supplies/.
17. Joe Overby. “April used-car sales likely up 58%; Dealer groups show strong Q1 pre-owned results.” April 27, 2021. www.autoremarketing.com.
18. Ibid.
19. Capgemini Voice of the Customer Survey, 2021. Capgemini Efma. “World Insurance Report 2021.” May 2021, p. 9. https://worldinsur-ancereport.com/wp-content/uploads/sites/6/2021/05/World-Insur-ance-Report-2021.pdf.
20. Ibid.
21. Ibid.
22. Susanne Sclafane. “Progressive ‘Crushing It ’ on Profit: Berkshire’s Jain and Buffet.” May 6, 2021. https://www.carriermanagement.com/features/2021/05/06/220214.htm
23. https://www.rolandberger.com/en/Insights/Publications/Advanced-Driver-Assistance-Systems-A-ubiquitous-technolo-gy-for-the-future-of.html.
24. Konstantin Shirokinskiy and Wolfgang Bernhart and Stephan Keese. “Advanced Driver-Assistance Systems: A Ubiquitous Technology for the
Future of Vehicles.” March 31, 2021. www.rolandberger.com.
25. HLDI Research Report: March 2020. “Speeding behavior while using adaptive cruise control and lane centering.”
26. McKinsey & Company, McKinsey Center for Future Mobility. “Five COVID-19 aftershocks reshaping mobility ’s future.” September 2020.
27. Benoit Laine and Coraline Daubresse. “Teletravail et demande de trans-port: une evaluation dans le modele PLANET.” Novembre 2020. Bureau federal du plan, Working Paper 6-20. https://www.plan.be.
28. Ibid.
29. Scott Calvert. “Afternoons Are the New Rush Hour in the Suburbs.” May 17, 2021. https://www.wsj.com/articles/afternoons-are-the-new-rush-hour-in-the-suburbs-11621157403.
30. https://www.brookings.edu/research/the-largest-cities-saw-the-sharpest-population-losses-during-the-pandemic-new-census-data-shows/.
31. Ibid.
32. https://www.wsj.com/articles/americans-up-and-moved-during-the-pandemic-heres-where-they-went-11620734566
33. Rob Warnock. “Remote Work Has Wealthy Americans Moving Again.” May 11, 2021. https://www.apartmentlist.com/research/remote-work-wealthy-americans-moving-again.
34. Ibid.
35. Chris Salviati. “How will remote work impact housing location preferenc-es.” May 3, 2021. https://www.apartmentlist.com/research/remote-work-moving-prefs-survey.
36. Ibid.
37. Justin Baer. “The Breakout Cities on the Forefront of America’s Economic Recovery.” May 9, 2021. https://www.wsj.com/articles/the-breakout-cities-on-the-forefront-of-americas-economic-recov-ery-11620584178
38. Stephan Whitaker, Federal Reserve Bank of Cleveland. “Cleveland Fed District Data Brief: Did the COVID-19 Pandemic Cause an Urban Exodus? Follow-Up Questions and Answers.” March 25, 2021.
39. Ibid.
40. Paper: The Environmental Impact of Suburbanization. Matthew E. Kahn Journal of Policy Analysis and Management – Vol. 19, No. 4 (Autumn, 2000), pp. 569-586.
41. https://www.tsa.gov/coronavirus/passenger-throughput.
42. www.artemis.bm/news/catastrophe-losses-running-30-above-aver-age-after-april-jefferies. May 17, 2021.
43. https://www.rolandberger.com/en/Insights/Publications/The-car-will-become-a-computer-on-wheels.html
44. https://www.wardsauto.com/dealers/evs-need-fewer-repairs-right-wrong-says-study.
45. McKinsey’s Center for Future Mobility. “Private autonomous vehicles: The other side of the robo-taxi story.” November 2020.
46. https://blog.nada.org/2021/06/04/nada-market-beat-may-sales-strong-slight-fall-from-aprils-highs/.
47. https://www.ft.com/content/70491b2f-6b6c-4489-ae14-706ed835c423.
SOURCES
PREPARED BY
SUSANNA GOTSCHSenior Director, Industry Analyst, CCC
Susanna Gotsch is Senior Director, Industry Analyst at CCC Intelligent Solutions Inc. She has been with CCC since July of 1992.
She has authored Crash Course, CCC’s annual publication on trends impacting collision repair and total loss costs since 1995. This publication has become a key resource for the industry in understanding how broader trends within the economy, new and used vehicle market places, and collision industry are impacting auto claim frequency and costs. Ms. Gotsch also consults with the on-going development of CCC’s industry-leading data warehouse and reporting products.
Ms. Gotsch has presented her research at numerous industry meetings and symposiums. In 2011, Ms. Gotsch was awarded the annual industry honorarium Most Influential Women in the Collision Repair Industry.


![HOME [hq3v243wqqe3dgv253uelk9o-wpengine.netdna-ssl.com]](https://img.pdfslide.us/doc/110x75/6170bc947fa5c3257e137324/home-hq3v243wqqe3dgv253uelk9o-.jpg)