Embed Size (px)
Citation preview

EVNGerman & AustrianCorporate Conference
May 19, 2011

Agenda
1. EVN’s strategy2. EVN’s growth perspectives3. Financial performance
21 EVN’s strategy 2 3

EVN at a glanceProfile Key metrics (2009/10)
Contribution by business segments
> Leading integrated Energy and Environmental Services company serving customers in Lower Austria, South East Europe and Central and Eastern Europe
> Active in 20 countries
> Key business areas include electricity, gas, heating, water and waste incineration
> Net results (2009/10): 207.0 EUR m (+16.3%)
> Employees (2009/10): 8,536, thereof ~70% abroad
> Rating: A3, stable (Moody’s)A–, negative (Standard & Poor’s)
Generation
> Electricity generation: 3,653 GWh
Networks
> Electricity: 131,905 km
> Gas: 13,540 km
> Heating: 586 km
Energy supply
> Customers: 3.6 m
> Sales volume: 28.7 TWh
Environmental Services
> 0.5 m drinking water customers in Lower Austria
> Waste incineration plants with capacity of 500,000 tons p.a. in Lower Austria
> Waste incineration plant with capacity of 360,000 tons p.a. in Moscow
> More than 80 drinking and wastewater plants servicing more than 13 m customers throughout Europe
Revenues1 EBITDA1
1 Pre consolidation adjustments
EnvironmentalServices
10%
Energy SupplySEE29% Energy Trade
and Supply40%
Netw orkInfrastructure
Austria17%
Generation4%
EUR 2,752.1mEUR 2,752.1m
Environmental Services12%
Energy SupplySEE16%
Energy Tradeand Supply
14%
Netw orkInfrastructure
Austria46%
Generation12%
EUR 416.6mEUR 416.6m
31 EVN’s strategy 2 3

EVN at a glance – active in 20 countries> Strong position in the home
market encompassing the whole value chain
> A leading Central and Eastern Europe player in water, wastewater and waste incineration
> Long term experience with a proven track record of reference projects
41 EVN’s strategy 2 3

EVN strategy 2020 –selective growth and consolidation
Generation
Network Infrastructure Austria
Energy Trade and Supply
Energy Supply South East Europe
Environmental Services
STRATEGY 2020
Focus on renewable generation capacities Optimisation of existing plants
Stable asset base and smart metering
Improvement of network efficiency
Energy efficiency, heating projects, extension of energy services
Strengthening of regional market coverage
Gas Croatia and heating Bulgaria
Further optimisation of existing business
Growth in international project business
Execution of existing projects and optimisation of waste incineration and water supply
+
+
+
+
+
Ongoing Consolidation Selective Growth
5

An attractive investment opportunity
1More than 60% of revenues and more than 80% of EBITDA from stable core Austrian business
2 Growing portfolio of high quality generation assets
3 Significant upside potential from SEE market development
4 Positioned to capture attractive returns in international Environmental Services business
5 Strategic investments in VERBUND and RAG strengthen internal energy hedge
1 EVN’s strategy 2 3 6

Stable core Austrian businessRevenue contribution (EURm) EBITDA contribution (EURm)
> Strong business foundations from stable revenue and EBITDA contribution of domestic activities
> Network activities, driven by transparent regulatory regime, provide stable cash flow to fund growth opportunities
63% 62% 62% 77% 80% 84%
1
(% of total)
(% of total)
Note: International activities include mainly Energy Supply South East Europe and international project businesses of the Environmental Services Segment
1,521 1,679 1,701
876
1,048 1,051
2,397
2,727 2,752
07/08 08/09 09/10
Domestic activities International activities
280 298349
8275
67363 373
416
07/08 08/09 09/10Domestic activities International activities
1 EVN’s strategy 2 3 7
Growing portfolio of high quality generation assetsCapacity development
Selected current generation projects
1 Includes Austrian Wind parks as well as Kavarna Wind park (Kavarna project 50 MW might not be pursued)
2 Contains smaller hydro power plants in Austria, cogeneration power plant in Plovdiv, Bulgaria
3 Delayed commercial operation date due to necessary repairs of defects
Project Walsum Wind parks Ashta Gorna Arda Devoll Others2
Fuel type Hard coal Wind Hydro Hydro Hydro Various
Pro-rata investment (EURm) 402 199 105 60 – 150 400 n/a
Expected COD 20113 2011/13 2012/13 2016 2015/18 n/a
2
> This potential capacity development will double the expected generation output by 2020
1,0001,410 1,533 1,558 1,573 1,701
192
2,541
1,787
53
1281525123410
2,63545
Status quo2009/10
Walsum Wind park 1 Ashta Gorna Arda Devoll Others 2
(Pro
-rat
a in
stal
led
capa
city
, M
W)
1 EVN’s strategy 2 3 8

54
80
100
0
20
40
60
80
100
120
EVN
inBu
lgar
ia
EVN
in
Mac
edon
ia
EVN
in L
ower
Au
stria
0
5
10
15
20
25
Bulg
aria
Mac
edon
ia
Rom
ania
Cro
atia
Aust
ria
EU 2
7
2007/08 2008/09
Significant upside from SEE investments
Improvement of grid efficiency (%)
Upside potential
1 In %, basis: Lower Austria = 100%
3
Illustrative electricity sales volumes per customer (%)1
Electricity prices for household (EUR cent/kWh)
121313141516 1617212224
04/05 05/06 06/07 07/08 08/09 09/10Grid losses, BG Grid losses, M K
1 EVN’s strategy 2 3 9

> Successful participation in 94 projects in 16 countries since 1983
> Strong demand for infrastructure projects set to continue
> Sales backlog of EUR 1.3bn with attractive return potential from international projects
> Underpinned by stable contributions from water and waste businesses
Attractive returns in Environmental Services4
1 EVN’s strategy 2 3 10

Internal hedge from strategic investments5
12.63% 50.03% 73.6%
> #1 electricity producer in Austria with 8.6 GW installed capacity
> Current Mcap of ~EUR 10.8bn> Historical payout ratio ~50%
> #2 oil and gas producer in Austria> One of the largest gas storage
operators in Central Europe with 5 bn m³ working gas capacity by 2011
> #1 green energy producer in Austria with ~270 MW installed capacity
> Increasing wind energy capacity by 75% to 470 MW in the next 5 years
49% 49%
> Strengthen vertical integration
> Financial exposure to generation and upstream gas
> Financial hedge against increasing input energy costs
> Regional expansion and contribution to EVN’s profitability
1 EVN’s strategy 2 3 11

A clear strategy to develop our integrated business model
> Expand generation capacity
- Target a coverage ratio of 40%–60%
- Increase the share of renewable generation, to 50% in the long-term
- High quality projects in SEE
> Maintain market leadership in Austrian supply business
> Enhance efficiency and profitability of regulated operations
- Maintain high level in Austria
- Continue improvements in SEE
> Capitalise on Environmental Services expertise and track record
1 EVN’s strategy 2 3 12

Agenda
1. EVN’s strategy2. EVN’s growth perspectives3. Financial performance
131 2 EVN’s growth perspectives 3

Wind power plants on the home market
1 2 EVN’s growth perspectives 3 14

Schütt hydropower plant in Lower Austria
1 2 EVN’s growth perspectives 3 15

Trans-regional natural gas transport pipeline – „Südschiene“
1 2 EVN’s growth perspectives 3 16

Cogeneration plant at Plovdiv in Bulgaria
1 2 EVN’s growth perspectives 3 17

Hydropower plants on the Rivers Drin and Devoll, Albania
1 2 EVN’s growth perspectives 3 18
Second waste incineration plant in Moscow
1 2 EVN’s growth perspectives 3 19

Agenda
1. EVN’s strategy2. EVN’s growth perspectives3. Financial performance
201 2 3 Financial performance

Business highlights Q. 1 2010/11
> Successful conclusion of capital increase, net proceeds: EUR 175.5m
> Changes in the Executive and Supervisory Board of EVN AG
- Burkhard Hofer elected as Chairman of the Supervisory Board;
- Peter Layr named as Spokesman to the Executive Board;
- Stefan Szyszkowitz appointed as Member of the Executive Board;
> EVN subscribed to new shares in VERBUND AG capital increase together with its syndicate partner Wiener Stadtwerke Holding AG
> Increase of payout ratio to about 35%
> Results for 2010/11 expected slightly below the prior-year level
1 2 3 Financial performance 21

Business development> Higher Group revenue due to
- Positive development in the EnvironmentalService segment
- Higher weather-driven energy sales volumes
It is despite- Negative wholesale price effect in
Generation and Trade and Supply segments- Changed presentation of tariff components
of high-voltage networks in Bulgaria
> EBITDA and EBIT above previous year‘slevel
> Positive development in financial results- Higher income from investments- Decline in interest and other financial results
> Group net profit above previous year‘s level> Strong growth of Net cash flow from
operating activities> Increase in earnings per share despite
higher number of shares
Corss cash value
Group net profit
Financial result
EBIT
EBITDA
–0.000.0Revenue
Veränd%
2009/10 EUR m
EUR
11.50.51Earnings per share
18.687.9Group net profit
–83.9Net cash flow fromoperating activities
–16.2Financial results
9.4104.1EBIT
0.8158.4EBITDA
4.3802.2Revenue
Changein %
2010/11 Q. 1EURm
1 2 3 Financial performance 22

Balance sheet
> Increase of total assets above EUR 7bn
> Strong increase in equity- Share capital increase of 10%
- Positive market valuation of EVN‘sshareholding in VERBUND AG
> Slight increase in equity ratio
> Drop in net debt and gearing due to increase of cash and cash equivalents
0.9p47.2Equity ratio (in %)
–7.3p40.5Gearing (in %)
–6.91,367.0Net debt
11.63,375.4Equity
6.27,149.3Total assets
Changein %1)
2010/11Q. 1EURm
83.7% 16.3%
Non-current assets Current assets
1) compared to September 30, 2010
47.2% 37.0% 15.8%
Equity Non-current liabilities Current liabilities
1 2 3 Financial performance 23

Cash Flow> Lower Gross cash flow
- Higher profit before income tax- Lower depreciation and amortisation- Higher non-cash income from investments in
equity accounted investees
> Increase of Net cash flow from operatingactivities
- Strong improvement in working capital
> Higher net cash outflow from investingactivities
- Capital payment for investments in equityaccounted investees
- Increase in lease receivables in theEnvironmental Services segment
- Increase in investments in cash funds- Lower investments in property, plant and
equipment
> Higher Net cash flow from financing activities- Net proceeds of capital increase: EUR 175.5m
–10.9168.2Net cash flow from financing activities
–38.1–191.3Net cash flow from investing activities
–6.983.9Net cash flow from operating activities
146.4139.9Gross cash flow
2009/10 Q. 1
2010/11Q. 1EURm
139.9
146.4
0 20 40 60 80 100 120 140 160
Q. 1 2010/11
Q. 1 2009/10
Gross cash flow
Investments in property, plant and equipment and intangibleassets
99.8
74.7
1 2 3 Financial performance 24
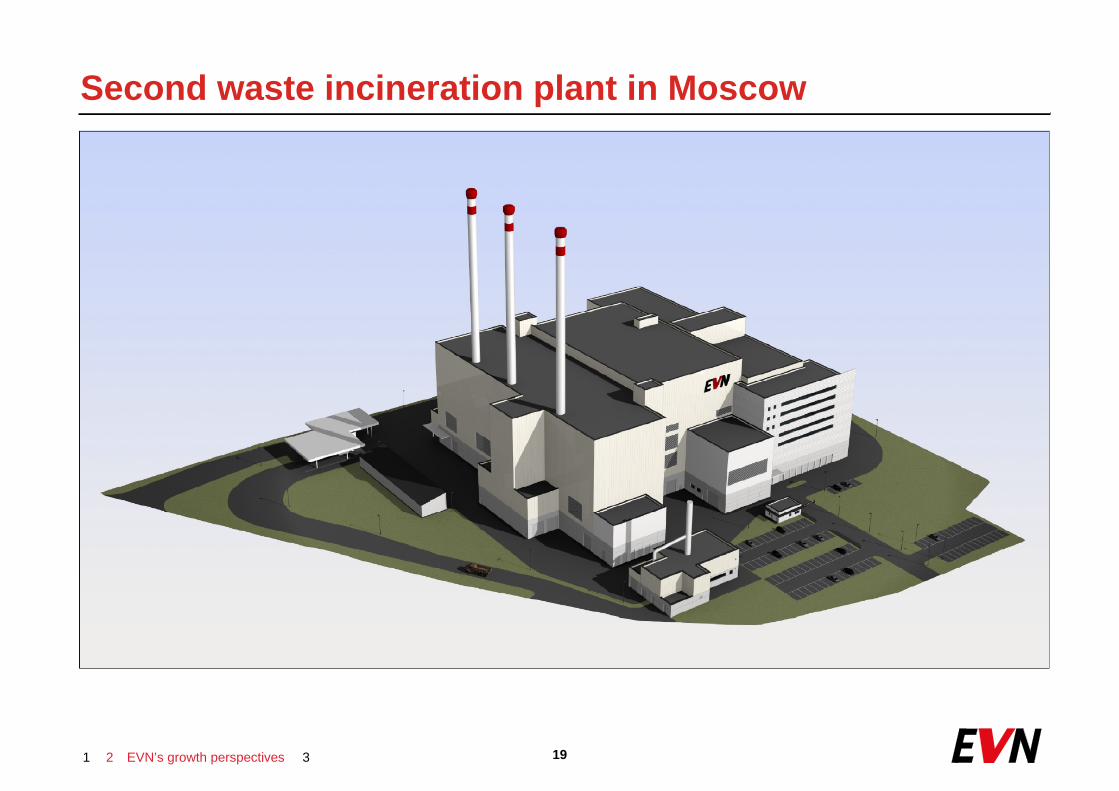
Outlook 2010/11
> Assumptions
- Stable end customers business development
- Lower spreads between primary energy prices and electricity prices
- High order book in Environmental Services segment
> EVN‘s expectation
- Operating results may remain stable
- Group net profit slightly below the prior-year level
1 2 3 Financial performance 25

EVNGerman & AustrianCorporate Conference
Q&As
Disclaimer
Certain statements made in this presentation may constitute „Forward-Looking Statements” within the meaning of the U.S. federal securities law. Forward-looking information is subject to various known and unknown risks and uncertainties. These include statements concerning our expectations and other statements that are not historical facts.
The Company believes any such statements are based on reasonable assumptions and reflect the judgement of EVN’s management based on factors currently known by it.
No assurance can be given that these forward-looking statements will prove accurate and correct. or that anticipated. projected future results will be achieved.
For additional information regarding risks. Investors are referred to EVN’s latest annual report.

EVN Investor Relations
Additional Information:
Stefan Szyszkowitz Investor information on the webChief Financial OfficerPhone +43 2236 200-12132 www.evn.atFax +43 2236 200-82132 www.evn.at/investor.aspxE-Mail [email protected] www.evn.at/Responsibility.aspx
E-Mail: [email protected]
Klára Székffy EVN AGInvestor Relations HeadquartersPhone +43 2236 200-12745 EVN PlatzFax +43 2236 200-82745 2344 Maria EnzersdorfE-Mail [email protected]
![Q7471Series[B][3]-SDS AUSTRIA-Austrian German-28.pdf ...h22235. fileQ7471Series[B][3]-SDS_AUSTRIA-Austrian German-28.pdf Q7471Series[C][3]-SDS_AUSTRIA-Austrian German-41.pdf Q7471Series[M][3]-SDS_AUSTRIA-Austrian](https://img.pdfslide.us/doc/110x75/5d4a3d0e88c993d57a8ba9ea/q7471seriesb3-sds-austria-austrian-german-28pdf-b3-sdsaustria-austrian.jpg)