Embed Size (px)
Citation preview

1
Evidence updates on risk factors for occupational noise-induced hearing
loss (ONIHL)
Update 2: Review of impact and impulse noise evidence
September 2018
Requested by: ONIHL Expert Advisory Group
Date Requested: June 2018
Date Completed: September 2018
Author Associate Professor David McBride
Status: Final
Version Final
2
Contents
Background ................................................................................................................................ 3
Methods ..................................................................................................................................... 3
Introduction ............................................................................................................................... 3
Impact noise exposure ........................................................................................................... 4
Impact noise exposure standards .......................................................................................... 4
New developments, epidemiological studies with an impact component ........................... 5
Impulse noise exposure ......................................................................................................... 9
Prediction of the effects of impulse noise ........................................................................... 10
Identification of risk of NIHL through evaluation of Temporary Threshold Shift ................ 11
Impulse noise from firearms ................................................................................................ 13
Conclusions .......................................................................................................................... 16
Limitations of TTS ................................................................................................................. 16
MIL-STD 1474E ..................................................................................................................... 21
The LIAeq100ms. ....................................................................................................................... 22
The NATO recommendations .............................................................................................. 23
Analysis of impulse noise standards .................................................................................... 24
Probable level of noise impulses in New Zealand ............................................................... 24
Epidemiological studies of impulse noise exposure ............................................................ 25
Overall summary and analysis ………………………………………………………………………………………….. 27
References. .............................................................................................................................. 28
3
Background
This review is an update of the impact and impulse sections of the 2010 report ‘Guideline
for diagnosing occupational noise-induced hearing loss. Part 1: noise effects and duration’1.
It has been carried out to inform ACC’s updated 2018 guide on assessing occupational noise-
induced hearing loss.
Methods
The Search strategy (PubMed) for impact or complex noise:
((((noise induced hearing loss) OR acoustic trauma)) AND (((complex*) OR impact*) OR
kurtos*)) AND noise yielding 507 results
For firearms and impulse noise:
((((((((impulse noise) OR shoot*) OR gun*) OR explosion*)))) AND noise) AND ((noise
induced hearing loss) OR acoustic trauma) which yielding 478 results
Both were restricted to the years since 2011.
All the abstracts were read by the author, and those studies potentially informing dose-
response were retrieved and analysed.
Introduction
Occupational noise induced hearing loss arises from the energy imparted from two main
types of noise, continuous noise, impact noise and impulsive noise.
The effects of continuous noise have provided the basic model for understanding the
relationship between exposure and outcome. Large cross-sectional studies were carried out
in Europe and the United States in the 1960s, the subjects having been exposed to the same
level of gaussian, noise throughout their careers without the use of hearing protection. This
allowed mathematical modelling of the relationship between noise and hearing level, shown
to conform (within constraints) to an ‘equal energy hypothesis,’ EEH. The latter proposed
1 McBride D. (2010). Guideline for diagnosing occupational noise-induced hearing loss. Part 1: noise effects and
duration. Wellington: Accident Compensation Corporation.
4
that equal amounts of ‘A weighted’ sound energy caused equal amounts of hearing loss,
seemingly independent of the temporal distribution of the noise and the equivalent
continuous noise level over an 8-hour period (Leq,8h) was predictive of hearing loss. The
model was refined, and has been incorporated into the International Standard ISO 1999,
which allows the calculation of the hearing level to be expected from any given noise
exposure in a range of percentiles of the population from the 5% least sensitive to the 5%
most sensitive to the noise effect. Age has also been incorporated into the model, the two
effects being combined in the populations actually under study, but allowed to be additive
in their effects. The model does suffer from a number of assumptions and constraints, is
therefore not perfect, but is at present the best available for practical purposes, for gaussian
noise at least.
Impact noise exposure
Impact noise is of very short duration, typically the collision of two metal objects. It imparts
potentially harmful energy to the cochlea over very short but cumulative time periods.
Knowledge of their effects have come from workers in industries where metal on metal
noise occurs, but does so in a semi-predictable manner, for example the foundry industry
where the ‘drop forging’ process is carried out. Initial studies found that the equivalent
continuous noise level provided and adequate prediction of the effects of impact noise.
Impact noise exposure standards
Atherley and Martin (1971) investigated the relationship between impact noise and hearing
loss in two drop forging factories, with noise profiles as described in table 1. The table
shows the equivalent energy Leq, 118 and 110 dB(A).
Table 1: Parameters of drop forging noise (2)
Factory Peak height (ph) Decay time (te) Impacts/day Reception rate LEq
(N/M2) (Sec) (nT) (n) dB(A)
1 448 0.045 5700 0.2 118
2 65 0.1 20,000 0.7 110
488 N/m2 is about 127 dB Lpeak and 65 dB(A) 110 dB Lpeak. Both of these are of course below
the peak limit of 140 dB Lpeak, and the when the EEH Leq was used to predict hearing levels
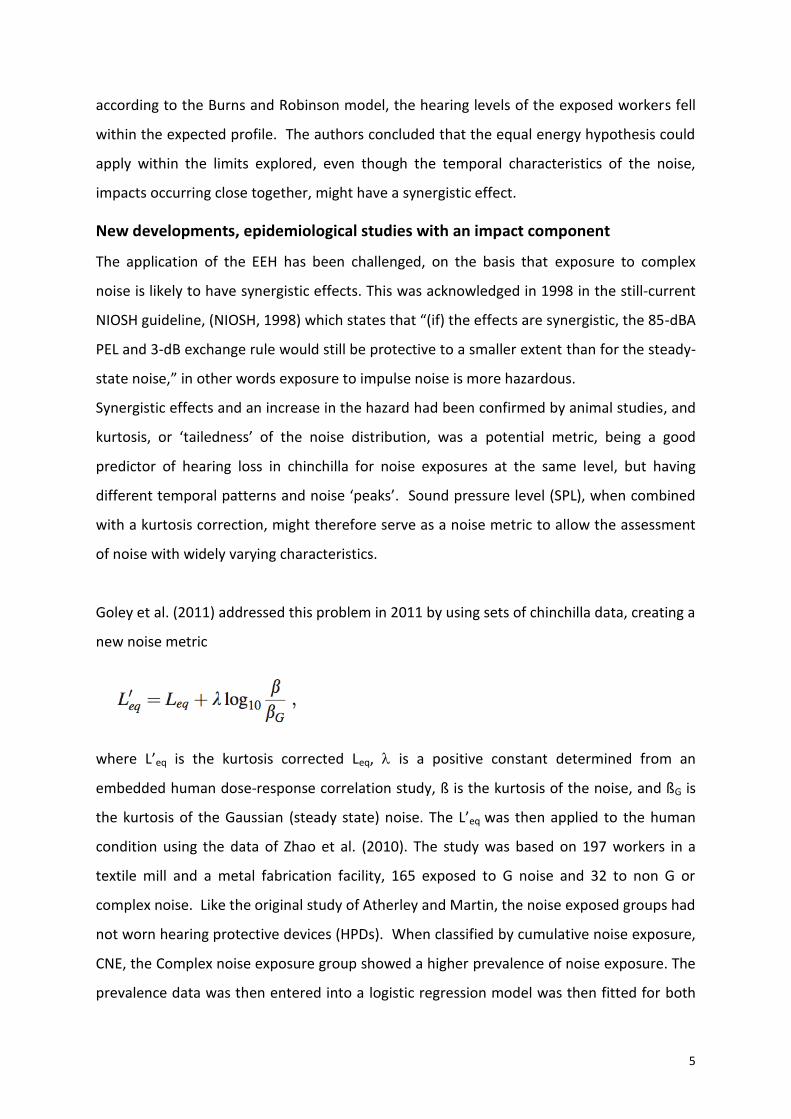
5
according to the Burns and Robinson model, the hearing levels of the exposed workers fell
within the expected profile. The authors concluded that the equal energy hypothesis could
apply within the limits explored, even though the temporal characteristics of the noise,
impacts occurring close together, might have a synergistic effect.
New developments, epidemiological studies with an impact component
The application of the EEH has been challenged, on the basis that exposure to complex
noise is likely to have synergistic effects. This was acknowledged in 1998 in the still-current
NIOSH guideline, (NIOSH, 1998) which states that “(if) the effects are synergistic, the 85-dBA
PEL and 3-dB exchange rule would still be protective to a smaller extent than for the steady-
state noise,” in other words exposure to impulse noise is more hazardous.
Synergistic effects and an increase in the hazard had been confirmed by animal studies, and
kurtosis, or ‘tailedness’ of the noise distribution, was a potential metric, being a good
predictor of hearing loss in chinchilla for noise exposures at the same level, but having
different temporal patterns and noise ‘peaks’. Sound pressure level (SPL), when combined
with a kurtosis correction, might therefore serve as a noise metric to allow the assessment
of noise with widely varying characteristics.
Goley et al. (2011) addressed this problem in 2011 by using sets of chinchilla data, creating a
new noise metric
where L’eq is the kurtosis corrected Leq, is a positive constant determined from an
embedded human dose-response correlation study, ß is the kurtosis of the noise, and ßG is
the kurtosis of the Gaussian (steady state) noise. The L’eq was then applied to the human
condition using the data of Zhao et al. (2010). The study was based on 197 workers in a
textile mill and a metal fabrication facility, 165 exposed to G noise and 32 to non G or
complex noise. Like the original study of Atherley and Martin, the noise exposed groups had
not worn hearing protective devices (HPDs). When classified by cumulative noise exposure,
CNE, the Complex noise exposure group showed a higher prevalence of noise exposure. The
prevalence data was then entered into a logistic regression model was then fitted for both

6
noise groups, producing dose-response curves, the curves of the complex noise group being
steeper. Use of the kurtosis metric aligned the curves, showing that the complex noise was
more harmful.
Davis et al. (2012) identified 240 workers from two industries in the Hube province of China
who had worn hearing protection only in the last two years of exposure. Of these, 207 were
exposed to complex noise. The median noise induced permanent threshold shift (NIPTS)
was assessed using pure tone audiometry and the median NIPTS for each noise exposed
group was predicted from the ISO 1999 algorithm. High median kurtosis (ß(t) ≥ 10 and
mean kurtosis ß(t) ≥ 4) significantly underestimated, by up to 10-15 dB, NIPTS at 2 and or 6
kHz.
Further data to support the synergistic effect was provided by Xie et al. in 2016 (Xie, 2016),
building upon earlier kurtosis work based on employees at two steel manufacturing plants
exposed to complex noise, (n=178), and including a comparison Gaussian exposed group
working in a textile mill (n=163).
Dosimetry on each subject allowed the calculation of the LAeq8hr and a full shift kurtosis
statistic and incorporating it into a kurtosis adjusted cumulative noise exposure, CNE.
Measured HTLs at each frequency were adjusted by subtracting the median age and gender
specific HTL obtained from the ISO 1999 noise unexposed ‘standard’ population, and high
frequency noise-induced hearing loss (AHFNIHL) was defined as one or more of the adjusted
HTLs, in either ear and at 3.0, 4.0 or 6.0 kHz being equal to or greater than 30 dB HL.
Correlations between HTL (the average at 3,4, and 6 kHz, worse ear) and both noise metrics,
adjusted and kurtosis adjusted, were calculated using multiple linear regression techniques
with age and smoking status as covariates. Logistic regression generated dose-response
curves for AHFNIHL, also using both noise metrics.
The results showed the Leq in the Gaussian noise plants to be higher than the complex noise
environment, however peak levels of non-G noise reached 140 dB.

7
Using the kurtosis adjusted CNE in the regression model reduced the coefficient for age
from 0.28 to 0.21, and increased the coefficient for CNE from 0.39 to 0.48. While both
relatively modest, a significantly better performance.
As regards hearing, there was a higher prevalence of AHFNIHL in the non-G group. Using
unadjusted CNE and at an exposure of 100 dB, 60. v 30%. These differences all but
disappeared using the adjusted CNE. The logistic regression model, fitted to the prevalence
data, confirmed that non-G noise was more hazardous, with a steep curve to the left of the
G group. Using the adjusted CNE the curves overlapped. The shift in the predictive value of
age versus noise exposure has implications for compensation.
Many epidemiological studies rely on a classification of complex or impact noise by
reference to occupation by way of a ‘noise exposure matrix,’ constructed by an ‘expert
panel’. An example is described by Sjöström et al. (2013) with classification of peak noise as
‘1 certainly, 2 probably, 3 maybe, 4, unlikely.
Railway track maintenance workers fall into group 1, and Lie et al. carried out a cross
sectional analysis of hearing status in employees of the Norwegian state railway operator,
finding a small but significant (circa 5 dB HL) loss in train and track maintenance personnel
in comparison with other groups. Their report (Lie, 2016) followed up on the base-line
analysis by examining ‘first and last’ audiograms between 1991 and 2014. Railway workers
were classified into 7 groups, train drivers, conductors, bus drivers, traffic controllers, train
maintenance workers, track maintenance workers and ‘others’. Mean changes in HTLs for
better ears at were calculated at low (0.5, 1, 2 and 4 kHz), and high (3, 4 and 6 Khz),
frequencies. Significant crude and adjusted shifts were noted in track maintenance workers.
Construction workers are in group 2, with probable complex noise exposure. Seixas et al.
(2012) reported on a 10 year longitudinal construction cohort. In 2000, at the start of their
training, the recruits were construction apprentices, carpenters, cement masons,
electricians, ironworkers, insulation workers, masonry workers, operating engineers and
sheet metal workers, with graduate students as non-noise exposed referents. A workplace
observational study showed low compliance with HPDs. Annual pure tone audiometry and
distortion product otoacoustic emission (DPOAE) testing at out at 3, 4 and 6 kHz were
8
carried out for at least 4 years. Those who had completed at least 2 tests in phase 1 were
recruited for an additional 4 year ‘phase 2’ follow-up.
A task-based cumulative noise exposure metric was developed for each subject, based on
full shift noise measurements carried out between 1997 and 2008. LEQ was adopted for the
G noise metric, normalised to an annual 2000-hour exposure to account for variation in
hours worked. Kurtosis was represented by a binary ‘peakiness’ variable, LMAX/LEQ (low) ≤ vs
> 50 (high). Linear mixed models estimated the change in hearing level in each ear, over
time and in relation to noise. Baseline age, gender and hearing thresholds were entered as
covariates. High peakiness was added to base models at 4kHz as an interaction term.
Comparisons were in terms of descriptive analyses comparing ‘exposed’ and ‘unexposed’
construction groups, respectively, and change over time was assessed among a subset with
six or more tests.
in the phase 2 model, hearing thresholds increased significantly (0.65 ± 0.53 dB per year).
The effect of noise exposure was small but significant, 0.023 (± 0.008) and 0.034 (± 0.013)
dB HTL x year, in the phase 1 and 2, and phase 2 models, respectively, with consistent
effects of noise exposure across models. Peakiness did not appear to affect the phase 2
hearing outcome.
This data was re-analysed by Roberts et al. (2018) primarily to ascertain whether the
Occupational Health and Safety Administration (OSHA) DRC, relying on the average noise
level, LAVG with a 5 dB exchange rate, or the NIOSH EEH LEQ with an exchange rate of 3dB,
was the better predictor of hearing loss. The noise metrics were recalculated appropriately,
firstly for each period, and secondly cumulated over the study period, with calculation of
the LMAX:LEQ ratio. Linear mixed models predicted HTLs in each year, over time, at 0.5, 1, 2, 3,
4, 6 and 8 kHz frequencies, also predicting the average of 2, 3 and 4 kHz. Models were run
using either the LAVG or LEQ exposure metric, and also using the combined data from Phases
1 and 2 allowing comparison with the Seixas data. The models were adjusted for baseline
covariates, age (<30 years or ≥30 years), including random intercepts for subjects, dominant
ears nested within subjects, and a random slope for years since baseline at the subject level.
An additional set of models was developed using the LAVG or LEQ metrics described
previously, but including as an additional covariate the baseline hearing thresholds. Four
models were run: LEQ controlling for baseline versus baseline as an additional repeated
measure, and LAVG controlling for baseline versus baseline as an additional repeated
9
measure. Model fit was compared through use of the Akaike information criterion (AIC), a
goodness of fit statistic, lower AIC scores indicating a better fit. The LEQ controlling for
baseline hearing models were a better fit, however only the 4Khz frequency was
substantially better. Including baseline hearing as an additional repeated measure. i.e.
without baseline HTLs, the LEQ models were, with the exception of 2 Khz, a better fit. The
differences between the models also improved, apart from the 3 and 4 kHz frequencies. The
AIC for the mixed model using the LEQ for the average of the 2, 3, and 4 kHz outcome was
found to be a substantially better fit, important because these are the frequencies used in
the OSHA significant threshold shift determination.
The model without the baseline covariate was also compared to the hearing levels predicted
by the ISO model. In all cases the mixed model predicted worse thresholds than the ISO
standard, more marked at the high frequencies for the higher percentiles of hearing loss,
being at least 5 dB HL and as much as 21 dBHL (90th percentile, 6 kHz). The authors explain
this “This is likely due to the fact that a subset of workers in this cohort had already
experienced hearing loss before enrollment. These workers tended to have worse and more
variable hearing outcomes compared with those who enrolled in the study with less or
minimal hearing loss. The ISO model provides no way for pre-existing hearing loss to be
factored into the NIHL predictions based on age and known noise exposure.”
Impulse noise exposure
Impulse noise results from the release of a large amount of energy over a very short time
period, typically resulting from the explosive effect of munitions. If very severe, the effect is
known as ‘blast overpressure’, caused by shock waves which can cause immediate damage
to the ear and indeed the chest. Because of the presence of a ‘shock front’ in the area
where the wave front is undergoing propagation, the physical nature of an impulse may be
complex. The behaviour of steady state noise can be modelled according to the principles
of fluid motion, but in order to use the fluid equations in the modelling process, certain
assumptions are made, in particular that there are no dissipative effects because the
amplitude of particle displacement, and thus the change in density of air, is small. At sound
pressure levels of greater than approximately 140 dB, pressure and density changes are
large, and dissipative effects cannot be ignored. Non linearities, including convective
effects, begin to affect the rules that govern propagation. When a shock wave is formed the
10
convective effects result in a wave speed that changes from point to point, so that the
different parts of the wave travel at different velocities. The velocity is greater in the areas
of increased density, so that the peaks of the pressure wave gain on the troughs and a ‘saw
tooth’ wave results. Because of these variations in density and non-linear effects, it is not
possible to specify unique values for the sound field variables, so it is not, strictly speaking,
possible to measure the energy content of an impulse exceeding 140 dB directly, which is
one reason why there is a ‘peak’ noise exposure limit. Exposure beyond this limit is possible,
but special measurement methods are required.
Because the noise is unpredictable, the cumulative exposure dose is almost impossible to
ascertain over a period of time. Human studies have however assessed the temporary
effects (temporary threshold shifts, the immediate shift that occurs directly after noise
exposure) of relatively few impulses of known characteristics. Controversy still surrounds
the mechanism for this loss, and whether it is a precursor of permanent threshold shift.
Various ‘energy like’ parameters have been proposed with which to measure impulse noise.
Of these, the most basic is the pressure/time profile, the ‘ideal’ profile having been
described by, and named after, Frederick Friedlander, who used such pulses to study
diffraction.
Empirical studies have shown that equal noise energy causes equivalent amounts of TTS (a
corollary to the equal energy hypothesis). In the absence of further insights, there are
energy measures, including the ‘A’ and ‘B’ duration of an impulse, allowing the risk to be
estimated, albeit with less precision than steady noise. There is also a growing body of
knowledge about ‘C’ weighting as an energy measure.
Prediction of the effects of impulse noise
Impulse noise is a ‘special case’ of noise exposure and an even more intractable problem
than that encountered with Gaussian or indeed complex noise.
It is a significant hazard in public safety personnel, but particularly the military. The
exposures are intermittent, and a satisfactory noise metric is still under investigation. Some
of these factors, especially those with a low frequency impulse spectrum due to blast
overpressure, whilst counter-intuitive, may actually lead to a decreased risk of hearing loss.
The close temporal distribution of semi-automatic and automatic weapons is likely to
increase the risk.

11
Identification of risk of NIHL through evaluation of Temporary Threshold Shift
Temporary Threshold Shift (TTS) provides a partial solution, because this effect is also
indicative of noise exposure, and the relationship between exposure (which can be
measured under laboratory conditions) and TTS is more immediate in time. It can also be
measured with a greater degree of accuracy. Providing that TTS is indeed predictive of PTS,
this could be a useful method of risk assessment for ‘difficult’ exposures. It has been
recognised more recently that TTS and PTS are due to different mechanisms, but they can
both be considered to be examples of cochlear strain and excessive exposure.
Evidence for the predictive value of TTS was first shown by Kryter (1966) who had studied
the effect of experimental noise exposures on human subjects. He identified that the TTS
measured two minutes after cessation of exposure (TTS2), induced by 8 hours exposure to
industrial noise, was “of the same magnitude” as the mean NIPTS found in workers exposed
for 10 to 20 years to about the same level of noise. The growth of the TTS also seemed to
follow a pattern very similar to the growth of NIPTS. Other TTS studies were based on
exposure to impulse, mainly rifle, noise which was carried out by the United States and
United Kingdom military authorities in a variety of conditions in an attempt to define “safe”
exposures.
One of the first exposure standards produced (for reasons of ethics) used TTS studies, in an
entirely empirical way, in the formulation of a damage risk criteria.(Kryter et al. 1966)
CHABA, the National Academy of Science-National Research Council Committee on Hearing,
Bioacoustics, and Biomechanics adopted a basic criterion that a sound exposure would be
acceptable if it produced a PTS after 10 years of exposure of no more than 10 dB at 1000 Hz
or below, 15 dB at 2000 Hz and 20 dB at 3000 Hz. These studies, carried out under
laboratory conditions, gave information on variations in risk resulting from different spectra,
level, duration and repetition rates of exposure (amongst other noise exposure variables).
The authors acknowledged that the precise relationship between NIPTS and TTS was not
known, but for practical reasons decided to use damage risk contours derived from TTS2
values that were equal to the criterion values for PTS. Their TTS2 criterion was therefore
identical to the PTS criterion in terms of hearing threshold. The reasoning for this was based
on three postulates. The first was that TTS2 was a consistent measure of the effects of a
single day exposure to noise. This first postulate was supported by evidence that TTSs
12
maintain their rank order during recovery, and by evidence that recovery from TTS does not
depend on how the TTS was produced. The second postulate was that TTS is not only a
consistent measure of a single day exposure to noise but also a measure of the hazard
associated with years of such exposure. All exposures that produce a given TTS will
therefore be equally hazardous, the equal temporary effect theory. The third was based on
the observation by Kryter: that the NIPTS eventually produced after many years of habitual
exposure, 8 hours per day, is about numerically equal to the TTS2 at 1000 Hz produced in
young normal ears by an 8-hour exposure to the same noise. These assumptions were used
because of a pragmatic imperative to set exposure standards, and used a form of the equal
energy hypothesis in the “equal temporary effect theory”. The major disadvantage of this
approach is that it is not based on mechanistic knowledge, and although it relies on a form
of the equal energy principle there is no evidence, not even a mathematical model, to
support it.
An exposure limit based on the equal energy principle could be set, (85 dB(A) for 8 hours, 88
for 4, 91 for 2, 94 for 1 hours and 130 dB for 0.7 of a second, but obviously this could not be
carried to extremes, because the linearity of the response of the ear could not be
guaranteed, and the level at which physical damage could occur was not known: there is
evidence that the ear has a certain ‘critical level’ above which immediate damage may
occur, possibly due to a direct mechanical action which may be combined with the toxic
effects of K+ ions due to membrane ruptures. The level at which this occurs in humans is
not known, but has been shown at 120 dB in guinea pigs.(28) Since it is also not possible to
measure the energy content of an impulse greater than 140 dB exactly, this was commonly
cited as an upper limit to which exposure, no matter how short, should occur.
The value of TTS is that it seems to be a useful proxy for potential damage to the ear. There
has been much debate about the mechanism by which impulse noise causes TTS: it may be
different from the mechanism which causes PTS. It would seem of particular value in that
Impulse noise has capricious effects, and thus the potential of any single event to cause
permanent damage is almost impossible to predict if the base-line hearing is not known.
The fact that TTS has occurred, especially if it lasts more than 24 hours (as described above)
may be very useful.
13
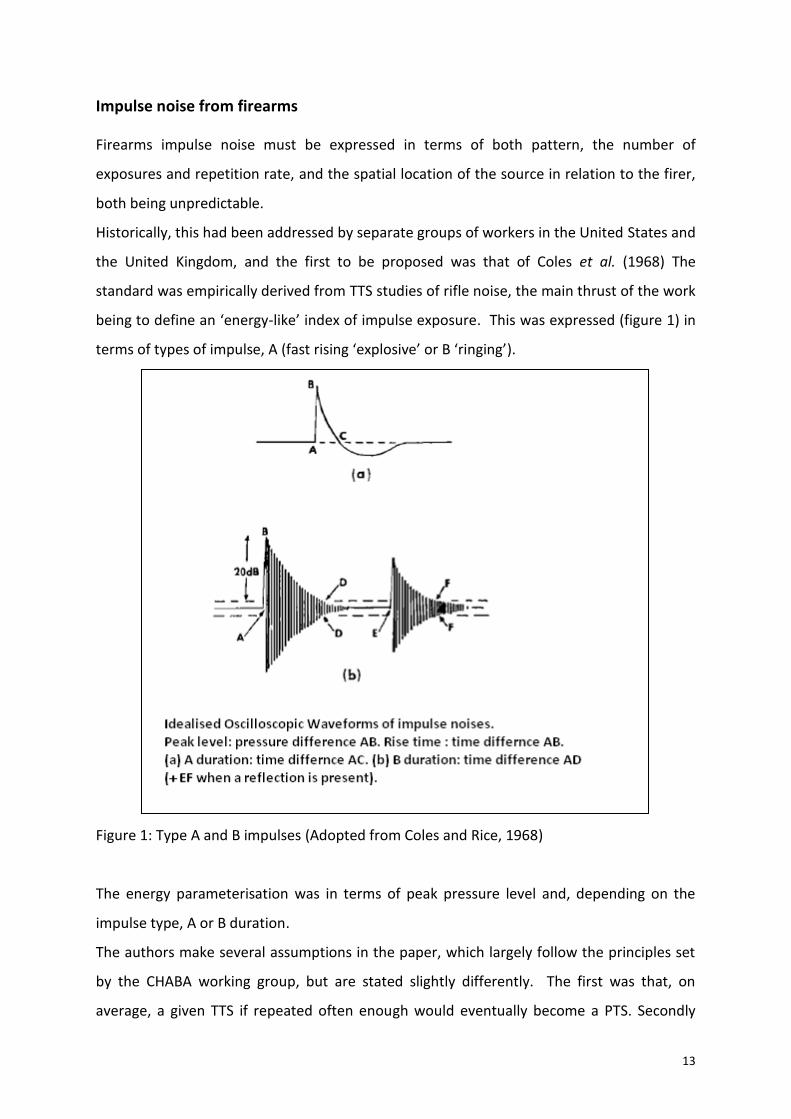
Impulse noise from firearms
Firearms impulse noise must be expressed in terms of both pattern, the number of
exposures and repetition rate, and the spatial location of the source in relation to the firer,
both being unpredictable.
Historically, this had been addressed by separate groups of workers in the United States and
the United Kingdom, and the first to be proposed was that of Coles et al. (1968) The
standard was empirically derived from TTS studies of rifle noise, the main thrust of the work
being to define an ‘energy-like’ index of impulse exposure. This was expressed (figure 1) in
terms of types of impulse, A (fast rising ‘explosive’ or B ‘ringing’).
Figure 1: Type A and B impulses (Adopted from Coles and Rice, 1968)
The energy parameterisation was in terms of peak pressure level and, depending on the
impulse type, A or B duration.
The authors make several assumptions in the paper, which largely follow the principles set
by the CHABA working group, but are stated slightly differently. The first was that, on
average, a given TTS if repeated often enough would eventually become a PTS. Secondly
14
that the end of day TTS2 was believed to be equivalent to, or in most cases greater than, the
likely PTS from recurrent exposures: this because for steady state noise exposure after the
first two minutes the rate of recovery from TTS depended primarily on the amount of TTS,
and not how it was caused, that is to say one high intensity exposure or several smaller
intensity exposures. This is a form of the equal energy concept, sometimes referred to as
the ‘equal temporary threshold shift concept’. The evidence for this came from steady state
noise exposures, and the authors acknowledge that the truth of this concept for impulse
noise was not certain but that “there is no published evidence to suggest otherwise”. The
DRC was based on the CHABA limits (a TTS of 20 dB at any frequency), but allowances had to
be made because of the different distribution of TTS due to impulse noise, which was wider
than that for continuous noise. This was dealt with by applying the CHABA limits to a higher
percentile of the population: the 75th instead of the 50th, to give an ‘adjusted CHABA
limit’.
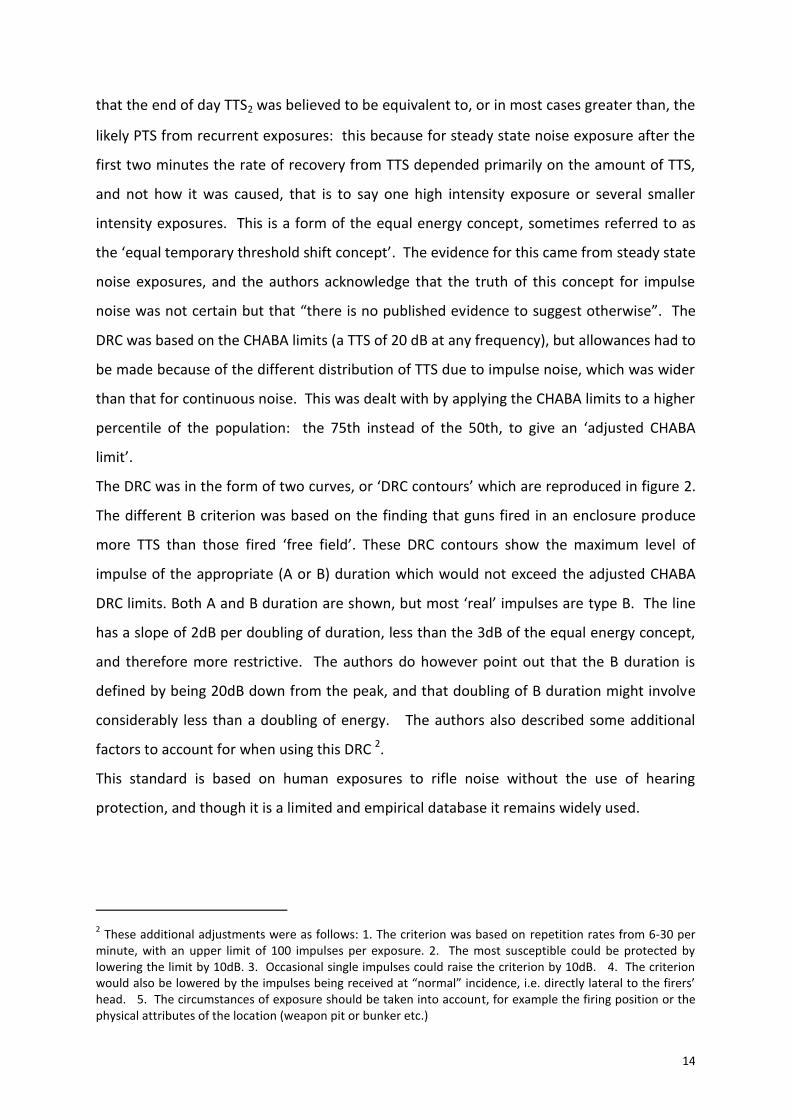
The DRC was in the form of two curves, or ‘DRC contours’ which are reproduced in figure 2.
The different B criterion was based on the finding that guns fired in an enclosure produce
more TTS than those fired ‘free field’. These DRC contours show the maximum level of
impulse of the appropriate (A or B) duration which would not exceed the adjusted CHABA
DRC limits. Both A and B duration are shown, but most ‘real’ impulses are type B. The line
has a slope of 2dB per doubling of duration, less than the 3dB of the equal energy concept,
and therefore more restrictive. The authors do however point out that the B duration is
defined by being 20dB down from the peak, and that doubling of B duration might involve
considerably less than a doubling of energy. The authors also described some additional
factors to account for when using this DRC 2.
This standard is based on human exposures to rifle noise without the use of hearing
protection, and though it is a limited and empirical database it remains widely used.
2 These additional adjustments were as follows: 1. The criterion was based on repetition rates from 6-30 per
minute, with an upper limit of 100 impulses per exposure. 2. The most susceptible could be protected by lowering the limit by 10dB. 3. Occasional single impulses could raise the criterion by 10dB. 4. The criterion would also be lowered by the impulses being received at “normal” incidence, i.e. directly lateral to the firers’ head. 5. The circumstances of exposure should be taken into account, for example the firing position or the physical attributes of the location (weapon pit or bunker etc.)
15
Figure 2, DRC contours of Coles and Rice
A duration is linked to the energy of the source while the B duration is the function of
individual weapon and exposure surrounding is related to additional energy in the stimulus
arriving at the subject produced, for example by reflections.
It runs from a point at 159 dB Lpeak at 5 ms to 150 db Lpeak for 100 ms, and acceptable
exposures were to be below the relevant limit. The common personal military weapons of
the period were the M14 assault rifle (American), and the L1-A1 Self Loading Rifle (British).
The impulse noise produced by both these weapons is in the order of 160 dB Lpeak, with a B
duration of 5 ms. One unprotected shot is all that would be allowed by the DRC.
Protection would be required, and the number of protected exposures at this limit are not
explicitly stated, but providing the exposure was “below the limit” up to 100 impulses would
be allowed under the DRC, providing that repetition rates were within the range of 6-30 per
minute. The DRC did not specify the “total energy” allowable in terms of numbers of
rounds, and there would have been some latitude in this, although 100 exposures very close
to the DRC limit would have obviously have been unacceptable. The application was also

16
limited to the “average” amount of exposure to be expected by military personnel and
civilians, and this was considered to be “in the order of” 50 to 1000 rounds per year.
The authors acknowledge that there is great deal of variability of individual response to
impulse noise, and that the expected variation in exposure is probably in the order of
magnitude of this individual variability: 50 rounds in the most sensitive would give a similar
risk of NIPTS as 1000 rounds in the least sensitive. The DRC does not give limits in terms of
precise numbers of exposures, as this was considered too cumbersome, but in practice it
limits the generalisability of this standard, because there is no coherent framework to allow
extrapolation in terms of total number of impulses and Lpeak.
Conclusions
The current UK impulse noise standards, for example the Defence Standard, are largely
based on this DRC, as are the US standards. Once more, for ethical reasons, it is highly
unlikely that additional human data regarding impulse noise will become available. In line
with the Coles et al proposal, the UK National Study of Hearing (Lutman, 1990) found little
effect of gunfire exposure. It is likely that cumulative exposure to less than 100 rounds will
have little effect.
If the results are to be extrapolated beyond weapon noise exposure, the assumptions must
be examined in the light of later data to see whether or not they can still be supported.
Limitations of TTS
Pfander et al. (1980) addressed the ‘total energy’ problem in 1980, by developing alterative
measures of duration, the C time (another measure of duration), which is similar to B time
except that the level is 10 dB down from the peak. The test subjects were members of the
Armed Forces of the Federal Republic of Germany, exposed to a variety of weapons during
practice shoot without hearing protection (then a part of training). Audiometric testing was
carried out 2 minutes after exposure, and at three-minute intervals up to half an hour. If
thresholds had not returned to base-line after half an hour, tests were made half hourly to 3
hours, then 12 and 24 hours and again at 2 weeks. The DRC assumes that no permanent
damage is to be expected from acoustic exposure if only 5% of those exposed still show a
TTS 24 hours after the event, and that this TTS disappears within 2 weeks. The types of
exposure assessed are shown in table 2, with the exposure metric tabulated as effective (or
17
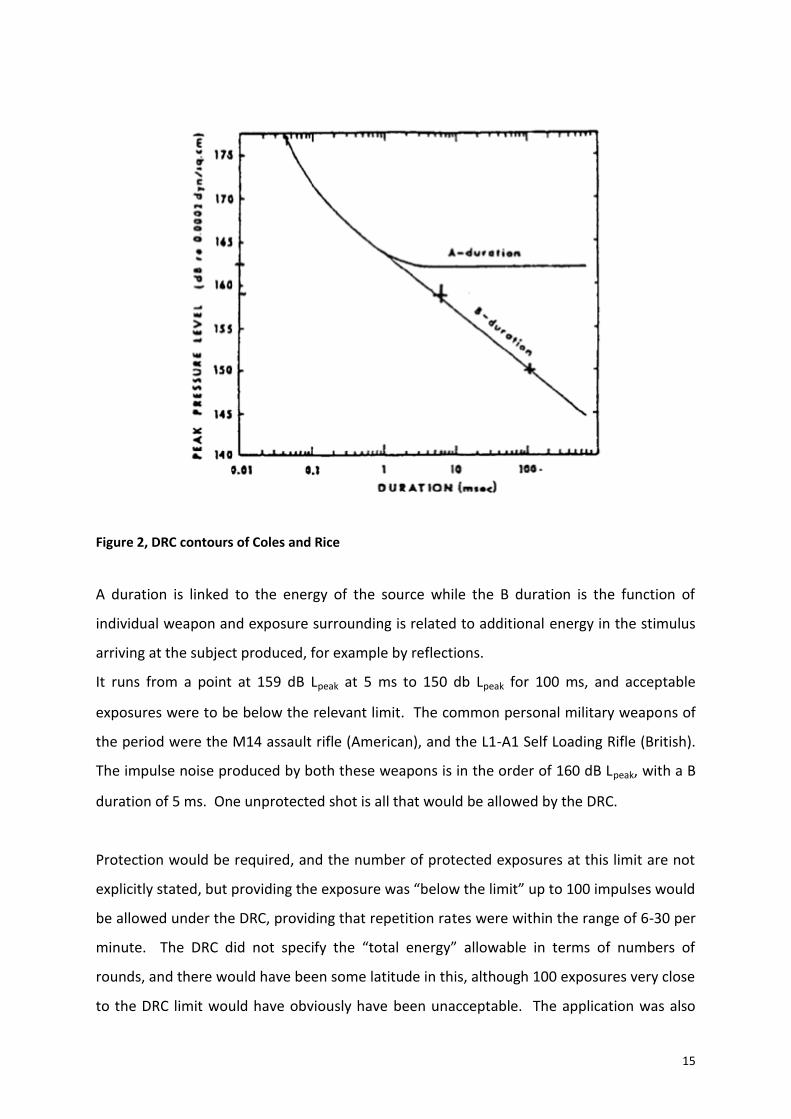
total) C duration, which is calculated as the product of C duration and number of impulses.
The TTS2 in relation to time required for complete recovery is shown in figure 3. Altogether,
477 personnel took part in these tests, of whom 103 showed a TTS. This figure shows that,
if TTS2 is large, the recovery time is generally longer. The large amount of variability should
also be noted, which may indicate that recovery time is a better indicator of auditory
hazard. 12 individuals (2.5% of those tested) had TTS which lasted for 24 hours, which is
thought to represent a danger of PTS. All of these individuals showed a TTS2 between 25
and 50 dB. The resulting DRC contour is shown in figure 3. Pfander, in using the effective
duration measure, cautions that a multiple acoustic exposure is more dangerous in its effect
on the ear than a single shot, and the magnitude of the effect depends on the length of
pauses between the individual shots.
Figure 3: Time to recovery for Pfander data
18
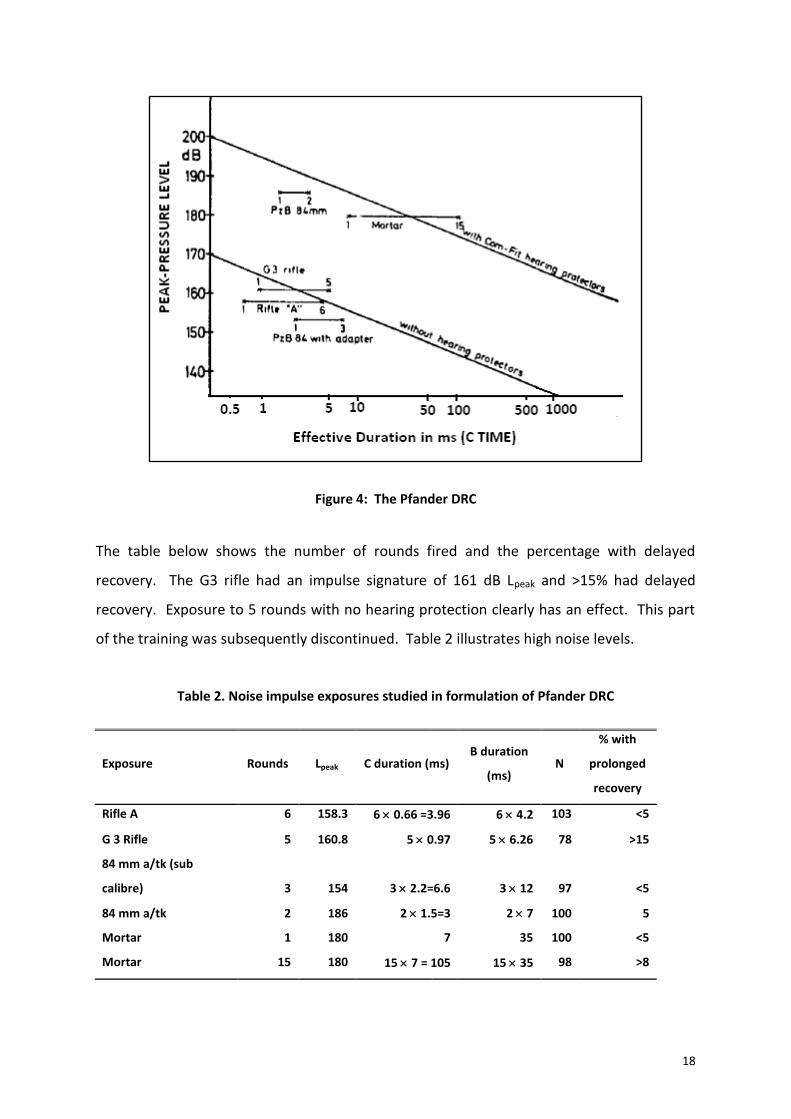
Figure 4: The Pfander DRC
The table below shows the number of rounds fired and the percentage with delayed
recovery. The G3 rifle had an impulse signature of 161 dB Lpeak and >15% had delayed
recovery. Exposure to 5 rounds with no hearing protection clearly has an effect. This part
of the training was subsequently discontinued. Table 2 illustrates high noise levels.
Table 2. Noise impulse exposures studied in formulation of Pfander DRC
Exposure Rounds Lpeak C duration (ms) B duration
(ms) N
% with
prolonged
recovery
Rifle A 6 158.3 6 0.66 =3.96 6 4.2 103 <5
G 3 Rifle 5 160.8 5 0.97 5 6.26 78 >15
84 mm a/tk (sub
calibre) 3 154 3 2.2=6.6 3 12 97 <5
84 mm a/tk 2 186 2 1.5=3 2 7 100 5
Mortar 1 180 7 35 100 <5
Mortar 15 180 15 7 = 105 15 35 98 >8
19
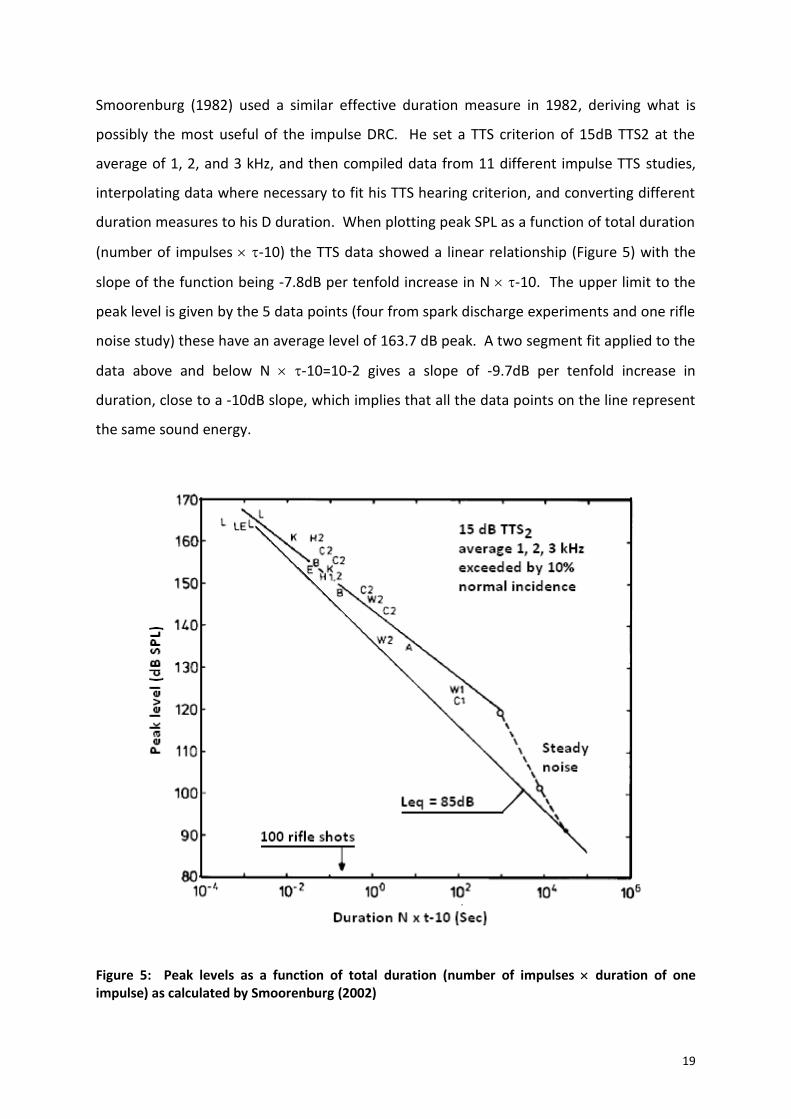
Smoorenburg (1982) used a similar effective duration measure in 1982, deriving what is
possibly the most useful of the impulse DRC. He set a TTS criterion of 15dB TTS2 at the
average of 1, 2, and 3 kHz, and then compiled data from 11 different impulse TTS studies,
interpolating data where necessary to fit his TTS hearing criterion, and converting different
duration measures to his D duration. When plotting peak SPL as a function of total duration
(number of impulses -10) the TTS data showed a linear relationship (Figure 5) with the
slope of the function being -7.8dB per tenfold increase in N -10. The upper limit to the
peak level is given by the 5 data points (four from spark discharge experiments and one rifle
noise study) these have an average level of 163.7 dB peak. A two segment fit applied to the
data above and below N -10=10-2 gives a slope of -9.7dB per tenfold increase in
duration, close to a -10dB slope, which implies that all the data points on the line represent
the same sound energy.
Figure 5: Peak levels as a function of total duration (number of impulses duration of one impulse) as calculated by Smoorenburg (2002)

20
In the figure above, exposure levels for steady state noise which satisfies the TTS criterion
are also shown. Two data points are plotted, from Ward (1959) and Kylin (1960) which
suggest that the TTS criterion was met by 2 hours of exposure at 95 dB(A) and data from
Kryter (1973) suggested that the hearing criterion was met by exposure to 113 dB(A) for an
exposure of 15 minutes. These levels were corrected by 6.6 dB to correspond to the
equivalent peak level. The dashed line in the figure runs up to N -10=8 hours, for which
continuous noise data suggests a level of 85 dB(A) (91.6 dB peak). The thin line represents
the combinations of number and duration which are equivalent to this level.
The slope of this continuous noise curve estimated from TTS studies shows an exchange rate
of 5-6 dB, for example, if 5-6 dB more exposure is required, the duration must be halved.
This is more than is allowed under the equal energy hypothesis suggested by the PTS data,
which allows a 3dB exchange rate. PTS studies with impulse noise tended to be carried out
in very high levels, for example Leqs of 110 and 118 dB(A) and these showed losses which
exceeded a 15dB hearing criterion. The standard should ensure that TTS2 is less than 15 dB
average 1, 2, and 3 kHz in 90-95% of the population at risk.
Table 3, Comparison of the TTS criteria of Smoorenburg, CHABA and Pfander3
Author Hearing Criterion (dB
HTL)
Frequency
(kHz)
Protected
percentile
Smoorenburg <25 Any 95
Pfander <15 123 90-95
CHABA 10 <1 95
CHABA 15 2 95
CHABA 20 >3 95
It can be appreciated that the measurement of an impulse is a complex process, and that
there is still controversy regarding suitable parameters of the impulse with which to
3 Criteria correspond to HTLs less than the tabulated levels at each frequency (or for the Smoorenburg criteria
at the mean of the frequencies) for the stated percentile of the population.
21
measure risk. More recent work has emphasised that “Rating the hazard of intense impulse
noises has long been a perplexing scientific problem. The recent consensus of the scientific
community is that none of the existing standards is accurate”.
In a 1982 paper, Price (1982) presents a model, the ‘auditory hazard assessment algorithm
for the human ear (AHAAH)’. The model output predicts immediate threshold shift, which
provides a prediction of PTS. In the paper, Price summarises the studies described above,
with a common method of comparison in that an unacceptable threshold shift has been
defined as that which will give rise to a shift of 25 dB or more at any frequency in the 95th
percentile ear (the most sensitive). In essence, most 50 round exposures at the 155-158 dB
level (typical of 7.62 mm exposures) gave rise to maximum TTS of 40, 50 or 70 dB. A study
by Brinkmann (2000) found that five or six rounds from a 5.56mm rifle produced TTS of 25
dB or more in around 20% of troops. Recovery took from 30 minutes to 16 hours.
MIL-STD 1474E
In 2015, the US Department of Defense approved the use of MIL-STD 1474E, with two
impulse metrics, the AHAAH and the LIAeq100ms. The AHAAH is described as “an
electroacoustic analog of the ear structured to match the physiology of the ear, element for
element”. It was developed first for the cat ear where temporary threshold shift (TTS),
permanent threshold shift (PTS), and cellular changes could be examined. It reproduces the
measured transfer functions from the free field to the stapes and translates stapes motion
into basilar membrane displacements. It keeps track of the displacements at 23 locations
(roughly one-third octave intervals) and derives a dose at each location by squaring the peak
amplitude of each upward displacement of the basilar membrane (in microns) and summing
them for the analysis interval. The result (at each location) is in auditory risk units (ARU):
ARU = sum (D2)
where D is the upward basilar membrane displacement (in microns).
The result with the largest value is reported.
In the Cat ear, which is similar to the human ear, there is a direct relationship between the
number of ARUs for an exposure and the resultant compound threshold shift, CTS, the latter
being the sum of the TTS and PTS produced.
22
In the human cochlea, when subjected to intense stimuli resulting in mechanical stress,
recovery begins only very slowly and recovery is unlikely when a dose of 500 ARUs is
exceeded, resulting in 25 dB CTS. In such cases, amount of PTS is usually about 0.6 of the
loss at 30 minutes and corresponds to hair cell loss.
A dose of 500 ARUs is ‘just safe,’ recovery should be within 24h. A ‘safe’ dose is thought to
be 200 ARUs, at which there is no predicted threshold shift. AHAAH is a software product
managed by the U.S. Army Research Laboratory (ARL). It can be downloaded at
http://www.arl.army.mil/ahaah.
The model is extremely flexible; however, the input is a digital pressure history which must
be edited prior to analysis to remove (for want of a better word) noise, which requires
considerable experience
The AHAAH is a good predictor of damage from single rifle impulses, however the NATO
expert group disagreed on several points as follows. (North Atlantic Treaty Organisation,
2003)
“A single measure of impulse sound exposure enabling adequate prediction of auditory
hazard from impulses with durations from 0.2 to 5 ms, or longer in reverberant conditions,
should ideally be based on nonlinear elements in exposure assessment that account for the
protective action of high-level low-frequency energy in the impulse. The only method based
on this principle, which is presently available, is the Auditory Hazard Assessment Algorithm
for the Human ear (AHAAH). However, RSG-029 disagrees on the general validity of this
method.” Shortcomings of the model being in the exposure level-number of impulses trade-
off, with ARUs being additive, and the reliance on activation of the middle ear protective
mechanism.
The LIAeq100ms.
LIAeq100ms is a metric that employs the “equal energy” model characterizing the equivalent
total energy of the impulse calculated for 100 milliseconds (ms). The LIAeq100ms metric can be
used to compute a noise dose relative to a single occurrence impulsive noise and the
impulsive dose from one or many shots can be added with the dose from continuous noise.
In this way, the LIAeq100ms metric could be used to assess the noise exposure dose from
combined continuous and impulsive noise exposure.
23
The NATO recommendations
The present NATO recommendations by their expert panel (RSG-029) (NATO, 2003)
synthesised all the above studies and made the following recommendations.
1. At present RSG-029 cannot propose a single measure, or assessment method, that
enables adequate prediction of auditory hazard from impulse noise for impulses from light
calibre weapons with impulse durations of 0.2 ms to those from large calibre weapons or
blasts with durations up to 5 ms.
2. The data available today allows for assessment of auditory hazard only on the basis of a
temporary shift in hearing threshold shortly after exposure and its recovery. The present
analysis is based on full recovery within 24 hours at 4 and 6 kHz. According to the data
available, this criterion can be met at either frequency when the temporary threshold shift,
2 minutes after exposure, (TTS2) does not exceed 25 dB. The limit of 25 dB applies to 95% of
the population exposed. Limited statistics do not allow an extension of the protected
fraction of the population exposed to more than 95%. This criterion is more stringent than
the criterion of 15 dB of TTS, averaged across a 1, 2, and 3 kHz, two minutes after the
exposure, not to be exceeded by more than 10% of the population exposed, which was
adopted in a previous study (RSG.6).
3. Sound exposure level (SEL – level which, if maintained constant for a period of 1 s, would
convey the same sound energy as is actually received from a noise event) can be used as a
measure to describe impulses. This avoids the sometimes difficult assessment of impulse
duration. Comparison of different frequency weightings, the widespread use and general
availability of the A-weighting, and consideration of the equal-energy concept implicit in the
use of SEL, suggest that A-weighted energy expressed as dB(A), SEL is an appropriate
measure. A further advantage is that dBA, SEL can be directly obtained from standard
measuring equipment, available in military facilities and companies.
4. For both impulse noise from rifles, and blast from explosions and large-caliber weapons,
there is a critical exposure level that should not be exceeded. For impulses from rifles
(unprotected ear, normal incidence) this critical level is 116 dB(A), SEL per impulse,
measured in free field at the location of the ear. This critical level applies for a number of
impulses, N, up to 50 at a rate of one impulse per 5 to 10 seconds. For impulses from blasts
24
(under the hearing protector, near the ear canal), this critical level is 135 dB(A), SEL per
impulse. The critical level for blasts applies when N 100 at a rate of about one per minute.
5. The critical level for rifles of 116 dB(A), SEL corresponds to about 153 dB peak level (in the
free field). This level exceeds the instantaneous sound pressure of 140 dB, up to which ISO
1999 applies, by 13 dB. Due to differences in impulse duration, no unequivocal translation
to peak level can be made for the critical level for blasts of 135 dB(A), SEL.
Analysis of impulse noise standards
The AHAAH model, based on the physiological response of the ear, is conceptually
appealing, but cannot account for noise exposure from multiple sources, and there are
problems with the software ‘as is’ so that it cannot be recommended. (Nakashima, 2015)
The problem with the LIAeq100ms is simply that no systematic performance evaluation has
been carried out.
The final selection is pragmatic, as Nakamisha says “The ideal Metric should include aspects
of auditory function, be able to account for the contributions of complex noise in various
environments.” The answer seems to be the LAeq, 8h.
Probable level of noise impulses in New Zealand
The main source of impulse noise which requires assessment is probably going to be small
arms fire. The type of weapons in common use in New Zealand are shotguns, 0.22 calibre
rifles and hunting rifles. The most comprehensive assessment of impulse noise across a
range of weapons was reported by Flamme et al. (2009) The firearms under test included a
Savage Model 110.30-06 hunting rifle, a Marlin Model 60.22 calibre rifle, a Smith and
Wesson Model 686.357 magnum handgun, a Glock model 17 (9 mm handgun), and a
Beretta model Beretta Teknys Gold Model AL391 12 gauge auto loading shotgun.
This would encompass the likely range of impulse signatures to be found in New Zealand
firers, including police and NZDF shooting small arms.
The positions measured were that occupied by the shooter's left ear when the weapon was
mounted on a gun rest secured to tripods (i.e., shooter-field); A position 150° from the line
of fire, at the distance between the muzzle and shooter's left ear (i.e., side-field) and the
location occupied by the shooter's left ear when the weapon was mounted on a gun rest on
a shooting table (i.e., shooter-table). All measurements were taken outdoors. Impulse
wave-forms were captured and digitised, which allowed comparison with all of the DRC
25
mentioned above. Risk estimates were calculated in terms of Maximum Permissible
Exposures (MPE) via each DRC for a listening condition in which the listener was directly
facing the sound source (i.e., grazing incidence to the ear).
Firearms produced typical peak levels between 159 and 164 dB SPL at the measurement
locations, except the 0.22 calibre rifle, which produced peak levels around 141 dB SPL. The
Sound Exposure Levels (The Leq normalised to 1 second) were 94 and 99 dB(A) for the 0.22
calibre rifle and between 119 and 127 dB(A) for the other weapons. The peak levels
recorded differed significantly, being lower for shooter-field. Among firearms producing
greater sound levels, pressure envelope (B) durations ranged between 12 and 33 ms,
differing by microphone location. The 0.22 rifle impulses were within the NATO criterion,
all the larger bore rifle exposures were in excess of the standard.
Meinke et al (2013 describe signals generated by .22 and .32 caliber starter pistols in the
context of noise-induced hearing loss risk for sports officials and athletes. Acoustic
comparison of impulses generated from typical .22 and .32 caliber starter pistols firing
blanks were made to impulses generated from comparable firearms firing both blanks and
live rounds. Acoustic characteristics are described in terms of directionality and distance
from the shooter in a simulated outdoor running track. Metrics include peak sound pressure
levels (SPL), A-weighted equivalent 8-hour level (LeqA8), and maximum permissible number
of individual shots, or maximum permissible exposures (MPE) for the unprotected ear.
Results: Starter pistols produce peak SPLs above 140 dB. The numbers of MPEs are as few as
five for the .22-caliber starter pistol, and somewhat higher (25) for the .32-caliber pistol.
Conclusion: The impulsive sounds produced by starter pistols correspond to MPE numbers
that are unacceptably small for unprotected officials and others in the immediate vicinity of
the shooter. At the distances included in this study, the risk to athletes appears to be low
(when referencing exposure criteria for adults), but the sound associated with the starter
pistol will contribute to the athlete’s overall noise exposure.
Epidemiological studies of impulse noise exposure
Gordon et al. (2017) reported on the recruitment of a longitudinal sample of recently retired
service members and veterans from any branch of the US military, and the results from the
first 100 participants. The background was a level of hearing loss claims at a level that
26
outstripped demand. The aim was to understand the epidemiology of hearing loss and how
it progressed following service to determine if the problems arose from prior service or
from “a variety of other causes such as occupational and/or recreational noise exposures,
head trauma(s), and chemical and ototoxic exposures experienced in their daily lives outside
of military service e or some combination of these factors”. There was particular concern
about the very high rates of ‘post deployment’ hearing loss diagnoses including acoustic
trauma, PTS, tinnitus, perforated tympanic membranes and hearing grades (H3 and H4) at
the adverse end of the scales. The 18 page, comprehensive, Lifetime Exposure to Noise and
Solvents Questionnaire (LENS-Q), divided into 3 sections, non-military occupational
exposures, military occupational exposures, and non-occupational exposures. Associations
were found with Certain factors were found to be associated with poorer hearing in both
conventional and extended-high-frequency ranges, including age, type of military branch,
years of military service, number of military deployments, noise exposure, tinnitus, and a
positive screen for post-traumatic stress disorder.
Irjens-Hansen et al. (2016) identified STSs in 226 personnel on board Royal Norwegian Navy
vessels over the 2 year period between 2010 and 2012.
STS was defined as an average change in hearing thresholds ≥ + 10 dB at 2,000 Hz, 3,000 Hz,
and 4,000 Hz in either ear, with a questionnaire measuring the frequency of occupational
and non-occupational exposure, including impulse noise, and whether the respondent had
experienced a TTS over the previous 12 months. Log binomial multivariate regression
analysis assessed the relationship between significant noise exposure determinants and STS.
Significant determinants of STS were the number of episodes of TTS in the Navy (>5, RR
2.09, 95% CI 1.21-3.62) exposure to ‘on board’ loud noise (>15h/week, RR 2.29, 95%CI 1.01-
5.18) and the number of ‘aggregate’ occupational and non-occupational gunshot exposures
(1-200, RR 2.53, 95% CI 1.04-6.15). As regards the latter, there was no increase in risk with >
200 gun shots. The low numbers did not facilitate a multivariate analysis.
Johnson et al. reported on hearing in cohort of male twins identified from the Swedish twin
registry, with a questionnaire survey and audiometry at baseline on 1114 individuals (557
twin pairs) born between 1914 and 1958 and screened between 1991–1994. Follow up
occurred between 2010–2013 (time 2) and included 583 individuals, 239 twin pairs and 105
27
individuals without their twin brother. The questionnaire included questions regarding
occupations, workplaces, and trade; time at each workplace; leisure time and military noise
exposure; occupational solvent exposure and smoking. Occupations were coded and linked
to a job exposure matrix. Expert panel classification, guided by available measurement data,
facilitated classification into gaussian noise exposure groups and the estimation of impulse
exposure according to probability. Linear quantile mixed method regression allowed
assessment of the effect of exposure variables on HTLs. Leisure time firearm noise exposure
produced a highly significant effect, a shift of about 10 dB HL at the most sensitive
frequency, 4 kHz.
Overall summary and analysis
Since the 2011 guidelines were published, two studies of Chinese workers exposed to
complex noise (Xie, 2016, Davis, 2012) have given additional insights into the effect of
complex noise. In models predictive of NIPTS, kurtosis exposure functions produce a better
fitting model. This is a ‘work in progress’, however Davis has shown that ISO 1999
underestimates the NIPTS to be found at 2, 4 and 6 kHz by at least 10-15 dB HL.
The Study by Roberts et al. (2018) using a mixed model in which baseline hearing status was
entered as an additional covariate, predicted worse thresholds than the ISO standard, more
marked at the high frequencies for the higher percentiles of hearing loss, being at least 5 dB
HL and as much as 21 dB HL (90th percentile, 6 kHz)
Whilst this is a ‘work in progress,’ assessors should be mindful that ISO 1999 is likely to
underestimate the effect on hearing when impact noise is present. It is probably
appropriate to add an additional 3-6 dB of noise exposure when assessing the audiometric
profile.
As regards impulse noise, there has been little additional data and the previous advice
should remain extant.
28
References
1. Ahroon, W.A., Flamme, G. (2016) Thoughts on MIL-STD-1474E noise limits. Journal of
the Acoustical Society of America 140(4):3147-3147. Conference paper, available
https://www.researchgate.net/publication/310760857_Thoughts_on_MIL-STD-
1474E_noise_limits
2. Atherley, G.R. and Martin, A.M. (1971), “Equivalent-continuous noise level as a
measure of injury from impact and impulse noise”. Ann Occup Hyg, Vol. 14 No. 1, pp.
11-23.
3. Brinkmann, H. (2000). Supplementary investigation of the German damage risk
criterion with the Belgian NATO small arms rifle FNC. Reconsideration of effects of
impulse noise. NATO Research Study Group RSG 29_Panel 8 - AC/243.
4. Coles, R.R., Garinther, G.R., Hodge, D.C. and Rice, C.G. (1968), “Hazardous exposure
to impulse noise”. J Acoust Soc Am, Vol. 43 No. 2, pp. 336-43.
5. Davis, R.I., Qiu, W., Heyer, N.J., Zhao, Y., Qiuling Yang, M.S., Li, N., Tao, L., Zhu, L.,
Zeng, L. and Yao, D. (2012), “The use of the kurtosis metric in the evaluation of
occupational hearing loss in workers in China: implications for hearing risk
assessment”. Noise Health, Vol. 14 No. 61, pp. 330-42.
6. Flamme, G.A., Wong, A., Liebe, K. and Lynd, J. (2009), “Estimates of auditory risk
from outdoor impulse noise II: Civilian firearms”. Noise Health, Vol. 11 No. 45, pp.
231-42.
7. Goley, G.S., Song, W.J. and Kim, J.H. (2011), “Kurtosis corrected sound pressure level
as a noise metric for risk assessment of occupational noises”. J Acoust Soc Am, Vol.
129 No. 3, pp. 1475-81.
8. Gordon, J.S., Griest, S.E., Thielman, E.J., Carlson, K.F., Helt, W.J., Lewis, M.S.,
Blankenship, C., Austin, D., Theodoroff, S.M. and Henry, J.A. (2017), “Audiologic
characteristics in a sample of recently-separated military Veterans: The Noise
Outcomes in Servicemembers Epidemiology Study (NOISE Study)”. Hear Res, Vol. 349
No. 21-30.
9. Irgens-Hansen, K., Baste, V., Bratveit, M., Lind, O., Koefoed, V.F. and Moen, B.E.
(2016), “Hearing loss in the Royal Norwegian Navy: A longitudinal study”. Noise
Health, Vol. 18 No. 82, pp. 157-65.
29
10. Johnson, A.C., Bogo, R., Farah, A., Karlsson, K.K., Muhr, P., Sjostrom, M., Svensson,
E.B., Skjonsberg, A. and Svartengren, M. (2017), “Influence of well-known risk factors
for hearing loss in a longitudinal twin study”. Int J Audiol, Vol. 56 No. sup1, pp. 63-
73.
11. Kryter, K.D., Ward, W.D., Miller, J.D. and Eldredge, D.H. (1966), “Hazardous exposure
to intermittent and steady-state noise”. J Acoust Soc Am, Vol. 39 No. 3, pp. 451-64.
12. Kryter, K.D. (1973), “Impairment to hearing from exposure to noise”. J Acoust Soc
Am, Vol. 53 No. 5, pp. 1211-34.
13. Kylin, B. (1960), “Temporary threshold shift and auditory trauma following exposures
to steady state noise. An experimental and field study”. Acta Otolaryngologica
(Suppl.) (Stockh.), Vol. 152 No. 1-93.
14. Lutman, M.E. and Spencer, H.S. (1990), “Occupational noise and demographic
factors in hearing”. Acta Otolaryngol Suppl, Vol. 476 No. 74.
15. Meinke, D.K., Finan, D.S., Soendergaard, J., Flamme, G.A., Murphy, W.J., Lankford,
J.E. and Stewart, M. (2013), “Impulse noise generated by starter pistols”. Int J Audiol,
Vol. 52 Suppl 1 No. S9-19.
16. MIL-STD-1474E Department Of Defense Design Criteria Standard: Noise Limits
17. Nakashima, A. 2015. A comparison of metrics for impulse noise exposure Analysis of
noise data from small calibre weapons. Toronto: Defence Research and
Development Canada, Toronto Research Centre.
18. Nilsson, P., et al., Anatomical changes in the cochlea of the guinea pig following
industrial noise exposure, in New Perspectives on Noise Induced Hearing Loss, R.
Hamernik, D. Henderson, and R. Salvi, Editors. 1982, Raven Press: New York.
19. NIOSH 1998. Criteria for a Recommended Standard: Occupations Noise Exposure,
Revised Criteria. Cincinnati, OH: DHHS, National Institute for Occupational Safety and
Health.
20. North Atlantic Treaty Organisation 2003. Reconsideration of the effects of impulse
noise. Available:
21. https://www.sto.nato.int/publications/STO%20Technical%20Reports/RTO-TR-
017/$$TR-017-ALL.pdf
22. Pfander, F., Bongartz, H., Brinkmann, H. and Kietz, H. (1980), “Danger of auditory
impairment from impulse noise: a comparitive study of the CHABA damage-risk
30
criteria and those of the Federal Republic of Germany”. Journal of the Acoustical
Society of America, Vol. 67 No. 2, pp. 628-633.
23. Price, G.R., Rating the hazard from intense sounds: putting theory into practice.
Scandinavian Audiology Supplementum, 1982. 16: p. 111-22.
24. Roberts, B., Seixas, N.S., Mukherjee, B. and Neitzel, R.L. (2018), “Evaluating the Risk
of Noise-Induced Hearing Loss Using Different Noise Measurement Criteria”. Ann
Work Expo Health, Vol. 62 No. 3, pp. 295-306.
25. Seixas, N.S., Neitzel, R., Stover, B., Sheppard, L., Feeney, P., Mills, D. and Kujawa, S.
(2012), “10-Year prospective study of noise exposure and hearing damage among
construction workers”. Occup Environ Med, Vol. 69 No. 9, pp. 643-50.
26. Sjostrom, M., Lewne, M., Alderling, M., Willix, P., Berg, P., Gustavsson, P. and
Svartengren, M. (2013), “A job-exposure matrix for occupational noise: development
and validation”. Ann Occup Hyg, Vol. 57 No. 6, pp. 774-83.
27. Smoorenburg GF (1982). “Damage risk criteria for impulse noise”. Hamernik, R.,
Henderson, D. & Salvi, R. (eds.) New perspectives on noise induced hearing loss
Raven Press, New York.
28. Ward, W., Glorig, A. and Sklar, D. (1959), “Temporary threshold shift from octave-
band noise: applications to damage risk criteria”. Journal of the Acoustical Society of
America, Vol. 31 No. 522-8.
29. Ward, W., Glorig, A. and Sklar, D. (1959), “Temporary threshold shift from octave-
band noise: applications to damage risk criteria”. Journal of the Acoustical Society of
America, Vol. 31 No. 522-8.73. 53(5): p. 1211-34.
30. Xie, H.W., Qiu, W., Heyer, N.J., Zhang, M.B., Zhang, P., Zhao, Y.M. and Hamernik, R.P.
(2016), “The Use of the Kurtosis-Adjusted Cumulative Noise Exposure Metric in
Evaluating the Hearing Loss Risk for Complex Noise”. Ear Hear, Vol. 37 No. 3, pp. 312
31. Zhao, Y.M., Qiu, W., Zeng, L., Chen, S.S., Cheng, X.R., Davis, R.I. and Hamernik, R.P.
(2010), “Application of the kurtosis statistic to the evaluation of the risk of hearing
loss in workers exposed to high-level complex noise”. Ear Hear, Vol. 31 No. 4, pp.
527-32.

31


![OSHA Occupational Noise [PPT]](https://img.pdfslide.us/doc/110x75/586a133a1a28abd9158b64de/osha-occupational-noise-ppt.jpg)
