Embed Size (px)
Citation preview

Ludovic Phalippou
Evidence on risk and return of private equity funds
ICPM forum May 2011

Outline of the talk
Part I: What do we know about average past returns? Academic findings on return Evidence from other datasets Why are these findings different from those trumpeted by the industry?
Part II: Benchmarking PE Academic findings on risk Benchmarking Private equity
Part III: Diseconomies of scale Drivers of return: The winner is size! Towards an explanation: Economic theory & real-world frictions
Performance studies with Thomson data
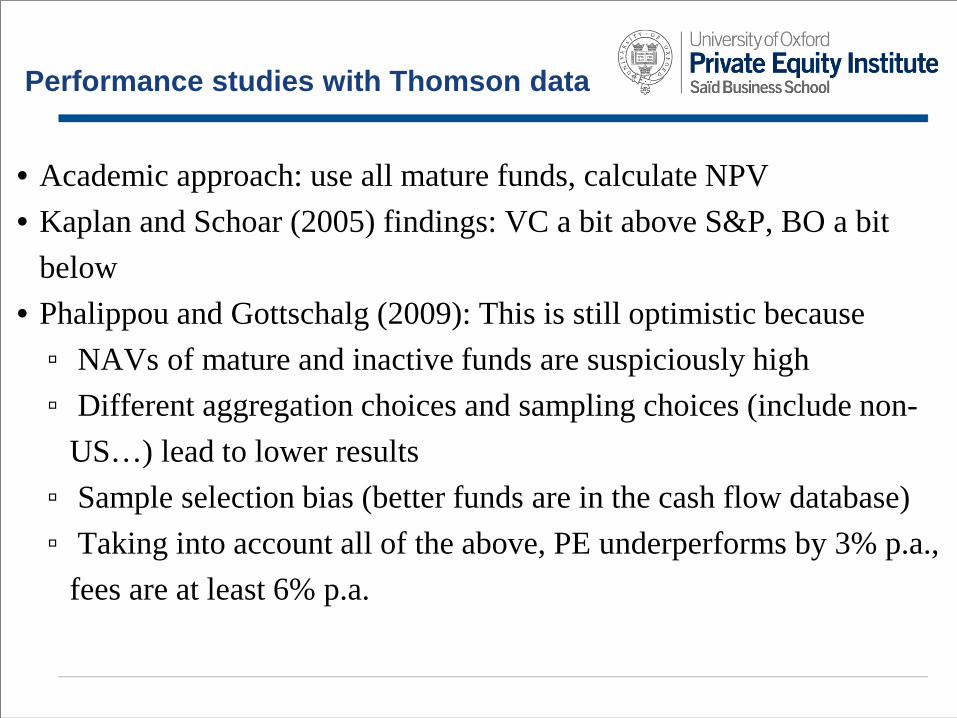
• Academic approach: use all mature funds, calculate NPV • Kaplan and Schoar (2005) findings: VC a bit above S&P, BO a bit
below • Phalippou and Gottschalg (2009): This is still optimistic because ▫ NAVs of mature and inactive funds are suspiciously high ▫ Different aggregation choices and sampling choices (include non-
US…) lead to lower results ▫ Sample selection bias (better funds are in the cash flow database) ▫ Taking into account all of the above, PE underperforms by 3% p.a.,
fees are at least 6% p.a.
Preqin data (from US pension funds)
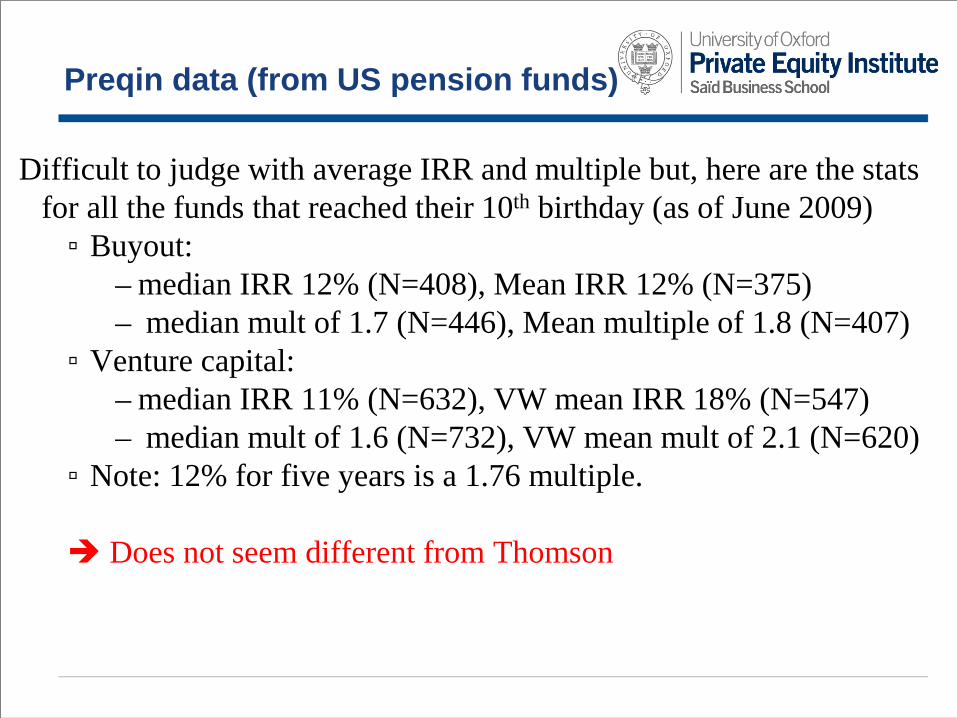
Difficult to judge with average IRR and multiple but, here are the stats for all the funds that reached their 10th birthday (as of June 2009) ▫ Buyout:
– median IRR 12% (N=408), Mean IRR 12% (N=375) – median mult of 1.7 (N=446), Mean multiple of 1.8 (N=407)
▫ Venture capital: – median IRR 11% (N=632), VW mean IRR 18% (N=547) – median mult of 1.6 (N=732), VW mean mult of 2.1 (N=620)
▫ Note: 12% for five years is a 1.76 multiple. Does not seem different from Thomson

Industry association reports
Commented by the press: “The industry is raising record amounts and returns have outstripped those from equity markets in the past few years.” (3 April 2006, Financial Times)
Why is industry report different?
• Is it the data?

No, was Thomson data until recently

Why is industry report different?
• Is it the data? ▫ No, same data source
• Is it NAV treatment? ▫ No, because Kaplan-Schoar also treated it as market value
• Is it the measurement approach (NPV vs IRR)? ▫ Maybe, but cannot be the whole story

Why is industry report different?
• Is it the data? ▫ No, same data source
• Is it NAV treatment? ▫ No, because Kaplan-Schoar also treated it as market value
• Is it the measurement approach (NPV vs IRR)? ▫ Maybe, but cannot be the whole story Answer: maybe a combination of the two IRR and conservative NAV upward bias Industry reports are NAV to NAV. When NAV is
conservative, the first and last cash flows are too small. Underestimating investment van be more important than underestimating last cash flow Bias can be x2!

Bias in industry returns
Imagine funds invest $1 million each year, hold every investment for 5 years, each investment pays a final dividend of $2 million, Calculate the end-to-end return with NAVs i) Set at cost, and ii) Marked-to-market
Outline of the talk
Part I: What do we know about average past returns? Academic findings on return Evidence from other datasets Why are these findings different from those trumpeted by the industry?
Part II: Benchmarking PE Academic findings on risk Benchmarking Private equity
Part III: Diseconomies of scale Drivers of return: The winner is size! Towards an explanation: Economic theory & real-world frictions
Traditional benchmarking?
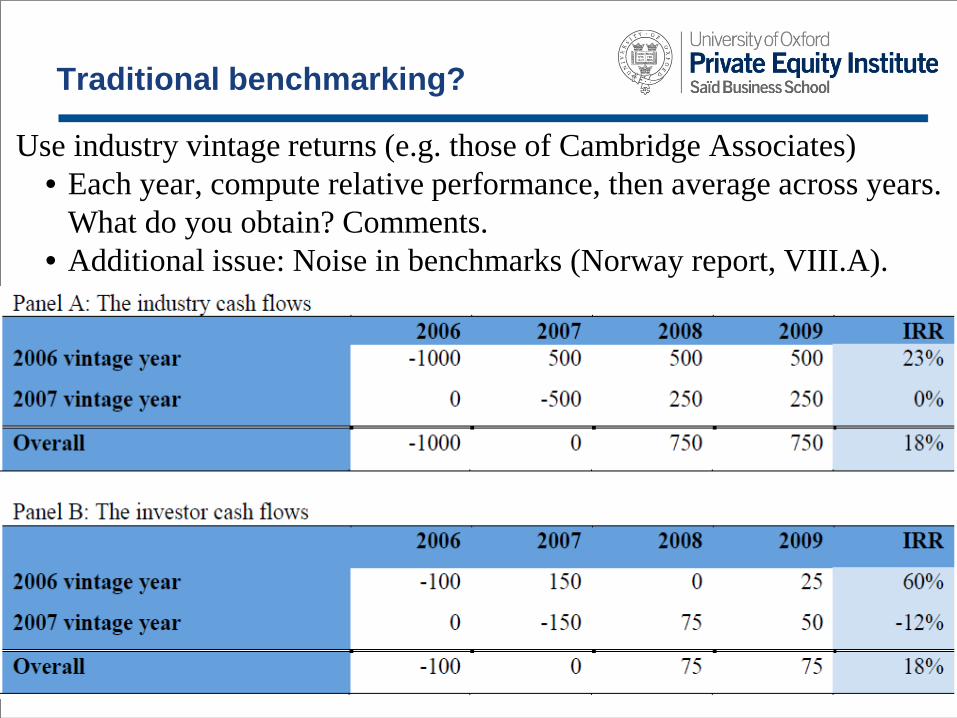
Use industry vintage returns (e.g. those of Cambridge Associates) • Each year, compute relative performance, then average across years.
What do you obtain? Comments. • Additional issue: Noise in benchmarks (Norway report, VIII.A).
Risk exposures (beta) of private equity
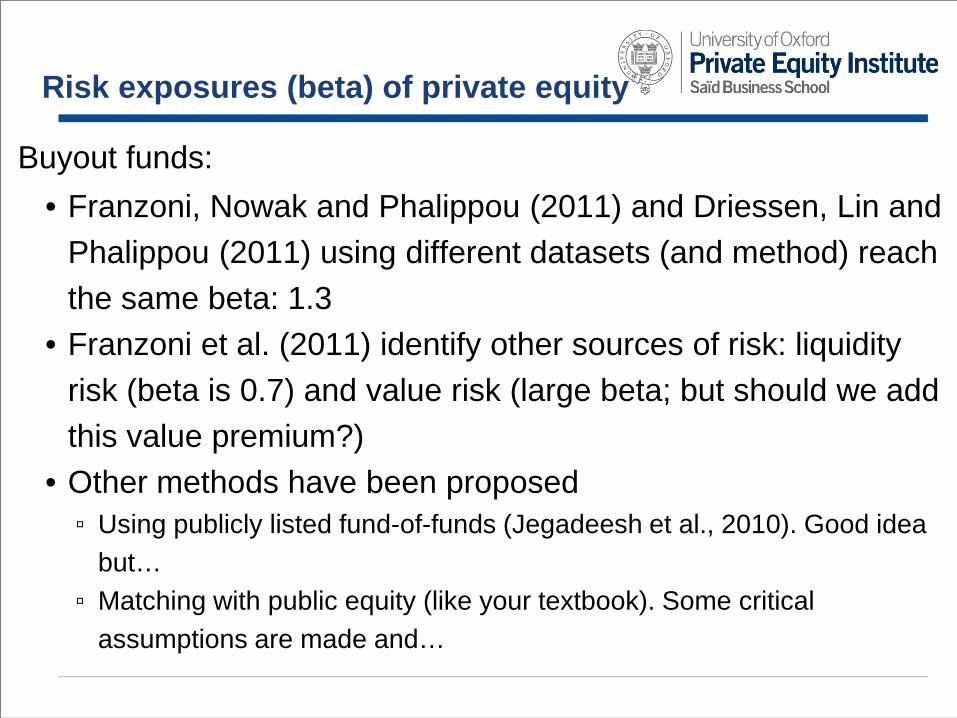
Buyout funds: • Franzoni, Nowak and Phalippou (2011) and Driessen, Lin and
Phalippou (2011) using different datasets (and method) reach the same beta: 1.3
• Franzoni et al. (2011) identify other sources of risk: liquidity risk (beta is 0.7) and value risk (large beta; but should we add this value premium?)
• Other methods have been proposed ▫ Using publicly listed fund-of-funds (Jegadeesh et al., 2010). Good idea
but… ▫ Matching with public equity (like your textbook). Some critical
assumptions are made and…

Risk exposures (beta) of private equity Buyout funds:
• Franzoni, Nowak and Phalippou (2011) and Driessen, Lin and Phalippou (2011) using different datasets (and method) reach the same beta: 1.3
• Franzoni et al. (2011) identify other sources of risk: liquidity risk (beta is 0.7) and value risk (large beta; but should we add this value premium?)
• Other methods have been proposed ▫ Using publicly listed fund-of-funds (Jegadeesh et al., 2010). Good idea but… ▫ Matching with public equity (like your textbook). Some critical assumptions are
made and…
Venture capital funds: Sorensen and Korteweg (2011) and Driessen, Lin and
Phalippou (2011) using very different datasets and method reach the same beta: 2.7
However, the wide 1999-2001 swings influence results a lot Looking forward, a beta of 2 may be more reasonable

Cost of capital of private equity
Once you have risk exposures then
• If you assess past performance: Betas get multiplied by
their corresponding realized risk premia plus realized risk
free rate
• If you assess an investment opportunity: Betas get
multiplied by their corresponding expected risk premia
plus expected risk-free rate
• Add up and you get the average cost of capital (then NPV)

Outline of the talk
Part I: What do we know about average past returns? Academic findings on return Evidence from other datasets Why are these findings different from those trumpeted by the industry?
Part II: Benchmarking PE Academic findings on risk Benchmarking Private equity
Part III: Diseconomies of scale Drivers of return: The winner is size! Towards an explanation: Economic theory & real-world frictions

Lopez-de-Silanes, Phalippou and Gottschalg (2010) find that the
most important and consistent driver of the cross-section of buyout investments performance is firm scale • Largest database on individual PE investment returns (11,000+ investments from
300+ PE firms) • Full firm track record from fund raising prospectuses • Similar coverage as commercial databases, which keep track of PE investments
(but not of performance)
Drivers of PE investment returns

Results


● Survivorship bias • Small firms that died are not present in the data • Collected information on dead firms, and added them (twice) • Firm age is not related to returns • Effect present within firms and funds
● Risk differences • Value at risk and one-side standard deviation for different
firm-scale deciles indicate that smaller firms are equally risky • Other measures are also used (e.g. portfolio volatility,
matching via industry)
● Mechanical • Tendency to hold on to losers • Stop counting investments beyond year two, four etc.
Other explanations

Is it market timing?
No, the effects are complementaries

Small is beautiful
Economic theory
Theory of the firm:
• How can two small firms be better than one firm twice as big?

Economic theory
Theory of the firm: • How can two small firms be better than one firm twice as big?
• Key trade-off: ▫ Recouping fixed costs (e.g. knowledge) ▫ Communication cost
• Implications: ▫ More hierarchical organizations will have more difficulties handling
many investments (it does not matter when there are few investments). ▫ Particularly visible in tasks where soft information is involved ▫ Number of deals made more than size of the deals

Structural Characteristics & Diseconomies of scale
1. PE firms may have different time horizons, so they may choose different growth rates: ▫ Being large increases fees today, but lower returns hurt fees in the future. ▫ Publicly traded PE firms or those run by managers closer to retirement
may opt for large size today at the cost of poorer future performance.
2. Some investors are ill-equipped to invest in PE: ▫ Firms with extensive track records may find it easier to window dress. ▫ Less sophisticated investors may be more comfortable investing in large,
well-established firms ▫ Investors may associate the quality of PE firms more closely with a handful
of highly successful investments than with the full track record. 27
An equilibrium? How do large firms survive?

3. Some investors invest in PE for reasons other than returns: ▫ Large PE firms generate substantial investment banking fees that could
lead some investors to back investments in hopes of earning the fees. ▫ Large investors are invited to co-invest in selected investments without
paying fees. So, large PE firms may increase the returns of their most sophisticated investors.
▫ Many investors are forced to invest large amounts in PE, an obligation that causes them to focus on large-scale firms.
4. Investors do not find it easy to back-test fund-selection strategies: ▫ Learning and optimally adjusting firm size a difficult task. It took us several
years to build our own dataset!!! ▫ Arbitrage is difficult in PE, as investors cannot really pick and choose; they
must take all the investments in a fund. 28
An equilibrium? How do large firms survive?

Outline of the talk
Part I: What do we know about average past returns? Academic findings on return Evidence from other datasets Why are these findings different from those trumpeted by the industry?
Part II: Benchmarking PE Academic findings on risk Benchmarking Private equity
Part III: Diseconomies of scale Drivers of return: The winner is size! Towards an explanation: Economic theory & real-world frictions

Summary
Measuring performance is difficult
Industry data suffer from a number of issues: sample bias,
survivorship bias, but also methodology bias
Better methods (but same data quality) suggest that
average PE performance is in line, or below, public equity
performance
Beta for buyout is around 1.3; it is more for venture capital
Better benchmarking is achieved with NPV
Firm scale is the main driver of returns

Contact and further reading
Ludovic Phalippou SBS – University of Oxford Park end street OX1 1HP – Oxford, UK [email protected] All my papers are available at: http://papers.ssrn.com/sol3/cf_dev/AbsByAuth.cfm?per_id=337309