Embed Size (px)
Citation preview

Atmos. Chem. Phys., 12, 8021–8036, 2012www.atmos-chem-phys.net/12/8021/2012/doi:10.5194/acp-12-8021-2012© Author(s) 2012. CC Attribution 3.0 License.
AtmosphericChemistry
and Physics
Evidence of an elevated source of nucleation based on modelsimulations and data from the NIFTy experiment
P. Crippa1, T. Petaja2, H. Korhonen3, G. S. El Afandi4, and S. C. Pryor1
1Atmospheric Science Program, College of Arts and Sciences, Indiana University, Bloomington, IN 47405, USA2Department of Physics, University of Helsinki, Helsinki, Finland3Finnish Meteorological Institute, Kuopio Unit, Kuopio, Finland4College of Agricultural, Environment and Nutrition Sciences – College of Engineering, Tuskegee University, Tuskegee,AL 36088, USA
Correspondence to:P. Crippa ([email protected])
Received: 5 March 2012 – Published in Atmos. Chem. Phys. Discuss.: 9 May 2012Revised: 9 August 2012 – Accepted: 26 August 2012 – Published: 10 September 2012
Abstract. New particle formation has been observed at anumber of ground-based measurement sites. Prior researchhas provided evidence that this new particle formation, whileobserved in the near-surface layer, is actually occurring in at-mospheric layers above the surface and appears to be focusedin or close to the residual layer formed by the nocturnal in-version. Here, we present both observations and modelingfor southern Indiana which support this postulate. Based onsimulations with a detailed aerosol dynamics model and theWeather Research and Forecasting model, along with datafrom ground-based remote sensing instruments and detailedgas and particle phase measurements, we show evidence that(i) the maximum rate change of ultrafine particle concentra-tions as observed close to the surface is always preceded bybreakdown of the nocturnal inversion and enhancement ofvertical mixing and (ii) simulated particle size distributionsexhibit greatest accord with surface observations during andsubsequent to nucleation only when initialized with a parti-cle size distribution representative of clear atmospheric con-ditions, rather than the in situ (ground-level) particle size dis-tribution.
1 Introduction and objectives
Particle nucleation has been observed with high frequency ata geographically diverse suite of ground-based measurementsites (Kulmala et al., 2011) and plays a key role in determin-ing the ambient particle size distribution (Spracklen et al.,
2006), but the controls and limitations on nucleation occur-rence and growth remain uncertain. Key uncertainties per-tain, in part, to mechanistic deconvolution of the chemicaland physics controls and include questions regarding vari-ation of nucleation intensity and mechanisms with height,and specifically whether nucleation occurs principally withinthe atmospheric boundary layer or is initiated at or close tothe residual layer (or free troposphere) (Boulon et al., 2011;Crumeyrolle et al., 2010; Pierce et al., 2012; Stratmann et al.,2003; Wehner et al., 2010). Indications of a link between theoccurrence and intensity of nucleation and boundary layerdynamics is provided by observations that enhancement ofturbulent kinetic energy, associated with entrainment and de-velopment of the boundary layer, is frequently observed justprior to the appearance of newly formed particles in themixed layer (Nilsson et al., 2001; Pryor et al., 2011). Further,balloon-borne observations during the SATURN experimentnear Leipzig in Germany provided evidence that prior to thebreak-up of the nocturnal inversion nucleation was focusedon the residual layer and, subsequent to erosion of the inver-sion and growth of the boundary layer, nucleation was ob-served throughout the planetary boundary layer (Stratmannet al., 2003; Wehner et al., 2007). Additional evidence for anelevated source of nucleated particles at continental sites inEurope was provided by data collected near Cabauw in theNetherlands in the IMPACT field campaign (Wehner et al.,2010). In that research vertical profiles of particle size dis-tributions were taken in a helicopter borne package and theevolution of the boundary layer was observed using a lidar
Published by Copernicus Publications on behalf of the European Geosciences Union.
8022 P. Crippa et al.: Evidence of an elevated source of nucleation
system. As in the SATURN experiment, analysis of the IM-PACT measurements led the authors to infer that nucleationlikely started higher in the atmosphere and the newly formedparticles were subsequently mixed downward (Wehner et al.,2010). The IMPACT authors postulate that the strong ver-tical variability of new particle formation is a result of en-hanced turbulence and non-linear mixing in specific layerswhich resulted in supersaturation of precursor gases cou-pled with vertical heterogeneity of in situ aerosol concentra-tions and thus variations in the condensational sink leadingto enhancement or suppression of nucleation. It should benoted that not all investigators have found evidence for anelevated nucleation source. Data collected using an instru-mented aircraft and micro-light flown over the Hyytiala siteduring 28 March 2003 are indicative of a surface-based parti-cle source, with subsequent vertical dispersion as the mixed-layer grew (Laaksonen et al., 2008). Here we examine thisissue further using: (i) data from the Nucleation In ForesTs(NIFTy) experiment in southern Indiana in conjunction withsimulations conducted using the Weather Research and Fore-casting (WRF) model and (ii) a novel approach based onthe application of a parameterized multi-component parti-cle model (i.e. the University of Helsinki MulticomponentAerosol (UHMA) model). Specifically we use the UHMAmodel to examine the sensitivity of nucleation and growth tothe prevailing chemical and physical environmental condi-tions (i.e. abundance of nucleation precursors and condensa-tional sink) in order to theorize the region of the atmospherein which nucleation is initiated. On the basis of the sensitiv-ity analysis conducted using as input to the model conditionsobserved close to the ground versus those associated with anelevated source of nucleation we infer that nucleation is initi-ated aloft. Supporting evidence for these assertions is drawnfrom ground-based particle size distribution measurements,observed and modeled profiles of the meteorological stateparameters and lidar backscatter measurements.
2 Methods
2.1 NIFTy
During the Nucleation In ForesTs (NIFTy) experiment, con-ducted between 5 and 31 May 2008, particle physical andchemical properties, gas phase concentrations and meteo-rological parameters of state were measured at three loca-tions along an 80 km transect in southern Indiana from Indi-anapolis in the northeast to the small college town of Bloom-ington in the southwest (Pryor et al., 2011). The primarymeasurements used herein were collected during the laterportion of the NIFTy experiment (14–27 May) at the Mor-gan Monroe State Forest (MMSF) tower site, centrally lo-cated along this transect, when the most complete set ofmeasurements was available. A Scanning Mobility ParticleSizer (SMPS) system from TSI Inc. (SMPS 3936) and a
Fast Mobility Particle Sizer (FMPS 3091) (TSI, Inc.) weredeployed at MMSF to measure simultaneously particle sizedistributions from a height of 46 m (above a canopy of 28m). The SMPS system comprised an Electrostatic Classifier(Model 3080), a nano-DMA (Model 3085) and a Conden-sation Particle Counter (Model 3786), and measured num-ber concentrations in 80 logarithmically-spaced size chan-nels from 3.22 to105.5 nm. The FMPS reported number con-centrations in 32 logarithmically-spaced size channels from6.04 to 523.3 nm. Measured particle concentrations fromboth instruments were corrected using the experimentally de-rived tubing particle transmission efficiencies presented inPryor et al. (2010). Discontinuous measurements of ammo-nia (NH3) concentrations above the canopy were made usinga Wet Effluent Diffusion Denuder (WEDD) system (Pryoret al., 2001). Thirty-minute average concentrations of SO2and H2SO4 were measured below the forest canopy using aTECO (model 43S) monitor and a Chemical Ionization MassSpectrometer (CIMS) (Eisele and Tanner, 1993; Mauldin etal., 2003; Petaja et al., 2009). The CIMS was also operatedto provide estimated hydroxyl radical (OH) concentrationsclose to the ground during 23–29 May. These measurementswere used to derive a composite 30 s diurnal profile of OHconcentrations during event and non-event days for use inthe UHMA modeling. VOC concentrations were measuredat the canopy top in six approximately 2-h intervals start-ing at 09:00 (LST) on multi-sorbent cartridges at flow rateof 27 ml min−1 following the EPA Method TO-17 and ana-lyzed for isoprene,α-pinene, limonene, cumene (isopropy-lbenzene), benzene, toluene, ethyl benzene, o-, m-, and p-xylene. In order to make composites of multiple event daysin this analysis, following the approach used in Pryor etal. (2011), all times were converted to a normalized scale inwhich the time is presented relative to the maximum gradient(i.e. rate change) in 10 nm particle number concentrations.
Meteorological conditions at the site were measured usingmicrometeorological equipment installed on this AmeriFluxtower, a scanning doppler lidar (Natural Power ZephIR li-dar), a Vaisala tethersonde and a Vaisala ceilometer (CL31)(see Pryor et al., 2011 for a full description of the instrumen-tation deployed at MMSF).
Long-term measurements at the MMSF site indicate evi-dence of elevated concentrations of ultra-fine particles (Dp:6–30 nm) on approximately 1 day in 5 (Pryor et al., 2010),with a highest frequency in May, consistent with observedhigh concentrations of ultra-fine particles on nearly half of allsampling days during NIFTy (Table 1) (Pryor et al., 2011).
2.2 UHMA model
The UHMA model is a box-model containing parameteriza-tions of the dynamics of multicomponent particles includ-ing nucleation (based on parameterization of binary, ternaryand kinetic nucleation), condensation, coagulation and drydeposition (Korhonen et al., 2004). In this study the particle
Atmos. Chem. Phys., 12, 8021–8036, 2012 www.atmos-chem-phys.net/12/8021/2012/
P. Crippa et al.: Evidence of an elevated source of nucleation 8023
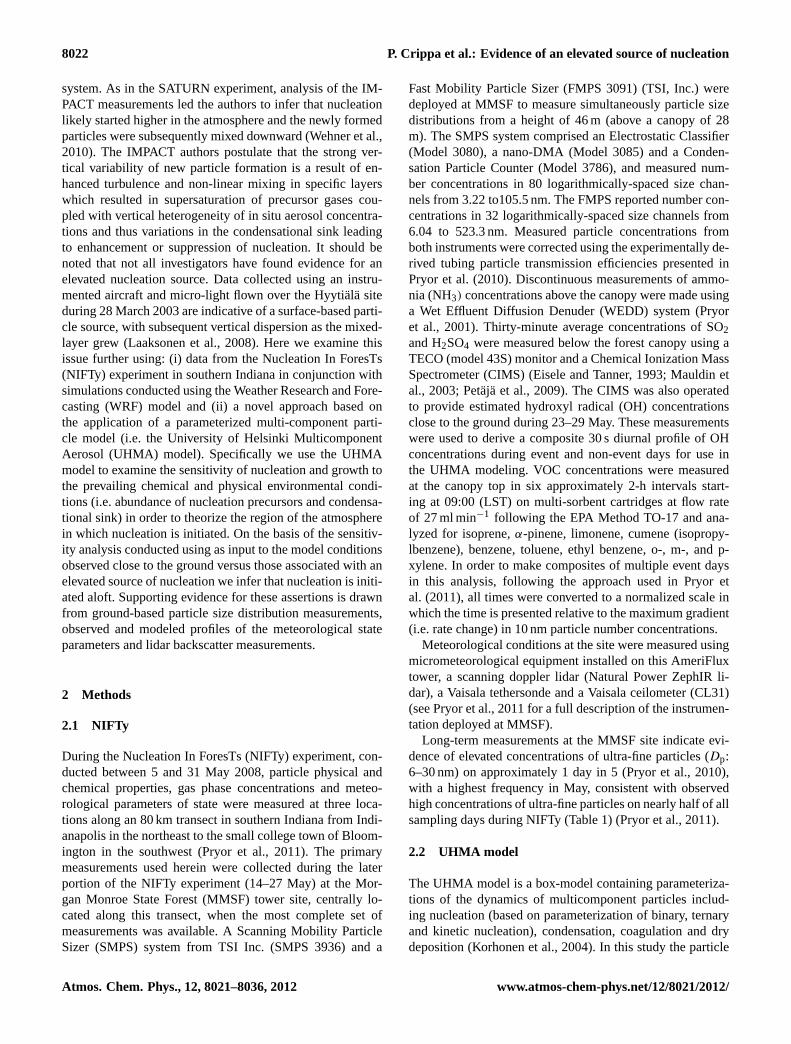
Table 1. Classification of event days at the MMSF site during the NIFTy experiment for 14–27 May based on the subjective classificationof (Boy and Kulmala, 2002). The hour of maximum rate change of 10 nm particle concentrations (start hour) is provided in local standardtime (LST). Observed nucleation intensities [cm−3], computed as the number of particles with diameter between 10 and 30 nm in the twohours of highest concentration, are shown in the 4th column. The final three columns show model simulation results setting 250 sections andinitializing the model with the measured particle size distribution (measured PSD) and clear atmospheric conditions (clear case) wherein thePSD is as described by (Seigneur et al., 1986).
Observations SMPS (and FMPS) Simulations
Day Event Start Nucleation Initialized Nucleation Nucleationhour Intensity [cm−3] with measured Intensity [cm−3] Intensity [cm−3](LST) from the SMPS PSD (measured PSD) (clear case)
14 Non-event (Non-event) Non-event Non-event Non-event Non-event Non-event15 Non-event (Non-event) Non-event Non-event Non-event Non-event Non-event16 C (C) 9 3.58 × 10⁴ A 1.48 × 10⁵ 1.87 × 10⁵
17 A (A) 9 1.06 × 10⁵ A 4.13 × 10⁴ 1.54 × 10⁵
18 C (C) 10 5.17 × 10⁴ C 3.65 × 101 1.20 × 10⁵
19 A (A) 9 6.95 × 10⁴ C 7.12 × 101 1.80 × 10⁵
20 B (B) 13 1.18 × 10⁴ A 2.10 × 10³ 9.06 × 10⁴
21 A (A) 8 2.47 × 10⁴ A 1.88 × 10² 9.17 × 10⁴
22 A (A) 9 4.90 × 10⁴ A 5.37 × 10⁴ 1.41 × 10⁵
23 Non-event (Non-event) Non-event Non-event Non-event Non-event Non-event24 A (A) 10 2.22 × 10⁴ A 3.26 × 10⁴ 1.84 × 10⁵
25 A (C) 9 5.37 × 10⁴ A 3.83 × 10³ 1.92 × 10⁵
26 Non-event (Non-event) Non-event Non-event Non-event Non-event Non-event27 Non-event (Non-event) Non-event Non-event Non-event Non-event Non-event
size distribution (PSD) is treated using a fixed sectional dis-cretization of the size distribution in the modified versionof the hybrid grid (Jacobson and Turco, 1995), which doesnot require any assumption regarding the PSD and allowsus to describe accurately the variability associated with fieldmeasurements (Spracklen et al., 2005). Since only condensedcore compounds need to be split among size sections, numer-ical diffusion is reduced (Jacobson and Turco, 1995). Hereinwe employ the UHMA model using the following assump-tions:
– The temporal variation of boundary layer depth(andthus box model volume in which concentrations areassumed to be homogeneous) is simulated using apseudo-sinusoidal profile evolving between 06:00 and21:00 (LST) with maximum of 1000 m and minimumof 300 m (this minimum is maintained throughout thenighttime hours) based on data obtained from a teth-ersonde system deployed during NIFTy and confirmedbased on simulations conducted using the WRF model.All other physical state parameters (e.g. temperatureand humidity) are input hourly to the model based onobserved conditions at 46 m.
– Particle removal. Within the original UHMA modeldry deposition processes are described by a semi-empirical parameterization validated for the boreal for-est in Hyytiala, Finland (Rannik et al., 2003). Deposi-tion velocities over deciduous forests have been shown
to be lower than those measured over boreal forests(Pryor et al., 2009), thus we implemented a physical pa-rameterization of dry deposition (Slinn, 1982; Pryor andBinkowski, 2004) constrained to match observed size-resolved particle deposition velocities of sub-100 nm di-ameter particles as measured at the MMSF site (Pryor etal., 2009). No removal by wet deposition was parame-terized.
– A simplified gas phase chemical mechanismwas imple-mented following the work of (Boy et al., 2005) (Table 2and Table 3) and was solved using the Euler BackwardIterative approach. Observed concentrations of the in-organic gases (SO2 and NH3) and condensable organicgases were provided at hourly resolution to the model.Because we did not have direct observations of semi-volatile organic compounds, the concentration of thecondensable organics was estimated from the observa-tions of isoprene, a-pinene, cumene, limonene, benzene,toluene, ethyl-benzene, (m,p)-xylene, and (o)-xyleneusing Fractional Aerosol Coefficients (FAC) (Grosjean,1992). The concentration of biogenic compounds wasobserved to be approximately twice that for the an-thropogenic VOCs (Pryor et al., 2011), thus while onlyone lumped reaction was implemented for the anthro-pogenic VOCs, the reaction of biogenics with both OHand ozone was included (see Table 2). It is acknowl-edged that this approach neglects factors such as the
www.atmos-chem-phys.net/12/8021/2012/ Atmos. Chem. Phys., 12, 8021–8036, 2012

8024 P. Crippa et al.: Evidence of an elevated source of nucleation
Table 2.Chemical reactions implemented within the UHMA model (Reference 1= (Hertel et al., 1993), 2= (Boy et al., 2006), 3= (Seinfeldand Pandis, 2006), 4=, Simpson et al., 1997). Second order rate constants are expressed in [ppb−1 s−1] for a temperature of 298K. Photolysisrate constants are expressed in s−1 and computed asJ = l × (cos2)m × e−n×sec2, wherein2 is the solar zenith angle. Typical peak valuesof photolysis rate constants for the MMSF site during a clear sky day in May are reported.
Reaction Rate constant Reference
SO2+OH=H2SO4+HO2 2.50 × 10⁻² 1NO2+OH=HNO3 2.72 × 10⁻¹ 1OH+CO=HO2 6.67 × 10⁻³ 1O3+OH=HO2 1.67 × 10⁻³ 1HCHO+OH=HO2+CO 2.50 × 10⁻¹ 1HO2+HO2 = H2O2+O2 6.91 × 10⁻² 1Biogenic organics+ OH = products 1.32 3Anthropogenic organics+ OH = products 1.53 × 10⁻¹ 1α-pinene+ O3 = products 2.13 × 10⁻⁶ 3H2+OH=HO2+H2O 1.65 × 10⁻¹ 2HO2+NO=OH + NO2 2.00 × 10² 3HO2+O3 =OH + 2O2 4.76 × 10⁻² 3O3 =0.2OH+0.8O3(P) 3.05 × 10⁻⁴ 4HCHO=2HO2+ CO 3.21 × 10⁻⁴ 4
Table 3. Input concentrations [ppb] to the chemical mechanismbased on Boy and Kulmala (2002) and typical spring values mea-sured in Southern Indiana by the Indiana Department of Environ-mental Management.
Compound Concentration [ppb]
O3 30NO2 5NO 2.5CO 800HCHO 10CH4 1900H2 500HO2 3.7 × 10⁻³
relationship with condensed mass (Griffin et al., 2003),but it is applied here to broadly represent the poten-tial for the production of oxidation products with lowvolatility that might partition into the particle phase.
– Comprehensive evaluations ofnucleation parameter-izations (Zhang et al., 2010a, b; Sihto et al., 2006)have illustrated the challenge of selecting a theoreti-cally appropriate nucleation parameterization and thehuge range of variation of model skill when predictionsbased on differing parameterizations are compared toobserved number concentrations (e.g. up to 3 orders ofmagnitude variations for the Aitken and accumulationmode). In order to select which of the nucleation param-eterizations was optimal for the simulations in south-ern Indiana, we used the approach of Sihto et al. (2006)and Kuang et al. (2008) to examine the functional rela-
tionship between ultra-fine particle nucleation rate andobserved sulfuric acid concentrations ([H2SO4]). If nu-cleation can be described using the activation approach,then the formation rate of new particles should scale lin-early with [H2SO4]. If the nucleation process is best de-scribed by the kinetic approach then the formation ratewill tend to scale with the square of [H2SO4], while ifit follows the ternary nucleation theory, with the criticalcluster comprising NH3, H2SO4 and water molecules,the exponent should exceed 3 (Sihto et al., 2009). Thus:
J(1nm)= K × [H2SO4]n (1)
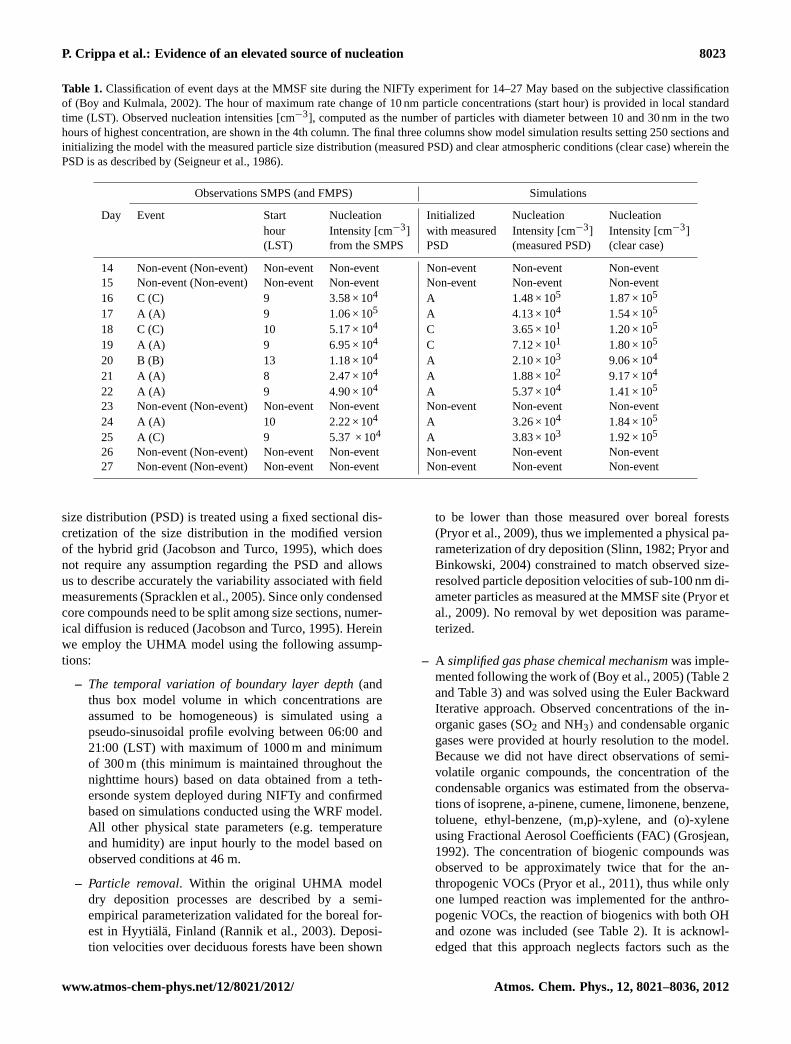
where n represents the number of sulfuric acidmolecules in each critical cluster. The best linear fit ofthe logarithm of the nucleation rate and the logarithmof sulfuric acid concentration for class A events duringNIFTy provided a value ofn of 1.78 andK of around10−14 (Fig. 1).J1 was computed based on (Kuang et al.,2008):
J1(t) = J 10(t+1t) × exp
[1
2×
AFUCHS
GR1−10×
√48kBT
π2ρ
×
(1√Dp1
−1√Dp10
)](2)
whereJ10 was derived from the measured PSD fromthe SMPS and the median Fuchs surface area of the pre-existing particles duringt + 1t was computed as:
Atmos. Chem. Phys., 12, 8021–8036, 2012 www.atmos-chem-phys.net/12/8021/2012/

P. Crippa et al.: Evidence of an elevated source of nucleation 8025
Fig. 1. Relationship between the base 10 logarithm of sulfuric acidconcentrations [cm−3] and the base 10 logarithm of the nucle-ation rate of 1 nm particles [cm−3s−1] during nucleation hours ofclass A events. The estimated regression coefficients are statisti-cally significant, giving a regression line of Log10J1 = −14.39×
Log10[H2SO4
]1.78. The 90 % confidence intervals forK ([−21.28,−7.51]) andn ([0.81, 2.75]) are also shown.
AFUCHS=4
3π ×
Dp10∫Dp6
D2p
×
(Kn + Kn2
1+ 1.71Kn + 1.33Kn2
)n(Dp)dDp (3)
wheren(Dp)
is the number concentration of particlesof diameterDp.
The Knudsen number is defined as:
Kn =2λ
Dp(4)
whereλ is assumed to be 100 nm (Kuang et al., 2008),the particle density,ρ is 1.3 kg m−3 andkB is the Boltz-mann constant. An average1t of 0.5 h was estimatedfrom the time shift required to match the measured sul-furic acid concentrations with the 6–10 nm diameter av-erage particle number concentrations. Based on the re-sults of the analysis of the nucleation rate as a functionof sulfuric acid concentrations we chose to apply a ki-netic approach to nucleation where the prefactorK isderived from the basic kinetic theory, assuming nucle-ation to be limited by the collision rate of sulfuric acidmolecules (Seinfeld and Pandis, 2006), rather than esti-mated from observations (Sihto et al., 2006).
We need to acknowledge the regression fit betweenlog[H2SO4] and log(J1) is highly sensitive to the fittingtime length since a fit conducted only on the duration ofeach nucleation event would provide higher slope val-ues (Kuang et al., 2008). Because of the relative lowtemporal resolution of the available sulfuric acid mea-surements we fitted the model over a larger time spanthan has been previously used.
– Initial particle size distribution.For the base case sim-ulations, the model was initialized using the PSD mea-sured by the FMPS at midnight (LST) of each simulatedday (14–27 May 2008). In order to reduce the sensitiv-ity to measurement uncertainty in each size bin, the datafrom the FMPS were fitted to three log-normal modes(see the example in Fig. 2). The geometric mean diam-eter, standard deviation and number concentration fromthese modes were then used to derive the initial numberconcentration in each of the model size sections. Themodel was then run for 24 h and evaluated over the sametime period.
The time-step of the simulations was set to 10 s. A sensitiv-ity analysis was undertaken to assess model performance as afunction of the number of sections used to describe the PSD,but for all other simulations, 250 sections equally spaced in alogarithmic scale in the range of diameters between 3 nm and10 µm, were used to match the discretization of the PSD forthe sub 100-nm particles from the SMPS operated at MMSFin order to facilitate the evaluation of the model fit to the data.
Since the UHMA model has been previously theoreticallyvalidated (Korhonen et al., 2004), herein we use statisticalmetrics not to evaluate the model per se but as a diagnostictool. Three primary metrics of model performance are used:
a. The presence, absence and “type” of nucleation event asdefined using a subjective event classification (Boy andKulmala, 2002):
class A: a new sudden particle mode appears inthe diameter range below 25 nm and it persists andgrows for more than 1 h.
class B: a new particle mode is present but it isnot visible at the smallest measured diameters. Thecomputation of the growth rate may be uncertainbecause of high variations in the mode number con-centration.
class C: a new particle mode is present but does notshow a clear growth.The day was defined as non-event if the aforemen-tioned conditions are not met (see Table 1 for asummary of the observed data from the SMPS andFMPS in terms of the event classification).
b. The skill of the UHMA model in predicting the particlenumber size distribution is quantified by metrics such as
www.atmos-chem-phys.net/12/8021/2012/ Atmos. Chem. Phys., 12, 8021–8036, 2012

8026 P. Crippa et al.: Evidence of an elevated source of nucleation
Fig. 2. Fit of the initial PSD to a three lognormal function usingdata measured by the FMPS at 00:00 LST for(a) an example A-event day (19 May) and(b) a non-event day (26 May).
nucleation intensity, the growth rate and the timing ofthe peak number concentration. Nucleation intensity isquantified as the total number of particles with diameterbetween 10 and 30 nm during the two hours with thehighest total number concentration:
Intensity=2∑
h=1
30∑Dp=10
Nh,Dp (5)
The growth rate is defined as the rate at which the num-ber geometric mean diameter (DgN) in the nucleationmode (6–30 nm) evolves:
lnDgN=
30∑j=6
nj × lnDj
N6−30(6)
where lnDgN is the value of lnD weighted accordingto the number of particles in that size interval,nj is thenumber of particles in a group whose diameters are cen-tered aroundDj andN6−30 is the total number of parti-cles in the diameter range of 6–30 nm. The growth rateis computed fitting a first order polynomial to the num-ber geometric mean diameters occurring in the threehours subsequent to the minimumDgN. The time dif-ference (1t) between the occurrence of maximum ob-served and simulated number concentration of particlesof size 6–30 nm was also computed:
1t = t(maxNobs
6−30
)− t
(maxNsim
6−30
)(7)
2.3 WRF simulations
The Weather Research and Forecasting model Version 3(WRFV3), applied using the physics schemes listed in Table4, was used to simulate meteorological conditions during 11–26 May 2008 over a parent domain (324×274 grid cells witha spatial resolution of 9 km) and a nested domain (310×259grid cells with a spatial resolution of 3 km) (Fig. 3). Themodel was run using the Advanced Research WRF (ARW)solver in the non-hydrostatic mode with 35 vertical levelsand initialized with lateral boundary conditions as simulatedby the North American Mesoscale Model (NAM). The landcover data were specified from the USGS 24-category data ata resolution of 3.7 km and 0.9 km for the parent and nesteddomain respectively. The WRF simulations were conductedprincipally to examine the vertical evolution of the planetaryboundary layer and thus the primary physics scheme of in-terest to the current work is the PBL package. The Mellor-Yamada-Janjic scheme (a TKE-based 2.5-level closure) wasselected because it is relatively computationally efficient, hasbeen widely used in prior research and has been demon-strated to generate relatively representative temperature pro-files and PBL heights in applications elsewhere (Hu et al.,2010).
3 Results
3.1 Evidence for an elevated source of nucleation fromobservations
As described below, observations of meteorological param-eters at the MMSF site support the hypothesis of nucleationinitiation above the surface with subsequent entrainment ofthe freshly nucleated particles into the mixed layer.
Turbulence intensity as measured with the ZephIR lidar in-dicates a strong link between the occurrence of high concen-trations of ultra-fine particles at the MMSF site and boundarylayer dynamics. The greatest increase in the number concen-tration of 6–10 nm particles occurs approximately one hourprior to the peak of nucleation intensity at 46 m during class
Atmos. Chem. Phys., 12, 8021–8036, 2012 www.atmos-chem-phys.net/12/8021/2012/

P. Crippa et al.: Evidence of an elevated source of nucleation 8027
Longitude
Latit
ude
Fig. 3. Parent and nested domain simulated by WRF imposing aspatial resolution of 9 km and 3 km respectively. The location of theMMSF site is also shown.
Table 4.Physics schemes (Skamarock et al., 2008) adopted for theWRF simulations.
Physics option Adopted scheme
Microphysics WRF Single-Moment 6-classLongwave Radiation Rapid Radiative Transfer Model (RRTM)Shortwave Radiation DudhiaSurface layer EtaLand Surface Noah Land Surface ModelPlanetary boundary layer Mellor-Yamada-JanjicCumulus parameterizations Kain-Fritsch
A events (Fig. 4a). Nearly simultaneously turbulence inten-sity rapidly increases from low values throughout the lowest300 m of the atmosphere (representative of a stable noctur-nal atmosphere) to more turbulent conditions associated witherosion of the nocturnal inversion and development of a fullymixed planetary boundary layer (Fig. 4b). Thus erosion ofthe nocturnal inversion and increased vertical mixing alwayspreceded the maximum concentration of ultra-fine particlesand was observed to precede the maximum rate change ofultrafine particle concentrations by approximately 0.5 h.
Further evidence supporting the hypothesis of an elevatedsource of nucleation is provided by the analysis of the con-densational sink (CS) (Kulmala et al., 2001; Dal Maso et al.,2002) measured in the surface layer (at 46 m) during eventclass A days. The CS is a metric quantifying the role of pre-existing particles in removing condensable vapors from theatmosphere, thus a high CS is expected to suppress nucle-ation. As in research conducted elsewhere, there is a lackof correspondence between the observed CS in near-surfacemeasurements just prior to the largest rate change of ultrafineparticles and the concentration of ultrafine particles (Fig. 5)(Boulon et al., 2011). This also supports our speculation ofan elevated initiation of nucleation.
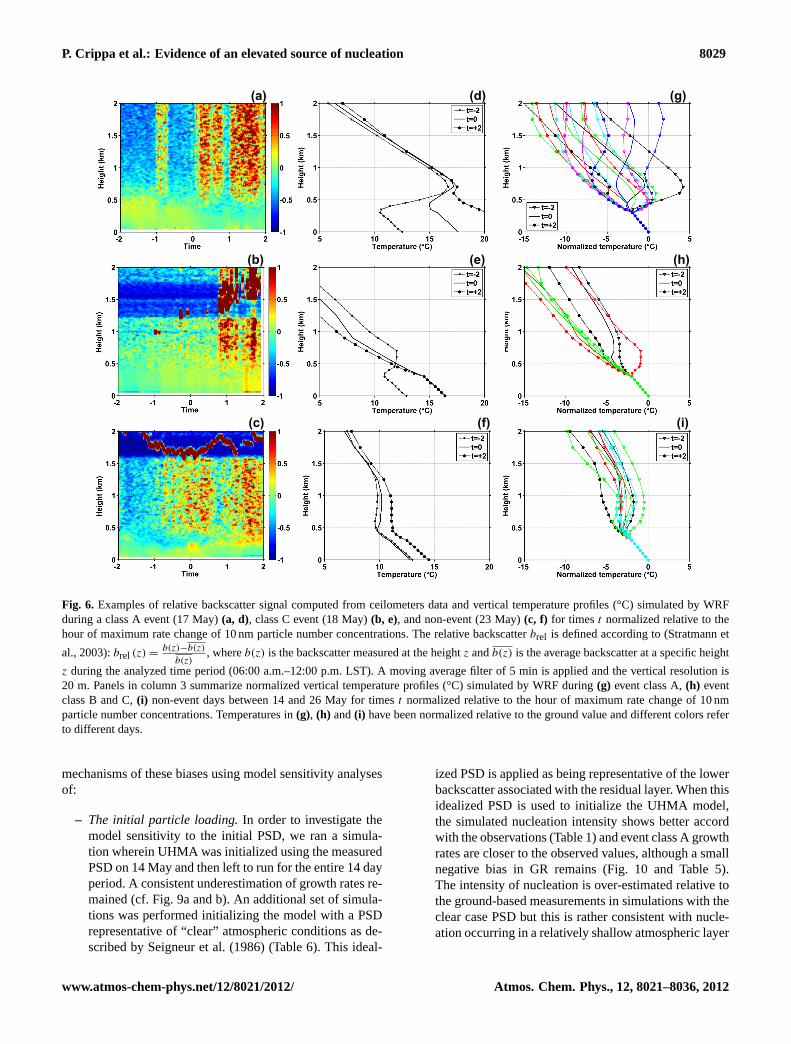
The Vaisala ceilometer has a wavelength of 910 nm andthus shows strongest response to the accumulation mode par-ticles that also tend to dominate the PSD and thus the conden-sational sink. The ceilometer backscatter measurements wereprocessed following the approach of Stratmann et al. (2003),to examine evidence for elevated atmospheric layers with rel-atively low aerosol loading (i.e. low backscatter) and thusmore favorable for nucleation occurrence (i.e. lower CS). Inthis approach the backscatter signals from each 20 m incre-ment in each 5 min period from each day is normalized tothe average backscatter at that height over the period 06:00-12:00 (LST) (Fig. 6a–c). The backscatter profiles were inte-grated with vertical temperature profiles derived from simu-lations with the WRF model (Fig. 6) to examine the presenceof a clear inversion and residual layer and to link the erosionof this layer to the appearance of elevated concentrations ofultrafine particles. A couple of hours prior to nucleation ap-pearance in the surface layer, event class A days are alwayscharacterized by a strong temperature inversion with a baselocated at approximately 400 m (Fig. 6g). This inversion ismuch weaker during event class B and class C days (Fig. 6h)and completely absent during non-event days which are usu-ally characterized by greater cloud cover (Fig. 6i). Duringevent days, at the time newly formed particles are detectedclose to the surface, the nocturnal inversion is almost com-pletely eroded. Moreover the relatively low elevation of thebase of the residual layer (i.e. 600–700 m), coupled with in-tense mixing phenomena due to boundary layer dynamics,may favor the advection of new particles formed aloft into themixed layer. Combining the vertical profiles of temperaturewith the relative backscatter signal derived from ceilome-ter data provides direct evidence of boundary layer dynam-ics and mixing processes. The ceilometer data indicate thaton event class A days there was a clear evidence for a lowbackscatter layer associated with the inversion and residuallayer (Fig. 6a). Just prior to the maximum rate change of10 nm particles in the surface observations the inversion iseroded (Fig. 6d), during the transition to a fully mixed layerwith high particle number concentrations. This transition of-ten occurs simultaneously with, or earlier than, detection ofsubstantial numbers of sub 10-nm particles detected closeto the ground, which supports our hypothesis of particle en-trainment from aloft.
Indirect evidence of nucleation being initiated aloft maybe derived by examining the concentrations of the smallestdetected particles during event class A days at the MMSFsite. The ratio between the number concentration of 3 nm and6 nm particles in the hour of maximum 6 nm particle concen-trations (computed after applying the empirical transmissionefficiency correction presented in Pryor et al., 2010) is on av-erage 60 % and thus is not sufficient to explain the observed6 nm particle concentrations. The low concentrations of 3 nmparticles might be related to limitations of the deployed in-strument and the experimental setup but may also reflectearly aging (i.e. growth by condensation and coagulation) of
www.atmos-chem-phys.net/12/8021/2012/ Atmos. Chem. Phys., 12, 8021–8036, 2012

8028 P. Crippa et al.: Evidence of an elevated source of nucleation
(a) (b)
Fig. 4. (a)Mean 6–10 nm particle number concentrations (cm−3) and(b) Log10 of turbulence intensity estimated from the 10 min averageZephIR lidar measurements during event class A days. The time coordinate is expressed relative to the hour the maximum rate change of10 nm particle concentrations was observed.
Fig. 5. Scatterplot of condensational sink (CS) (s−1) andDp = 6–30 nm particle number concentrations (cm−3). CS is computed forall event days during NIFTy for the period 1 h prior to the maximumrate change of 10 nm particles.
freshly nucleated particles formed elsewhere from the sam-pling site as also speculated by Pierce et al. (2012). Follow-ing the logic presented in Birmili and Wiedensohler (2000),the presence of a closed contour in the particle number sizedistribution profile (see Fig. 7) is also indicative of non-localnucleation (i.e. that the particles being observed were formedearlier – in this case in an elevated layer). However, it shouldbe acknowledged that a closed contour in this type of depic-tion of the PSD can also arise due to vapor condensation onan in situ particle population (Lehtinen and Kulmala, 2003).
3.2 Evidence for an elevated source of atmosphericparticles derived from model analyses
A key consideration in evaluating any particle dynamicsmodel is the sensitivity of the model to the description of theparticle size distribution (Zhang et al., 1999). Indeed, rec-onciling the need for computational efficiency and adequaterepresentation of the PSD is a key factor for implementing
particle dynamics within regional and global climate models(Spracklen et al., 2006). A model sensitivity analysis to thesize distribution discretization was conducted to define theoptimum number of sections as a function of model perfor-mance and computational time (Table 5). The results showlittle sensitivity to the number of sections for higher numberof sections (i.e. for simulations conducted using 300 sectionsrather than 250), hence 250 sections (over the whole simu-lated range of diameters: i.e. between 3 nm and 10 µm) wereselected to match the size resolution of the SMPS operated atMMSF and thus has 80 sections in the size range 3–105 nm).However, it is worthy of note that based on our sensitivityanalyses it appears that model skill improves only slightlysetting more than 80 bins, thus given the computational timerequired by 250 sections is around nine times longer than as-suming 80 sections, fewer than 250 sections may be used forlonger term simulations.
When driven by measured sulfur dioxide concentrationsand initialized using the observed PSD at midnight (LST)on each individual day, the UHMA model correctly simu-lates the occurrence or absence of nucleation (Table 1). How-ever, these simulations indicate a clear systematic under-prediction of the growth rate (Table 5 and Fig. 8) and typ-ically an underestimation of nucleation intensity (Table 1).Further there is a marked offset in the timing of the max-imum concentration of particle numbers forDp = 6–10 nm(Table 5). There are a number of possible causes for thesesystematic biases since the simulated particle number con-centrations are determined by the balance between forma-tion processes (the nucleation rate scales with the square ofsulfuric acid concentrations) and removal processes (dry de-position and condensational sink). The kinetic nucleation ap-proach was identified to be the dominant nucleation mech-anism and since the dry deposition algorithm has been re-formulated according to a physically based data-constraineddescription, thus we examined three other possible causal
Atmos. Chem. Phys., 12, 8021–8036, 2012 www.atmos-chem-phys.net/12/8021/2012/
P. Crippa et al.: Evidence of an elevated source of nucleation 8029
(a)
(b) (e)
(d)
(f)
(h)
(g)
(i) (c)
Fig. 6. Examples of relative backscatter signal computed from ceilometers data and vertical temperature profiles (°C) simulated by WRFduring a class A event (17 May)(a, d), class C event (18 May)(b, e), and non-event (23 May)(c, f) for timest normalized relative to thehour of maximum rate change of 10 nm particle number concentrations. The relative backscatterbrel is defined according to (Stratmann et
al., 2003):brel (z) =b(z)−b(z)
b(z), whereb(z) is the backscatter measured at the heightz andb(z) is the average backscatter at a specific height
z during the analyzed time period (06:00 a.m.–12:00 p.m. LST). A moving average filter of 5 min is applied and the vertical resolution is20 m. Panels in column 3 summarize normalized vertical temperature profiles (°C) simulated by WRF during(g) event class A,(h) eventclass B and C,(i) non-event days between 14 and 26 May for timest normalized relative to the hour of maximum rate change of 10 nmparticle number concentrations. Temperatures in(g), (h) and(i) have been normalized relative to the ground value and different colors referto different days.
mechanisms of these biases using model sensitivity analysesof:
– The initial particle loading.In order to investigate themodel sensitivity to the initial PSD, we ran a simula-tion wherein UHMA was initialized using the measuredPSD on 14 May and then left to run for the entire 14 dayperiod. A consistent underestimation of growth rates re-mained (cf. Fig. 9a and b). An additional set of simula-tions was performed initializing the model with a PSDrepresentative of “clear” atmospheric conditions as de-scribed by Seigneur et al. (1986) (Table 6). This ideal-
ized PSD is applied as being representative of the lowerbackscatter associated with the residual layer. When thisidealized PSD is used to initialize the UHMA model,the simulated nucleation intensity shows better accordwith the observations (Table 1) and event class A growthrates are closer to the observed values, although a smallnegative bias in GR remains (Fig. 10 and Table 5).The intensity of nucleation is over-estimated relative tothe ground-based measurements in simulations with theclear case PSD but this is rather consistent with nucle-ation occurring in a relatively shallow atmospheric layer
www.atmos-chem-phys.net/12/8021/2012/ Atmos. Chem. Phys., 12, 8021–8036, 2012

8030 P. Crippa et al.: Evidence of an elevated source of nucleation
Table 5.Measured and simulated growth rates [nm h−1] for class A events. Column 1 indicates the day in May 2008, column 2 the observedgrowth rates (GR) and column 3 shows simulated GR computed initializing the model with clear atmospheric conditions and setting 250sections. Columns 4 and 5 refer to GR simulated initializing the model with measured PSD and setting 250 sections when the sulfuric acid(H2SO4) and mass accommodation coefficient (α) correction are applied respectively, as described in Sect. 3.2. Columns 6–10 summarizethe results from the sensitivity analysis of simulated growth rates on the number of sections (20, 80, 150, 250 and 300 sections) when themodel is initialized with measured PSD. The timing between measured and simulated maximum 6-30 nm particle number concentrations(1t = tobs− tsim), computed initializing the model each day with the measured PSD and with clear atmospheric conditions setting 250sections, is also reported (columns 11–12).
Observations Simulations
Day GR (nm h−1) GR (nm h−1): GR (nm h−1): initialization with measured PSD Initialization with measured PSD Initialization with clear case
initialization Number of sections 1t (h) 1t (h)
with clear case H2SO4 α = 0.43 20 80 150 250 300correction
17 1.87 2.09 1.43 0.84 0.46 0.70 0.77 0.79 0.78 −1 219 2.13 2.28 1.08 0.37 0.33 0.89 0.94 0.82 0.78 −1 021 3.16 2.03 1.67 0.64 0.34 0.51 0.52 0.52 0.52 −2 022 2.47 1.37 1.65 0.61 0.35 0.52 0.57 0.61 0.59 −2 024 3.73 2.42 1.97 0.85 0.53 0.85 0.91 0.91 0.92 −2 125 3.40 2.31 2.49 1.11 0.72 1.05 1.05 1.06 1.06 −1 0Mean 2.79 2.08 1.72 0.74 0.46 0.75 0.79 0.79 0.78 −1.5 0.5
Fig. 7. Contour plot showing the particle number size distribu-tion [cm−3], expressed as dN /dLogDp, measured on 17 May. Thepresence of a closed contour line around the highest particle num-ber concentrations may imply non-local nucleation (Birmili andWiedensohler, 2000).
and then being mixed, diluted and reduced by coagula-tion during transport to the ground-based observing sys-tems. However, initializing the model with clear atmo-spheric conditions also appears to overestimate forma-tion rates during non-event days. Therefore we suggestthat factors other than the initial particle loading mayalso play a major role in controlling nucleation occur-rence.
– The availability of nucleation precursors.Since the ki-netic approach assumes the nucleation rate is depen-dent on the square of sulfuric acid concentrations, partof the underestimation of simulated growth rates maybe attributed to the negative bias in simulated sulfu-ric acid concentrations (Fig. 11). In the simulations,[H2SO4] results from the reaction between sulfur diox-
ide measured close to the ground and photochemi-cally produced OH. The chemical mechanism showsgood skill in simulating OH concentrations relative toobservations. The simulated average peak concentra-tion during event class A days is 4.2 × 106 cm−3 com-pared to the observed value of 4 × 106 cm−3, whereasthe average simulated maximum [OH] during non-eventdays is 2.7 × 106 cm−3, compared to measured value of8 × 105 cm−3 (Pryor et al., 2011). Thus we speculatethat the negative bias in simulated [H2SO4] is due toa negative bias in SO2 concentrations due to their mea-surement below the forest canopy. To investigate if thesystematic bias in [H2SO4] was responsible for a nega-tive bias in simulated nucleation an empirical correctionfactor (derived by fitting modeled [H2SO4] to the ob-servations, Fig. 11) was applied to the modeled values.Thus a simulation was conducted in which the modelwas initialized each day using the observed PSD andthe concentration of [H2SO4] was enhanced. The sensi-tivity analysis thus indicates the modeled GR increasesfrom 30 % to around 60 % of observed values when thesulfuric acid correction is applied to match the measuredvalues at the forest site (Table 5). This underestimationof growth rates even with enhanced [H2SO4] is also ob-served when the model is initialized on May and left torun for the entire 14 day period (Fig. 12a).
– Another factor regulating theavailability of condens-able vaporsand the growth rate of ultrafine particlesis the mass accommodation coefficient which describesthe probability of a gas molecule will stick to the pre-existing particles. Mass accommodation coefficient val-ues lower than 1 may thus enhance the concentration ofcondensable compounds available for nucleation hence
Atmos. Chem. Phys., 12, 8021–8036, 2012 www.atmos-chem-phys.net/12/8021/2012/

P. Crippa et al.: Evidence of an elevated source of nucleation 8031
(a)
(g)
(e)
(c) (d)
(f)
(h)
(b)
Fig. 8.Example particle number size distribution [cm−3], expressedas dN /dLogDp from measurements(a, c, e, g)and as simulated bythe UHMA (b, d, f, h) during the NIFTy experiment. The reporteddays are representative of(a–b) an event class A and(g–h) a non-event day showing good model skill,(c–d) an event class A and(e–f) an event class C day in which particle growth is not capturedby the model. Model simulations have been performed setting 250sections in order to match the size resolution of the SMPS.
reducing the influence of the CS. When the mass accom-modation coefficient was set to a value of 0.43 (based onwork by Poschl et al., 1998), UHMA simulations indi-cate only a weak sensitivity to this parameter (Fig. 12band Table 5).
The role of organics both in nucleation and initial par-ticle growth implied by the modeling presented hereinmay be an underestimate of the true contribution. How-ever, a dominant role of inorganics in the initial growthis also supported by a mass closure experiment in whichthe concentration of NH+4 and SO2−
4 captured on a size-resolved impactor accounted for the overwhelming ma-jority of mass determined from the SMPS forDp ≤
32 nm (Pryor et al., 2011), and also based on a scaleanalysis based on the work presented in Riccobono et
(b)
(a)
Fig. 9. Particle number size distribution [cm−3], expressed asdN /dLogDp, (a) measured by the SMPS during the NIFTy exper-iment and(b) simulated. Model simulations have been performedsetting 250 sections in order to match the size resolution of theSMPS and was initialized with the PSD observed on 14 May at00:00 LST.
al. (2012), in which the estimated GR due to H2SO4 isgiven by:
GRest=K × Vsaπ2 × D2
p(8)
whereK is the collision rate,Vsa is the volume of asulfuric acid mole andDp is the particle diameter. Us-ing a seed particle diameter of 10 nm, and the measuredH2SO4 during the event class A days, H2SO4 alone isestimated to be responsible for an average 45 % of theobserved initial particle growth (although the range ofvariability is 23–99 %). To further examine the poten-tial role of organics, we introduced the nucleation rateparameterization proposed in Metzger et al. (2010) intoUHMA. This formulation takes into account the roleplayed by both sulfuric acid and organics:
J1 = K × [H2SO4]m ×[NucOrg
]n (9)
where the prefactorK was derived from kinetic the-ory andm and n were assumed to be 1 (Metzger etal., 2010). The average nucleation intensity simulated
www.atmos-chem-phys.net/12/8021/2012/ Atmos. Chem. Phys., 12, 8021–8036, 2012

8032 P. Crippa et al.: Evidence of an elevated source of nucleation
(a)
(b)
Fig. 10. Simulated particle number size distribution [cm−3], ex-pressed as dN /dLogDp. Model simulations were performed using250 sections to match the size resolution of the SMPS. The modelwas initialized every day at 00:00 LST using(a) the measured PSDand(b) the PSD representative of clear atmospheric conditions asdescribed in Seigneur et al. (1986).
Fig. 11.Regression analysis between hourly averages of measuredand simulated sulfuric acid concentrations [H2SO4] (m−3) forevent days during the NIFTy experiment. As shown, simulated val-ues are negatively biased relative to the in situ measurements.
by this approach is 1.26 × 104 cm−3, which is muchcloser to the mean observed nucleation intensity (i.e.5.86 × 104 cm−3) than the activation mechanism (whereJ1 = 10−8.87
×[H2SO4]with the pre-factor derived fromthe data shown in Fig. 1) which gives a simulated nucle-
(a)
(b)
Fig. 12. Simulated particle number size distribution [cm−3], ex-pressed as dN /dLogDp showing model sensitivity on(a) sulfuricacid concentrations which have been enhanced by a factor 3.2 inorder to match the observed values and(b) on the mass accom-modation coefficient, set to 0.43 for each condensable compound(Poschl et al., 1998). Model simulations have been performed set-ting 250 sections in order to match the size resolution of the SMPSand initialized with the PSD observed on 14 May at 00:00 LST.
ation intensity of 4.26 × 102 cm−3. However, the param-eterization shown in Eq. (9) results in an average nucle-ation intensity value that is lower than that simulatedby the kinetic mechanism for event class A days (i.e.1.56 × 104 cm−3). These analyses are thus supportive ofthe inference that the organics do not play a dominantrole in controlling nucleation occurrence, the formationof the critical clusters and the initial stages of particlegrowth, which is consistent with an elevated nucleationsource.
4 Discussion and concluding remarks
In this study we provide independent evidence, both fromobservations and modeling results, supporting the hypothesisof an elevated source of nucleation in the residual layer, asalso advanced at other sites (Boulon et al., 2011; Pierce etal., 2012; Stratmann et al., 2003). Evidence in support of thispostulate derived from observations at the MMSF site located
Atmos. Chem. Phys., 12, 8021–8036, 2012 www.atmos-chem-phys.net/12/8021/2012/

P. Crippa et al.: Evidence of an elevated source of nucleation 8033
Table 6.Initial conditions of geometric mean diameter [µm], standard deviation and number concentration [cm−3] for each mode of the PSDassociated with clear atmospheric conditions and the average of observed PSD from the FMPS measurements.
Property Clear Case Measurements
Aitken Accumulation Coarse Aitken Accumulation Coarse
Geometric mean diameter [µm] 0.021 0.103 0.929 0.058 0.026 1.107Standard Deviation 1.80 1.60 2.20 1.67 1.48 2.20Number Concentration [cm−3] 1.256 × 10³ 6.451 × 10² 7.252 × 10⁻¹ 7.664 × 10³ 1.965 × 10³ 2.920 × 10²
in southern Indiana and thus within the polluted Ohio RiverValley include:
– There is a clear relationship between the occurrence ofelevated ultrafine particle concentrations and enhance-ment of turbulence intensity consistent with erosion ofthe nocturnal boundary layer and vertical transfer of re-cently nucleated particles (Fig. 4).
– The absence of a relationship between the near-surfacecondensational sink one hour prior to the appearanceof significant ultrafine particle concentrations and con-centrations of sub 10-nm particles (Fig. 5). Based onbackscatter data from a ceilometer, atmospheric con-ditions more favorable to new particle formation (i.e.lower CS) are found in the residual layer (Fig. 6).
– The primary distinction between event and non-eventdays, in terms of boundary layer dynamics, is the con-sistent presence of a capping inversion on event class Adays which is always eroded by the time of nucleationobservation in the surface layer (Fig. 6g). This modelingevidence strongly supports the hypothesis of new parti-cles formed in the residual layer and then mixed downto the surface layer with the erosion of the nocturnal in-version.
– The low ratio between 3 nm and 6 nm particle numberconcentrations measured in the near-surface layer at theMMSF site may be the result of an early aging of freshlynucleated particles before detection during their advec-tion from higher atmospheric levels to the mixed layer.
Model sensitivity analyses indicate nucleation rates appearto be highly dependent on the PSD used to initialize the sim-ulations with generally lower sensitivity to H2SO4 availabil-ity, the mass accommodation coefficient and the number ofsections used to represent the PSD. Thus results from theUHMA simulations that also support the postulate that nu-cleation is not occurring in the near-surface layer include thefollowing:
– The base case simulations with UHMA, driven by thePSD measured at 46 m and sulfur dioxide concentra-tions measured close to the surface, indicate consistentunderestimation of nucleation intensities and growth
rates (Figs. 8, 9 and 10, and Tables 1 and 5). Higheragreement between observed and simulated PSD is ob-tained when the initial PSD is set to conditions rep-resentative of clear atmospheric conditions (Fig. 10b)and when higher sulfuric acid concentrations are ap-plied (Fig. 12a). Both of these conditions may be foundat higher levels in the atmosphere and thus lead to in-ference that nucleation is initiated aloft and the newlyformed particles are then mixed downward with thebreaking of the residual layer and formation of the con-vective boundary layer (Pierce et al., 2012; Stratmannet al., 2003; Wehner et al., 2010).
– The time at which simulated peak number concentra-tions in the size range of 6–30 nm occur is on averageshifted towards an earlier nucleation start when assum-ing clear atmospheric conditions. This result supportsour hypothesis of new particles formed aloft (e.g. in theresidual layer), then mixed down and diluted with theformation of the mixed layer (thus also explaining theslightly lower observed nucleation intensities comparedto simulated values). The greatest temporal gradient (i.e.rate change) of 6–10 nm particle number concentrationsoccurs in the hour prior to the maximum in near-surfaceobservations which is also consistent with the postulatethat nucleation occurs aloft and also implies an essen-tial role for boundary layer dynamics in observations ofelevated ultrafine particle concentrations in the surfacelayer.
Although the postulates and findings advanced here can-not be considered conclusive, they are consistent with priorresearch that has indicated that new particle formation likelyoccurs principally at or close to the residual layer (or free tro-posphere) (Boulon et al., 2011; Lauros et al., 2011; Pierce etal., 2012; Stratmann et al., 2003; Wehner et al., 2010). Giventhe key role played by boundary layer dynamics and the lo-cation of the capping inversion in dictating the occurrence ofhigh particle concentrations near the surface, findings fromthis study may provide insights for the vertical resolutionrequired by regional models to adequately represent aerosoldynamics.
www.atmos-chem-phys.net/12/8021/2012/ Atmos. Chem. Phys., 12, 8021–8036, 2012

8034 P. Crippa et al.: Evidence of an elevated source of nucleation
Acknowledgements.This research was funded by grants to SCPfrom NSF (0544745 and 1102309). Some of the meteorologicaldata used herein were collected under funding from the Officeof Science (BER), US Department of Energy, grant DE-FG02-07ER64371, and additional funding from the IU PervasiveTechnology Institute was also provided. TP acknowledges fundingfrom the Academy of Finland (139656). Thanks to our researchcollaborators B. Plale (IU) and A. Rossner (Clarkson). Jim Smith isacknowledged for providing the SO2 instrument. Lee Mauldin andJoshua McGrath are acknowledged for setting up and operating theCIMS instrument. Comments from external reviewers improvedthis manuscript and are gratefully acknowledged.
Edited by: N. Riemer
References
Birmili, W. and Wiedensohler, A.: New particle formation inthe continental boundary layer: Meteorological and gas phaseparameter influence, Geophys. Res. Lett., 27, 3325–3328,doi:10.1029/1999gl011221, 2000.
Boulon, J., Sellegri, K., Hervo, M., Picard, D., Pichon, J.-M.,Freville, P., and Laj, P.: Investigation of nucleation events ver-tical extent: a long term study at two different altitude sites,Atmos. Chem. Phys., 11, 5625–5639,doi:10.5194/acp-11-5625-2011, 2011.
Boy, M. and Kulmala, M.: Nucleation events in the continentalboundary layer: Influence of physical and meteorological param-eters, Atmos. Chem. Phys., 2, 1–16,doi:10.5194/acp-2-1-2002,2002.
Boy, M., Kulmala, M., Ruuskanen, T. M., Pihlatie, M., Reissell,A., Aalto, P. P., Keronen, P., Dal Maso, M., Hellen, H., Hakola,H., Jansson, R., Hanke, M., and Arnold, F.: Sulphuric acid clo-sure and contribution to nucleation mode particle growth, Atmos.Chem. Phys., 5, 863–878,doi:10.5194/acp-5-863-2005, 2005.
Boy, M., Hellmuth, O., Korhonen, H., Nilsson, E. D., ReVelle, D.,Turnipseed, A., Arnold, F., and Kulmala, M.: MALTE – modelto predict new aerosol formation in the lower troposphere, At-mos. Chem. Phys., 6, 4499–4517,doi:10.5194/acp-6-4499-2006,2006.
Crumeyrolle, S., Manninen, H. E., Sellegri, K., Roberts, G., Gomes,L., Kulmala, M., Weigel, R., Laj, P., and Schwarzenboeck, A.:New particle formation events measured on board the ATR-42aircraft during the EUCAARI campaign, Atmos. Chem. Phys.,10, 6721–6735,doi:10.5194/acp-10-6721-2010, 2010.
Dal Maso, M., Kulmala, M., Lehtinen, K. E. J., Makela, J. M.,Aalto, P., and O’Dowd, C. D.: Condensation and coagulationsinks and formation of nucleation mode particles in coastal andboreal forest boundary layers, J. Geophys. Res.-Atmos., 107,8097,doi:10.1029/2001jd001053, 2002.
Eisele, F. L. and Tanner, D. J.: Measurement of the gas-phase con-centration of H2SO4 and methane sulphonic-acid and estimatesof H2SO4 production and loss in the atmosphere, J. Geophys.Res., 98, 9001–9010, 1993.
Griffin, R. J., Nguyen, K., Dabdub, D., and Seinfeld, J. H.:A coupled hydrophobic-hydrophilic model for predicting sec-ondary organic aerosol formation, J. Atmos. Chem., 44, 171–190,doi:10.1023/a:1022436813699, 2003.
Grosjean, D.: In situ organic aerosol formation during a smogepisode: Estimated production and chemical functionality, At-mos. Environ., 26, 953–963,doi:10.1016/0960-1686(92)90027-i, 1992.
Hertel, O., Berkowicz, R., Christensen, J., and Hov, O.: Test of twonumerical schemes for use in atmospheric transport-chemistrymodels, Atmos. Environ., 27, 2591–2611,doi:10.1016/0960-1686(93)90032-t, 1993.
Hu, X.-M., Nielsen-Gammon, J. W., and Zhang, F.: Eval-uation of three planetary boundary layer schemes in thewrf model, J. Appl. Meteorol. Climatol., 49, 1831–1844,doi:10.1175/2010jamc2432.1, 2010.
Jacobson, M. Z. and Turco, R. P.: Simulating condensationalgrowth, evaporation, and coagulation of aerosols using a com-bined moving and stationary size grid, Aerosol Sci. Technol., 22,73–92,doi:10.1080/02786829408959729, 1995.
Korhonen, H., Lehtinen, K. E. J., and Kulmala, M.: Multicompo-nent aerosol dynamics model UHMA: model development andvalidation, Atmos. Chem. Phys., 4, 757–771,doi:10.5194/acp-4-757-2004, 2004.
Kuang, C., McMurry, P. H., McCormick, A. V., and Eisele, F. L.:Dependence of nucleation rates on sulfuric acid vapor concen-tration in diverse atmospheric locations, J. Geophys. Res., 113,D10209,doi:10.1029/2007jd009253, 2008.
Kulmala, M., Dal Maso, M., Makela, J. M., Pirjola, L., Vakeva,M., Aalto, P., Miikkulainen, P., Hameri, K., and O’Dowd,C. D.: On the formation, growth and composition of nucle-ation mode particles, Tellus B, 53, 479–490,doi:10.1034/j.1600-0889.2001.530411.x, 2001.
Kulmala, M., Asmi, A., Lappalainen, H. K., Baltensperger, U.,Brenguier, J.-L., Facchini, M. C., Hansson, H.-C., Hov, Ø.,O’Dowd, C. D., Poschl, U., Wiedensohler, A., Boers, R.,Boucher, O., de Leeuw, G., Denier van der Gon, H. A. C., Fe-ichter, J., Krejci, R., Laj, P., Lihavainen, H., Lohmann, U., Mc-Figgans, G., Mentel, T., Pilinis, C., Riipinen, I., Schulz, M.,Stohl, A., Swietlicki, E., Vignati, E., Alves, C., Amann, M.,Ammann, M., Arabas, S., Artaxo, P., Baars, H., Beddows, D.C. S., Bergstrom, R., Beukes, J. P., Bilde, M., Burkhart, J. F.,Canonaco, F., Clegg, S. L., Coe, H., Crumeyrolle, S., D’Anna,B., Decesari, S., Gilardoni, S., Fischer, M., Fjaeraa, A. M., Foun-toukis, C., George, C., Gomes, L., Halloran, P., Hamburger, T.,Harrison, R. M., Herrmann, H., Hoffmann, T., Hoose, C., Hu,M., Hyvarinen, A., Horrak, U., Iinuma, Y., Iversen, T., Josipovic,M., Kanakidou, M., Kiendler-Scharr, A., Kirkevag, A., Kiss, G.,Klimont, Z., Kolmonen, P., Komppula, M., Kristjansson, J.-E.,Laakso, L., Laaksonen, A., Labonnote, L., Lanz, V. A., Lehtinen,K. E. J., Rizzo, L. V., Makkonen, R., Manninen, H. E., McMeek-ing, G., Merikanto, J., Minikin, A., Mirme, S., Morgan, W. T.,Nemitz, E., O’Donnell, D., Panwar, T. S., Pawlowska, H., Pet-zold, A., Pienaar, J. J., Pio, C., Plass-Duelmer, C., Prevot, A.S. H., Pryor, S., Reddington, C. L., Roberts, G., Rosenfeld, D.,Schwarz, J., Seland, Ø., Sellegri, K., Shen, X. J., Shiraiwa, M.,Siebert, H., Sierau, B., Simpson, D., Sun, J. Y., Topping, D.,Tunved, P., Vaattovaara, P., Vakkari, V., Veefkind, J. P., Viss-chedijk, A., Vuollekoski, H., Vuolo, R., Wehner, B., Wildt, J.,Woodward, S., Worsnop, D. R., van Zadelhoff, G.-J., Zardini,A. A., Zhang, K., van Zyl, P. G., Kerminen, V.-M., S Carslaw,K., and Pandis, S. N.: General overview: European Integratedproject on Aerosol Cloud Climate and Air Quality interactions
Atmos. Chem. Phys., 12, 8021–8036, 2012 www.atmos-chem-phys.net/12/8021/2012/

P. Crippa et al.: Evidence of an elevated source of nucleation 8035
(EUCAARI) – integrating aerosol research from nano to globalscales, Atmos. Chem. Phys., 11, 13061–13143,doi:10.5194/acp-11-13061-2011, 2011.
Laaksonen, A., Kulmala, M., O’Dowd, C. D., Joutsensaari, J., Vaat-tovaara, P., Mikkonen, S., Lehtinen, K. E. J., Sogacheva, L., DalMaso, M., Aalto, P., Petaja, T., Sogachev, A., Yoon, Y. J., Li-havainen, H., Nilsson, D., Facchini, M. C., Cavalli, F., Fuzzi, S.,Hoffmann, T., Arnold, F., Hanke, M., Sellegri, K., Umann, B.,Junkermann, W., Coe, H., Allan, J. D., Alfarra, M. R., Worsnop,D. R., Riekkola, M. -L., Hyotylainen, T., and Viisanen, Y.: Therole of VOC oxidation products in continental new particle for-mation, Atmos. Chem. Phys., 8, 2657–2665,doi:10.5194/acp-8-2657-2008, 2008.
Lauros, J., Sogachev, A., Smolander, S., Vuollekoski, H., Sihto, S.-L., Mammarella, I., Laakso, L., Rannik,U., and Boy, M.: Particleconcentration and flux dynamics in the atmospheric boundarylayer as the indicator of formation mechanism, Atmos. Chem.Phys., 11, 5591–5601,doi:10.5194/acp-11-5591-2011, 2011.
Lehtinen, K. E. J. and Kulmala, M.: A model for particle formationand growth in the atmosphere with molecular resolution in size,Atmos. Chem. Phys., 3, 251–257,doi:10.5194/acp-3-251-2003,2003.
Mauldin, R. L., Cantrell, C. A., Zondlo, M. A., Kosciuch, E.,Ridley, B. A., Weber, R., and Eisele, F. E.: Measurements ofOH, H2SO4, and MSA during tropospheric ozone productionabout the spring equinox (TOPSE), J. Geophys. Res., 108, 8366,doi:10.1029/2002jd002295, 2003.
Metzger, A., Verheggen, B., Dommen, J., Duplissy, J., Prevot, A.S. H., Weingartner, E., Riipinen, I., Kulmala, M., Spracklen,D. V., Carslaw, K. S., and Baltensperger, U.: Evidence forthe role of organics in aerosol particle formation under atmo-spheric conditions, P. Natl. Acad. Sci. USA, 107, 6646–6651,doi:10.1073/pnas.0911330107, 2010.
Nilsson, E. D., Rannik, U., Kulmala, M., Buzorius, G., andO’Dowd, C. D.: Effects of continental boundary layer evolution,convection, turbulence and entrainment, on aerosol formation,Tellus B, 53, 441–461,doi:10.1034/j.1600-0889.2001.530409.x,2001.
Petaja, T., Mauldin, III, R. L., Kosciuch, E., McGrath, J., Niem-inen, T., Paasonen, P., Boy, M., Adamov, A., Kotiaho, T., andKulmala, M.: Sulfuric acid and OH concentrations in a borealforest site, Atmos. Chem. Phys., 9, 7435–7448,doi:10.5194/acp-9-7435-2009, 2009.
Pierce, J. R., Leaitch, W. R., Liggio, J., Westervelt, D. M., Wain-wright, C. D., Abbatt, J. P. D., Ahlm, L., Al-Basheer, W., Cz-iczo, D. J., Hayden, K. L., Lee, A. K. Y., Li, S.-M., Rus-sell, L. M., Sjostedt, S. J., Strawbridge, K. B., Travis, M.,Vlasenko, A., Wentzell, J. J. B., Wiebe, H. A., Wong, J. P. S.,and Macdonald, A. M.: Nucleation and condensational growth toCCN sizes during a sustained pristine biogenic SOA event in aforested mountain valley, Atmos. Chem. Phys., 12, 3147–3163,doi:10.5194/acp-12-3147-2012, 2012.
Poschl, U., Canagaratna, M., Jayne, J. T., Molina, L. T., Worsnop,D. R., Kolb, C. E., and Molina, M. J.: Mass accommodationcoefficient of H2SO4 vapor on aqueous sulfuric acid surfacesand gaseous diffusion coefficient of H2SO4 in N2/H2O, J. Phys.Chem. A, 102, 10082–10089,doi:10.1021/jp982809s, 1998.
Pryor, S. C. and Binkowski, F. S.: An analysis of the time scales as-sociated with aerosol processes during dry deposition, Aerosol
Sci. Technol., 38, 1091–1098,doi:10.1080/027868290885827,2004.
Pryor, S. C., Barthelmie, R. J., Sørensen, L., and Jensen, B.: Am-monia concentrations and fluxes over a forest in the MidwesternUSA, Atmos. Environ., 35, 5645–5656, 2001.
Pryor, S. C., Barthelmie, R. J., Spaulding, A. M., Larsen,S. E., and Petroff, A.: Size-resolved fluxes of sub-100-nm particles over forests, J. Geophys. Res., 114, D18212,doi:10.1029/2009jd012248, 2009.
Pryor, S. C., Spaulding, A. M., and Barthelmie, R. J.: New parti-cle formation in the midwestern USA: Event characteristics, me-teorological context and vertical profiles, Atmos. Environ., 44,4413–4425,doi:10.1016/j.atmosenv.2010.07.045, 2010.
Pryor, S. C., Barthelmie, R. J., Sørensen, L. L., McGrath, J. G.,Hopke, P., and Petaja, T.: Spatial and vertical extent of nucleationevents in the Midwestern USA: insights from the Nucleation InForesTs (NIFTy) experiment, Atmos. Chem. Phys., 11, 1641–1657,doi:10.5194/acp-11-1641-2011, 2011.
Rannik, U., Aalto, P., Keronen, P., Vesala, T., and Kulmala, M.:Interpretation of aerosol particle fluxes over a pine forest: Drydeposition and random errors, J. Geophys. Res., 108, 4544,doi:10.1029/2003jd003542, 2003.
Riccobono, F., Rondo, L., Sipila, M., Barmet, P., Curtius, J., Dom-men, J., Ehn, M., Ehrhart, S., Kulmala, M., Kurten, A., Mikkila,J., Petaja, T., Weingartner, E., and Baltensperger, U.: Contribu-tion of sulfuric acid and oxidized organic compounds to particleformation and growth, Atmos. Chem. Phys. Discuss., 12, 11351–11389,doi:10.5194/acpd-12-11351-2012, 2012.
Seigneur, C., Hudischewskyj, A. B., Seinfeld, J. H., Whitby,K. T., Whitby, E. R., Brock, J. R., and Barnes, H. M.:Simulation of aerosol dynamics - a comparative review ofmathematical models, Aerosol Sci. Technol., 5, 205–222,doi:10.1080/02786828608959088, 1986.
Seinfeld, J. H. and Pandis, S. N.: Atmospheric chemistry andphysics - from air pollution to climate change (2nd edition), JohnWiley & Sons, 2006.
Sihto, S.-L., Kulmala, M., Kerminen, V.-M., Dal Maso, M., Petaja,T., Riipinen, I., Korhonen, H., Arnold, F., Janson, R., Boy, M.,Laaksonen, A., and Lehtinen, K. E. J.: Atmospheric sulphuricacid and aerosol formation: implications from atmospheric mea-surements for nucleation and early growth mechanisms, At-mos. Chem. Phys., 6, 4079–4091,doi:10.5194/acp-6-4079-2006,2006.
Sihto, S.-L., Vuollekoski, H., Leppa, J., Riipinen, I., Kerminen, V.-M., Korhonen, H., Lehtinen, K. E. J., Boy, M., and Kulmala,M.: Aerosol dynamics simulations on the connection of sulphuricacid and new particle formation, Atmos. Chem. Phys., 9, 2933–2947,doi:10.5194/acp-9-2933-2009, 2009.
Simpson, D., Olendrzynski, K., Semb, A., Støren, E., and Unger, S.:Photochemical oxidant modelling in Europe; multi-annual mod-elling and source-receptor relationships, EMEP/MSC-W3/97,1997.
Skamarock, W. C., Klemp, J. B., Dudhia, J., Gill, D. O., Barker,D. M., Duda, M. G., Huang, X.-Y., Wang, W., and Powers,J. G.: A description of the advanced research WRF version 3,National Center for Atmospheric Research, Boulder, Colorado,USA, 2008.
Slinn, W. G. N.: Predictions for particle deposition to vegetativecanopies, Atmos. Environ., 16, 1785–1794,doi:10.1016/0004-
www.atmos-chem-phys.net/12/8021/2012/ Atmos. Chem. Phys., 12, 8021–8036, 2012

8036 P. Crippa et al.: Evidence of an elevated source of nucleation
6981(82)90271-2, 1982.Spracklen, D. V., Pringle, K. J., Carslaw, K. S., Chipperfield,
M. P., and Mann, G. W.: A global off-line model of size-resolved aerosol microphysics: I. Model development and pre-diction of aerosol properties, Atmos. Chem. Phys., 5, 2227–2252,doi:10.5194/acp-5-2227-2005, 2005.
Spracklen, D. V., Carslaw, K. S., Kulmala, M., Kerminen, V.-M.,Mann, G. W., and Sihto, S.-L.: The contribution of boundarylayer nucleation events to total particle concentrations on re-gional and global scales, Atmos. Chem. Phys., 6, 5631–5648,doi:10.5194/acp-6-5631-2006, 2006.
Stratmann, F., Siebert, H., Spindler, G., Wehner, B., Althausen, D.,Heintzenberg, J., Hellmuth, O., Rinke, R., Schmieder, U., Sei-del, C., Tuch, T., Uhrner, U., Wiedensohler, A., Wandinger, U.,Wendisch, M., Schell, D., and Stohl, A.: New-particle forma-tion events in a continental boundary layer: first results fromthe SATURN experiment, Atmos. Chem. Phys., 3, 1445–1459,doi:10.5194/acp-3-1445-2003, 2003.
Wehner, B., Siebert, H., Stratmann, F., Tuch, T., Wiedensohler,A., Petaja, T., Dal Maso, M., and Kulmala, M.: Horizontal ho-mogeneity and vertical extent of new particle formation events,Tellus B, 59, 362–371,doi:10.1111/j.1600-0889.2007.00260.x,2007.
Wehner, B., Siebert, H., Ansmann, A., Ditas, F., Seifert, P., Strat-mann, F., Wiedensohler, A., Apituley, A., Shaw, R. A., Manni-nen, H. E., and Kulmala, M.: Observations of turbulence-inducednew particle formation in the residual layer, Atmos. Chem. Phys.,10, 4319–4330,doi:10.5194/acp-10-4319-2010, 2010.
Zhang, Y., Seigneur, C., Seinfeld, J. H., Jacobson, M. Z., andBinkowski, F. S.: Simulation of aerosol dynamics: A compara-tive review of algorithms used in air quality models, Aerosol Sci.Technol., 31, 487–514,doi:10.1080/027868299304039, 1999.
Zhang, Y., Liu, P., Liu, X.-H., Jacobson, M. Z., McMurry, P.H., Yu, F., Yu, S., and Schere, K. L.: A comparative studyofnucleation parameterizations: 2. Three-dimensional model ap-plication and evaluation, J. Geophys. Res., 115, D20213,doi:10.1029/2010jd014151, 2010a.
Zhang, Y., McMurry, P. H., Yu, F., and Jacobson, M. Z.: A compar-ative study of nucleation parameterizations: 1. Examination andevaluation of the formulations, J. Geophys. Res., 115, D20212,doi:10.1029/2010jd014150, 2010b.
Atmos. Chem. Phys., 12, 8021–8036, 2012 www.atmos-chem-phys.net/12/8021/2012/