Embed Size (px)
Citation preview
Journal of International Economics 76 (2008) 193–207
Contents lists available at ScienceDirect
Journal of International Economics
j ourna l homepage: www.e lsev ie r.com/ locate /econbase
The anatomy of financial crises: Evidence from the emerging ADR market☆
Paolo Pasquariello⁎Ross School of Business, University of Michigan, Department of Finance, 701 Tappan Street, Suite E7602, Ann Arbor, MI 48109-1234, United States
a r t i c l e i n f o
☆ This article was previously circulated under the tguidance of the editor (Giancarlo Corsetti) as well as froDaniel Isidori, Andrew Karolyi, Esa Jokivuolle, MarcelloEFA Meetings, the 2005 AFA Meetings, and the 11th A⁎ Tel.: +1 734 764 9286; fax: +1 760 268 3746.
E-mail address: [email protected] For economy of space, the above list is less than co
(2000), and Kaminsky et al. (2003) provide extensive
0022-1996/$ – see front matter © 2008 Elsevier B.V.doi:10.1016/j.jinteco.2008.04.001
a b s t r a c t
Article history:Received 13 February 2006Received in revised form 28 April 2007Accepted 28 April 2008
We study the anatomy of recent financial crises in Mexico, East Asia, Russia, Brazil, Turkey, andArgentina by investigating the efficiency and pricing of the emerging American depositaryreceipt (ADR) market. We use a non-parametric technique to test for persistent regime shifts intwo basic structural relationships for ADR returns in 20 emerging countries — identified viaarbitrage and capital mobility considerations — that should always hold in efficient andintegrated capital markets. We find that those “normal” market conditions were instead oftenviolated in proximity of financial crises: The law of one price often weakened (by 54% onaverage) and domestic sources of risk became more important (often by more than 100%) formany emerging ADRs. We also find the likelihood of these regime shifts to be related to proxiesfor uncertainty among investors, exchange rate volatility, trade linkages, and liquidity (but notstock market trends, currency devaluations, capital flight, or capital controls).
© 2008 Elsevier B.V. All rights reserved.
JEL classification:F37G15
Keywords:Regime shiftsFinancial crisesADRsMarket efficiencyMarket integration
1. Introduction
The global financial markets have recently been plagued by recurrent episodes of turmoil, most notably originating inMexico atthe end of 1994, in East Asia between 1997 and 1998, in Russia during the summer of 1998, in Brazil in 1999, in Turkey in 2001, andin Argentina in 2001/2002. In proximity of their occurrence, most emerging and some developed markets experienced sudden,severe, often deemed “excessive,” downward movements in stock, currency, and sovereign debt prices, scarce or drying liquidity,rapid reversals of capital flows, significant output losses, bank runs, or spillover effects.
The concentration of these episodes of turbulence, usually referred to as financial crises, over a relatively short period of timehas drawn the attention of a large and growing theoretical and empirical literature. Financial crises have alternatively beenattributed to local macroeconomic and microeconomic weaknesses (e.g., Krugman, 1979; Agenor et al., 1992; Kaminsky et al.,1998), monetary policy (e.g., Aghion et al., 2001), coordination problems among investors (e.g., Chang and Velasco, 1999), theactivity of large traders and speculators (e.g., Brown et al., 2000; Kaminsky et al., 2001, 2004; Kyle and Xiong, 2001; Kim and Wei,2002; Kodres and Pritsker, 2002; Corsetti et al., 2004), herding (e.g., Chari and Kehoe, 2004), self-fulfilling equilibria (e.g., Obstfeld,1998; Flood and Marion, 2000), the interaction of stock and foreign exchange markets (Corsetti et al., 1999; Park and Lee, 2003), orcontagion (e.g., King and Wadhwani, 1990; Calvo and Mendoza, 2000a,b; Corsetti et al., 2005; Kallberg et al., 2005; Pasquariello,2007).1
itle “Are Financial Crises Indeed “Crises?” Evidence from the Emerging ADR Market.” I benefited from them the comments of an anonymous referee, Warren Bailey, Geert Bekaert, Sreedhar Bharath, Vihang Errunza,Pericoli, Roberto Rigobon, Ivo Welch, and participants in seminars at the University of Michigan, the 2004nnual Assurant / Georgia Tech International Finance Conference. Any remaining errors are my own.
mprehensive. Calomiris (1995), Buiter et al. (1998), Corsetti et al. (1999), Flood and Marion (1999), Jeannesurveys of this literature and discuss its most recent developments.
All rights reserved.
194 P. Pasquariello / Journal of International Economics 76 (2008) 193–207
Operational criteria for the identification of the main, common characteristics of financial crises are a necessary premise of thesestudies (e.g., Mishkin, 1992). According to Bordo et al. (2000, p. 4), “any study of financial crises will turn on how these events areidentified.” Thus, for instance, defining crises as episodes of financial turmoil followed by output declinesmay lead to ignore instanceswhen such turmoil did not have real effects. Alternatively, Schwartz (1986) observes thatmanyfinancial disturbances leading to fallingasset prices should not be viewed asfinancial crises— and labeled instead “pseudo-financial crises”— if they are limited to a particularsector of the economy or set of market participants. In addition, identifying the nature of crisis events is arguably a crucial step inpolicymakers' and regulators' efforts at formulating prescriptions to prevent their occurrence or attenuate the severity of their effects.
Typically, financial crises are identified — i.e., distinguished from tranquil periods — and dated using various statistical criteriabased, e.g., on large fluctuations in stock and real estate prices, foreign exchange market pressure, a protracted deterioration inbanks' loan portfolios, bank failures, or common illiquidity and insolvency problems among financial market participants(Eichengreen et al., 1996; IMF,1998; Bordo et al., 2000). The objective of this paper is to provide further evidence on the anatomy ofrecent financial crises by assessing the impact of their occurrence on the efficiency and integration of emerging equity markets.Besides their distinct importance (e.g., Karolyi, 1998, 2006; Bekaert and Harvey, 2003), both features are likely to interact in thecontext of those markets, e.g., by virtue of the activity of foreign investors. For our purpose, we focus on the market for emergingAmerican depositary receipts (ADRs). ADRs are dollar-denominated rights, priced in the U.S. stock market, to shares of foreigncompanies traded in their domestic exchanges. According to Bailey et al. (2002), ADRs account for much trading in emergingmarket equities. Depositary receipts allow investors to trade inmore transparent and liquidmarkets (the NYSE, NASDAQ, or AMEX)than those of the issuers. More important, the ADR market represents an ideal environment to determine whether efficiency andintegration of emerging equity markets deteriorates during periods of financial stress. In each of those markets, ADRs and theircorresponding amounts of shares of the domestic issuers should always be perfect substitutes. Most of the available research onthe subject (see Section 2) argues that this is generally the case, in the absence of investment restrictions, when taxes, transactioncosts, liquidity, and non-synchronicity issues are considered. This implies that the relationship between the dollar return for adepositary receipt and the dollar return for the underlying security should always satisfy the law of one price, even afteraccounting for those financial frictions, unless “normal” market conditions are violated.
Further, in perfectly open, fully integrated financial markets, ADR prices should be related exclusively to their covariance withworld factors. Most emerging economies have experienced some form of capital market liberalization in the last decade. As a resultof this process, foreign investors can now trade in domestic assets and domestic investors in foreign assets. However, it is wellknown that investors' portfolios still display significant home bias (e.g., Tesar and Werner, 1995a); hence, local risk factors may bereasonably expected to affect ADR prices to a large extent. Importantly for our analysis, these factors may become even morerelevant during episodes offinancial turmoil.Many of these events have been associatedwith the occurrence of purely idiosyncraticshocks, like political instability,fiscal crises, ormonetary indiscipline. In addition, in several of those circumstances, local authoritiesreacted to generalized sales of domestic assets by erecting new barriers to capital flows (e.g., pegging unilaterally their currenciesand limiting the activities of foreign speculators), hence segmenting back their financial markets. Standard reduced-form ADRpricing models (e.g., Jorion and Schwartz, 1986; Foerster and Karolyi, 1999; Auguste et al., 2006) relate the dollar return for adepositary receipt to both the dollar return for the local index where the underlying security is traded and the dollar return for anindex of the ADR's fully open trading venue (the U.S. equity market). The above considerations then imply that ADR dollar returnsshould become more sensitive to local and less sensitive to global sources of risk if normal market conditions are violated.
Testing for and explaining regime shifts in the efficiency and pricing of emerging ADR markets is therefore the subject of thiswork. We start by translating the arbitrage and market integration arguments made above into two linear relationships betweenreturns for each ADR in the sample, its corresponding local stock, and domestic and global sources of risk. Our basic datasetcomprises weekly U.S. dollar returns for ADRs (from their inception, whenever possible, to April 1, 2003) from issuers in 20emerging markets: Argentina, Brazil, Chile, China, Colombia, Hong Kong, Hungary, India, Indonesia, Israel, Mexico, Peru,Philippines, Poland, Russia, South Africa, South Korea, Taiwan, Turkey, and Venezuela. Poor and time-varying liquidity in thesemarkets (e.g., Lesmond, 2005) may induce temporary shifts to those linear relationships even in normal market conditions (i.e., lesseconomically meaningful shifts, given our purposes). Further, emerging market financial crises often evolve over periods of manymonths or years around their official initial dates (e.g., Kaminsky et al., 2003; Kallberg et al., 2005). Thus, we search for the single,most economically and statistically significant persistent break over our sample period in each of the two hypothesizedrelationships, using the non-parametric statistical methodology of Bai et al. (1998). This approach has several desirable properties:i) it allows statistical inference on the nature of those breaks (and the estimation of confidence intervals around the estimated,endogenous break dates) with minimal restrictions on the behavior of the involved variables; ii) it exhibits adequate size andpower to that end, even under the alternative hypothesis of one ormore temporary structural breaks; and iii) it is unaffected by anyprior bias about when a persistent break is expected to happen.
We find that the law of one price ceased to hold for many emerging depositary receipts in our sample in proximity of financialcrises. Most of the estimated persistent breaks in their basic no-arbitrage relationships cluster in 1994, between 1997 and 1998,and by the end of 2001. In those circumstances, the correlation between ADR returns and the dollar returns of their perfectsubstitutes weakened considerably (by 54% on average), especially in Argentina, Chile, Mexico, South Africa, and Venezuela. Theseshifts were often accompanied by greater dependency of ADR prices on domestic equity index returns (usually by about 100%).Based on this evidence we conclude that during recent episodes of financial turmoil, the market for emerging ADRs became onaverage less efficient and more segmented than during more tranquil times. As interesting, however, these episodes wereaccompanied by either no discernible persistent deterioration or even a persistent improvement in the efficiency and/or pricingrelationships of at least half of the ADRs in our database, most notably in Brazil, China, India, and Russia. This additional evidence

195P. Pasquariello / Journal of International Economics 76 (2008) 193–207
suggests that some emerging markets may have actually benefited from the intense portfolio rebalancing activity across themreported to have taken place during those turbulent times (e.g., Disyatat and Gelos, 2001; Kallberg et al., 2005).
Our analysis goes a step further.We intend in fact to explain theoccurrence, dynamics, and clusteringof the estimated regimeshifts.To accomplish this task, we consider a number of popular arguments in the literature (described in Section 6) to explain timing andevolution of financial crises. We devise various proxies for them, which can be grouped into six main categories: Information, trend,currency and economic environment, investors' activity, market liquidity, and expected returns.We then include the selected proxiesin a Poisson model for the concentration of estimated breaks in each country in the sample. Despite our efforts, data limitations andpotentially conflicting interpretations of those proxies make the resulting analysis exploratory and tentative. Given these caveats, themodel's estimation indicates that emerging ADR markets are more likely to become less efficient and integrated in the presence ofgreater uncertainty among foreign investors and exchange rate volatility, declining expected returns and liquidity, and shrinking trade(but not prolonged stock market trends, abrupt currency devaluations, capital controls, or foreign capital flight).
This work is closely related to two recent studies. Using intraday data, Gagnon and Karolyi (2004) detect significant (albeitrarely persistent) short-term ADR price parity violations, the greater so in the presence of “excess” systematic comovement with U.S. market returns.While their analysis is static in nature, the focus of our research is on the long-term dynamics of ADR pricing andon its interactionwith financial crises. Kallberg et al. (2005) find statistically significant breaks in linear relationships between theequity and currency markets of several East Asian countries during 1997 and 1998, and link those episodes to herding by foreigninvestors. These structural dependencies, however, do not naturally arise from normal market conditions and are not bound tohold dynamically, regardless of whether those markets were experiencing a crisis. We are also not the first to investigate theproperties of emerging ADRs in proximity of episodes of financial turmoil. Among others, previous work examines the impact ofselected financial crises either on the performance and valuation of selected ADRs (Mathur et al., 1998; Bin et al., 2004; Chung,2005) or on their microstructure characteristics (Huang and Stoll, 2001) using event-study methodologies. Yet, these approachesmay be affected by the analyst's prior bias for they impose an exogenous, static, and usually short event horizon — the “crisis”period — over which to evaluate ADRs' properties. The ensuing findings are time-specific by construction, hence difficult tocompare to any benchmark pre- or post-crisis behavior. Our approach does not assume, but seeks to determine the nature of crisisperiods by dynamically identifying endogenous periods of normal and abnormal market conditions. We do so for all emergingmarkets and over the longest time frame for which data is available. Lastly, we further the robustness of our analysis by relating theoccurrence and clustering of normal and abnormal ADR pricing behavior to several macroeconomic and financial variables.
The paper is organized as follows. Section 2 identifies two basic efficiency and pricing relationships for ADR returns. Section 3details the econometric approach to testing for breaks in these relationships. Section 4 describes the data employed in the analysis.We present and discuss the evidence on the estimated regime shifts in Section 5. Section 6 investigates the significance ofalternative explanations for their time series and cross-country dynamics. Section 7 concludes.
2. Efficiency and pricing for ADR returns
American Depositary Receipts (ADRs) are dollar-denominated, negotiable certificates representing a pre-specified amount of aforeign company's publicly traded equity, held on deposit in the issuer's domestic market. The depositary banks pass all dividendsand payments related to the underlying shares (converted into U.S. dollars) to the holders of the ADRs, who therefore bear allcurrency risk and pay handling fees to the custodians. ADRs allow investors to achieve international diversificationwhile avoidinghefty local fees (up to 40 basis points, according to Velli, 1994) and trade failures, common especially in emerging markets.2
The holder of an ADR can redeem his certificate into the underlying shares at any point in time by simply paying a small servicecharge to the custodian. Conversely, new ADRs can be created at any point in time by simply depositing the appropriate number ofthose shares in the custodian's hands. Hence, in the absence of significant investment barriers and accounting for fluctuations in theexchange rate, ADRs and the underlying equity should be perfect substitutes (e.g., Karolyi,1998, 2006; Gagnon and Karolyi, 2004). Ifritm is the dollar return for the shares of company i in countrym at time t and rit
US is the dollar return for the corresponding depositaryreceipt at time t, the null hypothesis of perfect substitutability between the two securities implies that, in the relationship
2 Furtamong
3 Thisone priccorrespcurrencdifferen2006), w(ln Pit
m−our sam
rUSit ¼ ai þ birmit þ ηUSit ; ð1Þ
i=0 and bi=1.3 By construction, the validity of these return restrictions is independent of firm-specific events such
both aas stock splits, dividend payments, capital structure decisions, or control changes. However, differential taxation rules(e.g., on the treatment of dividends), restrictions to capital mobility and foreign ownership of domestic stocks, involuntaryher details on the types of ADR programs in the U.S. and the functioning of the ADR market are in Kato et al. (1991) and Ely and Salehizadeh (2001),others, and on the Web site of the Bank of New York (BoNY): http://www.adrbny.com/dr_edu_landing.jsp. BoNY is the world's largest depositary for ADRs.hypothesis is equivalent to requiring that, in the absence of capital and currency controls, transaction costs, and time delays in ADR conversion, the law ofe holds for the prices of ADRs and their underlying local shares at any point in time. If Pitm is the stock price of firm i in country m, PitUS is the price of theonding ADR, ϕi
m is the conversion ratio between the two (number of local shares underlying one ADR), and Stm is the spot exchange rate (units of local
y per U.S. dollar), the law of one price requires that, from the perspective of a U.S. dollar-based investor, PitUS=ϕimPit
m/Stm at each point in time t. Taking firstces leads to Pit
US−Pit - 1US =ϕim (Pitm/Stm−Pit - 1m /St - 1m ). Following standard practice in the literature testing for violations of the law of one price (e.g., Auguste et al.
e derive Eq. (1) by taking first differences of log prices from the no-arbitrage condition above: ln PitUS= lnϕi
m+(ln Pitm− ln St
m) implying that ln PitUS− ln Pit - 1
US =ln Pit - 1
m )– (ln Stm− ln St–1
m ). This representation effectively reduces heteroskedasticity and dampens exponential growth patterns common to some stocks inple. Results are qualitatively similar when using arithmetic price differences and are available upon request.

196 P. Pasquariello / Journal of International Economics 76 (2008) 193–207
dilution of ADR-holders' claims (due to SEC rules on the exercise of rights), limited liquidity, and non-synchronous tradingmay temporarily limit the efficient realignment of the dollar prices of ADRs and corresponding domestic stocks only within no-arbitrage bands such that ai≠0 and/or bi≠1. Most available studies (e.g., Rosenthal, 1983; Kato et al., 1991; Webb et al., 1995)conclude that the ADRmarket is at least weak-form efficient and that, after accounting for many of those frictions, the law of oneprice does indeed hold. One of the main objectives of this work is to test whether efficiency in the market for emerging ADRs ispersistently altered during periods of financial stress. Thus, we test whether Eq. (1) experiences a regime shift in proximity ofrecent financial crises.4 We analyze and discuss the importance of those frictions for the ensuing evidence in Section 6.
Established theoretical and empirical research supports the case for international diversification.5 Hence, if the internationalcapital markets were fully integrated and perfect capital mobility held, returns on ADRs should depend only on their covarianceswith global market factors relevant in their fully open trading venue (the U.S. equity market). Instead, the existence of home biasamong domestic investors leads local market dynamics to affect ADR prices as well (e.g., Errunza and Losq, 1985; Alexander et al.,1987; Karolyi and Stulz, 2003). The relevance of local factors may be even greater during periods of financial stress. Many of therecent episodes of financial turmoil raging through Asia and Latin America were in fact ignited or fueled by domestic events (e.g.,political uncertainty, bank failures, explosive budget deficits, or government defaults on bond payments).
In this paper we also test whether local market returns became persistently more important in pricing emerging ADRs aroundthe time of financial crises. To that purpose, we employ a standard multi-factor model in which factors typically proxy for sourcesof domestic and U.S. market risk. The model can be written as
4 AllFootnotclear prwe runestimat
5 E.g.6 Our
betwee7 It is
methodproxim
rUSit −rUSRFt ¼ bmi rmMt−rUSRFt
� �þ bUSi rUSMt−rUSRFt
� �þ eUSit ; ð2Þ
rRFtUS is the U.S. risk-free rate of return at time t, rMt
m is the dollar return on the local market portfolio of the ADR's underlying
wherestock at time t, and rMtUS is the return on the U.S. market portfolio at time t. Eq. (2) is intuitively reasonable for it implies that, as afirst-order approximation, ADR returns are driven by fluctuations in either the market where the ADR is traded, the market for theunderlying stock, or both. Accordingly, similar specifications have been employed in several studies of cross-border listings (e.g.,Jorion and Schwartz, 1986; Howe and Kelm, 1987; Karolyi, 1998; Foerster and Karolyi, 1999; Auguste et al., 2006).6 As argued inSection 1, a significant estimate for the local (global) market coefficient bim (biUS) in Eq. (2) provides evidence of relative capitalmarket segmentation (integration). Thus, conditional on its validity as an asset pricing model, this relation allows us to test forlong-lasting changes in the degree of market integration and capital mobility in the context of the emerging ADR market— i.e., totest for whether biUS and/or bim experience a regime shift — in proximity of recent financial crises.
3. Testing for regime shifts
In order to test for breaks in the parameters of Eqs. (1) and (2), we adopt the statistical methodology of Bai et al. (1998). Thisprocedure permits statistical inference about structural breaks (including the estimation of confidence interval around the breakdates) with minimal distributional restrictions. Bai et al. (1998)'s non-parametric technique searches for a single, persistent breakin univariate or multivariate time series models (with or without stationary regressors) and generates asymptotic confidenceintervals around their estimated break dates.7
To that purpose,we allow for the possibility of a structural regime shift in Eqs. (1) and (2). If k is a potential break date,Xitm is a 1×N
vector of country- or stock-specific regressors, and βim andΔβi
m areN×1 vectors of factor loadings, we specify the relation
ymit ¼ Xm0it βm
i þ dt kð ÞXm0it Δβm
i þ emit ; ð3Þyitm= ritUS or rit
US− rRFtUS, and dt(k)=1 if t≥k and zero otherwise. Eq. (3) is a model of full structural change since all the
wherecoefficients in βim are allowed to change. Hence, the vector Δβim can be interpreted as the change in these coefficients after a break
occurred.We are interested in testing the null hypothesis that Δβi
m=0 at each date k. Bai et al. (1998)'s test for structural breaks to Eq. (3)considers the maximum of aWald statistic Fim(k) (Eq. (2.7), p. 398) constructed with OLS estimators for Bim (k) and var (εim) (i.e., Bb i
m(k)andσb im
2 , respectively) under the alternative hypothesis of one break at date k. The estimated break date is then kbim=argmax Fim(k), andis statistically significant if Fim (kbim) is greater than its critical value at the chosen level of significance. If a statistically significant break is
our tests are run from the perspective of a dollar-based investor, since both ADR and associated local stock returns are in dollar terms. As shown ine 3, fluctuations in both the local share prices and the local exchange rate versus the dollar affect the extent to which the law of one price holds. Yet, noedictions for their relative importance, nor any general assumption about their interaction can be formulated. Our inference is qualitatively similar whenour tests from the perspective of local investors (i.e., using local currency returns). We explore in greater detail the role of exchange rate dynamics for theed regime shifts in Eq. (1) in Section 6., see Solnik (1974), Heston and Rouwenhorst (1994), and Griffin and Karolyi (1998), among others.inference is qualitatively similar when we replace rMt
US in Eq. (2) with dollar returns on a world equity index from Datastream, rMtW . The correlation
n rMtW and rMt
US is 0.823 over the sample period.possible that those time-series models may experience more than one regime shift over the sample period. In these circumstances, Bai et al. (1998)'sology allows us to identify the single most (economically and statistically) significant of those breaks. Determining whether such break occurs inity of periods of international financial turmoil is the main objective of this research.
197P. Pasquariello / Journal of International Economics 76 (2008) 193–207
detected in Eq. (3), Bai et al. (1998) specify an asymptotic confidence interval for the true break date based onBbim (k) andσbim2 (Eq. (2.21),p. 402) that does not require the restrictive assumption of normality of the residuals in Eq. (3).8
4. Data
Our basic dataset consists of weekly, continuously compounded, dividend-adjusted, U.S. dollar returns for all the Level II andLevel III ADR stocks traded at the NYSE, NASDAQ, or AMEX (ritUS) as of April 1, 2003, and their domestic counterparts traded inemerging financial markets (ritm). The list of all such issuers is available on the Bank of New York (BoNY)'s Web site.9 Level II andLevel III ADRs require basic to full compliance with U.S. GAAP and SEC disclosure rules. We define as emerging economies the 26countries included in the MSCI Emerging Markets Free Index (EMF), as of April 1, 2003, plus Hong Kong.10 We ignore stocks forwhich no information on their trading venue was provided by BoNY, Level 1 ADRs, and Rule 144A (also known as RADRs). Thosestocks require in fact minimal or no compliance with U.S. GAAP and SEC disclosure rules, and are traded on the OTC (Over TheCounter) or PORTAL (Private Offerings, Resales, and Trading through Automated Linkages) systems with much less liquidity thanexchange-listed securities (e.g., Karolyi, 1998). We also ignore companies whose domestic and ADR shares have a short commontrading history (100 weeks or less).
This filtering reduces our sample to joint time series of ritm and ritUS— from the earliest available date (generally from inception) to
April 1, 2003 — for 156 stocks in 20 countries. These countries are: Argentina, Brazil, Chile, China, Colombia, Hong Kong, Hungary,India, Indonesia, Israel, Mexico, Peru, Philippines, Poland, Russia, South Africa, South Korea, Taiwan, Turkey, and Venezuela. Allpricing data is from Datastream. We use weekly returns to control for infrequent and non-synchronous trading, non-overlappingtrading hours, and variousmicrostructure frictionswhich oftenplague emerging ADR data at higher frequencieswhile still allowingfor intra-month price dynamics.11 Our dataset also includesweekly time series of three-month Treasury Bill rates (rRFtUS) and of dollarreturns of broad market indexes for each of the 20 emerging countries (rMt
m ) and the U.S. (rMtUS), again from Datastream.
5. Estimating regime shifts
In this sectionwe test whether the efficiency and pricingmodels for ADRs described in Section 2 experience a persistent regimeshift in proximity of financial crises. To that purpose, we apply themethodology of Bai et al. (1998) to Eqs. (1) and (2) for each of theADRs in our sample.12 Tables 1 and 2 report the resulting regression coefficients from the estimation of both models at statisticallysignificant (at the 5% level) break dates kbim=arg max Fi
m (k), i.e., when the corresponding Wald statistic Fim(kbim)≥11.78, its
asymptotic 95% critical value (from Table 10 in Bekaert et al., 2002). To provide a benchmark for comparison, Tables 1 and 2 alsoreport country average estimates of Eqs. (1) and (2) for the ADRs that did not experience any such break.
The evidence inTable 1 suggests that amajority of the depositary receipts in our sample experienced a regime shift in their basicarbitrage relationships over the sample period. Specifically, we find that a statistically significant break occurs in the parameters ofEq. (1) for 81 of the 156 emergingmarket ADRs described in Section 4. These breaks are due on average to decreased dependence ofthe ADRs' dollar returns (ritUS) on the dollar return for the underlying shares in the local market (ritm), i.e., bΔbib0 on average.Consistently, there is greater support for the null hypothesis of perfect substitutability between ADRs and local stocks when theWald statistic Fi
m (k) does not register any break: In those circumstances, estimates for bi (ai) in Table 1 are in fact much greater(smaller), and not statistically different from one (zero) more often thanwhen a break occurs. Further, most of the estimated breakstook place during periods of financial turmoil. The scatter plot of estimated break dates in Fig. 1a shows that statistically significantregime shifts in Eq. (1) cluster during the events of Mexico (1994), East Asia (1997), Russia (1998), Brazil (1999), Turkey (2001), andArgentina (2001/2002), whose indicative “official” initial dates (from Table 1 in Kaminsky et al., 2003) are represented by verticaldotted lines. Accordingly, Table 1 reports that the median absolute distance between our efficiency break dates and the closest ofthose official crisis dates (column |kbim⁎|) is less thanfivemonths and as lowas a fewweeks for Argentina, Indonesia, Peru, andRussia.
As important, Table 3 and Fig. 1a indicate that most of the breaks in Table 1—when implying larger violations of the law of oneprice (i.e.,bΔbib0) — are economically significant, occurred in closest proximity of the events of Brazil, Turkey, and Argentina (butnot Russia and to a lesser extent the East Asian crisis, in columns |kbiEm⁎| andbΔbib0 of Table 3), and especially concern ADRs fromArgentina, Chile, Mexico, South Africa, and Venezuela.13 In particular, the average relative deterioration of the law of one price (i.e.,with respect to pre-break b i, whose mean is 0.95) i) amounts to a considerable 54% (
PbΔbi ¼ −0:49 in Table 3), ii) occurs within (amedian of) only 15 weeks from the closest official initial crisis date (i.e., economically close to those crises' observed chronological
8 Albeit constructed using limit theorems, these tests display satisfactory finite-sample properties: According to Bai et al. (1998) and Bekaert et al. (2002), theyperform adequately, in terms of both size and power, under the null hypothesis of no break and the alternative hypothesis either of a single persistent break in themean of the dependent variable or of persistent structural breaks in the coefficients of exogenous regressors, as in Eq. (3). Further Monte Carlo analysis specific toour empirical setting (available on request) confirms these findings, even under the null hypothesis of either a single or multiple temporary breaks of variousduration and intensity to the parameters of Eq. (3).
9 Http://www.adrbny.com/dr_directory.jsp.10 Http://www.msci.com/licensing/derive.html. We add Hong Kong to the MSCI list because of the presence of many Chinese companies in that stock exchange.11 E.g., see Harvey (1995), Aggarwal et al. (1999), and Bacidore and Sofianos (2002). Auguste et al. (2006) take weekly averages of daily ADR premiums ordiscounts for Argentine stocks. Unreported results based on lower frequencies (e.g., monthly) are qualitatively similar.12 The correlations between rMt
US and each of the local aggregate return series rMtm are relatively low, ranging from a minimum of 0.07 versus India to a maximum
of 0.37 versus Mexico. Therefore, when we estimate Eq. (2), we do not orthogonalize the regressors rMtm , as is instead done in Auguste et al. (2006).
13 Consistently, Hunter (2005) finds evidence of deteriorating efficiency in the ADR markets of Argentina, Chile, and Mexico during crisis periods.
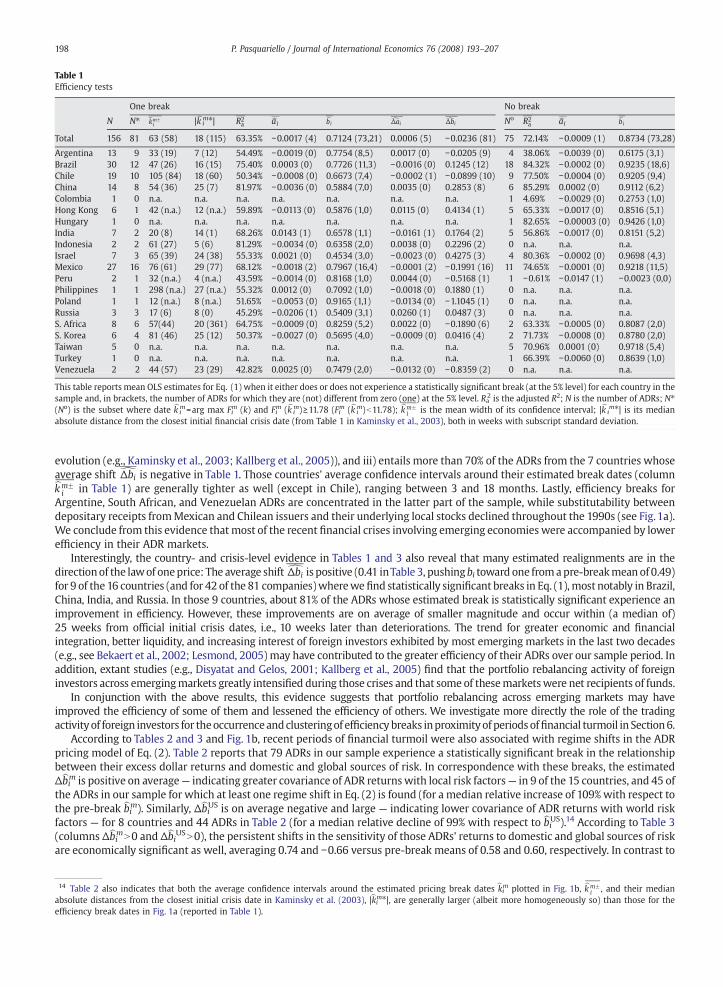
Table 1Efficiency tests
One break No break
N N⁎ kbmFi |kbim⁎| R2
a abi bbiPbΔai
PbΔbi No R2a abi bbi
Total 156 81 63 (58) 18 (115) 63.35% −0.0017 (4) 0.7124 (73,21) 0.0006 (5) −0.0236 (81) 75 72.14% −0.0009 (1) 0.8734 (73,28)
Argentina 13 9 33 (19) 7 (12) 54.49% −0.0019 (0) 0.7754 (8,5) 0.0017 (0) −0.0205 (9) 4 38.06% −0.0039 (0) 0.6175 (3,1)Brazil 30 12 47 (26) 16 (15) 75.40% 0.0003 (0) 0.7726 (11,3) −0.0016 (0) 0.1245 (12) 18 84.32% −0.0002 (0) 0.9235 (18,6)Chile 19 10 105 (84) 18 (60) 50.34% −0.0008 (0) 0.6673 (7,4) −0.0002 (1) −0.0899 (10) 9 77.50% −0.0004 (0) 0.9205 (9,4)China 14 8 54 (36) 25 (7) 81.97% −0.0036 (0) 0.5884 (7,0) 0.0035 (0) 0.2853 (8) 6 85.29% 0.0002 (0) 0.9112 (6,2)Colombia 1 0 n.a. n.a. n.a. n.a. n.a. n.a. n.a. 1 4.69% −0.0029 (0) 0.2753 (1,0)Hong Kong 6 1 42 (n.a.) 12 (n.a.) 59.89% −0.0113 (0) 0.5876 (1,0) 0.0115 (0) 0.4134 (1) 5 65.33% −0.0017 (0) 0.8516 (5,1)Hungary 1 0 n.a. n.a. n.a. n.a. n.a. n.a. n.a. 1 82.65% −0.00003 (0) 0.9426 (1,0)India 7 2 20 (8) 14 (1) 68.26% 0.0143 (1) 0.6578 (1,1) −0.0161 (1) 0.1764 (2) 5 56.86% −0.0017 (0) 0.8151 (5,2)Indonesia 2 2 61 (27) 5 (6) 81.29% −0.0034 (0) 0.6358 (2,0) 0.0038 (0) 0.2296 (2) 0 n.a. n.a. n.a.Israel 7 3 65 (39) 24 (38) 55.33% 0.0021 (0) 0.4534 (3,0) −0.0023 (0) 0.4275 (3) 4 80.36% −0.0002 (0) 0.9698 (4,3)Mexico 27 16 76 (61) 29 (77) 68.12% −0.0018 (2) 0.7967 (16,4) −0.0001 (2) −0.1991 (16) 11 74.65% −0.0001 (0) 0.9218 (11,5)Peru 2 1 32 (n.a.) 4 (n.a.) 43.59% −0.0014 (0) 0.8168 (1,0) 0.0044 (0) −0.5168 (1) 1 −0.61% −0.0147 (1) −0.0023 (0,0)Philippines 1 1 298 (n.a.) 27 (n.a.) 55.32% 0.0012 (0) 0.7092 (1,0) −0.0018 (0) 0.1880 (1) 0 n.a. n.a. n.a.Poland 1 1 12 (n.a.) 8 (n.a.) 51.65% −0.0053 (0) 0.9165 (1,1) −0.0134 (0) −1.1045 (1) 0 n.a. n.a. n.a.Russia 3 3 17 (6) 8 (0) 45.29% −0.0206 (1) 0.5409 (3,1) 0.0260 (1) 0.0487 (3) 0 n.a. n.a. n.a.S. Africa 8 6 57(44) 20 (361) 64.75% −0.0009 (0) 0.8259 (5,2) 0.0022 (0) −0.1890 (6) 2 63.33% −0.0005 (0) 0.8087 (2,0)S. Korea 6 4 81 (46) 25 (12) 50.37% −0.0027 (0) 0.5695 (4,0) −0.0009 (0) 0.0416 (4) 2 71.73% −0.0008 (0) 0.8780 (2,0)Taiwan 5 0 n.a. n.a. n.a. n.a. n.a. n.a. n.a. 5 70.96% 0.0001 (0) 0.9718 (5,4)Turkey 1 0 n.a. n.a. n.a. n.a. n.a. n.a. n.a. 1 66.39% −0.0060 (0) 0.8639 (1,0)Venezuela 2 2 44 (57) 23 (29) 42.82% 0.0025 (0) 0.7479 (2,0) −0.0132 (0) −0.8359 (2) 0 n.a. n.a. n.a.
This table reports mean OLS estimates for Eq. (1) when it either does or does not experience a statistically significant break (at the 5% level) for each country in thesample and, in brackets, the number of ADRs for which they are (not) different from zero (one) at the 5% level. Ra2 is the adjusted R2; N is the number of ADRs; N⁎(No) is the subset where date kbim=arg max Fi
m (k) and Fim (kbim)≥11.78 (Fim (kbi
m)b11.78);P
kbmFi is the mean width of its confidence interval; |kbim⁎| is its median
absolute distance from the closest initial financial crisis date (from Table 1 in Kaminsky et al., 2003), both in weeks with subscript standard deviation.
198 P. Pasquariello / Journal of International Economics 76 (2008) 193–207
evolution (e.g., Kaminsky et al., 2003; Kallberg et al., 2005)), and iii) entails more than 70% of the ADRs from the 7 countries whoseaverage shift
PbΔbi is negative in Table 1. Those countries' average confidence intervals around their estimated break dates (columnP
kbmFi in Table 1) are generally tighter as well (except in Chile), ranging between 3 and 18 months. Lastly, efficiency breaks for
Argentine, South African, and Venezuelan ADRs are concentrated in the latter part of the sample, while substitutability betweendepositary receipts fromMexican and Chilean issuers and their underlying local stocks declined throughout the 1990s (see Fig. 1a).We conclude from this evidence that most of the recent financial crises involving emerging economies were accompanied by lowerefficiency in their ADR markets.
Interestingly, the country- and crisis-level evidence in Tables 1 and 3 also reveal that many estimated realignments are in thedirectionof the lawof oneprice: The average shift
PbΔbi is positive (0.41 inTable 3, pushingbi toward one fromapre-breakmeanof 0.49)for 9 of the 16 countries (and for 42 of the 81 companies)wherewe find statistically significant breaks in Eq. (1),most notably in Brazil,China, India, and Russia. In those 9 countries, about 81% of the ADRs whose estimated break is statistically significant experience animprovement in efficiency. However, these improvements are on average of smaller magnitude and occur within (a median of)25 weeks from official initial crisis dates, i.e., 10 weeks later than deteriorations. The trend for greater economic and financialintegration, better liquidity, and increasing interest of foreign investors exhibited by most emerging markets in the last two decades(e.g., see Bekaert et al., 2002; Lesmond, 2005) may have contributed to the greater efficiency of their ADRs over our sample period. Inaddition, extant studies (e.g., Disyatat and Gelos, 2001; Kallberg et al., 2005) find that the portfolio rebalancing activity of foreigninvestors across emergingmarkets greatly intensified during those crises and that some of thesemarketswere net recipients of funds.
In conjunction with the above results, this evidence suggests that portfolio rebalancing across emerging markets may haveimproved the efficiency of some of them and lessened the efficiency of others. We investigate more directly the role of the tradingactivityof foreign investors for theoccurrenceandclusteringof efficiencybreaks inproximityof periods offinancial turmoil in Section6.
According to Tables 2 and 3 and Fig. 1b, recent periods of financial turmoil were also associated with regime shifts in the ADRpricing model of Eq. (2). Table 2 reports that 79 ADRs in our sample experience a statistically significant break in the relationshipbetween their excess dollar returns and domestic and global sources of risk. In correspondence with these breaks, the estimatedΔbbim is positive on average— indicating greater covariance of ADR returnswith local risk factors— in 9 of the 15 countries, and 45 ofthe ADRs in our sample for which at least one regime shift in Eq. (2) is found (for a median relative increase of 109% with respect tothe pre-break bbim). Similarly, ΔbbiUS is on average negative and large — indicating lower covariance of ADR returns with world riskfactors — for 8 countries and 44 ADRs in Table 2 (for a median relative decline of 99% with respect to bbiUS).14 According to Table 3(columns ΔbbimN0 and ΔbbiUSN0), the persistent shifts in the sensitivity of those ADRs' returns to domestic and global sources of riskare economically significant as well, averaging 0.74 and −0.66 versus pre-break means of 0.58 and 0.60, respectively. In contrast to
14 Table 2 also indicates that both the average confidence intervals around the estimated pricing break dates kbim plotted in Fig. 1b,P
kbmFi , and their median
absolute distances from the closest initial crisis date in Kaminsky et al. (2003), |kbim⁎|, are generally larger (albeit more homogeneously so) than those for theefficiency break dates in Fig. 1a (reported in Table 1).
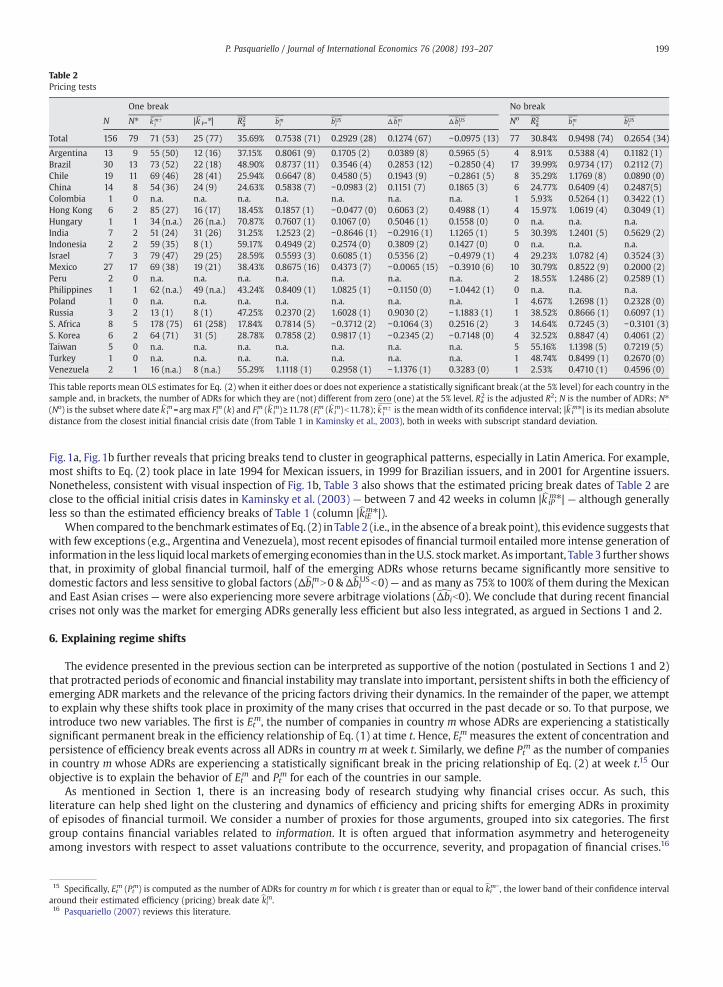
Table 2Pricing tests
One break No break
N N⁎P
kbmFi |kbim⁎| R2
a bbmi bbUS
i Δ bbmi Δ bbUS
i No R2a bbm
i bbUSi
Total 156 79 71 (53) 25 (77) 35.69% 0.7538 (71) 0.2929 (28) 0.1274 (67) −0.0975 (13) 77 30.84% 0.9498 (74) 0.2654 (34)
Argentina 13 9 55 (50) 12 (16) 37.15% 0.8061 (9) 0.1705 (2) 0.0389 (8) 0.5965 (5) 4 8.91% 0.5388 (4) 0.1182 (1)Brazil 30 13 73 (52) 22 (18) 48.90% 0.8737 (11) 0.3546 (4) 0.2853 (12) −0.2850 (4) 17 39.99% 0.9734 (17) 0.2112 (7)Chile 19 11 69 (46) 28 (41) 25.94% 0.6647 (8) 0.4580 (5) 0.1943 (9) −0.2861 (5) 8 35.29% 1.1769 (8) 0.0890 (0)China 14 8 54 (36) 24 (9) 24.63% 0.5838 (7) −0.0983 (2) 0.1151 (7) 0.1865 (3) 6 24.77% 0.6409 (4) 0.2487(5)Colombia 1 0 n.a. n.a. n.a. n.a. n.a. n.a. n.a. 1 5.93% 0.5264 (1) 0.3422 (1)Hong Kong 6 2 85 (27) 16 (17) 18.45% 0.1857 (1) −0.0477 (0) 0.6063 (2) 0.4988 (1) 4 15.97% 1.0619 (4) 0.3049 (1)Hungary 1 1 34 (n.a.) 26 (n.a.) 70.87% 0.7607 (1) 0.1067 (0) 0.5046 (1) 0.1558 (0) 0 n.a. n.a. n.a.India 7 2 51 (24) 31 (26) 31.25% 1.2523 (2) −0.8646 (1) −0.2916 (1) 1.1265 (1) 5 30.39% 1.2401 (5) 0.5629 (2)Indonesia 2 2 59 (35) 8 (1) 59.17% 0.4949 (2) 0.2574 (0) 0.3809 (2) 0.1427 (0) 0 n.a. n.a. n.a.Israel 7 3 79 (47) 29 (25) 28.59% 0.5593 (3) 0.6085 (1) 0.5356 (2) −0.4979 (1) 4 29.23% 1.0782 (4) 0.3524 (3)Mexico 27 17 69 (38) 19 (21) 38.43% 0.8675 (16) 0.4373 (7) −0.0065 (15) −0.3910 (6) 10 30.79% 0.8522 (9) 0.2000 (2)Peru 2 0 n.a. n.a. n.a. n.a. n.a. n.a. n.a. 2 18.55% 1.2486 (2) 0.2589 (1)Philippines 1 1 62 (n.a.) 49 (n.a.) 43.24% 0.8409 (1) 1.0825 (1) −0.1150 (0) −1.0442 (1) 0 n.a. n.a. n.a.Poland 1 0 n.a. n.a. n.a. n.a. n.a. n.a. n.a. 1 4.67% 1.2698 (1) 0.2328 (0)Russia 3 2 13 (1) 8 (1) 47.25% 0.2370 (2) 1.6028 (1) 0.9030 (2) −1.1883 (1) 1 38.52% 0.8666 (1) 0.6097 (1)S. Africa 8 5 178 (75) 61 (258) 17.84% 0.7814 (5) −0.3712 (2) −0.1064 (3) 0.2516 (2) 3 14.64% 0.7245 (3) −0.3101 (3)S. Korea 6 2 64 (71) 31 (5) 28.78% 0.7858 (2) 0.9817 (1) −0.2345 (2) −0.7148 (0) 4 32.52% 0.8847 (4) 0.4061 (2)Taiwan 5 0 n.a. n.a. n.a. n.a. n.a. n.a. n.a. 5 55.16% 1.1398 (5) 0.7219 (5)Turkey 1 0 n.a. n.a. n.a. n.a. n.a. n.a. n.a. 1 48.74% 0.8499 (1) 0.2670 (0)Venezuela 2 1 16 (n.a.) 8 (n.a.) 55.29% 1.1118 (1) 0.2958 (1) −1.1376 (1) 0.3283 (0) 1 2.53% 0.4710 (1) 0.4596 (0)
This table reports mean OLS estimates for Eq. (2) when it either does or does not experience a statistically significant break (at the 5% level) for each country in thesample and, in brackets, the number of ADRs for which they are (not) different from zero (one) at the 5% level. Ra2 is the adjusted R2; N is the number of ADRs; N⁎(No) is the subset where date kbim=arg max Fi
m (k) and Fim (kbim)≥11.78 (Fim (kbi
m)b11.78);P
kbmFi is the meanwidth of its confidence interval; |kbim⁎| is its median absolute
distance from the closest initial financial crisis date (from Table 1 in Kaminsky et al., 2003), both in weeks with subscript standard deviation.
199P. Pasquariello / Journal of International Economics 76 (2008) 193–207
Fig. 1a, Fig. 1b further reveals that pricing breaks tend to cluster in geographical patterns, especially in Latin America. For example,most shifts to Eq. (2) took place in late 1994 for Mexican issuers, in 1999 for Brazilian issuers, and in 2001 for Argentine issuers.Nonetheless, consistent with visual inspection of Fig. 1b, Table 3 also shows that the estimated pricing break dates of Table 2 areclose to the official initial crisis dates in Kaminsky et al. (2003) — between 7 and 42 weeks in column |kbiPm⁎| — although generallyless so than the estimated efficiency breaks of Table 1 (column |kbiEm⁎|).
When compared to the benchmark estimates of Eq. (2) inTable 2 (i.e., in the absence of a break point), this evidence suggests thatwith few exceptions (e.g., Argentina and Venezuela), most recent episodes of financial turmoil entailed more intense generation ofinformation in the less liquid localmarkets of emergingeconomies than in theU.S. stockmarket. As important, Table 3 further showsthat, in proximity of global financial turmoil, half of the emerging ADRs whose returns became significantly more sensitive todomestic factors and less sensitive to global factors (ΔbbimN0 & ΔbbiUSb0)— and as many as 75% to 100% of them during the Mexicanand East Asian crises —were also experiencing more severe arbitrage violations (bΔbib0). We conclude that during recent financialcrises not only was the market for emerging ADRs generally less efficient but also less integrated, as argued in Sections 1 and 2.
6. Explaining regime shifts
The evidence presented in the previous section can be interpreted as supportive of the notion (postulated in Sections 1 and 2)that protracted periods of economic and financial instability may translate into important, persistent shifts in both the efficiency ofemerging ADR markets and the relevance of the pricing factors driving their dynamics. In the remainder of the paper, we attemptto explain why these shifts took place in proximity of the many crises that occurred in the past decade or so. To that purpose, weintroduce two new variables. The first is Etm, the number of companies in country m whose ADRs are experiencing a statisticallysignificant permanent break in the efficiency relationship of Eq. (1) at time t. Hence, Etm measures the extent of concentration andpersistence of efficiency break events across all ADRs in countrym at week t. Similarly, we define Pt
m as the number of companiesin country m whose ADRs are experiencing a statistically significant break in the pricing relationship of Eq. (2) at week t.15 Ourobjective is to explain the behavior of Etm and Pt
m for each of the countries in our sample.As mentioned in Section 1, there is an increasing body of research studying why financial crises occur. As such, this
literature can help shed light on the clustering and dynamics of efficiency and pricing shifts for emerging ADRs in proximityof episodes of financial turmoil. We consider a number of proxies for those arguments, grouped into six categories. The firstgroup contains financial variables related to information. It is often argued that information asymmetry and heterogeneityamong investors with respect to asset valuations contribute to the occurrence, severity, and propagation of financial crises.16
15 Specifically, Etm (Ptm) is computed as the number of ADRs for country m for which t is greater than or equal to kbim−, the lower band of their confidence intervalaround their estimated efficiency (pricing) break date kbim.16 Pasquariello (2007) reviews this literature.
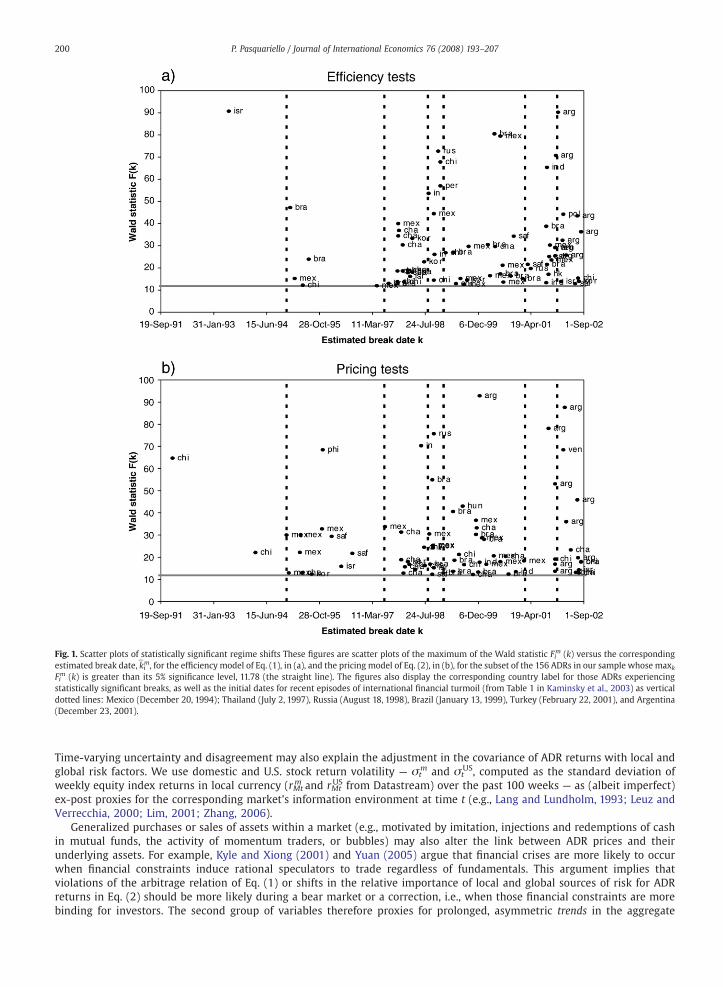
Fig. 1. Scatter plots of statistically significant regime shifts These figures are scatter plots of the maximum of the Wald statistic Fim (k) versus the corresponding
estimated break date, kbim, for the efficiency model of Eq. (1), in (a), and the pricing model of Eq. (2), in (b), for the subset of the 156 ADRs in our sample whose maxkFim (k) is greater than its 5% significance level, 11.78 (the straight line). The figures also display the corresponding country label for those ADRs experiencing
statistically significant breaks, as well as the initial dates for recent episodes of international financial turmoil (from Table 1 in Kaminsky et al., 2003) as verticaldotted lines: Mexico (December 20, 1994); Thailand (July 2, 1997), Russia (August 18, 1998), Brazil (January 13, 1999), Turkey (February 22, 2001), and Argentina(December 23, 2001).
200 P. Pasquariello / Journal of International Economics 76 (2008) 193–207
Time-varying uncertainty and disagreement may also explain the adjustment in the covariance of ADR returns with local andglobal risk factors. We use domestic and U.S. stock return volatility — σt
m and σtUS, computed as the standard deviation of
weekly equity index returns in local currency (rMtm and rMt
US from Datastream) over the past 100 weeks — as (albeit imperfect)ex-post proxies for the corresponding market's information environment at time t (e.g., Lang and Lundholm, 1993; Leuz andVerrecchia, 2000; Lim, 2001; Zhang, 2006).
Generalized purchases or sales of assets within a market (e.g., motivated by imitation, injections and redemptions of cashin mutual funds, the activity of momentum traders, or bubbles) may also alter the link between ADR prices and theirunderlying assets. For example, Kyle and Xiong (2001) and Yuan (2005) argue that financial crises are more likely to occurwhen financial constraints induce rational speculators to trade regardless of fundamentals. This argument implies thatviolations of the arbitrage relation of Eq. (1) or shifts in the relative importance of local and global sources of risk for ADRreturns in Eq. (2) should be more likely during a bear market or a correction, i.e., when those financial constraints are morebinding for investors. The second group of variables therefore proxies for prolonged, asymmetric trends in the aggregate
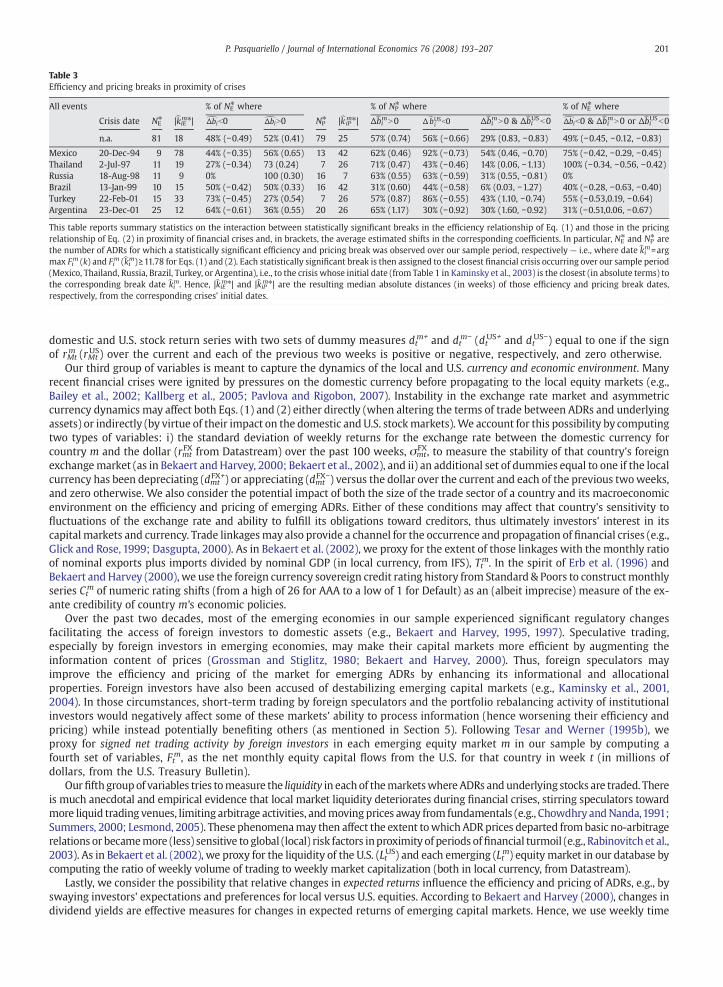
Table 3Efficiency and pricing breaks in proximity of crises
All events % of NE⁎ where % of NP⁎ where % of NE⁎ where
Crisis date NE⁎ |kbiEm⁎| bΔbib0 bΔbiN0 NP⁎ |kbiPm⁎| Δbbi
mN0 Δbb USi b0 ΔbbimN0 & ΔbbiUSb0 bΔbib0 & ΔbbimN0 or Δbbi
USb0
n.a. 81 18 48% (−0.49) 52% (0.41) 79 25 57% (0.74) 56% (−0.66) 29% (0.83, −0.83) 49% (−0.45, −0.12, −0.83)
Mexico 20-Dec-94 9 78 44% (−0.35) 56% (0.65) 13 42 62% (0.46) 92% (−0.73) 54% (0.46, −0.70) 75% (−0.42, −0.29, −0.45)Thailand 2-Jul-97 11 19 27% (−0.34) 73 (0.24) 7 26 71% (0.47) 43% (−0.46) 14% (0.06, −1.13) 100% (−0.34, −0.56, −0.42)Russia 18-Aug-98 11 9 0% 100 (0.30) 16 7 63% (0.55) 63% (−0.59) 31% (0.55, −0.81) 0%Brazil 13-Jan-99 10 15 50% (−0.42) 50% (0.33) 16 42 31% (0.60) 44% (−0.58) 6% (0.03, −1.27) 40% (−0.28, −0.63, −0.40)Turkey 22-Feb-01 15 33 73% (−0.45) 27% (0.54) 7 26 57% (0.87) 86% (−0.55) 43% (1.10, −0.74) 55% (−0.53,0.19, −0.64)Argentina 23-Dec-01 25 12 64% (−0.61) 36% (0.55) 20 26 65% (1.17) 30% (−0.92) 30% (1.60, −0.92) 31% (−0.51,0.06, −0.67)
This table reports summary statistics on the interaction between statistically significant breaks in the efficiency relationship of Eq. (1) and those in the pricingrelationship of Eq. (2) in proximity of financial crises and, in brackets, the average estimated shifts in the corresponding coefficients. In particular, NE⁎ and NP⁎ arethe number of ADRs for which a statistically significant efficiency and pricing break was observed over our sample period, respectively — i.e., where date kbim=argmax Fi
m (k) and Fim (kbim)≥11.78 for Eqs. (1) and (2). Each statistically significant break is then assigned to the closest financial crisis occurring over our sample period
(Mexico, Thailand, Russia, Brazil, Turkey, or Argentina), i.e., to the crisis whose initial date (from Table 1 in Kaminsky et al., 2003) is the closest (in absolute terms) tothe corresponding break date kbim. Hence, |kbiEm⁎| and |kbiPm⁎| are the resulting median absolute distances (in weeks) of those efficiency and pricing break dates,respectively, from the corresponding crises' initial dates.
201P. Pasquariello / Journal of International Economics 76 (2008) 193–207
domestic and U.S. stock return series with two sets of dummy measures dtm+ and dt
m− (dtUS+ and dtUS−) equal to one if the sign
of rMtm (rMt
US) over the current and each of the previous two weeks is positive or negative, respectively, and zero otherwise.Our third group of variables is meant to capture the dynamics of the local and U.S. currency and economic environment. Many
recent financial crises were ignited by pressures on the domestic currency before propagating to the local equity markets (e.g.,Bailey et al., 2002; Kallberg et al., 2005; Pavlova and Rigobon, 2007). Instability in the exchange rate market and asymmetriccurrency dynamics may affect both Eqs. (1) and (2) either directly (when altering the terms of trade between ADRs and underlyingassets) or indirectly (by virtue of their impact on the domestic and U.S. stockmarkets).We account for this possibility by computingtwo types of variables: i) the standard deviation of weekly returns for the exchange rate between the domestic currency forcountry m and the dollar (rmt
FX from Datastream) over the past 100 weeks, σmtFX, to measure the stability of that country's foreign
exchangemarket (as in Bekaert and Harvey, 2000; Bekaert et al., 2002), and ii) an additional set of dummies equal to one if the localcurrency has been depreciating (dmt
FX+) or appreciating (dmtFX−) versus the dollar over the current and each of the previous twoweeks,
and zero otherwise. We also consider the potential impact of both the size of the trade sector of a country and its macroeconomicenvironment on the efficiency and pricing of emerging ADRs. Either of these conditions may affect that country's sensitivity tofluctuations of the exchange rate and ability to fulfill its obligations toward creditors, thus ultimately investors' interest in itscapital markets and currency. Trade linkagesmay also provide a channel for the occurrence and propagation of financial crises (e.g.,Glick and Rose, 1999; Dasgupta, 2000). As in Bekaert et al. (2002), we proxy for the extent of those linkages with the monthly ratioof nominal exports plus imports divided by nominal GDP (in local currency, from IFS), Ttm. In the spirit of Erb et al. (1996) andBekaert and Harvey (2000), we use the foreign currency sovereign credit rating history from Standard & Poors to constructmonthlyseries Ctm of numeric rating shifts (from a high of 26 for AAA to a low of 1 for Default) as an (albeit imprecise) measure of the ex-ante credibility of country m's economic policies.
Over the past two decades, most of the emerging economies in our sample experienced significant regulatory changesfacilitating the access of foreign investors to domestic assets (e.g., Bekaert and Harvey, 1995, 1997). Speculative trading,especially by foreign investors in emerging economies, may make their capital markets more efficient by augmenting theinformation content of prices (Grossman and Stiglitz, 1980; Bekaert and Harvey, 2000). Thus, foreign speculators mayimprove the efficiency and pricing of the market for emerging ADRs by enhancing its informational and allocationalproperties. Foreign investors have also been accused of destabilizing emerging capital markets (e.g., Kaminsky et al., 2001,2004). In those circumstances, short-term trading by foreign speculators and the portfolio rebalancing activity of institutionalinvestors would negatively affect some of these markets' ability to process information (hence worsening their efficiency andpricing) while instead potentially benefiting others (as mentioned in Section 5). Following Tesar and Werner (1995b), weproxy for signed net trading activity by foreign investors in each emerging equity market m in our sample by computing afourth set of variables, Ftm, as the net monthly equity capital flows from the U.S. for that country in week t (in millions ofdollars, from the U.S. Treasury Bulletin).
Ourfifth groupof variables tries tomeasure the liquidity in eachof themarketswhere ADRs andunderlying stocks are traded. Thereis much anecdotal and empirical evidence that local market liquidity deteriorates during financial crises, stirring speculators towardmore liquid trading venues, limiting arbitrage activities, andmoving prices away from fundamentals (e.g., Chowdhry andNanda,1991;Summers, 2000; Lesmond, 2005). These phenomenamay then affect the extent towhich ADRprices departed frombasic no-arbitragerelations or becamemore (less) sensitive to global (local) risk factors inproximity of periods offinancial turmoil (e.g., Rabinovitch et al.,2003). As in Bekaert et al. (2002), we proxy for the liquidity of the U.S. (LtUS) and each emerging (Ltm) equity market in our database bycomputing the ratio of weekly volume of trading to weekly market capitalization (both in local currency, from Datastream).
Lastly, we consider the possibility that relative changes in expected returns influence the efficiency and pricing of ADRs, e.g., byswaying investors' expectations and preferences for local versus U.S. equities. According to Bekaert and Harvey (2000), changes individend yields are effective measures for changes in expected returns of emerging capital markets. Hence, we use weekly time
202 P. Pasquariello / Journal of International Economics 76 (2008) 193–207
series of annualized dividend yield levels from Datastream to define two new sets of variables, Dtm and Dt
US, in each of theemerging markets in our sample and in the U.S. stock market.17
6.1. The analysis
We now test whether the various proxies devised above can explain the occurrence and clustering of the persistent efficiencyand pricing breaks reported in Tables 1 and 2 and displayed in Fig. 1. To accomplish this task, the simplest approach would be to usemultivariate linear regressions. However, because the breaks are (by definition) unique events and concentrate over relativelyshort periods of time, the discrete dependent variables Etm and Pt
m show a preponderance of zeros and small values. According tothe econometric literature (e.g., Greene,1997), the Poisson regressionmodel is a better specification to account for these propertiesof the data. This model assumes that each discrete dependent variable Yt
m (either Etm or Ptm) is drawn from a Poisson distributionwith parameter λt
m, such that
17 As icoefficiethe incrdividen18 By coccurrecountsresults19 Foravailablconstan20 Thecountrycountrygovernain eachthe objethose dcountry21 Sincthan fo
Pr Ymt ¼ i
� � ¼ e−λmt λm
t
� �ii!
; ð4Þ
i is the number of ADRs in countrym experiencing a break in Eq. (1), when Ytm=Etm, or in Eq. (2), when Yt
m=Ptm.18 We impose
wherethat the parameter λtm is related to our six groups of regressors in terms of the following log-linear model:
lnλmt ¼ γ1σ
mt þ γ2σ
USt þ γ3d
mmt þ γ4d
m−t þ γ5d
USmt þ γ6d
US−t þ γ7σ
FXmt þ γ8d
FXmmt þ γ9d
FX−mt þ γ10T
mt þ γ11C
mt þ γ12F
mt þ γ13L
mt
þ γ14LUSt þ γ15D
mt þ γ16D
USt : ð5Þ
estimate the parameters of Eq. (5) by maximum likelihood, report the results in Table 4 for Ytm=Etm and in Table 5 for
WeYtm=Ptm for each emerging country m in our sample, and then discuss our evidence separately for countries experiencing either a
deterioration or an improvement in their efficiency and/or pricing relationships.19
Before proceeding, an important premise is necessary. Despite their popularity, there is little work exploring the properties ofmost of the regressors in Eq. (5) or discriminating among their numerous, often potentially conflicting interpretations. As such, theanalysis that follows is of an exploratory nature and any inference based upon it should be interpreted with caution. With thesecaveats in mind, our model appears to performwell for both sets of dependent variables Etm and Pt
m. The Poisson model producesno obvious counterpart to the R2 of linear regressions. Yet, two alternative measures of goodness of fit based on standardizedresiduals (RP2) and log-deviances (RD2) are mostly greater than 90%, while the chi-squared statistic (χ2) rejects the null hypothesisthat the slopes in Eq. (5) are all zero for all countries but Hong Kong and Poland in Table 4 and South Korea in Table 5. Further, ourevidence suggests that information asymmetry, domestic and U.S. economic conditions, and changes in relative liquidity andexpected returns are the most relevant factors in explaining the clustering of efficiency and pricing breaks over the last decade.20
To beginwith, we find that the likelihood of an emerging ADR market to become less efficient is negatively related to domesticequity volatility and positively related to U.S. stock market volatility. Specifically, we find statistically significant (often at the 1%level) γb1b0 and/or γb2N0 in Eq. (5) for most of those countries (e.g., Argentina, Chile, Mexico, Peru, South Africa, and Venezuela, butnot Poland) whose ADR markets experienced a deterioration in their efficiency relationships over the sample period — i.e., whereon average bΔbib0 in Eq. (1) according to Table 1. Not surprisingly, in those same countries the greater the fluctuations in thedomestic currency the more likely are ADR returns to violate the law of one price: γb7N0 in Eq. (5) for Etm. Along those lines, thecoefficient γ 7 is instead negative and significant for China, Hong Kong, India, and Israel (but not Brazil and Russia), whose ADRmarkets were found to become more (rather than less) efficient during the 1990s (again in Table 1).21 However, the impact of the
n Bekaert and Harvey (2000), the weekly emerging market dividend yield series (Dtm) are highly persistent, with an average first-order autocorrelation
nt of 0.974. Dividend yields in the U.S. (DtUS) are characterized by a pronounced downward trend over the sample period, which can be in part ascribed to
easing popularity of alternative payout policies (e.g., stock repurchases or stock rights) by U.S. corporations. No such trends can be identified for thed yield series Dt
m.onstruction, both time series Etm and Pt
m (as well as their first differences) display high positive serial correlation, thus violating the assumption that eventnces generated by a Poisson point process in successive time intervals are independent. Unfortunately, alternative time series regression models forwith those properties are neither available nor well developed yet (e.g., see the surveys by Cameron and Trivedi, 1996; Greene, 1997, Chapter 19). Thefrom multiple linear regressions (available on request) are nonetheless qualitatively similar.each country m, the sample over which Eqs. (4) and (5) are estimated starts on the first potential break date for the ADR with the earliest return datae (t0 in Tables 4 and 5), hence is made of no less than N=247 weeks (India) and up to 1, 210 weeks (South Africa). The specification of Eq. (5) has not term to avoid the possibility of collinear regressors in the estimation.model of Eq. (5) does not explicitly account for the possibility that the total number of ADRs in a country at each point in timemay itself be affected by that's degree of financial development and vulnerability to crisis events. We discuss in this section the impact of time-varying local market openness on the-level evidence presented in Section 5. At the firm level, issuance of ADRs has been motivated by liquidity, cost of capital, visibility, signaling, and corporatence considerations, among others (e.g., see the surveys in Karolyi,1998, 2006). Any of these considerationsmayexplain the imbalance in the number of ADRscountry in our sample (see column N in Table 1a), as well as in turn be affected by periods of financial turmoil, thus potentially biasing our inference. It is notctive of this study to examine firms' ADR issuance decisions in emerging economies or whether causes and consequences of financial crises are relevant forecisions. Nevertheless, when scaling each discrete dependent variable Yt
m (either Etm or Ptm) by the corresponding total number of ADRs in the sample form in week t and estimating Tobit regressions for the resulting ratios, we find the inference below qualitatively unaffected.e the weekly currency return volatility σmt
FX for China, Hong Kong, and India (with a mean of 0.89%, 0.03%, and 0.45%, respectively) is generally smallerr the other countries in the sample, the corresponding estimates of γb7 in Table 4 are of greater absolute magnitude.

Table 4Explaining efficiency breaks Etm
Argentina Brazil Chile China Hong Kong India Indonesia Israel Mexico Peru Philippines Poland Russia S. Africa S. Korea Venezuela
Informationσt
m −102.5⁎⁎⁎ −0.2720 −20.65⁎⁎⁎ 11.30⁎⁎⁎ −124.7⁎⁎ 87.91⁎⁎⁎ −28.02⁎⁎⁎ −4.7869 −6.8658⁎ 24.49 −7.7363 8.6179 −24.24⁎⁎ −17.24⁎⁎⁎ −37.75⁎⁎⁎ −111.0⁎⁎⁎(−5.49) (−0.11) (−4.69) (5.22) (−2.15) (5.55) (−4.08) (−0.36) (−1.93) (0.88) (−0.60) (0.05) (−3.36) (−5.09) (−3.99) (−4.52)
σtUS 138.7⁎⁎⁎ 40.21⁎⁎⁎ 56.54⁎⁎⁎ 17.65⁎ 29.02 −258.5⁎⁎⁎ 85.44⁎⁎⁎ 44.33⁎⁎⁎ 47.32⁎⁎⁎ 128.9⁎⁎⁎ −41.14⁎⁎ 14.36 83.31⁎⁎⁎ 17.49⁎⁎⁎ 97.61⁎⁎⁎ 212.8⁎⁎⁎
(8.26) (5.78) (8.55) (1.92) (0.51) (−3.51) (6.18) (3.79) (9.39) (3.81) (−2.05) (0.16) (3.89) (4.48) (8.20) (4.03)Trenddtm+ 0.0581 −0.0497 0.0115 −0.0638 −0.3400 0.4674⁎ 0.0666 −0.0405 0.0294 −0.0605 −0.1171 0.0741 0.0251 0.0274 −0.0229 −0.1753
(0.42) (−0.86) (0.22) (−0.98) (−0.84) (1.69) (−0.49) (−0.44) (0.61) (−0.28) (−0.70) (0.17) (0.22) (0.54) (−0.21) (−0.49)dtm− 0.2523⁎ 0.0280 0.0319 −0.0287 −0.0330 −0.6019⁎⁎ 0.0254 0.0400 0.0678 −0.1066 −0.0377 −0.0461 −0.0644 −0.0032 0.0438 −0.0830
(1.85) (0.38) (0.59) (−0.45) (−0.10) (−2.44) (0.19) (0.37) (1.19) (−0.58) (−0.28) (−0.13) (−0.47) (−0.05) (0.37) (−0.35)dtUS+ −0.0714 −0.0112 −0.0193 0.0066 −0.2809 0.0938 −0.0830 0.0078 −0.0296 −0.0536 0.0462 −0.2597 −0.0862 −0.0169 −0.0816 −0.0736
(−0.45) (−0.20) (−0.38) (0.11) (−0.71) (0.33) (−0.64) (0.08) (−0.65) (−0.28) (0.35) (−0.39) (−0.67) (−0.32) (−0.80) (−0.22)dtUS− 0.1240 −0.0003 0.0192 −0.0210 −0.0487 0.3998⁎ 0.0943 0.0030 0.0276 0.0746 −0.0498 0.0297 0.1320 0.0371 0.0804 0.3198
(1.03) (−0.01) (0.30) (−0.30) (−0.14) (1.80) (0.65) (0.03) (0.51) (0.36) (−0.28) (0.08) (0.99) (0.55) (0.75) (1.28)Currency and economic environmentσmt
FX 84.69⁎⁎⁎ 2.5500⁎ −2.8185 −626.0⁎⁎⁎ −16,436⁎⁎⁎ −1,107.8⁎⁎⁎ −1.4116 −44.79⁎ 10.47⁎⁎⁎ 0.9523 1.7945 −139.8 9.5619⁎⁎⁎ 8.2074⁎⁎⁎ 39.23⁎⁎⁎ −9.9911(6.33) (1.65) (−0.41) (−4.69) (−3.86) (−3.79) (−0.04) (−1.93) (3.73) (0.02) (0.15) (−0.29) (4.15) (3.25) (5.24) (−0.47)
dmtFX+ −0.1407 −0.0446 0.0227 −0.1044 −0.1631 0.5823⁎⁎ −0.0494 −0.0070 0.0439 0.1129 −0.0884 0.0156 −0.1681 −0.0231 0.1510 0.0556
(−0.83) (−0.92) (0.49) (−1.27) (−0.41) (2.18) (−0.39) (−0.07) (0.89) (0.54) (−0.65) (0.03) (−1.60) (−0.44) (1.45) (0.26)dmtFX− 0.0172 0.0189 0.0161 0.0531 0.0208 −0.1677 −0.0097 −0.0049 0.0108 −0.0296 0.0049 −0.0496 −0.2572⁎ 0.0306 0.0643 −0.1265
(0.13) (0.26) (0.26) (0.57) (0.05) (−0.70) (−0.06) (−0.05) (0.20) (−0.12) (0.03) (−0.12) (−1.72) (0.51) (0.64) (−0.36)Ttm −6.7281⁎⁎ 4.9429⁎⁎⁎ −6.3495⁎⁎⁎ n.a. −6.3460⁎⁎⁎ −42.74⁎ 2.8350⁎⁎⁎ −0.6906 −0.1151 −12.15 4.6542⁎⁎⁎ 15,872 1.4961 −1.1511⁎⁎ 2.3423⁎⁎⁎ −1.8429
(−2.23) (4.28) (−6.57) (−2.82) (−1.73) (6.64) (−0.70) (−0.30) (−0.95) (4.10) (0.00) (1.09) (−2.29) (3.26) (−0.24)Ctm −0.1140⁎⁎⁎ 0.0637⁎⁎⁎ 0.2884⁎⁎⁎ 0.0796⁎⁎⁎ 1.2077⁎⁎⁎ 0.7867 −0.0061 0.0389 0.1432⁎⁎⁎ 0.0248 −0.1874⁎ −529.6 0.0509⁎⁎ 0.0777⁎⁎⁎ −0.0012 −0.0050
(−5.17) (3.94) (10.99) (4.20) (3.40) (1.51) (−0.43) (1.03) (6.27) (0.08) (−1.72) (0.00) (2.23) (5.43) (−0.04) (−0.03)Investors' activityFtm −0.0006 −0.0001 −0.0001 0.0002 −0.00004 −0.0032⁎ −0.0005 −0.0001 −0.00001 −0.0011 0.0015 0.0036 0.0014 0.0001 −0.0002 0.0012
(−1.64) (−1.15) (−0.43) (0.85) (−0.40) (−1.66) (−0.49) (−0.49) (−0.22) (−0.81) (0.92) (0.21) (1.11) (0.39) (−1.42) (0.52)Market liquidityLtm −0.1180⁎⁎ 0.0072 0.0879 −0.0009⁎⁎⁎ −0.1580 −30.55⁎⁎⁎ 11.83 n.a. −0.0846 0.0640 −0.1671 0.4861 0.0002 0.3019 1.5076 −0.5078
(−2.09) (0.25) (0.07) (−2.78) (−0.42) (−4.30) (0.94) (−1.58) (0.72) (−1.03) (0.21) (0.29) (1.46) (0.11) (−0.08)LtUS 0.1255 0.2249⁎⁎ 0.2747⁎⁎ 0.2505⁎⁎ 0.3525 0.3368 0.4947⁎ 0.0876 0.4541⁎⁎ 0.5859 0.9115⁎⁎⁎ 0.2167 0.5227⁎⁎ 0.5182⁎⁎ 0.5955⁎⁎ 0.5628
(0.71) (2.07) (2.54) (1.99) (0.65) (0.93) (1.77) (0.45) (5.71) (1.51) (3.07) (0.34) (2.31) (4.23) (3.01) (1.44)Expected returnsDt
m 0.3828⁎⁎⁎ −0.0693⁎⁎⁎ −0.1251⁎⁎⁎ −0.1627⁎⁎ 0.9551⁎⁎ 0.4890 0.1771⁎ n.a. −0.1228⁎⁎ 0.5316 −0.0113 −0.5609 −0.0662 0.1112⁎⁎⁎ 0.0621 −0.0421(9.02) (−4.24) (−3.76) (−5.89) (1.97) (1.20) (1.68) (−2.14) (1.53) (−0.06) (−0.33) (−0.95) (4.08) (0.77) (−0.43)
DtUS 0.1043 −0.7208⁎⁎⁎ −0.4806⁎⁎⁎ 0.1752 −3.9257⁎⁎⁎ 4.6872⁎⁎⁎ −2.5391⁎⁎⁎ −0.845 −0.8269⁎⁎⁎ −1.6017⁎⁎⁎ −0.7179⁎⁎⁎ 0.0750 −1.5681⁎⁎⁎ −0.1552⁎⁎⁎ −1.9696⁎⁎⁎ −1.4139
(0.31) (−8.10) (−7.43) (0.80) (−2.53) (4.03) (−6.94) (−0.71) (−9.21) (−3.11) (−3.78) (0.03) (−5.24) (−4.30) (−5.14) (−1.24)t0 12/7/93 3/15/94 11/28/89 12/21/93 11/19/96 7/14/98 3/21/95 12/1/92 5/31/88 10/15/96 2/9/88 12/5/00 6/3/97 5/27/80 3/14/95 8/17/93N 487 473 697 485 333 247 420 534 775 338 791 122 305 1,210 421 503RP2 95.86% 94.55% 95.95% 88.53% 90.71% 77.73% 81.98% 85.66% 97.68% 59.76% 67.65% 98.48% 63.08% 88.01% 75.10% 93.04%
RD2 94.45% 92.81% 96.09% 91.41% 88.79% 78.91% 85.67% 82.74% 97.39% 71.13% 75.03% 98.35% 70.78% 85.21% 82.93% 90.32%
χ2 132.5⁎⁎⁎ 74.87⁎⁎⁎ 68.79⁎⁎⁎ 146.9⁎⁎⁎ 21.65 67.17⁎⁎⁎ 53.40⁎⁎⁎ 28.25⁎⁎⁎ 102.8⁎⁎⁎ 39.04⁎⁎⁎ 119.0⁎⁎⁎ 0.8687 71.90⁎⁎⁎ 92.67⁎⁎⁎ 104.4⁎⁎⁎ 38.57⁎⁎⁎(0.0000) (0.0000) (0.0000) (0.0000) (0.1172) (0.0000) (0.0000) (0.0083) (0.0000) (0.0006) (0.0000) (1.0000) (0.0000) (0.0000) (0.0000) (0.0007)
This table reports maximum likelihood estimates for the Poisson regression model of Eqs. (4) and (5) when Ytm=Etm for countrym over an interval starting on the earliest potential break date (t0). N is the resulting number of
observations. RP2 is the Pearson R2; RD2 is the Deviance R2; χ2 is a goodness-of-fit statistic; its p-values are in parentheses. A “ ⁎ ”, “ ⁎⁎ ”, or “ ⁎⁎⁎ ” indicate significance at the 10%, 5%, or 1% level, respectively. 203P.Pasquariello
/Journal
ofInternational
Economics
76(2008)
193–207

Table 5Explaining pricing breaks Ptm
Argentina Brazil Chile China Hong Kong Hungary India Indonesia Israel Mexico Philippines Russia S. Africa S. Korea Venezuela
Informationσt
m −63.03⁎⁎⁎ −24.58⁎⁎⁎ −7.6265 −2.4965 −2.7346 10.35 30.67⁎⁎ −27.20⁎⁎⁎ −35.46⁎ −16.71⁎⁎⁎ −12.50 −14.48⁎ 4.0104 −25.20⁎⁎⁎ −213.0⁎⁎⁎(−4.79) (−5.72) (−1.61) (−1.14) (−0.25) (0.56) (2.56) (−4.02) (−1.91) (−4.32) (−0.95) (−1.84) (1.35) (−3.26) (−3.21)
σtUS 196.2⁎⁎⁎ 114.0⁎⁎⁎ 75.96⁎⁎⁎ 50.70⁎⁎⁎ 51.25⁎ 117.6⁎⁎⁎ 72.11⁎ 78.57⁎⁎⁎ 48.29⁎⁎⁎ 25.54⁎⁎⁎ −36.88⁎ 72.14⁎⁎⁎ −0.0310 19.45 141.5⁎⁎
(12.63) (13.36) (10.90) (8.05) (1.95) (2.97) (1.81) (5.81) (3.56) (4.84) (−1.80) (3.01) (−0.01) (1.46) (2.08)Trend
dtm+ 0.0601 0.0700 0.0121 −0.0913 −0.1270 0.1449 0.0363 −0.0523 −0.0179 0.0286 −0.0771 0.0392 0.0073 0.0462 −0.5077
(0.48) (1.14) (0.22) (−1.31) (−0.88) (0.66) (0.21) (−0.39) (−0.17) (0.61) (−0.46) (0.31) (0.15) (0.38) (−0.85)dtm− 0.1821⁎ 0.1122 0.0479 −0.0030 −0.0153 0.0367 −0.1596 0.0023 0.0130 0.0332 −0.0486 0.0318 0.0125 −0.0412 −0.2263
(1.75) (1.52) (0.84) (−0.04) (−0.12) (0.19) (−0.94) (0.02) (0.10) (0.60) (−0.36) (0.22) (0.22) (−0.32) (−0.59)dtUS+ −0.1369 −0.0941 −0.0328 −0.0074 0.0047 −0.2441 −0.0384 −0.0486 −0.0708 −0.0397 0.0166 −0.0408 0.0041 −0.0497 0.5241
(−1.08) (−1.51) (−0.60) (−0.12) (0.04) (−1.08) (−0.21) (−0.39) (−0.68) (−0.93) (0.22) (−0.30) (0.09) (−0.48) (0.94)dtUS− 0.1609 0.0082 0.0491 0.0204 0.0019 0.0966 0.1481 0.0861 −0.0104 0.0334 −0.0476 0.0803 0.0187 0.0149 0.3339
(1.62) (0.13) (0.77) (0.28) (0.01) (0.44) (0.88) (0.60) (−0.08) (0.63) (−0.26) (0.52) (0.28) (0.11) (0.90)Currency and economic environment
σmtFX 39.68⁎⁎⁎ 7.7168⁎⁎⁎ −33.21⁎⁎⁎ −14.85⁎⁎⁎ 95.22 94.51 −139.3 −2.9209 10.37 21.99⁎⁎⁎ 4.3217 7.7446⁎⁎⁎ −0.0811 21.22⁎⁎⁎ 20.04
(4.16) (4.66) (−4.41) (−2.74) (0.07) (0.83) (−1.61) (−0.09) (0.36) (8.63) (0.35) (3.19) (−0.03) (3.50) (0.68)dmtFX+ −0.1179 −0.0334 0.0123 −0.0586 0.0287 −0.0340 0.0916 −0.0218 −0.0444 0.0143 −0.0792 −0.1592 −0.0102 0.0539 −0.1665
(−0.71) (−0.64) (0.25) (−0.67) (0.24) (−0.16) (0.57) (−0.17) (−0.38) (0.30) (−0.58) (−1.33) (−0.21) (0.49) (−0.50)dmtFX− −0.1789 0.0447 0.0166 0.0228 0.0449 −0.0510 −0.1356 −0.0282 0.0957 0.0048 0.0074 −0.2250 −0.0097 0.0202 −0.1215
(−1.40) (0.62) (0.26) (0.24) (0.25) (−0.22) (−0.65) (−0.16) −6.9352⁎⁎⁎ 1.0543⁎⁎⁎ 4.6334⁎⁎⁎ 0.4027 −1.8805⁎⁎⁎ 1.4954⁎ 4.9430Ttm −0.1608 −3.3730⁎⁎⁎ −2.9894⁎⁎⁎ n.a. −1.1240⁎⁎ −1.3260 −3.1034 2.8525⁎⁎⁎ (−6.04) (2.84) (4.01) (0.27) (−3.47) (1.95) (0.37)
(−0.08) (−2.55) (−2.97) (−2.21) (−0.96) (−0.35) (6.93) 0.3432⁎⁎⁎ 0.1780⁎⁎⁎ −0.1740 0.0172 0.1716⁎⁎⁎ 0.0752⁎⁎⁎ 0.2422Ctm −0.0410⁎⁎ 0.1786⁎⁎⁎ 0.1555⁎⁎⁎ 0.0851⁎⁎⁎ 0.1521⁎⁎ −0.0242 −0.1724 −0.0041 (6.54) (7.31) (−1.58) (0.69) (11.18) (2.76) (0.99)
(−2.23) (7.16) (5.56) (4.46) (2.11) (−0.14) (−0.78) (−0.29)Investors' activity
Ftm −0.0003 −0.0001 −0.0003 −0.0002 −0.00001 −0.0013 0.0016 −0.0007 0.00003 0.00004 0.0014 0.0008 0.0003 0.00003 −0.0010
(−1.10) (−1.28) (−1.06) (−0.77) (−0.19) (−0.52) (1.55) (−0.67) (0.17) (0.54) (0.87) (0.56) (1.20) (0.22) (−0.21)Market liquidity
Ltm −0.1463⁎⁎⁎ 0.0226 0.9328 −0.0004 0.0436 −54.75 −0.3121 13.01 n.a. −0.4897⁎⁎⁎ −0.1484 0.0001 −0.0360 −3.3398 −9.7260
(−2.95) (0.82) (0.78) (−1.29) (0.59) (−1.56) (−0.10) (1.05) (−5.95) (−0.91) (0.12) (−0.19) (−0.18) (−0.57)LtUS 0.7352⁎⁎⁎ 0.1014 0.3185⁎⁎⁎ 0.3137⁎⁎⁎ 0.1944 0.4797 0.0901 0.4589⁎ 0.840⁎⁎ 0.5387⁎⁎⁎ 0.8209⁎⁎⁎ 0.4865⁎ 0.4605⁎⁎⁎ 0.2083 0.4482
(4.62) (0.91) (2.94) (2.63) (0.75) (1.11) (0.28) (1.66) (2.23) (6.78) (2.73) (1.85) (3.74) (0.88) (0.81)Expected returns
Dtm 0.1487⁎⁎⁎ 0.1154⁎⁎⁎ −0.2667⁎⁎⁎ 0.0155 0.1383 −0.2260 −0.6431⁎⁎⁎ 0.1870⁎ n.a. −0.4309⁎⁎⁎ −0.0195 −0.1540⁎ −0.0881⁎⁎ 0.0299 0.0697
(4.84) (6.98) (−6.11) (0.62) (1.64) (−0.88) (−2.59) (1.80) (−6.08) (−0.10) (−1.93) (−2.50) (0.33) (0.56)Dt
US −2.4326⁎⁎⁎ −1.7685⁎⁎⁎ −0.2369⁎⁎⁎ −0.9133⁎⁎⁎ −1.0599⁎⁎⁎ −1.9280⁎⁎⁎ 1.2889 −2.4323⁎⁎⁎ −0.9282⁎⁎⁎ −0.6964⁎⁎⁎ −0.8153⁎⁎⁎ −1.0930⁎⁎⁎ −0.3071⁎⁎⁎ −1.1563⁎⁎⁎ −2.4646(−9.19) (13.92) (−3.55) (−7.61) (−2.73) (−2.63) (1.51) (−6.96) (−6.20) (−7.14) (−4.05) (−3.29) (−8.35) (−4.46) (−1.35)
t0 12/7/93 3/15/94 11/28/89 12/21/93 11/19/96 4/14/98 7/14/98 3/21/95 12/1/92 5/31/88 2/9/88 6/3/97 5/27/80 3/14/95 8/17/93N 487 473 697 485 333 260 247 420 534 775 791 305 1,210 421 503RP2 94.24% 95.16% 95.23% 90.23% 32.92% 41.91% 63.04% 81.68% 72.24% 90.29% 68.87% 53.57% 83.76% 69.08% 92.37%
RD2 92.17% 95.58% 94.85% 91.40% 51.59% 57.70% 70.03% 85.64% 78.51% 91.03% 76.09% 66.83% 82.93% 70.88% 88.50%
χ2 140.2⁎⁎⁎ 102.7⁎⁎⁎ 92.52⁎⁎⁎ 95.83⁎⁎⁎ 38.63⁎⁎⁎ 27.88⁎⁎ 37.28⁎⁎⁎ 52.79⁎⁎⁎ 105.3⁎⁎⁎ 447.5⁎⁎⁎ 117.1⁎⁎⁎ 59.43⁎⁎⁎ 207.0⁎⁎⁎ 19.79 33.27⁎⁎⁎(0.0000) (0.0000) (0.0000) (0.0000) (0.0007) (0.0223) (0.0012) (0.0000) (0.0000) (0.0006) (0.0000) (0.0003) (0.0000) (0.1802) (0.0043)
This table reports maximum likelihood estimates for the Poisson regression model of Eqs. (4) and (5) when Ytm=Ptm for countrym over an interval starting on the earliest potential break date (t0). N is the resulting number of
observations. RP2 is the Pearson R2; RD2 is the Deviance R2; χ2 is a goodness-of-fit statistic; its p-values are in parentheses. A “ ⁎ ”, “ ⁎⁎ ”, or “ ⁎⁎⁎ ” indicate significance at the 10%, 5%, or 1% level, respectively.
204P.Pasquariello
/Journal
ofInternational
Economics
76(2008)
193–207

205P. Pasquariello / Journal of International Economics 76 (2008) 193–207
exchange rate on the efficiency of emerging ADR markets is symmetrically unrelated to its prolonged unidirectional swings:Coefficients for dmt
FX+ and dmtFX− in Table 4 are statistically insignificant for most of the countries in the sample.
As discussed in Section 5, Tables 2 and 3 report that many of the statistically significant breaks in Eq. (1) are associated withstatistically significant breaks in Eq. (2) in proximity of financial crises, especially when these breaks entail a deterioration in theefficiency and pricing of the corresponding ADRs. Consistently, Table 5 indicates that, in those circumstances, the likelihood of ADRprices to become more (less) sensitive to local (global) sources of risk is similarly related to both domestic and U.S. stock returnvolatility and the dynamics of the domestic currency: γb1b0, γb2N0, γ 7N0, γb8≈0, and γb9≈0, respectively, in Eq. (5) for Ptm. Not onlythe occurrence but also the interaction between efficiency and pricing breaks may be related to the trading activity of investors andspeculators during periods of financial turmoil. For instance, much trading in emerging market equities already takes place on theNYSE, NASDAQ, or AMEX during “tranquil” times (e.g., Hargis, 1997). More trading, especially if informed, may shift toward theseand other more liquid venues during periods of turmoil, ultimately affecting both emerging ADRs' arbitrage relation (Eq. (1))and the covariance of their returns with local and U.S. equity returns (Eq. (2)). Accordingly, we find that greater divergence inliquidity (lower Lm and/or higher LUS ) is often associated with both efficiency and pricing breaks — i.e., γb13b0 and/or γb14N0 inTables 4 and 5— evenwhen the former are in the direction of the law of one price (in Brazil, China, Philippines, and Russia, but notIndia).22
Somehow surprisingly, capital flight — measured by net monthly equity capital flows (Ftm) — does not impact the clustering ofarbitrage and pricing breaks in emerging ADR markets, with the sole exception of India. Furthermore, most of the coefficients forthe upward and downward trend dummies in the domestic and U.S. stock markets defined in Section 6 — γb3 to γb6 in Eq. (5) — arestatistically insignificant. Nonetheless, these variables may not adequately capture the extent to which capital controls andfinancial constraints are curtailing the ability of domestic and foreign investors to fully arbitrage price wedges between ADRs andtheir underlying stocks at each point in time. For instance, although virtually all of the countries in our sample gradually relaxedcapital mobility and foreign ownership restrictions during the 1990s (e.g., Bekaert et al., 2002), some of their governments alsoabruptly reintroduced many of these restrictions in proximity of financial crises, most notably in Argentina between 2001 and2002.23 Yet again, when considering more direct measures of the time-varying intensity of country-level capital controls and localmarket openness— such as the Edison andWarnock (2003) index and the Chinn and Ito (2006) index (as in Auguste et al., 2006)—we find weak or no evidence (not reported here) that structural shifts in ADR efficiency and pricing relationships are more likelywhen the activity of investors and arbitrageurs is more hindered.24
Despite these results, shifts in investors' expectations do appear to play an important role for the dynamics of Etm and Ptm:
Lower expected returns in the U.S. (DtUS) and in the domestic market (Dt
m) almost uniformly increase the likelihood of the law ofone price to be violated and of a significant ΔbbiUSb0 to be observed. ADR markets are instead on average more efficient, but moresensitive to local sources of risks, in response to higher Dt
m. Lastly, we find that a shrinking (expanding) trade sector — i.e., lower(higher) Ttm — also leads often to the clustering of negative (positive) shifts in bbi and bbiUS, and/or positive (negative) shifts in bbim —
i.e., γb10b0 (γb10N0) in Eq. (5), especially in Latin America and southeast Asia. Yet, deterioration (improvement) in the efficiency andpricing of ADRs are generally less (more) likely to occur during worsening (better) macroeconomic conditions (as proxied bydeclining S&P sovereign ratings Ctm): γb11N0 in Tables 4 and 5 for most countries. These results indicate that the healthier economicenvironment of an emerging country and the ensuing attention from the financial community ameliorate the efficiency and pricingof its ADR market only if accompanied by greater trade linkages with the rest of the world.25
Overall, the above evidence — subject to the caveats discussed earlier and some country-level heterogeneity — suggests thatmany of the factors usually associated with the occurrence of financial crises in emerging economies, in particular increasinguncertainty and disagreement among investors, greater exchange rate volatility, dwindling trade balances, unfavorable ex-pectations, and worsening liquidity (but not stockmarket trends, currency devaluations, or flight of foreign capital) also contributeto make their emerging equity markets less efficient and— assuming the validity of the two-factor pricing model of Eq. (2)—morede facto segmented.
22 Similar inference can be drawn when using the average proportion of zero return weeks for the underlying local stocks of the ADRs in our sample as a proxyfor those stocks' degree of liquidity (as in Lesmond, 2005).23 Nevertheless, the majority of estimated regime shifts in Eqs. (1) and (2) for Argentina took place before new restrictions to capital flight (described in LevyYeyati et al., 2004; Auguste et al., 2006) were announced and implemented. Our evidence of lower efficiency and segmentation of the Argentine ADR market in2001 (in Tables 1–3 and Fig. 1) is consistent with the argument in Melvin (2003) that domestic investors moved funds out of Argentina, despite stringent capitalcontrols, by purchasing shares of local companies cross-listed in the U.S. and then converting them in ADRs, until such conversions were permitted (March 25,2002).24 In unreported analysis, we also consider whether, in the presence of less-than-perfect legal substitutability between ADRs and their associated shares,informed risk arbitrage in emerging markets may become less attractive to arbitrageurs (e.g., Morck et al., 2000; Aggarwal et al., 2007), thus affecting thesemarkets' efficiency and pricing. We find no relation between country-level and firm-level measures of investor protection and corporate governance (such asthose developed by La Porta et al., 1998, and by Credit Lyonnais Securities Asia, 2001) and the likelihood and extent of the estimated efficiency and pricing breaksin Tables 1a and 2a.25 The likelihood of an emerging country's ADRs to experience persistent regime shifts in their arbitrage and pricing relationships may also be explained byfinancial contagion – i.e., non-fundamental cross-country spillover – due to the trading activity of investors and speculators (for a review see Kaminsky et al.,2003; Kallberg et al., 2005). We test for this possibility by analyzing whether the number of emerging markets in our sample simultaneously experiencing moreefficiency or pricing breaks than justified by the fundamental model of Eqs. (4) and (5) is greater than if due to chance, in the spirit of Kallberg et al. (2005). Theresulting test statistics (available on request) overwhelmingly reject the alternative hypothesis of financial contagion, except for pricing breaks during theMexican peso crisis.
206 P. Pasquariello / Journal of International Economics 76 (2008) 193–207
7. Conclusions
Financial crises have received increasing attention from the economic and financial literature, not least in light of theirtremendous social and allocational costs. Determining the nature of financial crises is crucial to explaining their occurrence andformulating policy recommendations for their prevention (e.g., Schwartz, 1986; Mishkin, 1992; IMF, 1998; Bordo et al., 2000). Themain objective of this paper was to contribute to the understanding of the anatomy of these crises by conducting an empiricalinvestigation of the impact of their occurrence on the efficiency and pricing of the emerging ADR market.
Specifically, we first identified two fundamental relationships that arbitrage and capital mobility considerations impose onreturns of depositary receipts and their local counterparts. The first one — between the dollar return for an ADR and the dollarreturn for the underlying security — arises from the law of one price, ceteris paribus for various financial frictions, and shouldalways hold unless “normal”market conditions are violated. The second one — between ADR returns and local and global sourcesof risk— is the result of perfectly open and fully integrated financial markets, conditional upon the validity of a standard two-factorADR pricingmodel.We then tested for a single, persistent regime shift in each of these relations in our sample of ADRs from issuersin 20 emerging countries using the non-parametric technique of Bai et al. (1998).
We provided evidence that during recent episodes of financial turmoil — Mexico (1994), East Asia (1997/1998), Russia (1998),Brazil (1999), Turkey (2001), and Argentina (2001/2002) — those normal market conditions were often violated. In particular, wefound that a majority of the depositary receipts in our sample experienced statistically and economically significant structuralshifts in their efficiency and pricing relationships over the past decade or so. The estimated properties and chronology of thesebreaks suggest that financial crises involving emerging economies were accompanied by lower efficiency and greatersegmentation of their ADR markets.
Finally, using several regression models, we offered support for some of the available explanations of financial crises inemerging economies by showing that the estimated regime shifts in each country in our sample were more likely whenuncertainty among investors was greater and both financial and macroeconomic conditions were deteriorating. However, thoseefficiency and pricing breaks were also generally unrelated to capital controls, prolonged stock market runs, currencydepreciations, and foreign capital flight.
References
Agenor, P., Bhandari, B., Flood, R., 1992. Speculative attacks and models of balance of payments crises. IMF Staff Papers 39, 357–394.Aggarwal, R., Inclan, C., Leal, R., 1999. Volatility in emerging stock markets. Journal of Financial and Quantitative Analysis 34, 33–55.Aggarwal, R., Dahiya, S., Klapper, L., 2007. ADR holdings of U.S.-based emerging market funds. Journal of Banking and Finance 31, 1649–1667.Aghion, P., Bacchetta, P., Banerjee, A., 2001. Currency crises and monetary policy in an economy with credit constraints. European Economic Review 45, 1121–1150.Alexander, G., Eun, C., Janakiramanan, S., 1987. Asset pricing and dual listing on foreign capital markets: a note. Journal of Finance 42, 151–158.Auguste, S., Dominguez, K., Kamil, H., Tesar, L., 2006. Cross-border trading as a mechanism for capital flight: ADRs and the Argentine crisis. Journal of Monetary
Economics 53, 1259–1295.Bacidore, J., Sofianos, G., 2002. Liquidity provision and specialist trading in NYSE-listed non-U.S. stocks. Journal of Financial Economics 63, 133–158.Bai, J., Lumsdaine, R., Stock, J., 1998. Testing for and dating common breaks in multivariate time series. Review of Economic Studies 65, 395–432.Bailey, W., Chan, K., Chung, P., 2002. Depositary receipts, country funds, and the peso crash: the intraday evidence. Journal of Finance 55, 2693–2717.Bekaert, G., Harvey, C., 1995. Time-varying world market integration. Journal of Finance 50, 403–444.Bekaert, G., Harvey, C., 1997. Emerging equity market volatility. Journal of Financial Economics 43, 29–78.Bekaert, G., Harvey, C., 2000. Foreign speculators and emerging equity markets. Journal of Finance 55, 565–613.Bekaert, G., Harvey, C., 2003. Emerging markets finance. Journal of Empirical Finance 10, 3–55.Bekaert, G., Harvey, C., Lumsdaine, R., 2002. Dating the integration of world equity markets. Journal of Financial Economics 65, 203–247.Bin, F., Blenman, L., Chen, D., 2004. Valuation impact of currency crises: evidence from the ADR market. International Review of Financial Analysis 13, 411–432.Bordo, M., Eichengreen, B., Klingebiel, D., Soledad, M., 2000. Is the crisis problem growing more severe? Working Paper. Rutgers University.Brown, S., Goetzmann, W., Park, J., 2000. Hedge funds and the Asian currency crisis of 1997. Journal of Portfolio Management 26, 95–101.Buiter, W., Corsetti, G., Pesenti, P., 1998. Financial Markets and European Monetary Cooperation. Cambridge University Press.Calomiris, C., 1995. Financial fragility: issues and policy implications. Journal of Financial Services Research 9, 241–257.Calvo, G., Mendoza, E., 2000a. Rational contagion and the globalization of securities markets. Journal of International Economics 51, 79–113.Calvo, G., Mendoza, E., 2000b. Capital-market crises and economic collapse in emerging markets: an informational-frictions approach. American Economic Review
90, 59–64.Cameron, C., Trivedi, P., 1996. Count data models for financial data. In: Maddala, G., Rao, C. (Eds.), Handbook of Statistics, vol. 14. Elsevier, pp. 363–392.Chang, R., Velasco, A., 1999. Liquidity crises in emerging markets: theory and policy. NBER Macroeconomic Annual, pp. 11–58.Chari, V., Kehoe, P., 2004. Financial crises as herds: overturning the critiques. Journal of Economic Theory 119, 128–150.Chinn, M., Ito, H., 2006. What matters for financial development? Capital controls, institutions, and interactions. Journal of Development Economics 61, 163–192.Chowdhry, B., Nanda, V., 1991. Multimarket trading and market liquidity. Review of Financial Studies 4, 483–511.Chung, H., 2005. The contagious effects of the Asian financial crisis: some evidence from ADR and country funds. Journal of Multinational Financial Management 15,
67–84.Corsetti, G., Pesenti, P., Roubini, N., 1999. What caused the Asian currency and financial crisis? Japan and the World Economy 11, 305–373.Corsetti, G., Dasgupta, A., Morris, S., Shin, H., 2004. Does one Soros make a difference? A theory of currency crises with large and small traders. Review of Economic
Studies 71, 87–113.Corsetti, G., Pericoli, M., Sbracia, M., 2005. Some contagion, some interdependence: more pitfalls in tests of financial contagion. Journal of International Money and
Finance 24, 1177–1199.Credit Lyonnais Securities Asia, 2001. Saints and sinners: who's got religion? CG Watch/Corporate Governance in Emerging Markets.Dasgupta, A., 2000. Regionality revised: an examination of the direction of spread of currency crises. Working Paper. Yale University.Disyatat, P., Gelos, G., 2001. The Asset allocation of emerging market mutual funds. IMF Working Paper No. 01/111.Edison, H., Warnock, F., 2003. A simple measure of the intensity of capital controls. Journal of Empirical Finance 10, 81–103.Eichengreen, B., Rose, A., Wyplosz, C., 1996. Contagious currency crises: first tests. Scandinavian Journal of Economics 98, 463–484.Ely, D., Salehizadeh, M., 2001. American depositary receipts — an analysis of international stock price movements. International Review of Financial Analysis 10,
343–363.Erb, C., Harvey, C., Viskanta, T., 1996. Expected return and volatility in 135 nations. Journal of Portfolio Management 22, 46–58.
207P. Pasquariello / Journal of International Economics 76 (2008) 193–207
Errunza, V., Losq, E., 1985. International asset pricing under mild segmentation: theory and test. Journal of Finance 40, 105–124.Flood, R., Marion, N., 1999. Perspectives on the recent currency crisis literature. International Journal of Finance and Economics 4, 1–26.Flood, R., Marion, N., 2000. Self-fulfilling risk predictions: an application to speculative attacks. Journal of International Economics 50, 245–268.Foerster, S., Karolyi, A., 1999. The effects of market segmentation and investor recognition on asset prices: evidence from foreign stocks listing in the United States.
Journal of Finance 54, 981–1014.Gagnon, L., Karolyi, A., 2004. Multi-market trading and arbitrage. Working Paper. Fisher College of Business, Ohio State University.Glick, R., Rose, A., 1999. Contagion and trade: why are currency crises regional? Journal of International Money and Finance 18, 603–617.Greene, W., 1997. Econometric Analysis. Prentice Hall.Griffin, J., Karolyi, A., 1998. Another look at the role of the industrial structure of markets for international diversification strategies. Journal of Financial Economics
50, 351–373.Grossman, S., Stiglitz, J., 1980. On the impossibility of informationally efficient markets. American Economic Review 70, 393–408.Hargis, K., 1997. When does multimarket trading improve the quality of the primary market? Evidence from international cross-listings. Goldman, Sachs, and Co.
Working Paper.Harvey, C., 1995. Predictable risk and return in emerging markets. Review of Financial Studies 8, 773–816.Heston, S., Rouwenhorst, G., 1994. Does industrial structure explain the benefits of international diversification? Journal of Financial Economics 36, 3–27.Howe, J., Kelm, K., 1987. The stock price impact of overseas listings. Financial Management 16, 51–56.Huang, R., Stoll, H., 2001. Exchange rates and firms' liquidity: evidence from ADRs. Journal of International Money and Finance 20, 297–325.Hunter, D., 2005. What drives time variation in emerging market segmentation? Journal of Financial Research 28, 261–280.International Monetary Fund, 1998. Financial crises: characteristics and indicators of vulnerability. World Economic Outlook, International Monetary Fund.Jeanne, O., 2000. Currency crises: a perspective on recent theoretical developments. Special Papers in International Economics No. 20. Princeton University.Jorion, P., Schwartz, E., 1986. Integration versus segmentation in the Canadian stock market. Journal of Finance 41, 603–616.Kallberg, J., Liu, C., Pasquariello, P., 2005. An examination of the Asian crisis: regime shifts in currency and equity markets. Journal of Business, 78, 169–211.Kaminsky, G., Lizondo, S., Reinhart, C., 1998. Leading indicators of currency crises. IMF Staff Papers 45, 1–48.Kaminsky, G., Lyons, R., Schmukler, S., 2001. Mutual fund investment in emerging markets: an overview. World Bank Economic Review 15, 315–340.Kaminsky, G., Reinhart, C., Vegh, C., 2003. The unholy trinity of financial contagion. Journal of Economic Perspectives 17, 51–74.Kaminsky, G., Lyons, R., Schmukler, S., 2004. Managers, investors, and crises: mutual fund strategies in emerging markets. Journal of International Economics 64,
113–134.Karolyi, A., 1998. Why do companies list shares abroad? A survey of the evidence and its managerial implications. Financial Markets, Institutions & Money 7, 1–60.Karolyi, A., 2006. The world of cross-listings and cross-listings of the world: challenging conventional wisdom. Review of Finance 10, 99–152.Karolyi, A., Stulz, R., 2003. Are financial assets priced locally or globally? In: Constantinides, G., Harris, M., Stulz, R. (Eds.), Handbook of the Economics of Finance.
North-Holland.Kato, K., Linn, S., Schallheim, J., 1991. Are there arbitrage opportunities in the market for American depositary receipts? Journal of International Financial Markets,
Institutions & Money 1, 73–89.Kim, W., Wei, S., 2002. Foreign portfolio investors before and during a crisis. Journal of International Economics 56, 77–96.King, M., Wadhwani, S., 1990. Transmission of volatility between stock markets. Review of Financial Studies 3, 5–33.Kodres, L., Pritsker, M., 2002. A rational expectations model of financial contagion. Journal of Finance 57, 769–799.Krugman, P., 1979. A model of balance of payment crisis. Journal of Money, Credit, and Banking 11, 311–325.Kyle, A., Xiong, W., 2001. Contagion as a wealth effect. Journal of Finance 56, 1401–1440.La Porta, R., Lopez de Silanes, F., Shleifer, A., Vishny, R., 1998. Law and finance. Journal of Political Economy 106, 1113–1155.Lang, M., Lundholm, R., 1993. Cross-sectional determinants of analysts' ratings of corporate disclosures. Journal of Accounting Research 31, 246–271.Lesmond, D., 2005. Liquidity of emerging markets. Journal of Financial Economics 77, 411–452.Leuz, C., Verrecchia, R., 2000. The economic consequences of increased disclosure. Journal of Accounting Research 38, 91–124.Levy Yeyati, E., Schmukler, S., Van Horen, N., 2004. The price of inconvertible deposits: the stock market boom during the Argentine crisis. Economic Letters 83,
7–13.Lim, T., 2001. Rationality and analysts' forecast bias. Journal of Finance 56, 369–385.Mathur, I., Gleason, K., Singh, M., 1998. Did markets react efficiently to the 1994 Mexican peso crisis? Evidence from Mexican ADRs. Journal of Multinational
Financial Management 8, 39–48.Melvin, M., 2003. A stock market boom during a financial crisis? ADRs and capital outflows in Argentina. Economic Letters 81, 129–136.Mishkin, F., 1992. Anatomy of a financial crisis. Journal of Evolutionary Economics 2, 115–130.Morck, R., Yeung, B., Yu, W., 2000. The information content of stock markets: why do emerging markets have synchronous stock price movements? Journal of
Financial Economics 58, 215–260.Obstfeld, M., 1998. The global capital market: benefactor or menace. Journal of Economic Perspectives 12, 9–30.Park, Y., Lee, J., 2003. Recovery and sustainability in East Asia. In: Dooley, M., Frankel, J. (Eds.), Managing Currency Crises in Emerging Markets. University of Chicago
Press, pp. 275–320.Pasquariello, P., 2007. Imperfect competition, information heterogeneity, and financial contagion. Review of Financial Studies 20, 391–426.Pavlova, A., Rigobon, R., 2007. Asset prices and exchange rates. Review of Financial Studies 20, 1139–1181.Rabinovitch, R., Silva, A., Susmel, R., 2003. Returns on ADRs and arbitrage in emerging markets. Emerging Markets Review 4, 225–247.Rosenthal, L., 1983. An empirical test of the efficiency of the ADR market. Journal of Banking and Finance 7, 17–29.Schwartz, A.,1986. Real and pseudo-financial crises. In: Capie, Forrest, Wood, Georey (Eds.), Financial Crises and theWorld Banking System. St. Martins Press, pp.11–31.Solnik, B., 1974. Why not diversify internationally rather than domestically? Financial Analyst Journal 30, 48–54.Summers, L., 2000. International financial crises: causes, prevention, and cures. American Economic Review Papers and Proceedings 90, 1–16.Tesar, L., Werner, I., 1995a. Home bias and high turnover. Journal of International Money and Finance 14, 467–492.Tesar, L., Werner, I., 1995b. U.S. equity investment in emerging stock markets. World Bank Economic Review 9, 109–130.Velli, J., 1994. American depositary receipts: an overview. Fordham International Law Journal 17, 38–57.Webb, S., O, cer, D., Boyd, B., 1995. An examination of international equity markets using American depositary receipts. Journal of Business Finance and Accounting
22, 415–430.Yuan, K., 2005. Asymmetric price movements and borrowing constraints: a REE model of crisis, contagion, and confusion. Journal of Finance 60, 379–411.Zhang, F., 2006. Information uncertainty and stock returns. Journal of Finance 61, 105–137.