Embed Size (px)
Citation preview
Evidence from NHS Improvement on clinical staff shortages A workforce analysis February 2016
2
About NHS Improvement
NHS Improvement is responsible for overseeing foundation trusts, NHS trusts and
independent providers. We offer the active support these frontline providers need to
give patients consistently safe, high quality, compassionate care within local health
systems that are financially sustainable. By holding providers to account and, where
necessary, intervening, we help the NHS to meet its short-term challenges and
secure its future.
NHS Improvement brings together Monitor, the NHS Trust Development Authority
plus groups from three other organisations: from NHS England both the Patient
Safety Team and the Advancing Change Team, from NHS Interim Management and
Support two Intensive Support Teams, together with the National Reporting and
Learning System. NHS Improvement is an operational name for the organisation
which formally comes into being from 1 April 2016.
3
Contents
Summary .................................................................................................................... 4
1. Background ............................................................................................................ 6
2. What has happened to the nursing workforce? ...................................................... 6
2.1. Nursing demand has risen rapidly and is outstripping supply ....................... 6
2.2. Nurse demand has risen partly because of increasing activity, but also as a result of safe staffing .................................................................................... 9
2.3. Providers have responded to the supply shortage in large measure by hiring agency workers, driving up agency costs ................................................. 14
2.4. Improvements in providers’ productivity have moderated the additional demand for nurses and the increase in agency spend ....................................... 14
3. What has happened to the consultant workforce? ............................................... 15
3.1. The number of consultants has increased faster than activity ..................... 15
3.2. Demand is outstripping supply in some key specialties .............................. 16
4. NHS Improvement’s plan to help providers respond to workforce shortages ....... 17
4.1. Supporting local action by providers ........................................................... 18
4.2. National actions to support local responses ................................................ 19
4
Summary1
1. There has been a rapid rise in demand for hospital nurses since publication of
the Francis Report in February 2013 and the push for higher staffing levels that
followed. For example, hospitals’ demand for nurses caring for adult acute
patients in 2014 was 189,000, around 7,000 more than hospitals had been
forecasting just a year earlier and 24,000 more than was forecast two years
before. Taken together, trusts’ current forecasts anticipate further growth in the
nursing workforce.
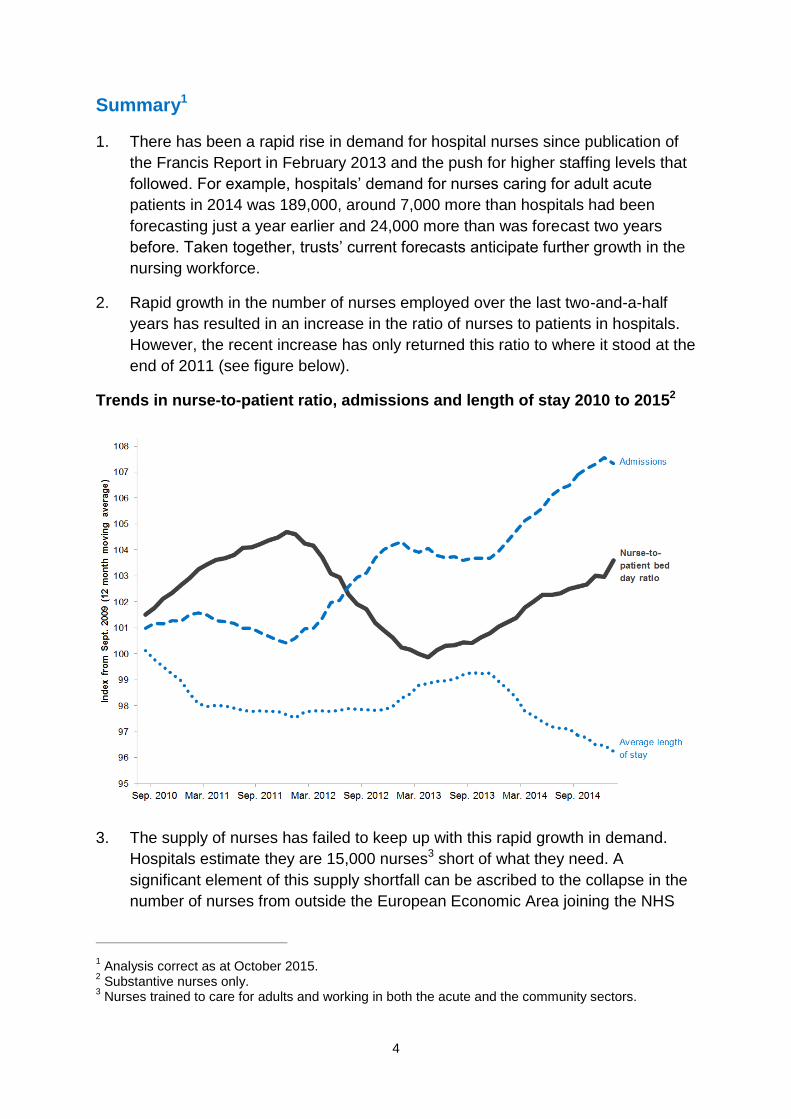
2. Rapid growth in the number of nurses employed over the last two-and-a-half
years has resulted in an increase in the ratio of nurses to patients in hospitals.
However, the recent increase has only returned this ratio to where it stood at the
end of 2011 (see figure below).
Trends in nurse-to-patient ratio, admissions and length of stay 2010 to 20152
3. The supply of nurses has failed to keep up with this rapid growth in demand.
Hospitals estimate they are 15,000 nurses3 short of what they need. A
significant element of this supply shortfall can be ascribed to the collapse in the
number of nurses from outside the European Economic Area joining the NHS
1 Analysis correct as at October 2015.
2 Substantive nurses only.
3 Nurses trained to care for adults and working in both the acute and the community sectors.
5
each year. This figure has fallen by over 95% from its peak of more than 15,000
in the early 2000s.
4. Inevitably, this significant supply shortfall has driven up the cost of agency
nurses. Agency charges for nurses increased by around 30% from 2012 to
2015.
5. Nevertheless, the nurse shortfall would be even worse were it not for
productivity improvements made by trusts over the last two years. In particular,
reductions in average length of stay have offset a sharp increase in hospital
admissions (see figure above). Without this improvement, there would likely be
a need for around 5,000 extra nurses at a cost to the NHS of about £250 million
at agency rates.4
6. We are supporting local workforce initiatives and working with system partners
to rebalance supply and demand at the national level. Our actions include:
supporting providers on workforce planning and improving co-ordination at a
national level
building on the work of the Carter Review to improve provider productivity
reducing providers’ agency costs.
4 Our calculation is based on NHS Professionals’ observed rate for a band 5 nurse in 2014/15.

6
1. Background
The NHS as a whole directly employs over 640,000 people in the professionally
qualified clinical workforce, including 110,000 doctors and over 315,000 nurses.5
Spending on total workforce represents an estimated 70% of a typical hospital’s6
costs, with much of this spent on the clinical workforce.7 The right workforce is
crucial to ensuring the quality of care that hospitals provide. It is also central to
making the productivity and efficiency gains needed to meet their financial
challenges, and transforming services through new care models.
Growing shortages of qualified clinical staff have led providers to make increasing
use of agency and other temporary workers to fill vacancies. We have recently
introduced new rules on agency workers to help providers address the impact of this
trend on their costs.
This report sets out our analysis of the causes and extent of current clinical staff
shortages in acute hospitals, focusing on adult nurses8 and consultants.9 Its aims are
to provide evidence informing decisions about the sector at a national level,10 and to
highlight some of the materials we are developing to support providers. Further, the
report sets out the actions we will take at a national level with our system partners to
support providers facing workforce shortages.
2. What has happened to the nursing workforce?
2.1. Nursing demand has risen rapidly and is outstripping supply
Since the end of 2012, there has been a large increase in demand for hospital
nurses across the NHS. In 2014, providers reported to Health Education England
(HEE)11 that they needed 189,000 adult nurses12 (acute) in total, yet two years
earlier they predicted they would need only 165,000; in 2013, this had risen to over
180,000 (see Figure 2).
5 Health and Social Care Information Centre NHS workforce statistics – June 2015, provisional
statistics. 6 www.kingsfund.org.uk/sites/files/kf/field/field_publication_file/the-nhs-productivity-challenge-
kingsfund-may14.pdf 7 According to NHS Employers, 50.6% of NHS employees are professionally qualified clinical staff –
www.nhsemployers.org/news/2015/07/the-nhs-workforce-in-numbers 8 ‘Adult nurses’ in our analysis refers collectively to all nurses caring for adult acute, elderly and adult
general patients. 9 Other areas and specialties, such as general practice, may also be experiencing shortages but are
outside the scope of this study. 10
Analysis correct as at October 2015. 11
HEE asks providers for their forecast workforce demand each year. 12
HEE defines adult nurses differently from us as it bases its definition on training branches. Where we cite HEE adult nursing data, we indicate whether the data are for nurses working in the adult acute and/or community sector.
7
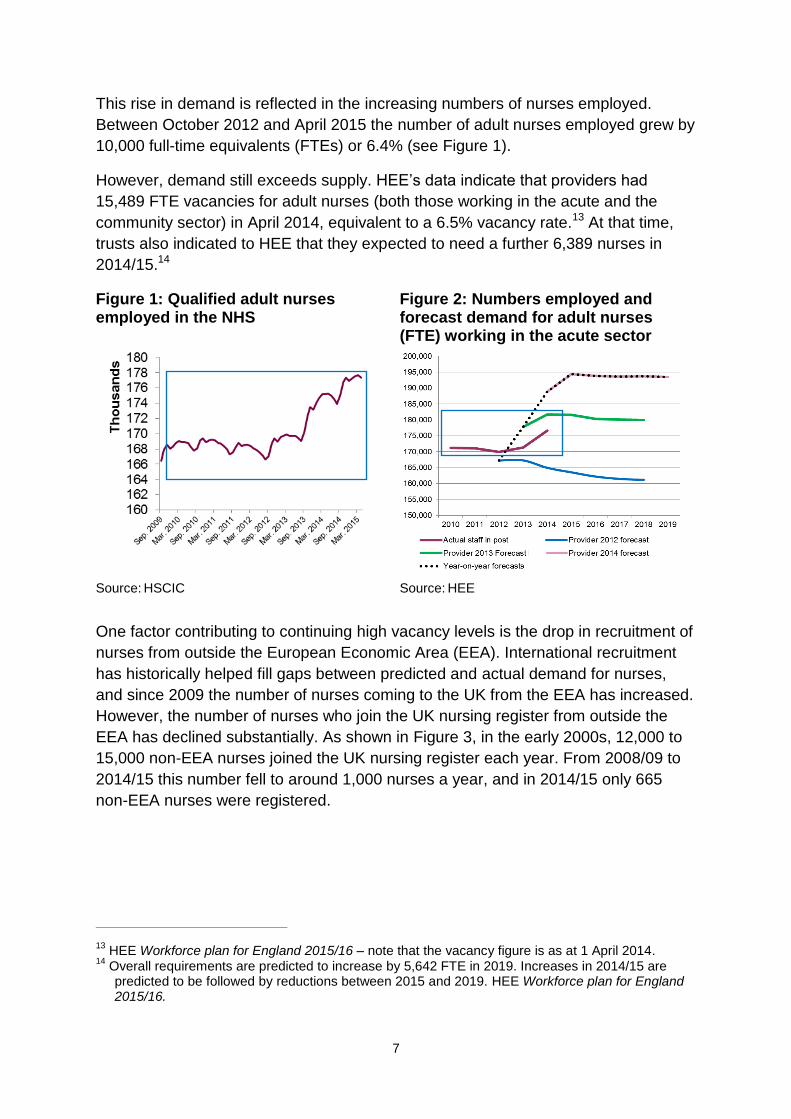
This rise in demand is reflected in the increasing numbers of nurses employed.
Between October 2012 and April 2015 the number of adult nurses employed grew by
10,000 full-time equivalents (FTEs) or 6.4% (see Figure 1).
However, demand still exceeds supply. HEE’s data indicate that providers had
15,489 FTE vacancies for adult nurses (both those working in the acute and the
community sector) in April 2014, equivalent to a 6.5% vacancy rate.13 At that time,
trusts also indicated to HEE that they expected to need a further 6,389 nurses in
2014/15.14
Figure 1: Qualified adult nurses employed in the NHS
Figure 2: Numbers employed and forecast demand for adult nurses (FTE) working in the acute sector
Source: HSCIC Source: HEE
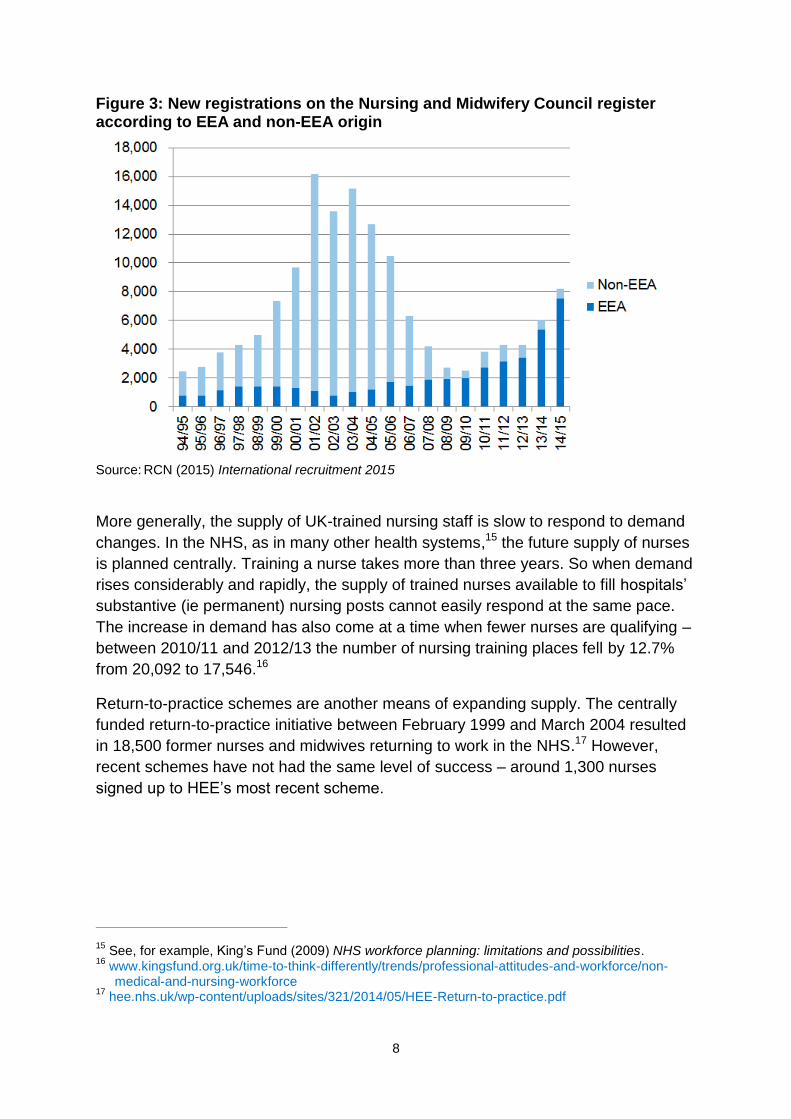
One factor contributing to continuing high vacancy levels is the drop in recruitment of
nurses from outside the European Economic Area (EEA). International recruitment
has historically helped fill gaps between predicted and actual demand for nurses,
and since 2009 the number of nurses coming to the UK from the EEA has increased.
However, the number of nurses who join the UK nursing register from outside the
EEA has declined substantially. As shown in Figure 3, in the early 2000s, 12,000 to
15,000 non-EEA nurses joined the UK nursing register each year. From 2008/09 to
2014/15 this number fell to around 1,000 nurses a year, and in 2014/15 only 665
non-EEA nurses were registered.
13
HEE Workforce plan for England 2015/16 – note that the vacancy figure is as at 1 April 2014. 14
Overall requirements are predicted to increase by 5,642 FTE in 2019. Increases in 2014/15 are predicted to be followed by reductions between 2015 and 2019. HEE Workforce plan for England 2015/16.
8
Figure 3: New registrations on the Nursing and Midwifery Council register according to EEA and non-EEA origin
Source: RCN (2015) International recruitment 2015
More generally, the supply of UK-trained nursing staff is slow to respond to demand
changes. In the NHS, as in many other health systems,15 the future supply of nurses
is planned centrally. Training a nurse takes more than three years. So when demand
rises considerably and rapidly, the supply of trained nurses available to fill hospitals’
substantive (ie permanent) nursing posts cannot easily respond at the same pace.
The increase in demand has also come at a time when fewer nurses are qualifying –
between 2010/11 and 2012/13 the number of nursing training places fell by 12.7%
from 20,092 to 17,546.16
Return-to-practice schemes are another means of expanding supply. The centrally
funded return-to-practice initiative between February 1999 and March 2004 resulted
in 18,500 former nurses and midwives returning to work in the NHS.17 However,
recent schemes have not had the same level of success – around 1,300 nurses
signed up to HEE’s most recent scheme.
15
See, for example, King’s Fund (2009) NHS workforce planning: limitations and possibilities. 16
www.kingsfund.org.uk/time-to-think-differently/trends/professional-attitudes-and-workforce/non-medical-and-nursing-workforce
17 hee.nhs.uk/wp-content/uploads/sites/321/2014/05/HEE-Return-to-practice.pdf
9
The increase in demand for nurses appears to be continuing. In July 2015, 75% of
NHS trust finance directors indicated they planned to increase their permanent
nursing staff in the next six months.18
2.2. Nurse demand has risen partly because of increasing activity, but also as
a result of safe staffing
Three main factors may drive changes in hospitals’ demand for nurses. The first is
expected levels of activity: the more patients that hospitals expect to admit, the more
nurses they will need. The second is those patients’ levels of sickness (or acuity): a
high proportion of seriously sick patients will need more nursing hours. Lastly, sector
reports and new policies concerning staffing levels can change demand for nurses.
The Mid Staffordshire NHS Foundation Trust Public Inquiry’s findings (the Francis
Report) were published in 2013. The report was commissioned after serious failings
at the trust. One recommendation was to create tools to establish the safe staffing
needs of each service. The National Institute for Health and Care Excellence (NICE)
then developed safe staffing guidelines for hospital wards.19 Although the NICE
guidance does not specify a staff-to-patient ratio, it suggests that patients are at
increased risk of harm if a nurse regularly has to care for more than eight patients on
a ward during the day.20 In addition, in 2013 the National Quality Board (NQB)
published guidance setting out expectations of hospitals’ nursing staff capacity and
capability. The Care Quality Commission’s (CQC’s) inspections also assess whether
staffing is safe. We refer to the Francis Report, NQB guidance, NICE guidelines and
their use alongside the CQC inspection regime collectively as ‘safe staffing’.
We have tested whether safe staffing has been a cause of the recent increase in
demand for nursing staff. It is difficult to disentangle its effects on nurse demand
from the other two causes – activity and levels of sickness.21 However, the step
change in demand in the period after publication of the Francis Report in early 2013
indicates that safe staffing has had a strong impact on acute hospitals’ demand for
nursing staff, specifically:
18
Response to the question: ‘Is your organisation planning to increase the number of permanent nursing staff in the next six months?’ King’s Fund Quarterly Monitoring Report July 2015 – http://qmr.kingsfund.org.uk/2015/16/
19 Safe staffing timeline, key milestones:
Francis Report, February 2013
National Quality Board Guidance 2013 – www.england.nhs.uk/wp-content/uploads/2013/11/nqb-how-to-guid.pdf
guidance on publishing staffing data monthly from April 2014 – www.england.nhs.uk/2014/04/01/hard-truths/
NICE safe staffing guidelines, July 2014 – www.nice.org.uk/guidance/sg1/chapter/1-recommendations
20 www.nice.org.uk/guidance/sg1/chapter/1-recommendations (July 2014).
21 In addition, here we have not controlled for any other aspects of quality.
10
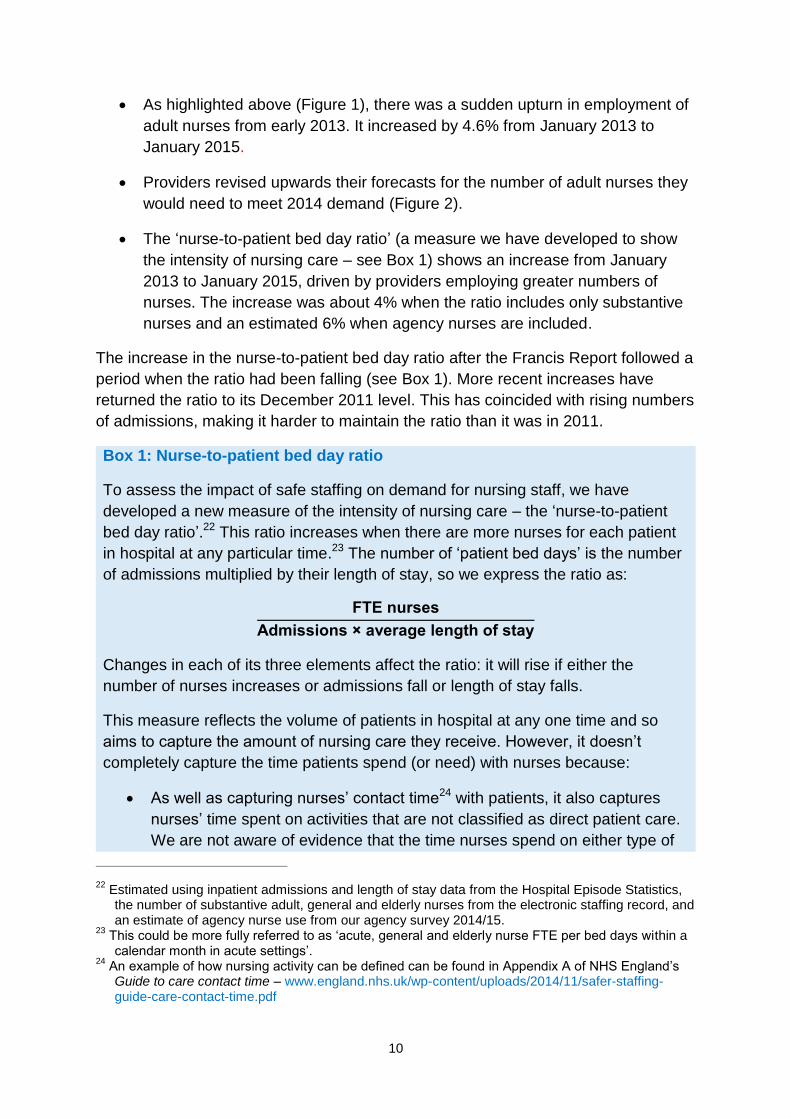
As highlighted above (Figure 1), there was a sudden upturn in employment of
adult nurses from early 2013. It increased by 4.6% from January 2013 to
January 2015.
Providers revised upwards their forecasts for the number of adult nurses they
would need to meet 2014 demand (Figure 2).
The ‘nurse-to-patient bed day ratio’ (a measure we have developed to show
the intensity of nursing care – see Box 1) shows an increase from January
2013 to January 2015, driven by providers employing greater numbers of
nurses. The increase was about 4% when the ratio includes only substantive
nurses and an estimated 6% when agency nurses are included.
The increase in the nurse-to-patient bed day ratio after the Francis Report followed a
period when the ratio had been falling (see Box 1). More recent increases have
returned the ratio to its December 2011 level. This has coincided with rising numbers
of admissions, making it harder to maintain the ratio than it was in 2011.
Box 1: Nurse-to-patient bed day ratio
To assess the impact of safe staffing on demand for nursing staff, we have
developed a new measure of the intensity of nursing care – the ‘nurse-to-patient
bed day ratio’.22 This ratio increases when there are more nurses for each patient
in hospital at any particular time.23 The number of ‘patient bed days’ is the number
of admissions multiplied by their length of stay, so we express the ratio as:
FTE nurses
Admissions × average length of stay
Changes in each of its three elements affect the ratio: it will rise if either the
number of nurses increases or admissions fall or length of stay falls.
This measure reflects the volume of patients in hospital at any one time and so
aims to capture the amount of nursing care they receive. However, it doesn’t
completely capture the time patients spend (or need) with nurses because:
As well as capturing nurses’ contact time24 with patients, it also captures
nurses’ time spent on activities that are not classified as direct patient care.
We are not aware of evidence that the time nurses spend on either type of
22
Estimated using inpatient admissions and length of stay data from the Hospital Episode Statistics, the number of substantive adult, general and elderly nurses from the electronic staffing record, and an estimate of agency nurse use from our agency survey 2014/15.
23 This could be more fully referred to as ‘acute, general and elderly nurse FTE per bed days within a
calendar month in acute settings’. 24
An example of how nursing activity can be defined can be found in Appendix A of NHS England’s Guide to care contact time – www.england.nhs.uk/wp-content/uploads/2014/11/safer-staffing-guide-care-contact-time.pdf
11
work has changed significantly over the period, although we might expect
providers to have responded to safe staffing by increasing care contact time
per patient for each nurse in the ways described by NHS England.25
It does not capture differences in different patients’ needs for nurse time.
For example, a higher prevalence of patients with dementia in a hospital
would lead to a higher overall patient need for contact time.
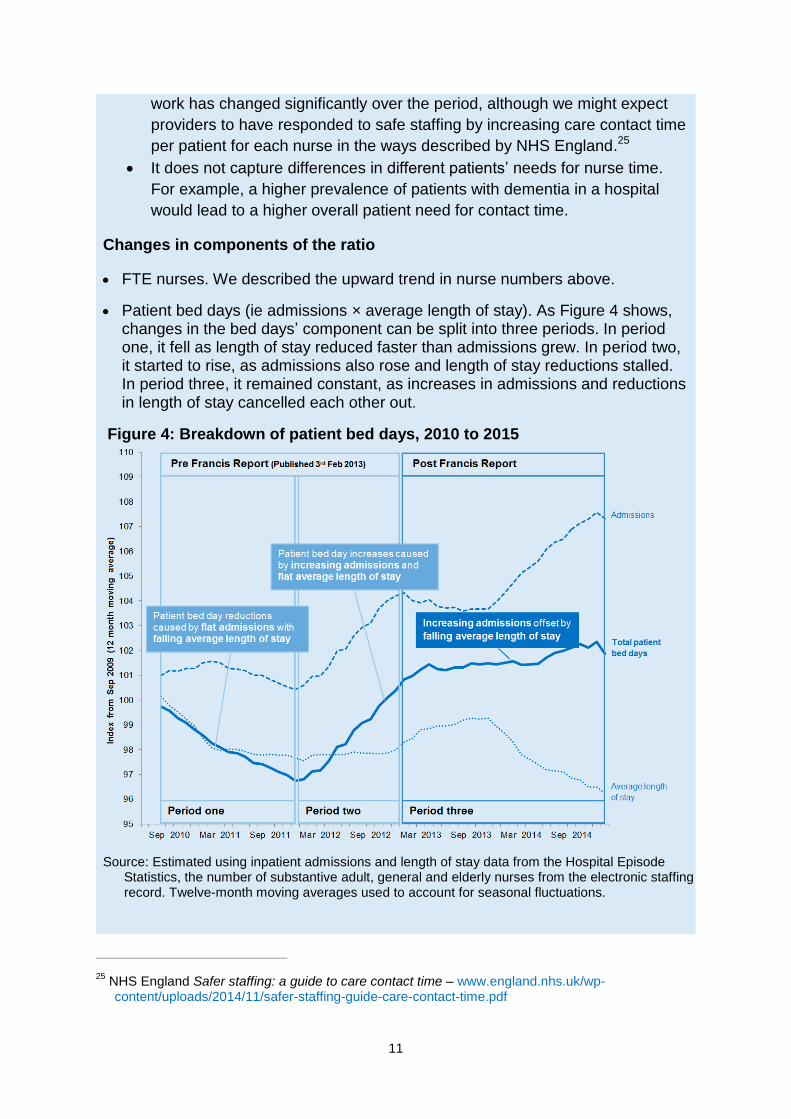
Changes in components of the ratio
FTE nurses. We described the upward trend in nurse numbers above.
Patient bed days (ie admissions × average length of stay). As Figure 4 shows, changes in the bed days’ component can be split into three periods. In period one, it fell as length of stay reduced faster than admissions grew. In period two, it started to rise, as admissions also rose and length of stay reductions stalled. In period three, it remained constant, as increases in admissions and reductions in length of stay cancelled each other out.
Figure 4: Breakdown of patient bed days, 2010 to 2015
Source: Estimated using inpatient admissions and length of stay data from the Hospital Episode
Statistics, the number of substantive adult, general and elderly nurses from the electronic staffing record. Twelve-month moving averages used to account for seasonal fluctuations.
25
NHS England Safer staffing: a guide to care contact time – www.england.nhs.uk/wp-content/uploads/2014/11/safer-staffing-guide-care-contact-time.pdf
12
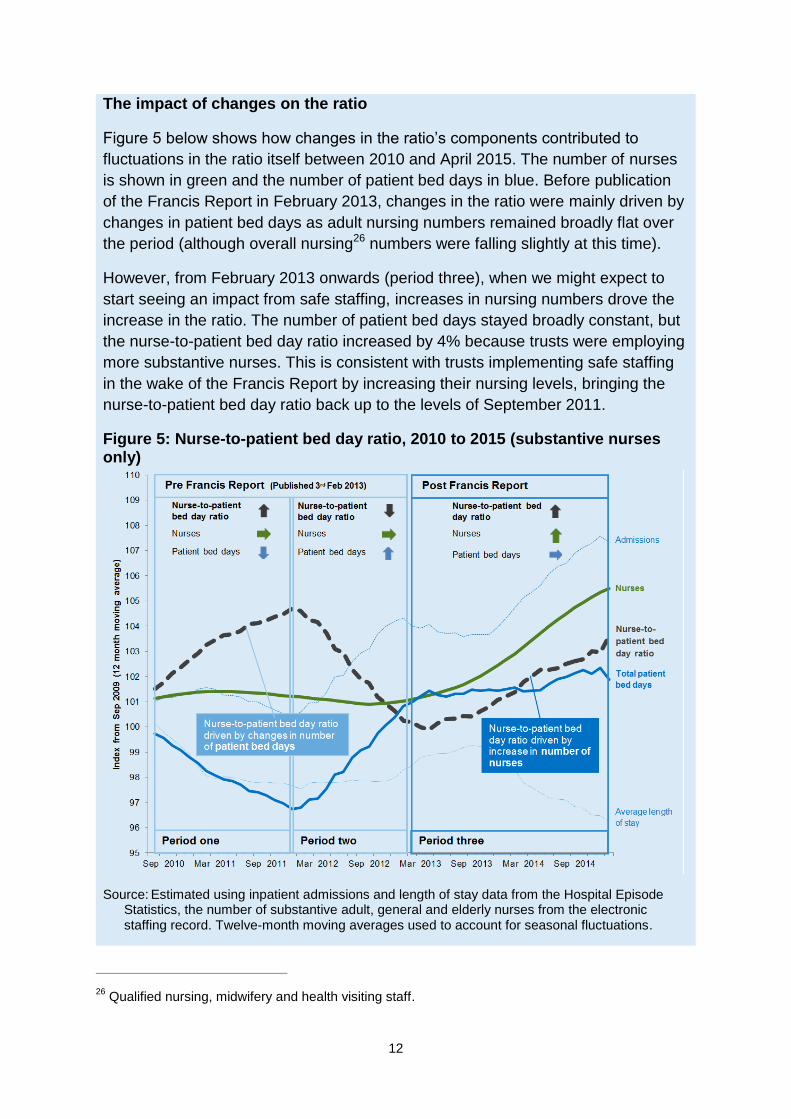
The impact of changes on the ratio
Figure 5 below shows how changes in the ratio’s components contributed to
fluctuations in the ratio itself between 2010 and April 2015. The number of nurses
is shown in green and the number of patient bed days in blue. Before publication
of the Francis Report in February 2013, changes in the ratio were mainly driven by
changes in patient bed days as adult nursing numbers remained broadly flat over
the period (although overall nursing26 numbers were falling slightly at this time).
However, from February 2013 onwards (period three), when we might expect to
start seeing an impact from safe staffing, increases in nursing numbers drove the
increase in the ratio. The number of patient bed days stayed broadly constant, but
the nurse-to-patient bed day ratio increased by 4% because trusts were employing
more substantive nurses. This is consistent with trusts implementing safe staffing
in the wake of the Francis Report by increasing their nursing levels, bringing the
nurse-to-patient bed day ratio back up to the levels of September 2011.
Figure 5: Nurse-to-patient bed day ratio, 2010 to 2015 (substantive nurses only)
Source: Estimated using inpatient admissions and length of stay data from the Hospital Episode Statistics, the number of substantive adult, general and elderly nurses from the electronic staffing record. Twelve-month moving averages used to account for seasonal fluctuations.
26
Qualified nursing, midwifery and health visiting staff.
13
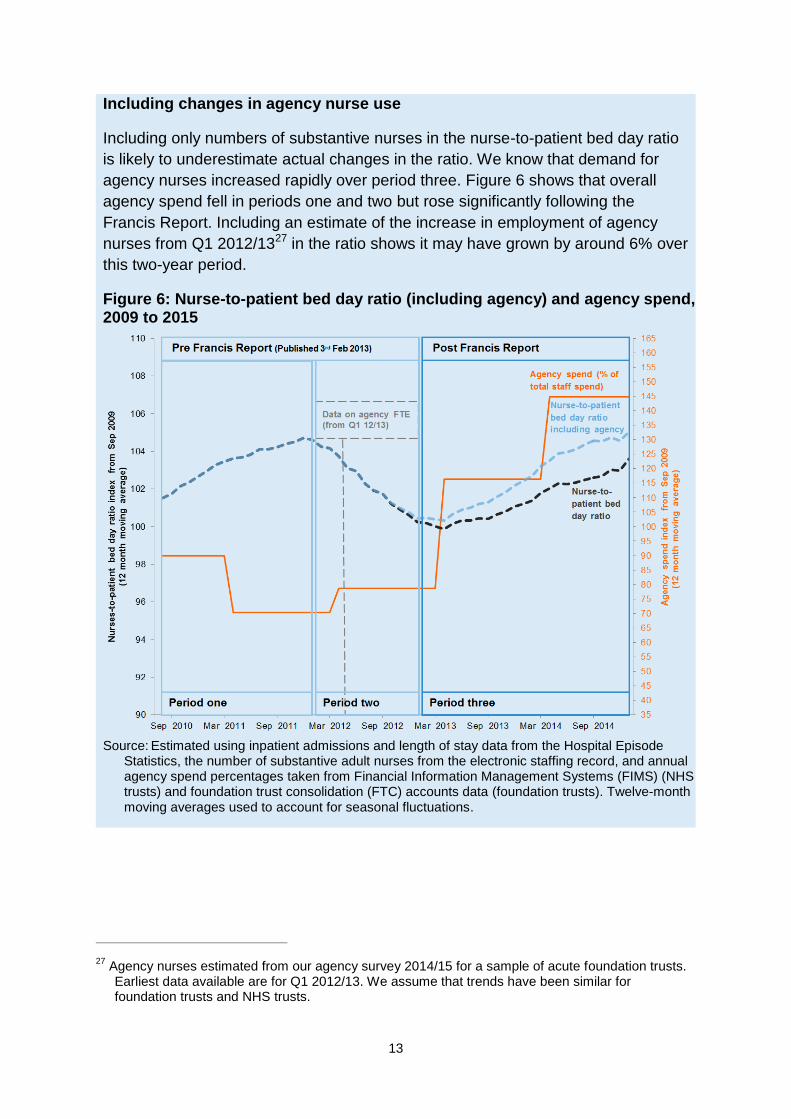
Including changes in agency nurse use
Including only numbers of substantive nurses in the nurse-to-patient bed day ratio
is likely to underestimate actual changes in the ratio. We know that demand for
agency nurses increased rapidly over period three. Figure 6 shows that overall
agency spend fell in periods one and two but rose significantly following the
Francis Report. Including an estimate of the increase in employment of agency
nurses from Q1 2012/1327 in the ratio shows it may have grown by around 6% over
this two-year period.
Figure 6: Nurse-to-patient bed day ratio (including agency) and agency spend, 2009 to 2015
Source: Estimated using inpatient admissions and length of stay data from the Hospital Episode
Statistics, the number of substantive adult nurses from the electronic staffing record, and annual agency spend percentages taken from Financial Information Management Systems (FIMS) (NHS trusts) and foundation trust consolidation (FTC) accounts data (foundation trusts). Twelve-month moving averages used to account for seasonal fluctuations.
27
Agency nurses estimated from our agency survey 2014/15 for a sample of acute foundation trusts. Earliest data available are for Q1 2012/13. We assume that trends have been similar for foundation trusts and NHS trusts.
14
2.3. Providers have responded to the supply shortage in large measure by
hiring agency workers, driving up agency costs
To meet their rising demand for nurses, providers have turned increasingly to agency
staff. This has raised NHS providers’ costs as they have spent more on all agency
staff. In 2014/15 these accounted for 7% of the total staff bill for NHS providers, up
from 3.4% in 2011/12.28 In total in 2014/15, NHS providers spent £3.3 billion on
temporary staff. Of this, we estimate that around £0.7 billion is the premium paid for
agency staff over the equivalent substantive pay and on-costs that providers would
incur.29
Demand for agency nurses has been a major cause of the overall growth in
temporary staff spend: spend on nursing agency staff for a sample of foundation
trusts grew by 150% between Q1 2011/12 and Q2 2014/15,30 and nurses now
account for 31% of total spending on clinical agency staff by all NHS foundation
trusts.31 There is some evidence that with rising demand the average total rate
charged for a nursing agency shift also increased, by around 10% each year from
2012 to 2015.32
2.4. Improvements in providers’ productivity have moderated the additional
demand for nurses and the increase in agency spend
The impact on providers’ costs of the recent imbalance between supply and demand
for nursing staff would have been worse had providers not at the same time
improved their productivity.
For hospitals, reducing average length of stay has historically been an important
means of improving productivity: the less time patients spend in a hospital bed on
average, the more patients hospitals can treat with the same number of beds and
staff, avoiding the need to open new beds as patient numbers rise.
From January 2013 to January 2015, the average length of stay across English
hospitals fell by 2.6%. Over the same period safe staffing increased the number of
nurses required for any given number of beds. Without this reduction in length of
stay, providers would have had to increase the number of adult nurses by around a
further 5,000 – equivalent to an extra nurse for every hospital ward in England. In
28
Source: FIMS and FTC data. 29
Based on our (2015) Price caps for agency staff: impact assessment, p22 Table 11 –www.gov.uk/government/uploads/system/uploads/attachment_data/file/468469/Impact_assessment_-_agency_rules.pdf. Note this is based on trusts employing all staff at the maximum rates of Agenda for Change bands or the equivalent pay scale for doctors. On-costs of 55% allow for employer National Insurance, holiday pay and employer pension contributions. They also include an allowance for a modest administration fee, which may be reduced if administered through the trust.
30 Our agency return – sample of foundation trusts.
31 APR data.
32 NHS Professionals’ data. Note that shift length has also changed over this period, as has the mix of
basic/unsocial hours.
15
money terms, the reduction in average length of stay meant the NHS avoided
spending up to £250 million on nurses annually (assuming these extra nurses would
have been employed through agencies).33
3. What has happened to the consultant workforce?
3.1. The number of consultants has increased faster than activity
The size and composition of the consultant workforce at any time is largely the result
of plans made 10 to 20 years ago34 because of the time it takes to train entry-level
doctors and for some of those doctors to reach consultant level. The difficulties of
planning the consultant workforce so far ahead are compounded by new
technologies, changing demographic needs, and innovations in care models, all of
which can lead to large changes in demand for consultants, especially in particular
specialties.
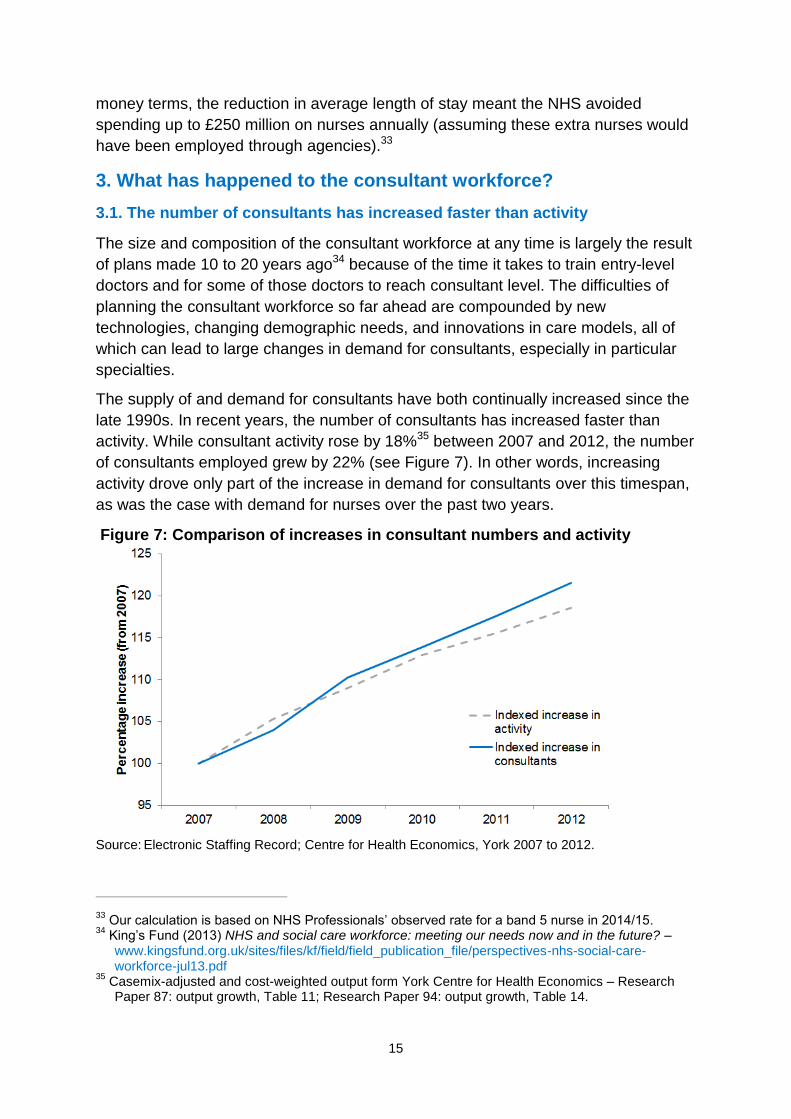
The supply of and demand for consultants have both continually increased since the
late 1990s. In recent years, the number of consultants has increased faster than
activity. While consultant activity rose by 18%35 between 2007 and 2012, the number
of consultants employed grew by 22% (see Figure 7). In other words, increasing
activity drove only part of the increase in demand for consultants over this timespan,
as was the case with demand for nurses over the past two years.
Figure 7: Comparison of increases in consultant numbers and activity
Source: Electronic Staffing Record; Centre for Health Economics, York 2007 to 2012.
33
Our calculation is based on NHS Professionals’ observed rate for a band 5 nurse in 2014/15. 34
King’s Fund (2013) NHS and social care workforce: meeting our needs now and in the future? – www.kingsfund.org.uk/sites/files/kf/field/field_publication_file/perspectives-nhs-social-care-workforce-jul13.pdf
35 Casemix-adjusted and cost-weighted output form York Centre for Health Economics – Research
Paper 87: output growth, Table 11; Research Paper 94: output growth, Table 14.
16
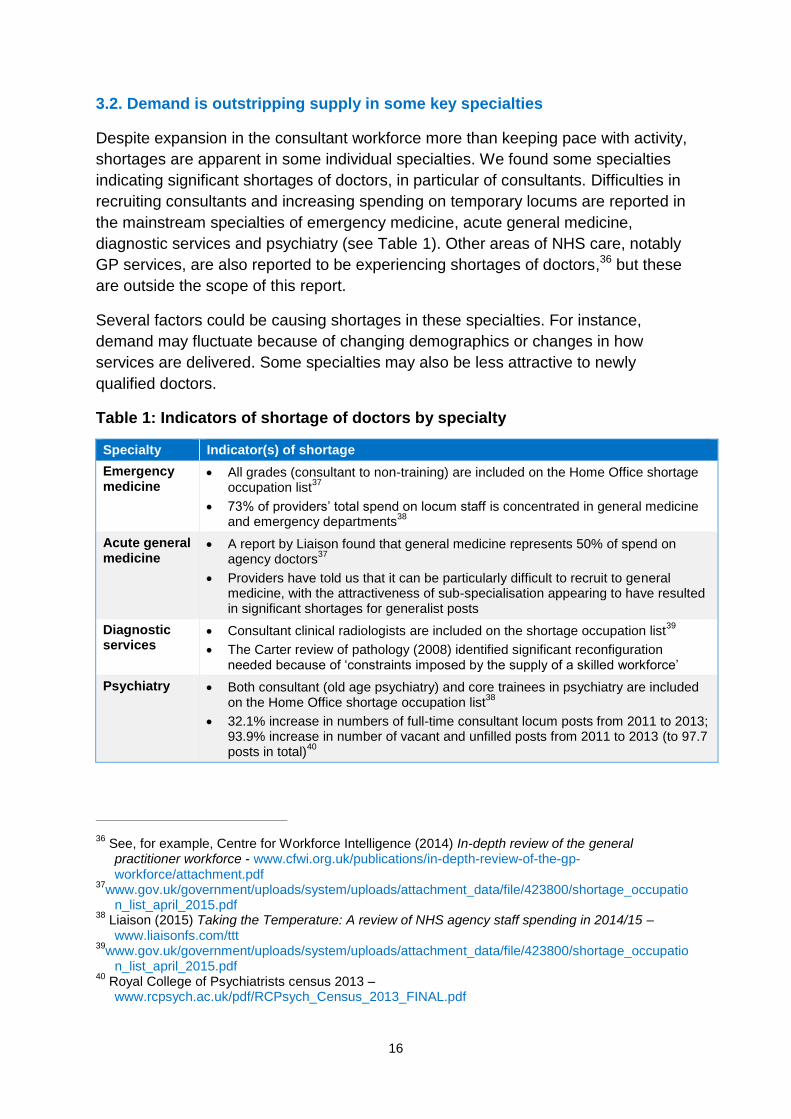
3.2. Demand is outstripping supply in some key specialties
Despite expansion in the consultant workforce more than keeping pace with activity,
shortages are apparent in some individual specialties. We found some specialties
indicating significant shortages of doctors, in particular of consultants. Difficulties in
recruiting consultants and increasing spending on temporary locums are reported in
the mainstream specialties of emergency medicine, acute general medicine,
diagnostic services and psychiatry (see Table 1). Other areas of NHS care, notably
GP services, are also reported to be experiencing shortages of doctors,36 but these
are outside the scope of this report.
Several factors could be causing shortages in these specialties. For instance,
demand may fluctuate because of changing demographics or changes in how
services are delivered. Some specialties may also be less attractive to newly
qualified doctors.
Table 1: Indicators of shortage of doctors by specialty
Specialty Indicator(s) of shortage
Emergency medicine
All grades (consultant to non-training) are included on the Home Office shortage occupation list
37
73% of providers’ total spend on locum staff is concentrated in general medicine and emergency departments
38
Acute general medicine
A report by Liaison found that general medicine represents 50% of spend on agency doctors
37
Providers have told us that it can be particularly difficult to recruit to general medicine, with the attractiveness of sub-specialisation appearing to have resulted in significant shortages for generalist posts
Diagnostic services
Consultant clinical radiologists are included on the shortage occupation list39
The Carter review of pathology (2008) identified significant reconfiguration needed because of ‘constraints imposed by the supply of a skilled workforce’
Psychiatry Both consultant (old age psychiatry) and core trainees in psychiatry are included on the Home Office shortage occupation list
38
32.1% increase in numbers of full-time consultant locum posts from 2011 to 2013; 93.9% increase in number of vacant and unfilled posts from 2011 to 2013 (to 97.7 posts in total)
40
36
See, for example, Centre for Workforce Intelligence (2014) In-depth review of the general practitioner workforce - www.cfwi.org.uk/publications/in-depth-review-of-the-gp-workforce/attachment.pdf
37www.gov.uk/government/uploads/system/uploads/attachment_data/file/423800/shortage_occupatio
n_list_april_2015.pdf 38
Liaison (2015) Taking the Temperature: A review of NHS agency staff spending in 2014/15 – www.liaisonfs.com/ttt
39www.gov.uk/government/uploads/system/uploads/attachment_data/file/423800/shortage_occupatio
n_list_april_2015.pdf 40
Royal College of Psychiatrists census 2013 – www.rcpsych.ac.uk/pdf/RCPsych_Census_2013_FINAL.pdf
17
The attractiveness of a specialty to newly qualified doctors is a complex issue. It
depends on their individual position on a range of motivators, including the intrinsic
attractiveness of the work, work–life balance, and potential NHS and non-NHS
earnings. But clearly some specialties currently appear less attractive to most newly
qualified doctors. For example, the Keogh review found that too few doctors choose
to specialise in emergency medicine because of the nature of the work and the
working conditions.41
Current shortages of consultants and other doctors in some specialities may in part
reflect a desire to improve quality by increasing consultant-delivered care faster than
supply can respond.42 Several Royal Colleges have issued guidelines in this area.
For example, the Royal College of Physicians recommended in 2012 that acute
medical units, which provide the critical first stage in hospital admissions, have
consultants on the unit for at least 12 hours a day, seven days a week. Similarly,
guidance from the Royal College of Emergency Medicine (RCEM) recommended
that a senior emergency department doctor should be available to take decisions in
emergency departments 24 hours a day, seven days a week.43 The resulting upward
pressure on demand is illustrated by RCEM estimates that meeting its recommended
standards44 in emergency departments would require an increase in the number of
consultants from 852 FTE (the 2010 total) to 2,222.
4. NHS Improvement’s plan to help providers respond to workforce
shortages
Imbalances remain between supply and demand for both hospital nurses and
consultants in some specialties, as shown by shortages in these areas of the
workforce and continuing agency cost pressures. Our research suggests that
providers are responding with a number of actions to help bring local workforce
supply and demand back into balance. This section details what we are doing to
support these local initiatives, and the actions we and our system partners are taking
at a national level to rebalance workforce supply and demand.
41
NHS England (2013) Transforming urgent and emergency care services in England, Urgent and Emergency Care Review End of Phase 1 Report Appendix 1 – Revised evidence base from the Urgent and Emergency Care Review – www.nhs.uk/NHSEngland/keogh-review/Documents/UECR.Ph1Report.Appendix%201.EvBase.FV.pdf
42 The Academy of Royal Medical Colleges in 2012 set out evidence for the benefits of consultant-
delivered care across the health service – www.aomrc.org.uk/general-news/benefits-of-consultant-delivered-care.html
43 College of Emergency Medicine: The way ahead 2008-2012 – www.marathe.org/media/the-way-
ahead-2008-2012.pdf 44
Based on recommended minimum number of whole-time equivalent (WTE) consultants per emergency department to achieve 16/7 ‘shopfloor presence’ and additional numbers of WTE consultants per major trauma centre needed to expand from 16/7 presence to 24/7 – www.rcem.ac.uk/Shop-Floor/Service%20Design%20&%20Delivery/The%20Emergency%20Medicine%20Workforce/Expanding%20the%20Consultant%20Workforce
18
4.1. Supporting local action by providers
We have found providers doing a variety of things to manage supply, including
attracting more new entrants into their workforces, reducing exit and employing the
existing workforce for more hours (increasing participation). Providers are also
reducing growth in their demand for staff through initiatives to increase productivity
or alter the range of work that people in particular roles can take on (role
substitution). However, several providers highlighted to us that workforce demand
and supply management plans capable of delivering longer-term, sustainable
solutions are complex to develop and that they often lack the ‘head space’ these
plans require.
We recognise that having the time and tools to develop good workforce plans and
processes is critical to providers’ management of workforce pressures. To support
providers’ workforce planning further, we intend to feed insights from the analysis
behind this document into our work to support providers. This work may include:
developing measures of good practice in workforce planning. These measures
will support trust boards’ in their oversight and challenge role
publishing case studies highlighting good practice and lessons learned in
workforce development and culture
giving NHS providers better access to available improvement planning tools
and guidance, including workforce planning tools. We have identified several
such tools, including those available from NHS Employers45 and those in the
strategy development toolkit46 developed by us in 2014.
We are committed to helping providers improve their productivity, which will help
curb the rate of increase in their demand for nurses and doctors in areas of shortage.
To support this, we have made the Reference Cost Benchmarking Tool available to
NHS trusts and foundation trusts. This allows providers to compare their costs with
those of similar NHS providers and identify any areas of outlying cost that they need
to work on. In October 2015, we published a report on opportunities to improve
productivity in elective care, which was co-developed with hospital clinicians,
directors and operational managers from eight NHS providers and with the Royal
College of Ophthalmologists and the British Orthopaedic Association.47
45
See, for example, those provided by NHS Employers – www.nhsemployers.org/case-studies-and-resources
46www.gov.uk/government/uploads/system/uploads/attachment_data/file/365275/Strategy_developme
nt_toolkit_Strategic_workforce_planning_tool_20102014.pdf 47
www.monitor.gov.uk/guidance/improving-productivity-in-elective-care
19
The Carter Review48 is helping providers to benchmark their performance against
that of peers in specific areas, and then examine in detail areas for improvement,
including workforce productivity.
4.2. National actions to support local responses
We recognise that local providers’ actions cannot solve all the workforce issues they
face. We and our system partners are therefore working on several actions at a
national level. These aim to support providers by increasing the national workforce
supply, helping to moderate demand for staff in short supply, and improving the
operation of the agency market.
Increasing workforce supply
Training liberalisation: The government announced in the Spending Review
plans to introduce new funding arrangements for nursing, midwifery and allied
health students. These will replace grants and bursaries with standard student
loans, to increase the supply of nurses and achieve a better balance between
supply and demand in future.
International recruitment: We submitted evidence to the Migration Advisory
Committee (MAC) in September 2015 supporting the case for exempting
nursing from restrictions on international recruitment, as well as wider
evidence of nurse shortages across the NHS. In October 2015, those
restrictions were relaxed: nurses were added to the Tier 2 shortage
occupation list on an interim basis, with MAC due to publish a fuller review this
month (February 2016).
Co-ordination of workforce plans and forecasts: Providers have told us
that workforce forecasts might understate true demand as they are often
driven by financial controls. To address this, we have worked closely with
partners, including NHS England and HEE, to improve the 2015/16 planning
process with, for example, greater coherence between workforce plans and
submissions.
Moderating workforce demand
Better assessment of the impact of policies on workforce: To make sure
providers can respond quickly and cost efficiently to new policies and
standards, the impact of these on workforce and provider costs should be
accurately assessed before their introduction. In light of this, we will be taking
account of labour market implications as we assess new staffing guidelines.
48
See, for example, Review of operational productivity in NHS providers – interim report (June 2015) – www.gov.uk/government/uploads/system/uploads/attachment_data/file/434202/carter-interim-report.pdf
20
Ensuring the best use of the workforce: The Carter Review has found that
many parts of the NHS use their workforce efficiently, but practice across the
sector is highly variable. Building on this work, together with the Department
of Health we are developing measures of ‘unit labour costs’. These will help
providers identify in-year how well they are utilising their workforce to provide
healthcare, so they can understand what drives their overall workforce
efficiency and make comparisons with their peers.
Improving the operation of the agency market
Agency price controls: We are taking action to reduce providers’ agency
costs,49 including capping agency spend and rates, and mandating use of
approved frameworks.50 Our Agency Intensive Support Team is helping some
providers to improve their use of agency staff.
Further research on the agency market: We will continue our work to
understand and monitor the impact of our policies on agency caps, and shed
light on the agency market and the impact of current agency practices on
providers.
We recognise that workforce challenges cannot be resolved overnight because it
takes time to train new nurses and doctors. However, providers can continue to
make improvements at a local level. Our role is to support local providers in this
complicated area and to help resolve some of the difficulties they face at the national
level.
49
www.gov.uk/guidance/rules-for-all-agency-staff-working-in-the-nhs 50
A framework agreement is an agreement with providers that sets out terms and conditions under which agreements for specific purchases (eg to hire an agency worker) can be made throughout the term of the agreement.
3
From 1 April 2016 NHS Improvement will be the operational name for the organisation that brings
together Monitor, the NHS Trust Development Authority plus groups from three other
organisations: from NHS England both the Patient Safety Team and the Advancing Change
Team, from NHS Interim Management and Support two Intensive Support Teams, together with
the National Reporting and Learning System.
This publication can be made available in a number of other formats on request.
Publication code: Report 01/16
Contact us
NHS Improvement, Wellington House,
133-155 Waterloo Road,
London, SE1 8UG
Telephone: 020 3747 0000