Embed Size (px)
Citation preview
Evidence For LSE Growth Commission – Human Capital
March 14 2012
Stephen Machin
1

• It is undeniable that the skills and education of the workforcematter for productivity and, in turn, for overall growth.
• The key policy questions concern how those skills andeducation can be harnessed to generate productivityimprovements and growth.
Relevant Issues
• In the UK context, there are a number of positives andnegatives in this regard – on some dimensions we fare well, onothers very poorly.
• Use this talk to try to highlight where we do better andworse.
2

• Education participation trends and levels of education in theworkforce.
• Trends in differences in wages for different groups.
• Basicskills problems.
Outline
• Basicskills problems.
• Inequalities in school and school policies.
• Summary.
3
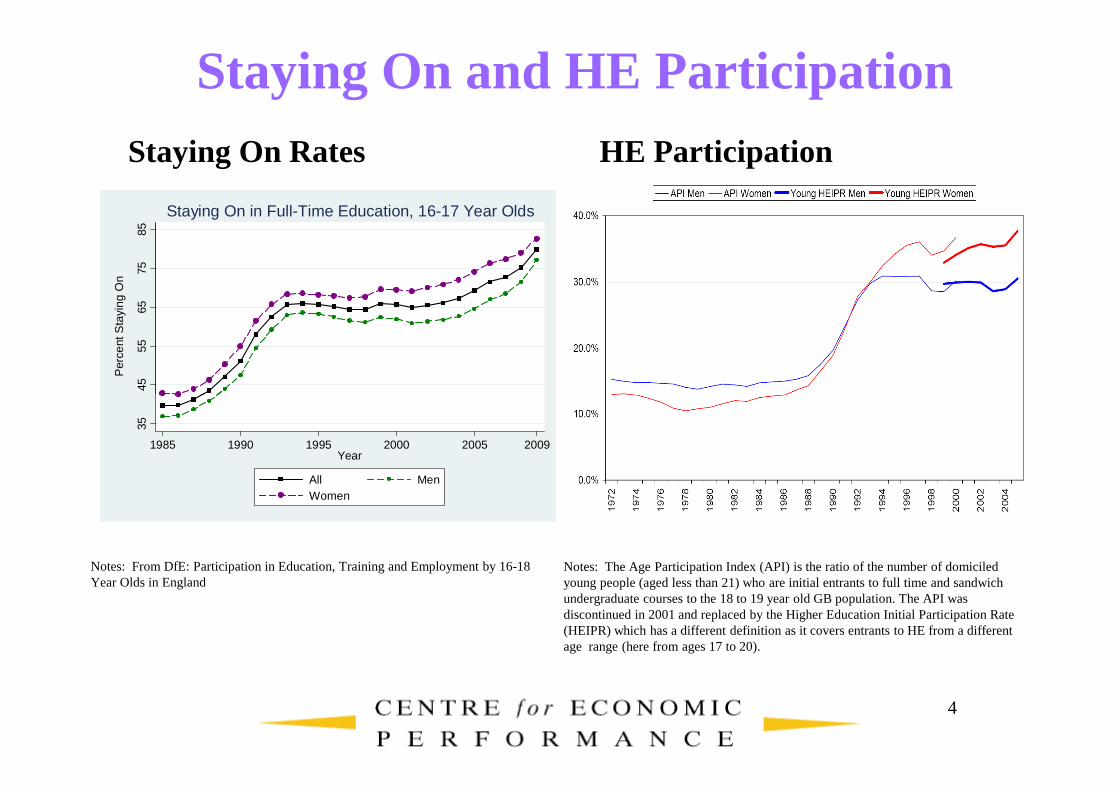
Staying On and HE ParticipationStaying On Rates HE Participation
4555
6575
85
Per
cent
Sta
ying
On
Staying On in Full-Time Education, 16-17 Year Olds
4
Notes: From DfE: Participation in Education, Training and Employment by 16-18 Year Olds in England
Notes: The Age Participation Index (API) is the ratio of the number of domiciled young people (aged less than 21) who are initial entrants to full time and sandwich undergraduate courses to the 18 to 19 year old GB population. The API was discontinued in 2001 and replaced by the Higher Education Initial Participation Rate (HEIPR) which has a different definition as it covers entrants to HE from a differentage range (here from ages 17 to 20).
35
1985 1990 1995 2000 2005 2009Year
All MenWomen
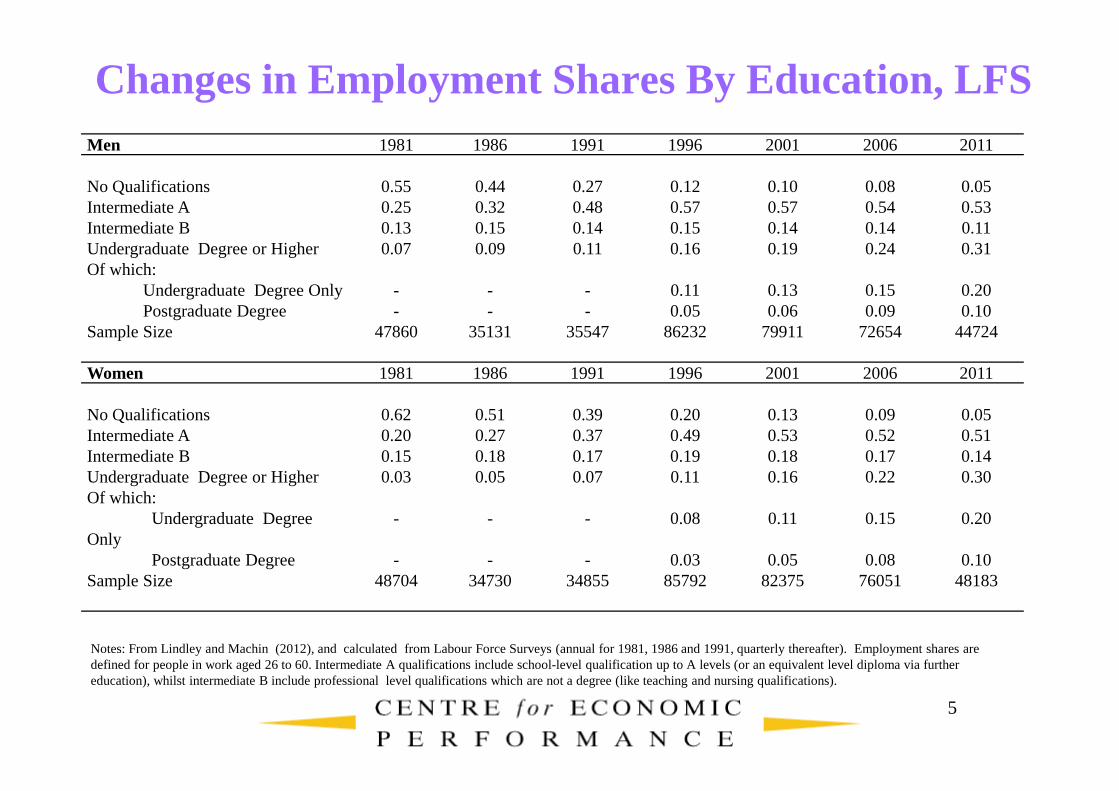
Changes in Employment Shares By Education, LFSMen 1981 1986 1991 1996 2001 2006 2011
No Qualifications 0.55 0.44 0.27 0.12 0.10 0.08 0.05Intermediate A 0.25 0.32 0.48 0.57 0.57 0.54 0.53Intermediate B 0.13 0.15 0.14 0.15 0.14 0.14 0.11Undergraduate Degree or Higher 0.07 0.09 0.11 0.16 0.19 0.24 0.31Of which:
Undergraduate Degree Only - - - 0.11 0.13 0.15 0.20Postgraduate Degree - - - 0.05 0.06 0.09 0.10
Sample Size 47860 35131 35547 86232 79911 72654 44724
Women 1981 1986 1991 1996 2001 2006 2011
5
Notes: From Lindley and Machin (2012), and calculated from Labour Force Surveys (annual for 1981, 1986 and 1991, quarterly thereafter). Employment shares are defined for people in work aged 26 to 60. Intermediate A qualifications include school-level qualification up to A levels (or an equivalent level diploma via further education), whilst intermediate B include professional level qualifications which are not a degree (like teaching and nursing qualifications).
No Qualifications 0.62 0.51 0.39 0.20 0.13 0.09 0.05Intermediate A 0.20 0.27 0.37 0.49 0.53 0.52 0.51Intermediate B 0.15 0.18 0.17 0.19 0.18 0.17 0.14Undergraduate Degree or Higher 0.03 0.05 0.07 0.11 0.16 0.22 0.30Of which:
Undergraduate Degree Only
- - - 0.08 0.11 0.15 0.20
Postgraduate Degree - - - 0.03 0.05 0.08 0.10Sample Size 48704 34730 34855 85792 82375 76051 48183
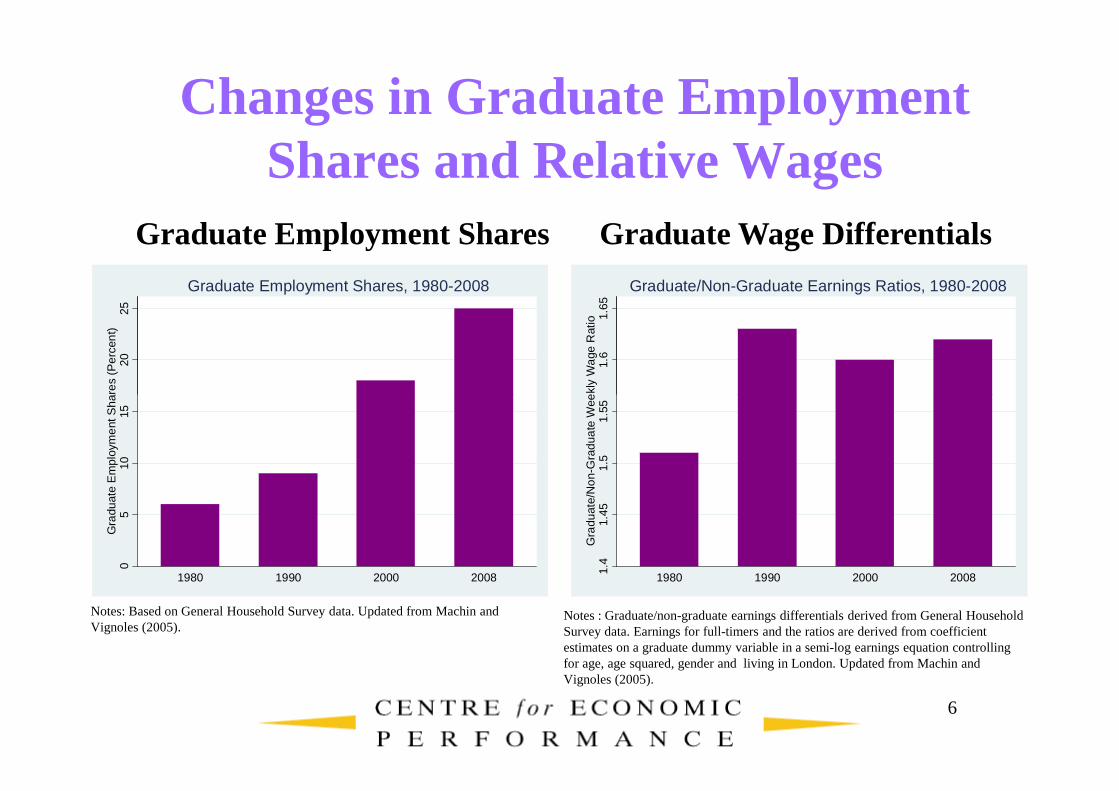
Changes in Graduate Employment Shares and Relative Wages
Graduate Employment Shares Graduate Wage Differentials
2025
Gra
duat
e E
mpl
oym
ent
Sha
res
(Per
cen
t)
Graduate Employment Shares, 1980-2008
1.6
1.65
Gra
duat
e/N
on-
Gra
dua
te W
eekl
y W
age
Rat
io
Graduate/Non-Graduate Earnings Ratios, 1980-2008
6
Notes: Based on General Household Survey data. Updated from Machin and Vignoles (2005).
Notes : Graduate/non-graduate earnings differentials derived from General HouseholdSurvey data. Earnings for full-timers and the ratios are derived from coefficientestimates on a graduate dummy variable in a semi-log earnings equation controllingfor age, age squared, gender and living in London. Updated from Machin andVignoles (2005).
05
1015
Gra
duat
e E
mpl
oym
ent
Sha
res
(Per
cen
t)
1980 1990 2000 2008
1.4
1.45
1.5
1.55
Gra
duat
e/N
on-
Gra
dua
te W
eekl
y W
age
Rat
io1980 1990 2000 2008
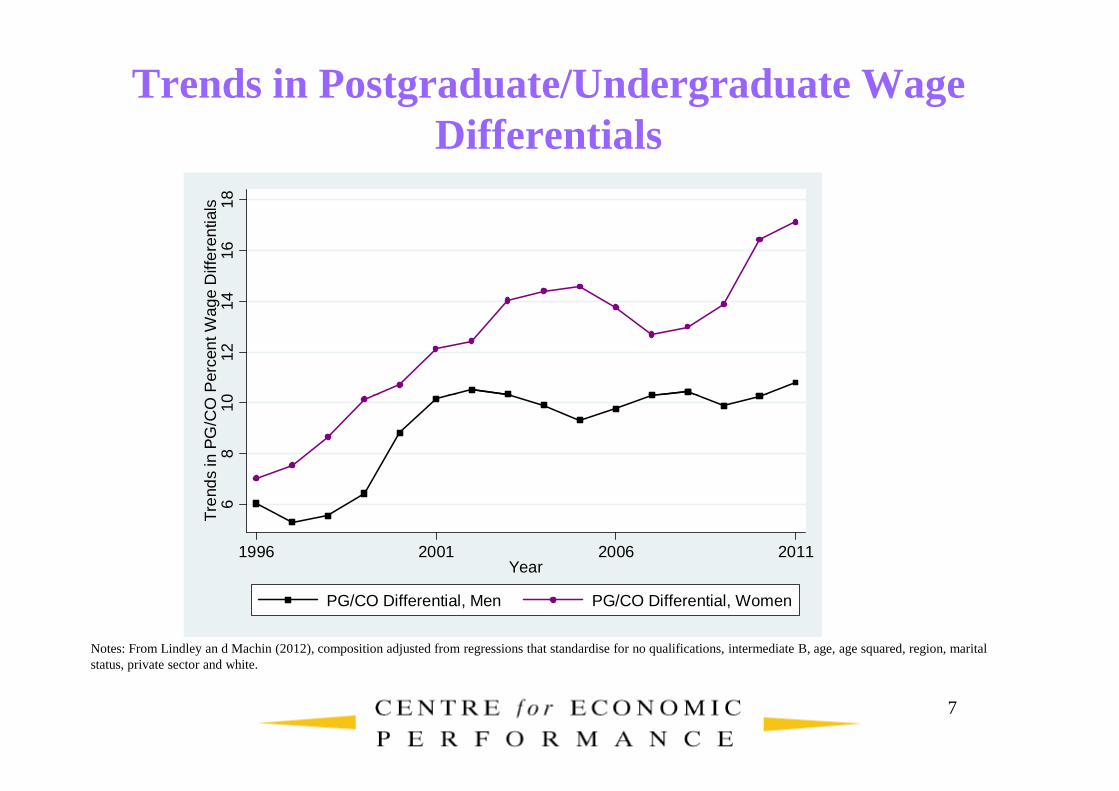
Trends in Postgraduate/Undergraduate Wage Differentials
1012
1416
18T
rend
s in
PG
/CO
Per
cent
Wag
e D
iffer
entia
ls
7
68
10T
rend
s in
PG
/CO
Per
cent
Wag
e D
iffer
entia
ls
1996 2001 2006 2011Year
PG/CO Differential, Men PG/CO Differential, Women
Notes: From Lindley an d Machin (2012), composition adjusted from regressions that standardise for no qualifications, intermediate B, age, age squared, region, marital status, private sector and white.

• The intermediate qualifications group have been losing out,in part because they do not have the requisite skills to use thenew technologies that graduates are benefiting from. In thisgroup, there are a lot of people with poor levels of educationand skills (and more than in other countries).
• There are big deficiencies in basic skills – literacy,numeracy, ICT – amongstthis groupandtheno qualifications
Intermediate Education
numeracy, ICT – amongstthis groupandtheno qualificationsgroup that contribute to this.
• This long tail in the lower part of the basic skills distributionis present in the UK (and in other places like the US) but notin countries whose education system seems to deliver betteroutcomes lower down the education distribution (Sweden,Germany, Finland).
8
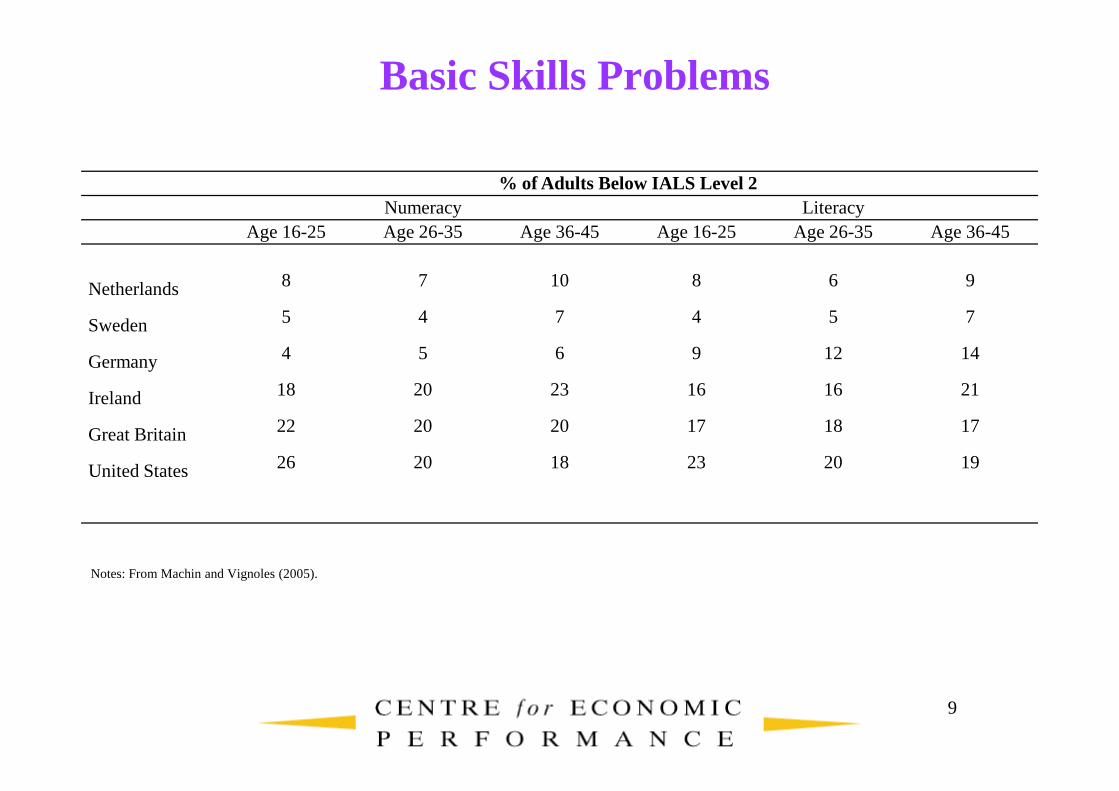
Basic Skills Problems
% of Adults Below IALS Level 2Numeracy Literacy
Age 16-25 Age 26-35 Age 36-45 Age 16-25 Age 26-35 Age 36-45
Netherlands 8 7 10 8 6 9
Sweden 5 4 7 4 5 7
Germany 4 5 6 9 12 14
Ireland 18 20 23 16 16 21
9
Ireland 18 20 23 16 16 21
Great Britain 22 20 20 17 18 17
United States 26 20 18 23 20 19
Notes: From Machin and Vignoles (2005).
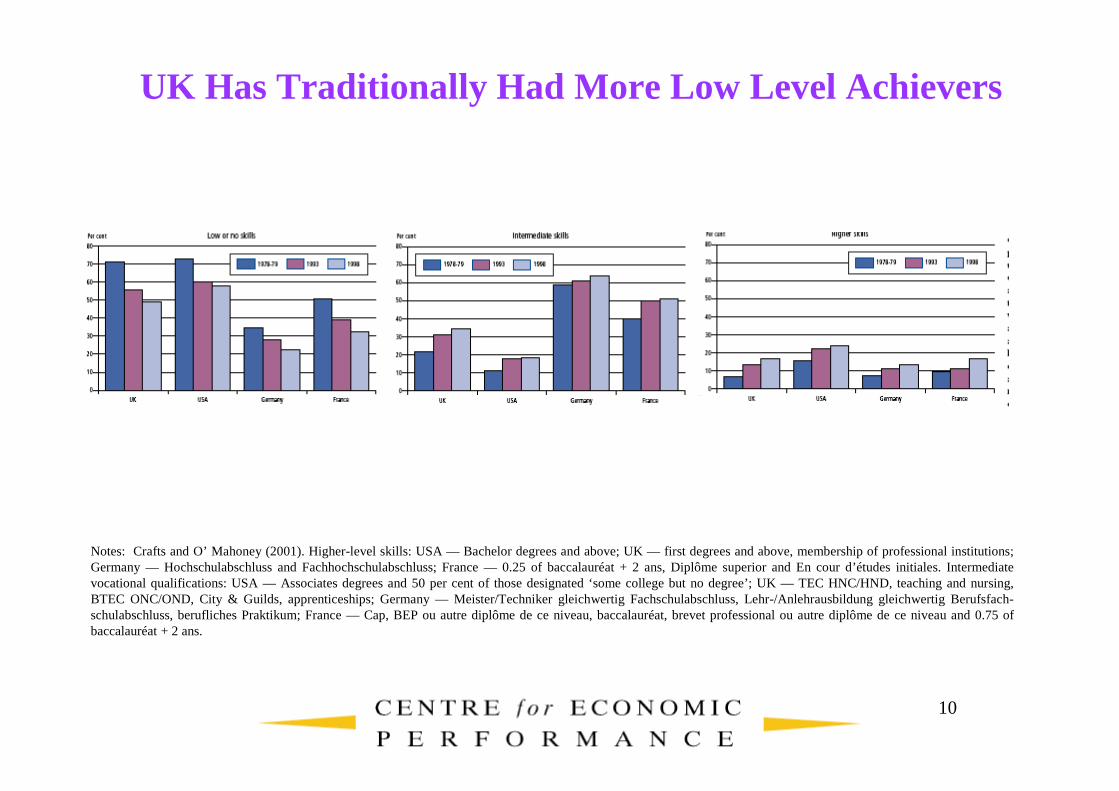
UK Has Traditionally Had More Low Level Achievers
10
Notes: Crafts and O’ Mahoney (2001). Higher-level skills: USA — Bachelor degrees and above; UK — first degrees and above,membership of professional institutions;Germany — Hochschulabschluss and Fachhochschulabschluss; France — 0.25 of baccalauréat + 2 ans, Diplôme superior and En cour d’études initiales. Intermediatevocational qualifications: USA — Associates degrees and 50per cent of those designated ‘some college but no degree’; UK— TEC HNC/HND, teaching and nursing,BTEC ONC/OND, City & Guilds, apprenticeships; Germany — Meister/Techniker gleichwertig Fachschulabschluss, Lehr-/Anlehrausbildung gleichwertig Berufsfach-schulabschluss, berufliches Praktikum; France — Cap, BEP ou autre diplôme de ce niveau, baccalauréat, brevet professional ou autre diplôme de ce niveau and 0.75 ofbaccalauréat + 2 ans.
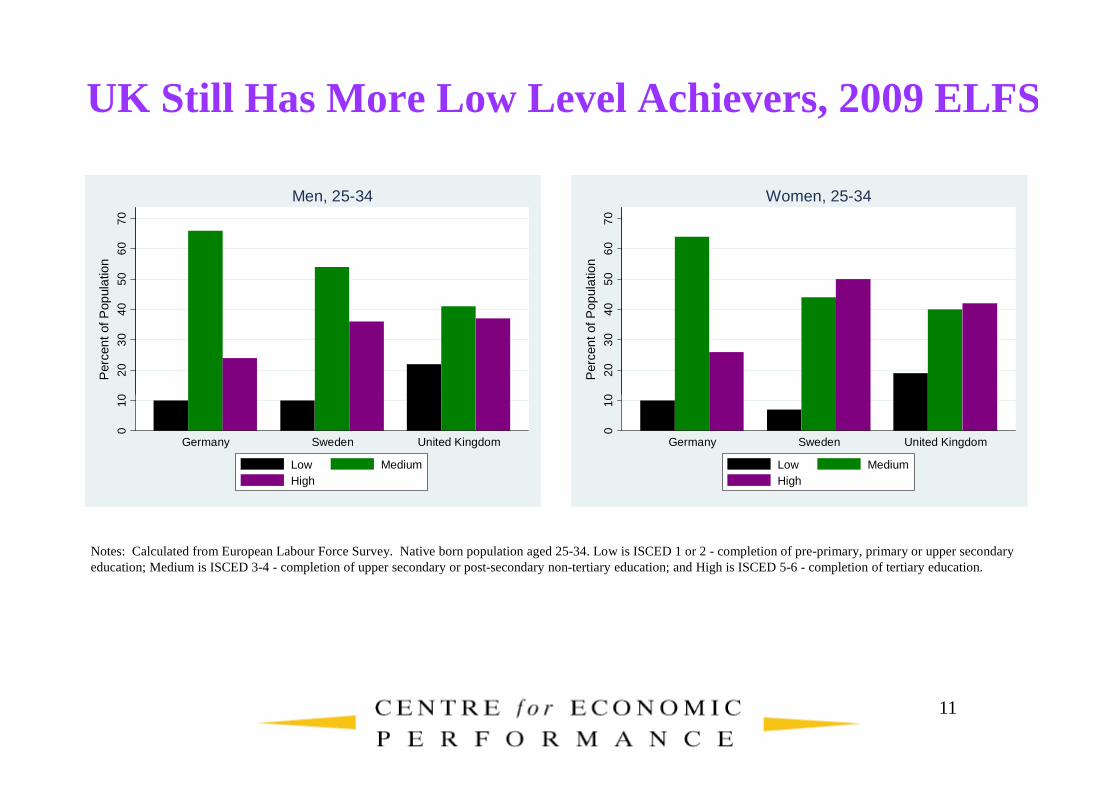
UK Still Has More Low Level Achievers, 2009 ELFS10
20
30
4050
60
70
Per
cent
of P
opul
atio
n
Men, 25-34
102
03
040
506
070
Per
cent
of P
opul
atio
n
Women, 25-34
11
Notes: Calculated from European Labour Force Survey. Native born population aged 25-34. Low is ISCED 1 or 2 - completion of pre-primary, primary or upper secondaryeducation; Medium is ISCED 3-4 - completion of upper secondary or post-secondary non-tertiary education; and High is ISCED 5-6 - completion of tertiary education.
010
Germany Sweden United Kingdom
Low MediumHigh
010
Germany Sweden United Kingdom
Low MediumHigh
• These skill shortfalls in the middle and lower part of theeducation distribution have meant that graduates have beendoing very well.
• Thus, wage inequality has risen sharply as employersincreasingly demand graduates who have the skills to workwith new technologies.
Low Level Achievers
• Moreover, the scope for productivity gains from a welltrained and skilled non-graduate workforce has beendiminished (unlike, for example, Germany where themanufacturing base has stayed higher and where there is abigger core group of skilled mid-level workers).
12
• Also, within the hard core group of low achievers are theNEETs (those not in employment, education or training).Especially young men.
• The problemsof low achievementfor part of the education
Low Level Achievers
• The problemsof low achievementfor part of the educationdistribution can, in part, be traced back to the compulsoryschool system.
13

• The pattern from schools confirms this. The UK again haspupils that do very well, but a lower tail that do not.
• In PISA, for example, children in private schools do just aswell as high achievers elsewhere and significantly better thanstate school children (PISA test scores are standardised to amean of 500, and the private/state gaps in reading, maths andsciencein PISA 2009are61, 56and73 respectively).
Schools
sciencein PISA 2009are61, 56and73 respectively).
• At the same time, the UK has one of the highest gradientswith respect to family background in the PISA data.
14
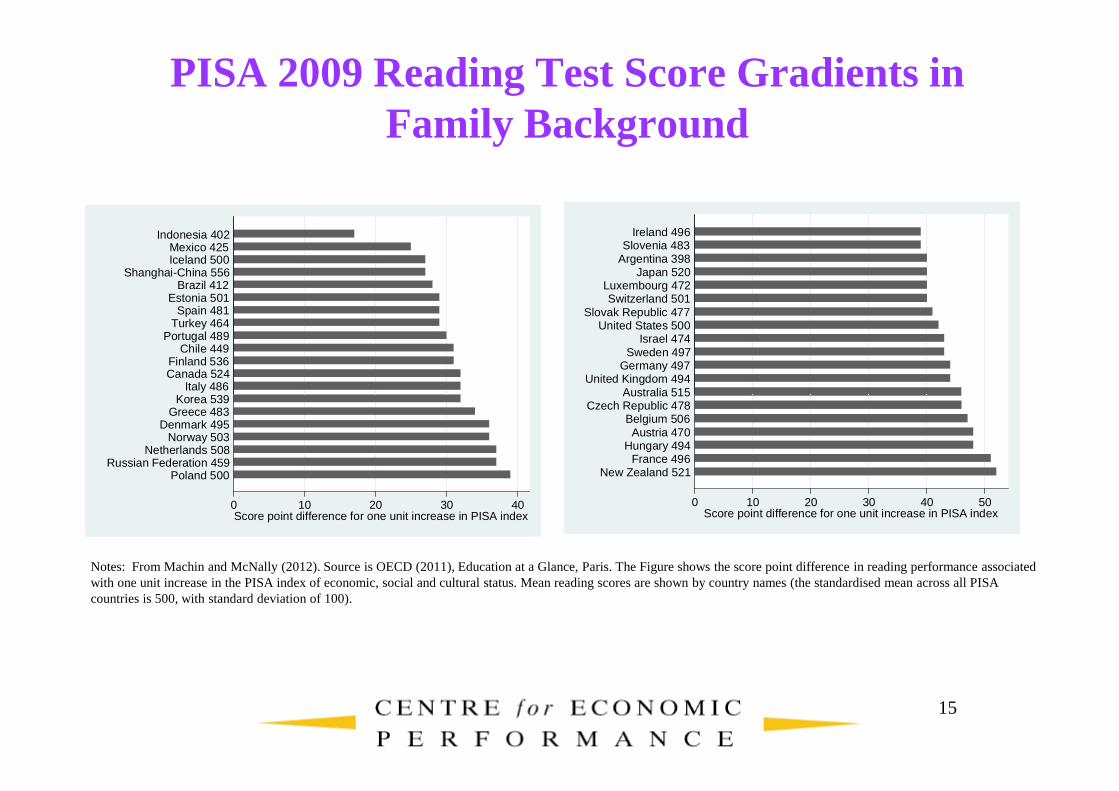
PISA 2009 Reading Test Score Gradients in Family Background
Korea 539Italy 486
Canada 524Finland 536
Chile 449Portugal 489
Turkey 464Spain 481
Estonia 501Brazil 412
Shanghai-China 556Iceland 500Mexico 425
Indonesia 402
Australia 515United Kingdom 494
Germany 497Sweden 497
Israel 474United States 500
Slovak Republic 477Switzerland 501
Luxembourg 472Japan 520
Argentina 398Slovenia 483
Ireland 496
15
0 10 20 30 40Score point difference for one unit increase in PISA index
Poland 500Russian Federation 459
Netherlands 508Norway 503
Denmark 495Greece 483
Korea 539
0 10 20 30 40 50Score point difference for one unit increase in PISA index
New Zealand 521France 496
Hungary 494Austria 470
Belgium 506Czech Republic 478
Australia 515
Notes: From Machin and McNally (2012). Source is OECD (2011), Education at a Glance, Paris. The Figure shows the score point difference in reading performance associated with one unit increase in the PISA index of economic, social and cultural status. Mean reading scores are shown by country names (the standardised mean across all PISA countries is 500, with standard deviation of 100).

• This naturally leads on to the question of what can be donein schools to better reach the low achievers.
• There is a huge academic literature on what works better ingenerating improved outcomes.
• The recentEnglish experiencehas also beeninterestingin
Schools
• The recentEnglish experiencehas also beeninterestinginthis regard as a number of education policies have beenintroduced in attempts to drive up standards.
• These include policies organised around: incentives (forschools, teachers and pupils); choice and competition;changing school structures to generate more autonomy andimproved governance; curriculum change.
16
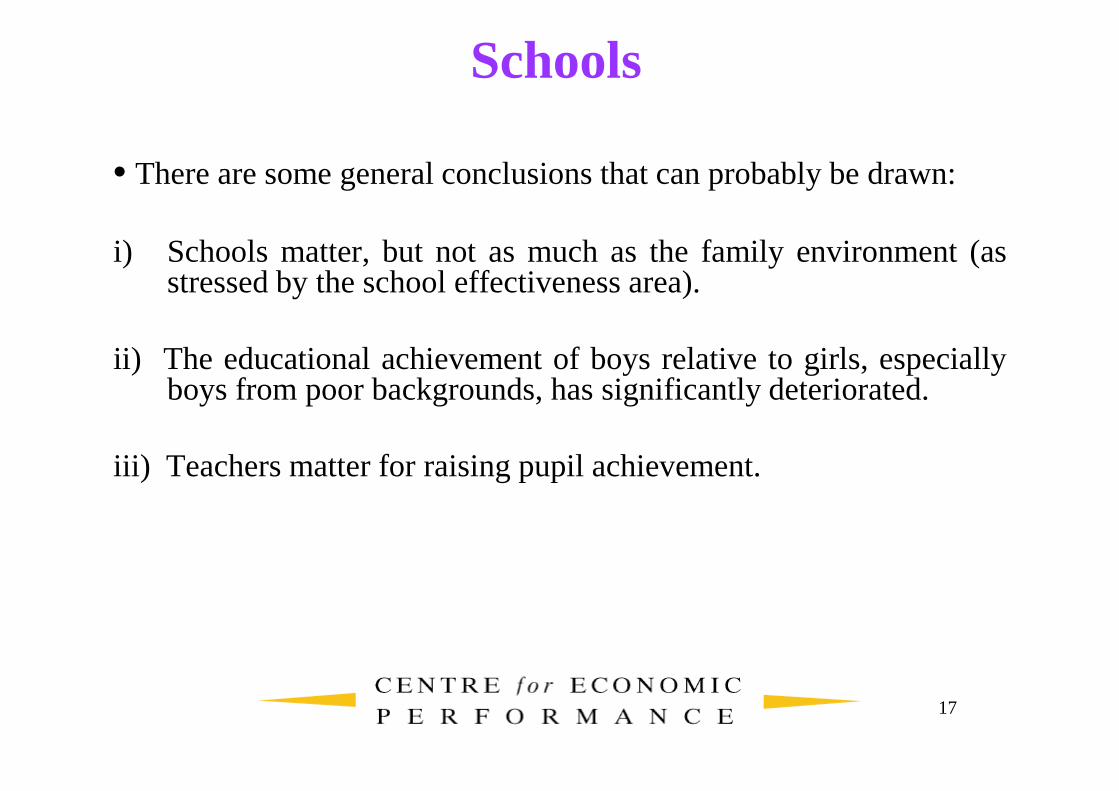
• There are some general conclusions that can probably be drawn:
i) Schools matter, but not as much as the family environment (asstressed by the school effectiveness area).
ii) The educational achievement of boys relative to girls, especiallyboysfrom poorbackgrounds,hassignificantlydeteriorated.
Schools
boysfrom poorbackgrounds,hassignificantlydeteriorated.
iii) Teachers matter for raising pupil achievement.
17

iv) Policies on incentives, choice and competition show mixedevidence and, in that mixed evidence, some suggestions of risinginequality in educational outcomes.
v) Non-targeted throwing money at schools does not seem veryeffective. May be linked to managerial quality in schools.
Schools
vi) In some scenarios, altering school types may work, but the jury isout on this as most changes that have been evaluated arerelatively recent (like the academies programme in England andcharter schools in the US).
18
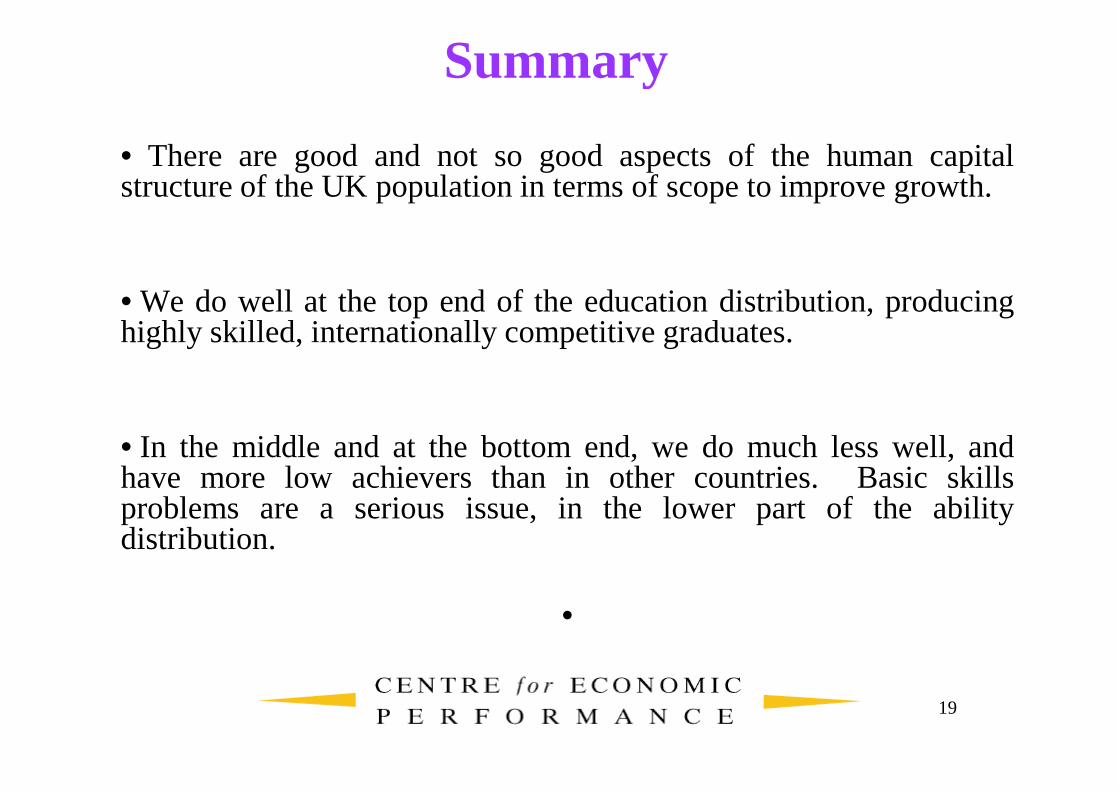
• There are good and not so good aspects of the human capitalstructure of the UK population in terms of scope to improve growth.
• We do well at the top end of the education distribution, producinghighly skilled, internationally competitive graduates.
Summary
• In the middle and at the bottom end, we do much less well, andhave more low achievers than in other countries. Basic skillsproblems are a serious issue, in the lower part of the abilitydistribution.
•
19
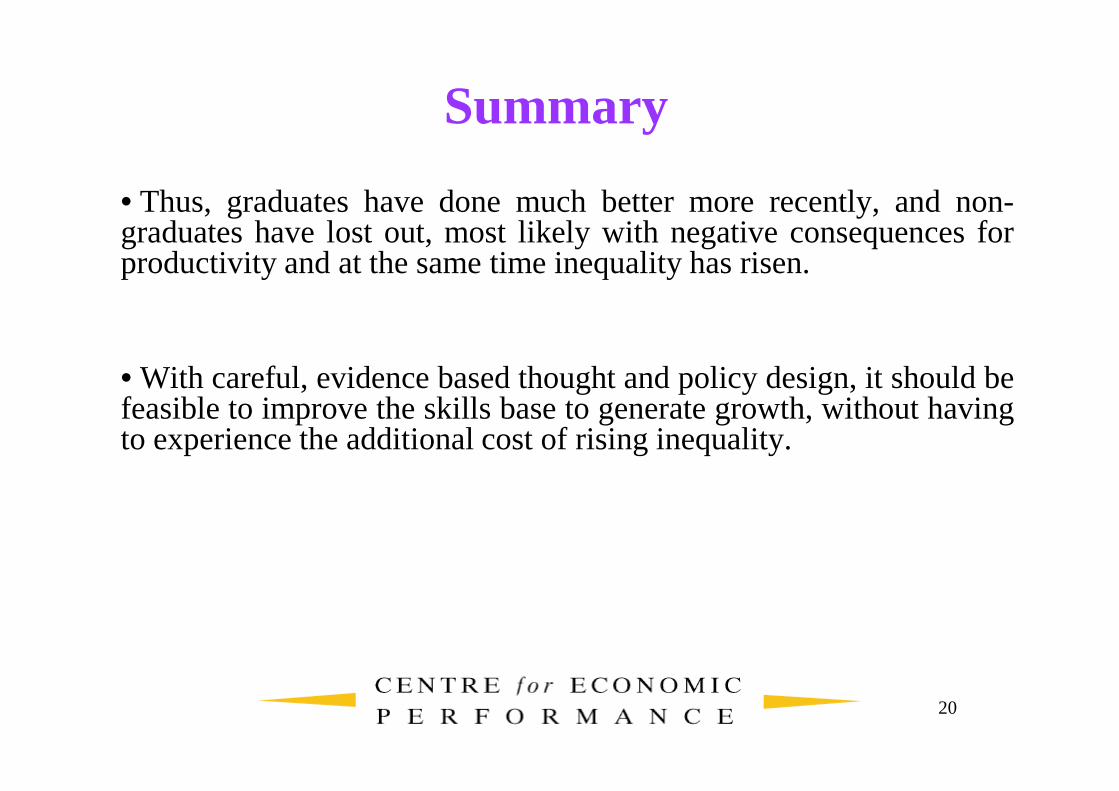
• Thus, graduates have done much better more recently, and non-graduates have lost out, most likely with negative consequences forproductivity and at the same time inequality has risen.
• With careful, evidence based thought and policy design, it should befeasibleto improvetheskills baseto generategrowth,without having
Summary
feasibleto improvetheskills baseto generategrowth,without havingto experience the additional cost of rising inequality.
20
Back Up Slides
21
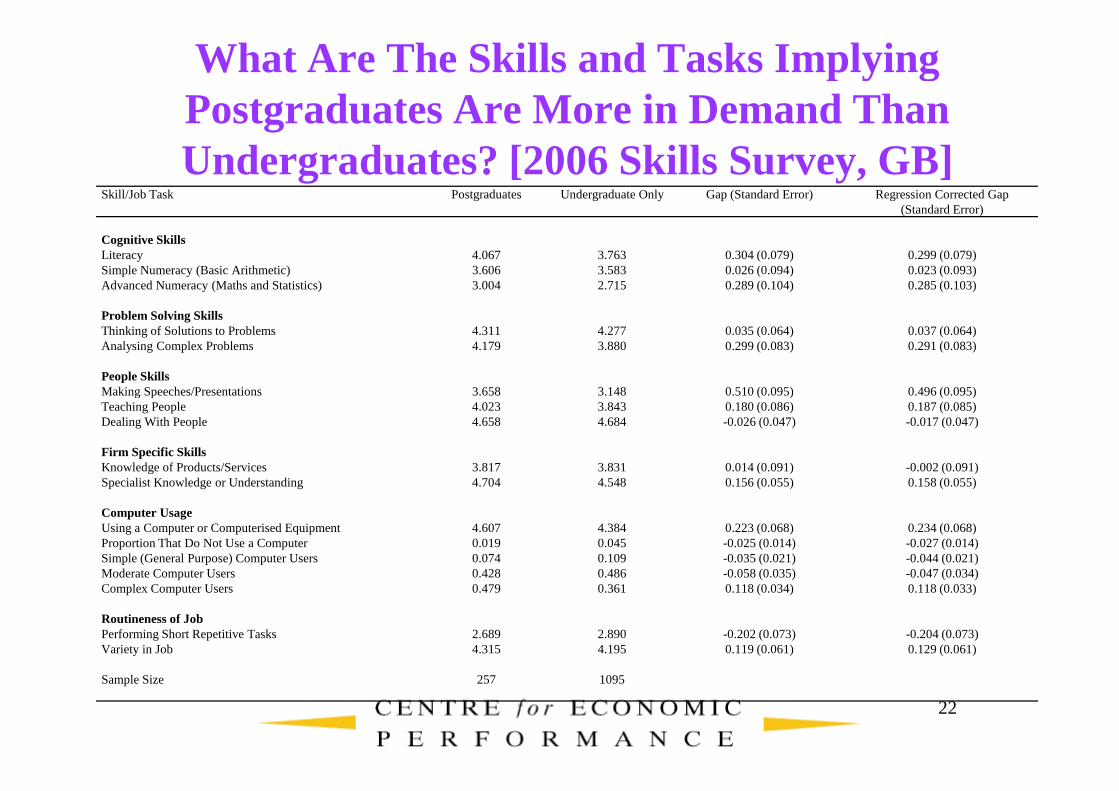
What Are The Skills and Tasks Implying Postgraduates Are More in Demand Than Undergraduates? [2006 Skills Survey, GB]
Skill/Job Task Postgraduates Undergraduate Only Gap (Standard Error) Regression Corrected Gap (Standard Error)
Cognitive SkillsLiteracy 4.067 3.763 0.304 (0.079) 0.299 (0.079)Simple Numeracy (Basic Arithmetic) 3.606 3.583 0.026 (0.094) 0.023 (0.093)Advanced Numeracy (Maths and Statistics) 3.004 2.715 0.289 (0.104) 0.285 (0.103)
Problem Solving SkillsThinking of Solutions to Problems 4.311 4.277 0.035 (0.064) 0.037 (0.064)Analysing Complex Problems 4.179 3.880 0.299 (0.083) 0.291 (0.083)
People SkillsMaking Speeches/Presentations 3.658 3.148 0.510 (0.095) 0.496 (0.095)
22
Making Speeches/Presentations 3.658 3.148 0.510 (0.095) 0.496 (0.095)Teaching People 4.023 3.843 0.180 (0.086) 0.187 (0.085)Dealing With People 4.658 4.684 -0.026 (0.047) -0.017 (0.047)
Firm Specific SkillsKnowledge of Products/Services 3.817 3.831 0.014 (0.091) -0.002 (0.091)Specialist Knowledge or Understanding 4.704 4.548 0.156 (0.055) 0.158 (0.055)
Computer UsageUsing a Computer or Computerised Equipment 4.607 4.384 0.223 (0.068) 0.234 (0.068)Proportion That Do Not Use a Computer 0.019 0.045 -0.025 (0.014) -0.027 (0.014)Simple (General Purpose) Computer Users 0.074 0.109 -0.035 (0.021) -0.044 (0.021)Moderate Computer Users 0.428 0.486 -0.058 (0.035) -0.047 (0.034)Complex Computer Users 0.479 0.361 0.118 (0.034) 0.118 (0.033)
Routineness of JobPerforming Short Repetitive Tasks 2.689 2.890 -0.202 (0.073) -0.204 (0.073)Variety in Job 4.315 4.195 0.119 (0.061) 0.129 (0.061)
Sample Size 257 1095
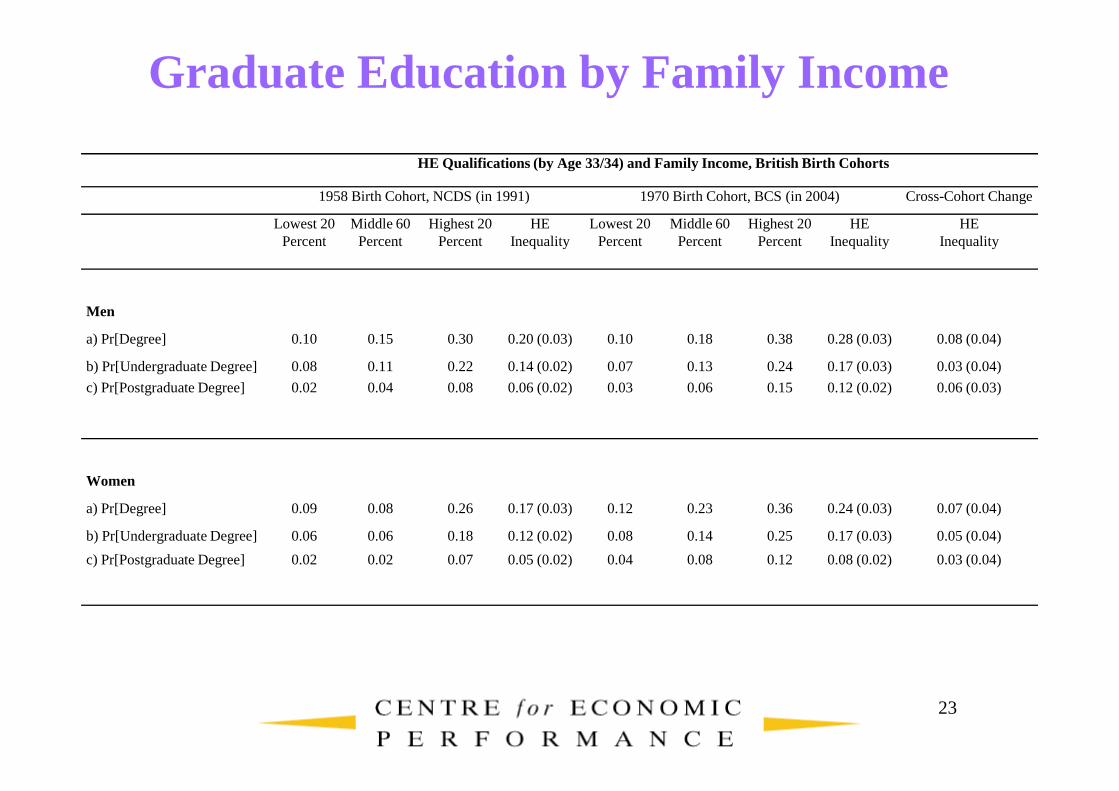
Graduate Education by Family Income
HE Qualifications (by Age 33/34) and Family Income, British Birth Cohorts
1958 Birth Cohort, NCDS (in 1991) 1970 Birth Cohort, BCS (in 2004) Cross-Cohort Change
Lowest 20 Percent
Middle 60 Percent
Highest 20 Percent
HE Inequality
Lowest 20 Percent
Middle 60 Percent
Highest 20 Percent
HE Inequality
HE Inequality
Men
a) Pr[Degree] 0.10 0.15 0.30 0.20 (0.03) 0.10 0.18 0.38 0.28 (0.03) 0.08 (0.04)
b) Pr[Undergraduate Degree] 0.08 0.11 0.22 0.14 (0.02) 0.07 0.13 0.24 0.17 (0.03) 0.03 (0.04)
c) Pr[Postgraduate Degree] 0.02 0.04 0.08 0.06 (0.02) 0.03 0.06 0.15 0.12 (0.02) 0.06 (0.03)
23
c) Pr[Postgraduate Degree] 0.02 0.04 0.08 0.06 (0.02) 0.03 0.06 0.15 0.12 (0.02) 0.06 (0.03)
Women
a) Pr[Degree] 0.09 0.08 0.26 0.17 (0.03) 0.12 0.23 0.36 0.24 (0.03) 0.07 (0.04)
b) Pr[Undergraduate Degree] 0.06 0.06 0.18 0.12 (0.02) 0.08 0.14 0.25 0.17 (0.03) 0.05 (0.04)
c) Pr[Postgraduate Degree] 0.02 0.02 0.07 0.05 (0.02) 0.04 0.08 0.12 0.08 (0.02) 0.03 (0.04)