Embed Size (px)
Citation preview
Executive Health and Safety
Epidemiological evidence for the effectiveness of the noise at work regulations
Prepared by the Institute of Sound and Vibration Research, the Medical Research Council’s Institute of Hearing Research and the MRC Hearing & Communication Group for the Health and Safety Executive 2008
RR669 Research Report
Executive Health and Safety
Epidemiological evidence for the effectiveness of the noise at work regulations
Professor Mark E Lutman Institute of Sound and Vibration Research University of Southampton
Professor Adrian C Davis MRC Hearing & Communication Group University of Manchester
Melanie A Ferguson MRC Institute of Hearing Research Nottingham
The Noise at Work Regulations 1989 and the Control of Noise at Work Regulations 2005 (the Regulations) are designed to minimise risk of occupational noise-induced hearing loss in the UK. The present study examined their effectiveness in a longitudinal field study, where participants were seen annually over a period of 3 years. Audiometric and otoacoustic emission measures were obtained in 154 recruits aged 18-25 years at risk of noise-induced hearing loss through occupational exposure and 99 non-exposed controls. The study had power to detect approximately 1-2 dB change per year, which is a smaller change than would be expected in the noise-exposed participants without protection. There were no significant effects on auditory function, or rate of change in function, of risk group when other potential explanatory variables were taken into account. Nor were there significant effects when contrasting exposed participants working in companies demonstrating relatively lower or higher compliance with the Regulations. Noise levels in exposed participants averaged approximately 88-89 dB(A) before accounting for hearing protection. The only significant effects on hearing demonstrated in the study were small effects of estimated social noise prior to the study, for example at nightclubs or from personal audio systems.
Limitations of the study arise from the range of noise level encountered and the restricted duration of the study, which precludes showing longer-term effects. The companies involved in the study are not necessarily representative of the UK in terms of their compliance. Within these limitations, no evidence for lack of effectiveness of the Regulations was found.
This report and the work it describes were funded by the Health and Safety Executive (HSE). Its contents, including any opinions and/or conclusions expressed, are those of the authors alone and do not necessarily reflect HSE policy.
HSE Books

© Crown copyright 2008
First published 2008
All rights reserved. No part of this publication may be reproduced, stored in a retrieval system, or transmitted in any form or by any means (electronic, mechanical, photocopying, recording or otherwise) without the prior written permission of the copyright owner.
Applications for reproduction should be made in writing to: Licensing Division, Her Majesty’s Stationery Office, St Clements House, 2-16 Colegate, Norwich NR3 1BQ or by e-mail to [email protected]
ii
ACKNOWLEDGEMENTS The authors wish to thank Russell Ecob, who designed and implemented the statistical modelling elements of the work. Gordon Brown contributed to the design of the compliance assessment schedule and carried out all of the assessments. Dr Stephen Karmy advised on the original design of the study and recruitment of participants. Several research assistants performed the data collection aspects of the study over its duration - in Nottingham: Kim Holmes and very special thanks to Kezia Hills who tested virtually all the participants; in Manchester: John Gill, Ann Fomukong and Thulisile Khoza; in Southampton: Graham Horswell. The MLS otoacoustic emissions equipment was provided by David Bullock of the Medical Research Council’s Institute of Hearing Research in Nottingham and used with the permission of Professor Roger Thornton. Thanks are due to colleagues from Occupational Heath departments in Manchester for assistance contacting companies for the study. Finally, thanks go to the companies who kindly agreed to take part in the study and to the employees who gave up their time.
iii

iv
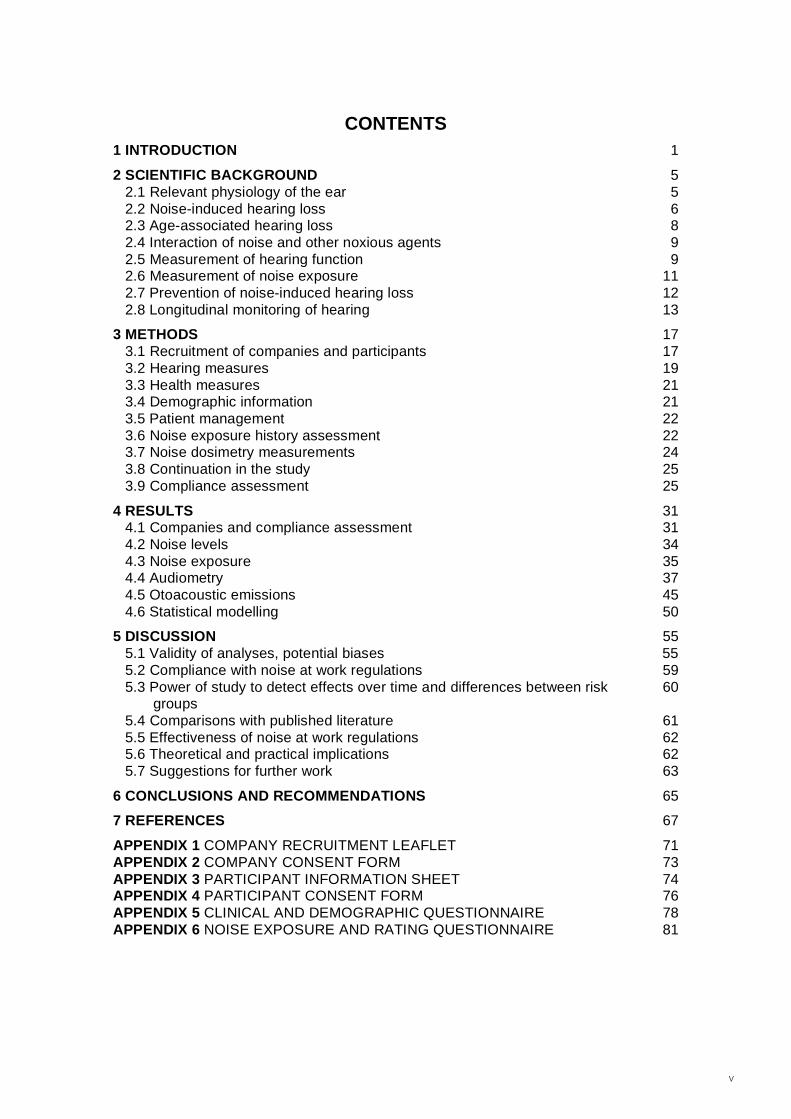
CONTENTS 1 INTRODUCTION 1
2 SCIENTIFIC BACKGROUND 5 2.1 Relevant physiology of the ear 5 2.2 Noise-induced hearing loss 6 2.3 Age-associated hearing loss 8 2.4 Interaction of noise and other noxious agents 9 2.5 Measurement of hearing function 9 2.6 Measurement of noise exposure 112.7 Prevention of noise-induced hearing loss 122.8 Longitudinal monitoring of hearing 13
3 METHODS 173.1 Recruitment of companies and participants 173.2 Hearing measures 193.3 Health measures 213.4 Demographic information 213.5 Patient management 223.6 Noise exposure history assessment 223.7 Noise dosimetry measurements 243.8 Continuation in the study 253.9 Compliance assessment 25
4 RESULTS 314.1 Companies and compliance assessment 314.2 Noise levels 344.3 Noise exposure 354.4 Audiometry 374.5 Otoacoustic emissions 454.6 Statistical modelling 50
5 DISCUSSION 555.1 Validity of analyses, potential biases 555.2 Compliance with noise at work regulations 595.3 Power of study to detect effects over time and differences between risk 60
groups5.4 Comparisons with published literature 615.5 Effectiveness of noise at work regulations 625.6 Theoretical and practical implications 625.7 Suggestions for further work 63
6 CONCLUSIONS AND RECOMMENDATIONS 65
7 REFERENCES 67
APPENDIX 1 COMPANY RECRUITMENT LEAFLET 71APPENDIX 2 COMPANY CONSENT FORM 73APPENDIX 3 PARTICIPANT INFORMATION SHEET 74APPENDIX 4 PARTICIPANT CONSENT FORM 76APPENDIX 5 CLINICAL AND DEMOGRAPHIC QUESTIONNAIRE 78APPENDIX 6 NOISE EXPOSURE AND RATING QUESTIONNAIRE 81
v

vi
EXECUTIVE SUMMARY Background Hearing conservation in the UK was governed by the Noise at Work Regulations 1989 until April 2006. The Control of Noise at Work Regulations 2005 then came into force. These sets of regulations stipulate a number of actions to be taken by employers to minimise the risk of noise-induced hearing loss in the workforce. Those actions include noise surveys, noise reduction, exposure limitation and, if those actions are insufficient, implementation of a programme of personal hearing protection. If the regulations are followed properly, noise-induced hearing loss should be minor and limited to the most susceptible individuals. These regulations are referred to here generically as the Regulations.
The earlier Regulations advised use of personal hearing protection at noise levels of 85 dB(A) and above, while use was mandatory at 90 dB(A) and above. These levels were reduced to 80 and 85 dB(A) in the later regulations. A lifetime of daily exposure to 80 dB(A) carries little risk of hearing damage in all but the most susceptible individuals.
Methods The present work investigated short-term effectiveness of the Regulations in practice by conducting a longitudinal field study in a sample of 19 companies. Recruits to the companies served as participants and were followed for a period of approximately 3 years on an annual basis. A total of 154 participants entering the study worked in noise levels of at least 85 dB(A); 99 controls were not exposed to any noise exceeding 80 dB(A). The companies with participants exposed to noise were classified according to the extent that they complied with the Regulations into two relative categories on the basis of surveys of practice: relatively low and high compliance. All companies demonstrated substantial, but incomplete, compliance.
Participants were assessed at the start of the study and at approximately annual intervals in terms of auditory function using two main measures: pure tone audiometry and otoacoustic emissions (OAE). The latter is an indicator of the activity of the outer hair cells of the inner ear, which play an essential role achieving normal sensitivity of hearing. Noise-induced hearing loss causes a reduction in hearing sensitivity at high frequencies, especially around 4 kHz, and reduction of OAEs.
Care was taken to document factors that might affect hearing, including medical conditions and exposure to noise. Assessment of noise exposure included past and concurrent occupational sources. Particular attention was also paid to documenting past and concurrent exposure to social noise from sources such as nightclubs and personal audio systems. Gunfire noise exposure was also quantified.
Hypotheses The main hypothesis was that exposure to noise at work is associated with poorer hearing threshold levels and reduced OAEs measured cross-sectionally compared to controls, after accounting for other potential factors. Similarly, it was hypothesised that exposure to noise at work is associated with deterioration of hearing threshold levels and OAEs over time when measured longitudinally. Null hypotheses were lack of such associations.
Results Surveys of compliance with the Regulations showed a range of scores on the rating scheme developed for the study, from a little below 50% to 100%. Common shortcomings were noise surveys that did not allow individual noise exposures to be estimated, insufficient awareness raising and re-training to ensure employees continue to recognise the risks of noise and protect themselves properly and lack of clear quality assurance practices and plans for continuous improvement. Having an identified person with overall responsibility for hearing conservation
vii
and sufficient authority to ensure that quality assurance and action plans are implemented was considered to be fundamental to successful compliance.
Noise dosimetry showed that estimated daily levels for the noise-exposed participants were in the range 85-94 dB(A), with an average of approximately 88-89 dB(A).
Measurements of auditory function showed no major effects on auditory function, or rate of change of auditory function, of occupational noise exposure compared to non-exposed controls, when other potential explanatory variables were taken into account. Explanatory variables included age, sex, education level, eye colour, family history and non-occupational noise exposures Nor were there significant effects of membership of relatively low and high compliance groups. Participant numbers were adequate to ensure power to detect changes of approximately 1-2 dB per year. Therefore, the null hypotheses are accepted and the measures taken by companies demonstrate a degree of effectiveness across the range of compliance encountered.
Estimation of noise exposure of participants, including the presumed benefits of hearing protection, indicated that few participants had accrued material occupational noise exposure before the study, or accrued material further exposure during the study. Material noise exposure here is defined as the energy equivalent of daily 8-hour exposure to 90 dB(A) for 1 year, which is an amount of noise exposure that may potentially cause slight but measurable hearing loss. There was little difference in this respect between exposed groups and controls. However, more than half of participants had accrued material exposure to social noise, irrespective of study group. Comparison of groups composed of participants with and without material social noise exposure showed significantly worse hearing threshold levels (averaged across the frequencies 3, 4 and 6 kHz and averaged across right and left ears) in the more exposed group. The group difference amounted to 1.7 dB, which compares with an expected difference of approximately 6 dB based on the social noise exposure estimates. There were no corresponding group differences for the OAE measures. It is inferred that either social noise exposure is over-estimated by participants or the nature and patterns of social noise exposure makes them less hazardous than normal patterns of occupational exposure containing equivalent noise energy.
Limitations of study Companies agreeing to participate were not necessarily representative and may be biased towards better compliance with the Regulations. Individual participants may have been biased towards those with concerns about their hearing, or possibly the reverse. The lack of formal random sampling makes it impossible to detect such biases if they exist.
While the measures taken by the companies involved in the study to combat risk of hearing damage from noise were effective in minimising hazard to hearing for employees working in relatively noisy areas, it is not possible to draw firm conclusions for companies where noise levels are substantially higher than in the companies involved in the study.
Field measurement of auditory status on company premises with participants taken immediately from the workplace reduces reliability of results compared to laboratory studies. Although steps were taken to avoid effects of noise exposure on the day of testing, the repeatability of measurements was poorer than in our previous work. This somewhat limited the power to detect changes within participants over time.
Implications and further research Within the limitations of the study, measures within the range taken by the participant companies in relation to the Regulations should ensure that the hearing of employees in noisy areas does not deteriorate relative to non-exposed controls, at least in the short term. Under these circumstances, social noise exposure appears to constitute a much greater risk to hearing
viii
in young people than occupational noise, when hearing conservation programmes are implemented effectively at work.
It has been suggested in the literature that use of OAEs to monitor hearing in people exposed to noise at work, in preference to or in addition to audiometry, would be beneficial. The present study was unable to support that suggestion and it would be premature to substitute OAEs for audiometry. Nonetheless, it must be recognised that audiometry has limited sensitivity for detecting noise-induced changes in hearing thresholds. Using existing techniques, a shift of 15 dB is required before confidence can be attached to changes in individuals. Further research may show that audiometry and OAEs can play complementary roles.
There is limited evidence from previous studies to suggest that reduced OAE amplitude is a precursor of noise-induced hearing loss and may be a biomarker for greater susceptibility to noise-induced hearing loss. Further research should be directed towards this issue by longitudinal study of populations exposed to noise. Special populations must be sought where it is ethical to study such effects without intervention to reduce the risk. Further research should also be directed towards other potential biomarkers for susceptibility to noise-induced hearing loss.
The timescale of the present study limited the magnitude of any effects that could potentially surface. Ideally, a longer study lasting perhaps 10 or even 20 years would be conducted, although it is recognised that finding participants who remain in a static working environment is becoming increasingly difficult.
ix

x
1 INTRODUCTION
Noise-induced hearing loss (NIHL) accrued in industry is the most common preventable form of hearing impairment, accounting for at least a third but maybe up to a half of hearing impairments in people under 50 years old. According to population studies carried out by the Medical Research Council’s Institute of Hearing Research (IHR), 11% of men and 3% of women in the UK in the early 1980’s had already accrued sufficient cumulative noise exposure to constitute a risk to hearing, amounting to a noise immission level1 (NIL) of 107 dB(A) or above. That exposure is equivalent to an LEP,d of 90 dB(A) throughout a 50-year working lifetime.
Current regulation of occupational noise exposure in the UK is through the Health and Safety at Work Act. More specific regulation was under the Noise at Work Regulations 1989 (NWR) [25] at the commencement of the study. Compliance with the NWR should ensure that personnel are not exposed to noise exceeding an LEP,d of 90 dB(A), thereby containing the risk of NIHL. However, due to the wide variation in susceptibility to NIHL, some people exposed to noise below an LEP,d of 90 dB(A) will sustain a degree of NIHL. According to ISO 1999 [31], 20% of men aged 65 with a history of exposure to an LEP,d of 90 dB(A) would have hearing threshold levels (HTL) at 4 kHz that are 20 dB greater than their non-exposed peers. Approximately half of this difference would have accrued in the first five years. Insofar as ISO 1999 gives a true indication of the relationship between noise exposure and NIHL, it can be seen that marginal compliance with the NWR merely contains the risk of NIHL rather than preventing it. The NWR make provision for people exposed to noise levels between 85 and 90 dB(A) by making hearing protection available, but as there is no requirement for enforcement of the use of hearing protection, this aspect of the NWR is weaker than other aspects.
The Control of Noise at Work Regulations 2005 (CNWR) [26], which came into force during the present study in April 2006, have addressed the limitations of the NWR. An important difference is that hearing protection must be worn at noise levels of 85 dB(A), and must be made available at noise levels above 80 dB(A). Hence, these action levels have been reduced by 5 dB(A).
The NWR take the form of a set of specific numbered regulations, ranging from survey of noise levels and assessment of risk to monitoring the effectiveness of hearing conservation. These regulations are outlined in more detail below. The CNWR similarly are outlined below.
The aim of the present research is to assess the effectiveness of the NWR, or the subsequent CNWR. It is not possible to separate the two sets of regulations neatly in time. While many of the participants in the study would have been exposed to noise prior to April 2006, when the CNWR came into effect, their employers may have anticipated the new regulations and put them into effect well before the implementation date of the regulations. On the other hand, employers may have been slow to appreciate requirements of the new regulations and put them into effect. Therefore, in the remainder of this report, the regulation framework will be referred to as the Regulations, which should be understood to be an undefined combination of the NWR and CNWR.
If the Regulations were effective in principle, and faithfully applied in practice, there should not be any noise-induced hearing loss (NIHL) due to employment, or at least the incidence of NIHL should be restricted to a few exceptionally susceptible individuals and the extent of that hearing loss should be minor. In order to assess whether that effectiveness obtained in practice, the study set out to monitor hearing sensitivity and other measures of auditory function in people exposed to noise under the Regulations. Specifically, we obtained distribution of hearing status
1 Noise immission level (NIL) is a cumulative measure of A-weighted noise exposure, used to assess accumulated risk to hearing and to predict hearing loss in people exposed to noise.
1
measures and their change over time in people exposed to noise and compared them to the same measures taken over the same period in people not exposed to noise. In addition, we assessed the extent of compliance with the Regulations in each workplace and divided them into two groups: low-compliance and high-compliance. We compared distributions of hearing status measures across the non-exposed group and two exposed groups. These comparisons were made in the context of a prospective longitudinal study design. Hearing changes were also modelled as a function of duration of noise exposure, its level and pattern as well as compliance with the Regulations, taking into account other demographic variables and personal characteristics. The length of the study needed to achieve these aims was three years.
Hearing status was measured by audiometry to acquire hearing threshold levels (HTL) and by otoacoustic emissions (OAE). Audiometric HTL represent the conventional measure of noise-induced hearing loss, as a loss of sensitivity to pure tones in quiet. OAEs indicate the electromotile response of the outer hair cells of the inner ear (cochlea) to sound input and are potentially a more sensitive indicator of cochlear damage when used in a longitudinal context. The background to these measures is described in more detail below.
The relevant provisions of the NWR are outlined in the following. Regulation 4 requires the employer to have assessments made by a competent person of noise exposure for individuals who are likely to be exposed to the first action level of 85 dB(A), or the peak action level of 140 dB. The assessments are to be reviewed when there may have been a change in circumstances. Regulation 5 requires the employer to keep records of assessments. Regulation 6 requires the employer to reduce the risk of damage to the hearing of his employees from exposure to noise to the lowest level reasonably practicable. Regulation 7 requires the employer to reduce noise exposure wherever an individual is likely to be exposed to the second action level of 90 dB(A), or the peak action level, by means other than personal hearing protection. Regulation 8 requires the employer to ensure that employees exposed to the second action levels of 90 dB(A), or the peak action level, are provided with hearing protection that will keep the risk of hearing damage to that arising below the second action level. Furthermore, the employer must make hearing protection available on request to employees exposed at the first action level of 85 dB(A). Regulation 9 requires the employer to demarcate ear protection zones where employees are likely to be exposed to the second action level, or the peak action level, using approved signs. Regulation 10 requires the employer to ensure that protective measures are used and maintained properly, and there is a reciprocal requirement for employees to comply with the measures. The guidance notes lay emphasis on the need to pursue a systematic programme to encourage use of hearing protectors, recognising that people are often reluctant to use them. However, this regulation applies only to individuals exposed at the second action level, or peak action level. Regulation 11 requires the employer to provide employees with information, instruction and training regarding the risk of damage to their hearing, steps they can take to minimise such risk, steps that the employee must take to obtain hearing protectors and their obligations under the Regulations.
The main changes incorporated in the CNWR are reductions of the first/second action levels from 85/90 to 80/85dB(A). There are peak action levels of 135 dB(C) and 137 dB(C). There are also new exposure limit values of 87 dB(A) (LEP,d) and 140 dB (peak) which must not be exceeded after taking into account wearing hearing protection. There is now a specific requirement to provide health surveillance where there is a risk to health. The guidance states that this is when there is frequent exposure at 85 dB(A).
Compliance assessment in the present study was achieved using a schedule designed around the above two sets of regulations. The schedule is described in detail in Chapter 3.
In summary, the present study set out to examine the effectiveness of the Regulations by applying sensitive measures of hearing status to people exposed to noise in places where the Regulations applied. Young participants were selected to minimise confounding effects of age
2
and previous exposure to noise at work. If the Regulations were effective, any changes in hearing status would be no greater in the exposed people than in non-exposed controls, provided the Regulations were complied with. Greater deterioration in hearing status associated with lower compliance with the Regulations than with higher compliance would indicate that the Regulations must be adhered to strictly to be effective.
3

4
2 SCIENTIFIC BACKGROUND
2.1 RELEVANT PHYSIOLOGY OF THE EAR The outer ear funnels sound from the external environment towards the tympanic membrane (ear drum), which is thereby caused to vibrate. Vibrations of the tympanic membrane are transmitted through the bones of the middle ear (malleus, incus, stapes) to the inner ear, where they are transduced into nerve impulses in the auditory nerve carrying information about the sound signal to the brain. The middle ear acts as an impedance transformer, matching the relatively low impedance of air to the higher impedance of the inner ear fluids. This is achieved mainly by the area ratio of the larger tympanic membrane to the smaller footplate of the stapes, although there is also some lever advantage. Vibrations at the stapes footplate, which is located in the oval window of the cochlea, set up a pressure wave throughout the inner ear (cochlear) fluids. This pressure wave causes the round window of the cochlea to vibrate, following the input vibrations. The displacements at the round window cause similar displacements to occur at the base of the basilar membrane, which divides the cochlear into two main chambers along its length. These displacements set off a wave that travels relatively slowly along the basilar membrane, forming a characteristic vibration pattern.
The cochlea is formed with a variation in vibration characteristics along the length of the basilar membrane. (Although its structure is coiled, its function is usually described as though it is stretched out as a linear tube.) The part of the basilar membrane closest to the oval window, known as the base, is relatively narrow and stiff, while the far end, known as the apex, is relatively broad and flaccid. This means that the basal portion resonates at high frequencies while the apex resonates at low frequencies. These characteristics determine the direction of the travelling wave, from base to apex, and cause the travelling wave to reach a peak at a position that depends on the input sound frequency. High frequency signals reach a peak near the base and low frequency signals reach a peak near the apex.
The travelling wave intrinsically causes an amplification of the vibration around the place of maximum vibration, known as the characteristic place. However, in a healthy cochlea, there is further amplification through the normal physiological behaviour of the outer hair cells on the basilar membrane. These cells detect movement of the membrane and then change length in a way that increases the movement. This process of positive mechanical feedback increases the amplitude of vibration by up to 60 dB in humans, causing a corresponding increase in the sensitivity of the ear. Without this mechanism, humans would have hearing thresholds closer to 60 dB than to 0 dB. The inner hair cells along the basilar membrane have a different function. They are the transducers of the amplified vibration into nerve impulses in the auditory nerve, leading ultimately to sensation of hearing when they reach the brain.
The positive feedback by the outer hair cells is known as active amplification, or the “cochlear amplifier”. The process consumes metabolic energy and only operates in the living cochlea. The cochlear amplification process is easily damaged and loss of amplification through loss of outer hair cells is the most common form of hearing loss. The amplification process is selective in two ways: it occurs primarily at the characteristic place along the basilar membrane and it only amplifies sounds at low and moderate intensities. Because of its selectivity in relation to place, it is also selective in terms of frequency, allowing the listener to focus on sound at one frequency and ignore sounds presented simultaneously at other frequencies. Loss of outer hair cell function therefore leads to loss of frequency resolution, the main practical consequence of which is difficulty following speech against a background of noise. Selectivity in relation to intensity arises because outer hair cell amplification saturates at moderate sound levels. Loss of outer hair cell amplification therefore reduces sensitivity for quiet sounds but has little effect on more intense sounds. The practical consequence of this is that an ear with outer hair cell damage
5
experiences loudness recruitment, whereby the loudness of sounds grows abnormally steeply with increasing intensity. This has implications for amplifying hearing aids, which must counteract recruitment by compressing the amplified signal.
A by-product of the “cochlear amplifier” is the generation of low-intensity sounds in the ear canal, termed otoacoustic emissions (OAE). The measurement of OAEs is described below. They are a normal physiological phenomenon and reduced or absent OAEs indicate reduced or absent outer hair cell function.
2.2 NOISE-INDUCED HEARING LOSS 2.2.1 Physiology of noise-induced hearing loss Noise-induced hearing loss (NIHL) accrues progressively and often unnoticed until it has reached a certain degree. The main site of impairment is the outer hair cells of the cochlea, where the damage is irreversible [2]. Very high levels of noise exposure can lead to acute mechanical damage to inner and outer hair cells, but this form of damage is very rare. More commonly, there is chronic damage that builds up slowly over time. Current scientific knowledge suggests that the main mechanism is excitotoxicity. Excessive exposure to sound creates a build-up of the metabolic products of outer hair cell activity that exceeds the capability of the cell to neutralise those products. These by-products of cell function are toxic to the cell and may either damage the cell structures themselves, or damage the DNA of the cell. In the first case, the cell dies as a consequence of critical damage and in the second case that DNA damage triggers a process of “programmed cell death”. Both processed cause the cell to die and be replaced by scar tissue. Hence, noise-induced hearing loss is irreversible and the main form of treatment is prevention.
2.2.2 Consequences of noise-induced hearing loss Loss of outer hair cells leads to a reduction in the normal amplification process occurring in the cochlea, which in turn leads to a loss of sensitivity to quiet sounds at frequencies associated with the region of damaged hair cells. NIHL is evident on the audiogram as mild or moderate bilateral sensory (cochlear) hearing loss, predominantly at high frequencies. The greatest hearing loss is commonly at 4 kHz, giving rise to the typical 4 kHz notch in the audiogram pattern [1]. The loss of sensitivity for quiet sounds is accompanied by a loss of frequency resolution ability, which means that sounds at the affected frequencies are more easily masked by sounds at other frequencies, especially lower frequencies. This phenomenon in referred to as increased upward spread of masking and has the consequence of making speech less clear. When listening to speech in quiet, increased upward spread of masking tends to mean that low-intensity higher-frequency consonant sounds in speech are masked by the more intense vowel sounds. This effect is exacerbated by reverberation in the environment. The result is reduced accuracy of speech recognition, especially confusion of words that are distinguished by weak high-frequency consonant sounds (e.g. bat versus back). Loss of frequency resolution ability also impairs ability to recognise speech in noisy backgrounds, as important speech sounds are masked by noise at adjacent frequencies. Typically, people with NIHL complain of loss of perceived clarity of speech and greater difficulty than normal following speech in a background of noise. They often require the television to be turned up louder than suits unaffected members of their family, which causes discord at home. Loss of frequency resolution ability is most evident when hearing threshold levels exceed approximately 30 dB [41].
Hearing aids primarily work by amplifying sound selectively as a function of frequency, according to the hearing loss of the recipient. Modern hearing aids are nonlinear and amplify low-intensity sounds more than high-frequency sounds; in other words they compress the dynamic range of input sounds to compensate for the reduced compression occurring in the cochlea due to outer hair cell loss. Nonlinear amplification can compensate to an extent for loss of sensitivity to quiet sounds and may help to restore normal loudness. However, hearing aids
6
cannot compensate for loss of frequency resolution ability and they do not restore speech recognition in noise to normal levels. Typically, people with mild-moderate sensorineural hearing loss require speech to be 5-10 dB more intense, relative to background noise, for recognition scores equal to normal listeners.
2.2.3 Relationship between noise-induced hearing loss and noise exposure Knowledge concerning the relationship between noise exposure and NIHL is based on cross-sectional studies of people exposed to noise, much of which was conducted several decades ago and which concentrated on people exposed continuously to high levels of noise that were commonplace in the 1950’s and 1960’s. This knowledge is far from complete. Most studies have suffered from lack of appropriate non-exposed control subjects and longitudinal studies are almost entirely lacking [45]. Authoritative studies have involved large primary studies or synthesis of data from several large primary studies. The seminal study of Burns and Robinson in 1970 [11] has been influential in the UK and elsewhere. It formed the basis of the first edition of the international standard ISO 1999 in 1975 and has been embodied in the National Physical Laboratory (NPL) tables that are still used widely for prediction of NIHL in populations exposed to noise. The later version of ISO 1999 in 1990 [31] synthesised data from studies in the US as well as Burns and Robinson to derive predictive formulae for predicting NIHL. An advantage of ISO 1999 [31] is that it allows the user to insert different values to account for the effects of age-associated hearing loss. This facility has enabled ISO 1999 to keep up with developing understanding of the effects of age on hearing and the recognition that there are important socio-economic factors governing hearing acuity. This is important because the non-exposed controls used in many studies of NIHL have been drawn from different socio-economic groups than the exposed participants (e.g. office worker, researchers, university staff).
Subsequent to the derivation of the formulae in ISO 1999, Robinson [61] conducted a comprehensive meta-analysis of the published evidence available at the time for the Health and Safety Executive (HSE). While that study is a comprehensive critical analysis, other authors have seldom used its formulae for prediction of NIHL. The study suffers from the same disadvantage as Burns and Robinson in its reliance on a database for age-associated hearing loss from unrepresentative socio-economic groups.
All of the above methods account for the combined effects of age and noise exposure by simple addition of the hearing losses from the two effects, or a slight modification of simple addition. The modified addition incorporated in ISO 1999 [31] slightly reduces the resultant hearing loss compared to simple addition. However, this effect is negligible for combined hearing loss lower than 40 dB and for the present purposes can be ignored.
ISO 1999 allows prediction of the distribution of NIHL to be expected from any cumulative amount of noise exposure. This is combined with (in most cases simply added to) distribution of age-associated hearing loss appropriate to the population in question. The resulting distribution allows estimation of the probability that any given magnitude of overall hearing loss will be exceeded. In the context of the present study, noise levels in the range from 80-95 dB(A) are of interests. Based on ISO 1999, the following table (Table 1) shows the extent of NIHL to be expected from a working lifetime of 45 years at daily continuous noise levels of 80, 85, 90 and 95 dB(A). The values are for NIHL at 4 kHz, which is the frequency predicted to give the greatest hearing loss. Values are given for the median and the 5th centile (value exceeded by 5% of population). These data constitute the noise-induced component of hearing loss alone. Note that hearing loss is minimal for exposures at 80 dB(A), even at the 5th centile, and increases at higher levels.
7
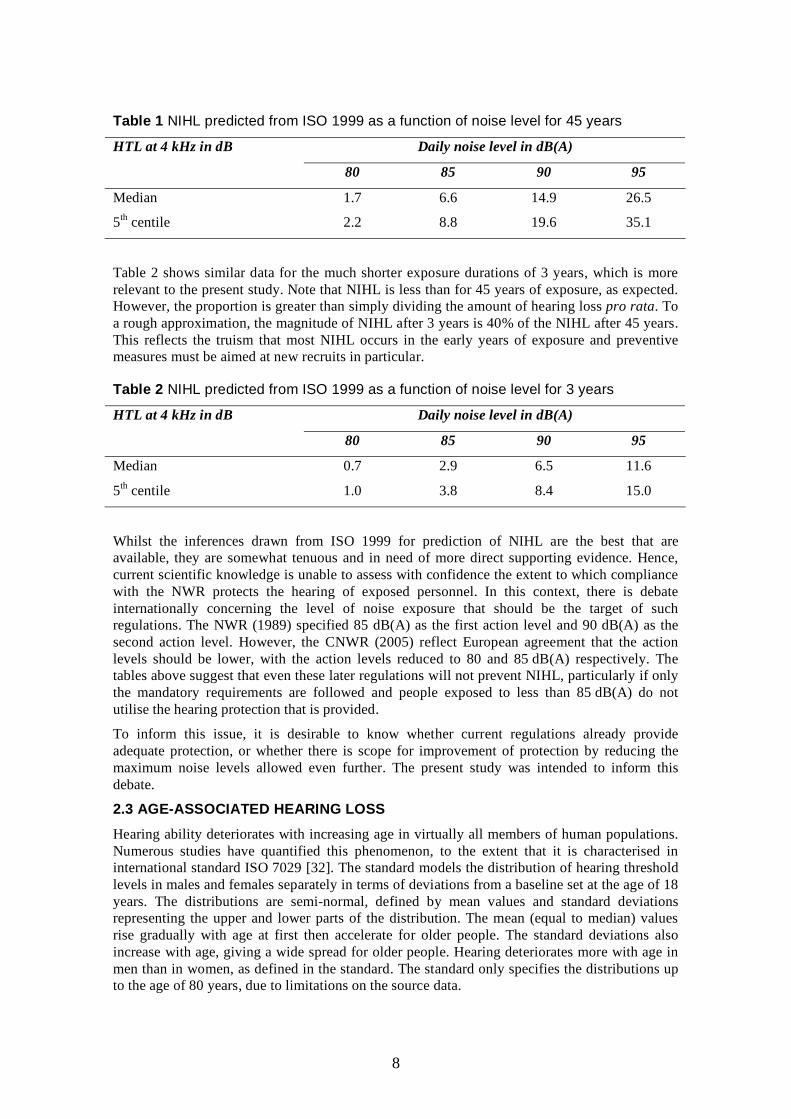
Table 1 NIHL predicted from ISO 1999 as a function of noise level for 45 years
HTL at 4 kHz in dB Daily noise level in dB(A)
80 85 90 95
Median 1.7 6.6 14.9 26.5
5th centile 2.2 8.8 19.6 35.1
Table 2 shows similar data for the much shorter exposure durations of 3 years, which is more relevant to the present study. Note that NIHL is less than for 45 years of exposure, as expected. However, the proportion is greater than simply dividing the amount of hearing loss pro rata. To a rough approximation, the magnitude of NIHL after 3 years is 40% of the NIHL after 45 years. This reflects the truism that most NIHL occurs in the early years of exposure and preventive measures must be aimed at new recruits in particular.
Table 2 NIHL predicted from ISO 1999 as a function of noise level for 3 years
HTL at 4 kHz in dB Daily noise level in dB(A)
80 85 90 95
Median 0.7 2.9 6.5 11.6
5th centile 1.0 3.8 8.4 15.0
Whilst the inferences drawn from ISO 1999 for prediction of NIHL are the best that are available, they are somewhat tenuous and in need of more direct supporting evidence. Hence, current scientific knowledge is unable to assess with confidence the extent to which compliance with the NWR protects the hearing of exposed personnel. In this context, there is debate internationally concerning the level of noise exposure that should be the target of such regulations. The NWR (1989) specified 85 dB(A) as the first action level and 90 dB(A) as the second action level. However, the CNWR (2005) reflect European agreement that the action levels should be lower, with the action levels reduced to 80 and 85 dB(A) respectively. The tables above suggest that even these later regulations will not prevent NIHL, particularly if only the mandatory requirements are followed and people exposed to less than 85 dB(A) do not utilise the hearing protection that is provided.
To inform this issue, it is desirable to know whether current regulations already provide adequate protection, or whether there is scope for improvement of protection by reducing the maximum noise levels allowed even further. The present study was intended to inform this debate.
2.3 AGE-ASSOCIATED HEARING LOSS Hearing ability deteriorates with increasing age in virtually all members of human populations. Numerous studies have quantified this phenomenon, to the extent that it is characterised in international standard ISO 7029 [32]. The standard models the distribution of hearing threshold levels in males and females separately in terms of deviations from a baseline set at the age of 18 years. The distributions are semi-normal, defined by mean values and standard deviations representing the upper and lower parts of the distribution. The mean (equal to median) values rise gradually with age at first then accelerate for older people. The standard deviations also increase with age, giving a wide spread for older people. Hearing deteriorates more with age in men than in women, as defined in the standard. The standard only specifies the distributions up to the age of 80 years, due to limitations on the source data.
8
For the purposes of the present study, which involves only young adults, ISO 7029 shows little change over the age range from 18-25 years. For example, at the median there is an increase of less than 1 dB at any frequency from age 18 to 25 years in either males or females.
There has been substantial debate about the baseline value used to represent hearing threshold level for 18-year-olds. The original standard implied that a value of 0 dB should be assumed based on numerous studies of highly screened populations of young adults. However, those studies involved participants who were not representative of the population at large and had thresholds that are slightly better than the whole population. More recent studies in the UK have shown that a baseline in the range 2-7 dB is more representative of the otologically normal UK population [46].
2.4 INTERACTION OF NOISE AND OTHER NOXIOUS AGENTS Hearing has been shown to be susceptible to exposure to organic solvents, such as toluene, that are used in several industrial processes. Studies in laboratory animals using high concentrations of solvents have shown an interaction between noise and solvent exposure, whereby the combination has greater effects that the sum of the separate effects [33] However, data from humans exposed to lower concentrations of solvents, which would be representative of industrial exposures, are limited. Schaper et al. [62] were unable to show any solvent effects at concentrations below 50 ppm (mean 26 ppm) in a large 5-year longitudinal study. Nor were they able to show any interaction with moderate levels of noise (mean 81 dB(A)), although there was a significant main effect of noise when comparing subgroups with mean exposure levels of 79 and 84 dB(A). The authors conclude that effects of toluene are not evident for concentrations below 50 ppm.
2.5 MEASUREMENT OF HEARING FUNCTION 2.5.1 Audiometry Conventional measurement of hearing loss utilises pure tone audiometry, where pure tones at a given frequency are presented to one ear of the test participant via standardised earphones, usually of the supra-aural type. Tones are presented in a sequence designed to estimate the lowest level to which the participant responds correctly on at least 50% of presentations. This level is designated the hearing threshold level (HTL). The sequence is repeated for a range of standard test frequencies for each ear to obtain the pure tone audiogram, which plots HTL as a function of frequency. The audiometer that generates and delivers the pure tones is calibrated according to the Hearing Level scale defined in ISO 389 (BS EN ISO 398-1, 2000). This scale normalises the measured thresholds so that otologically normal persons aged 18-30 years are expected, on average, to have HTL of 0 dB at all frequencies. In fact, studies of representative populations of otologically normal young adults tend to show average HTL a few decibels worse than 0 dB. This difference probably reflects the socio-economic factor mentioned above.
Hearing thresholds can also be measured by bone conduction, whereby the signal is introduced as a vibratory force applied to the skull. This signal is transmitted as vibration through the skull to the cochlea, by-passing the middle ear. Some of the vibration may enter the ear canal and/or middle ear and pass to the cochlea via the ossicular chain. Bone conduction measurements are used diagnostically to help identify conductive hearing loss, affecting the transmission of sound through the outer and middle ear. Where there is conductive hearing loss, air conduction thresholds will be worse than bone conduction, the difference reflecting the magnitude of conductive hearing loss.
The sequence of presentation of pure tones during audiometry may be controlled manually by the tester, or automatically by the audiometer. For workplace monitoring of hearing it is common to use the self-recording procedure, where the test participant is required to keep a button pressed whenever they can hear a (usually intermittent) tone. The audiometer decreases
9
the pure tone level in steps when the button is being pressed and increases it in steps when the button is not being pressed. In this way, the audiometer tracks the marginal zone above and below threshold and a printout of the tracking pattern is used to estimate the HTL.
Study of the effects of noise on HTL is restricted by the limited accuracy of audiometry as currently practised. In longitudinal studies, the main restriction is the limited repeatability of audiometry over time. Part of the lack of repeatability stems from the subjective nature of the psychophysical task. In addition to intrinsic variability, practice effects, subject attention and motivation can influence measured thresholds. This may be exacerbated by interference from extraneous ambient noise when the test is conducted without adequate sound treatment of the testing enclosure. Studies of the repeatability of pure tone audiometry under ideal circumstances with highly motivated young adult subjects suggest a within-subject standard deviation (SD) in the region of 3 dB [20]. Extending the interval between repeats and testing more representative samples of individuals tends to increase the SD to approximately 5 dB [44]. Our previous work for the HSE suggests a SD of 4.2 dB for HTL at 4 kHz obtained by self-recording audiometry repeated across an interval of 9 months [50].
2.5.2 Middle ear function measurement Study of NIHL is confounded by the presence of conductive hearing loss due to middle ear dysfunction, which commonly occurs in connection with upper respiratory tract infection and is virtually always a temporary disorder. The conductive hearing loss occurs due to blockage of the Eustachian tube and consequent negative pressure in the middle ear that is not equalised by the normal operation of the tube. The negative pressure may lead to exudate of fluid within the middle ear, which reduces the mobility of the tympanic membrane and causes a conductive hearing loss. Any conductive hearing loss due to the negative pressure alone is usually minor.
The presence of middle ear disorder of this type can be deduced from tympanometry, which is a technique used to assess the middle ear pressure and the mobility of the tympanic membrane. An acoustic probe is sealed in the outer ear and measures acoustic admittance using a low-frequency probe tone. This admittance is the combined admittance of the ear canal and tympanic membrane. The tympanogram charts the change in admittance as the ambient pressure is varied from above to below atmospheric pressure. In a normal ear, the tympanogram has a peak of maximum admittance at atmospheric pressure, where the applied pressure matches the middle ear pressure. The location of the peak gives an indication of the middle ear pressure, which in adults has a normal range from −50 to +50 decapascals (daPa). The magnitude of the peak gives an indication of the mobility of the tympanic membrane, which has a normal range of 0.2-1.6 ml (millilitres of air). Fluid in the middle ear reduces the peak greatly and there may be no identifiable peak at all.
2.5.3 Otoacoustic emissions Otoacoustic emissions (OAE) are a release of acoustic energy recorded in the ear canal. Their general properties have been reviewed comprehensively by Probst et al. [60]. They have their origin primarily in the outer hair cells of the cochlea and are associated with sharply tuned frequency-analysing mechanisms (see above). Otoacoustic emissions are recordable in the vast majority of ears with normal or near-normal hearing, but not in ears with cochlear hearing losses greater than about 25 dB HL at the best-hearing frequencies. This suggests that OAEs are sensitive to minor pathology affecting the sharply tuned frequency selective mechanism of the outer hair cells and may be a more sensitive indicator of damage than the conventional audiological measurement of pure-tone hearing threshold levels.
Two types of OAE have been studied widely: transiently evoked and distortion product otoacoustic emissions (TEOAE and DPOAE). TEOAEs are almost universally elicited by broadband clicks, whereas DPOAE methods use pairs of tonal stimuli at specific frequencies (f1 and f2) and record the level of intermodulation distortion, typically at the frequency 2f1−f2.
10
Hence DPOAEs are intrinsically frequency specific, whilst any frequency specificity of TEOAEs can only be derived by spectral analysis of the recorded waveform. When HTL is dichotomised as better or worse than 25 dB, and OAEs are dichotomised as present or absent, the ability of OAEs to predict HTL can be characterised in terms of sensitivity and specificity. Studies of TEOAEs indicate sensitivity approaching 100% for sensorineural impairments. Specificity depends on factors including the actual recording methods used, ambient conditions and the composition of the test sample (preponderance of marginal cases can reduce specificity markedly). In studies of young subjects with normal hearing at all audiometric frequencies, and where there were good recording conditions, TEOAEs have been obtained in virtually 100% of ears [35]. By contrast, in a group of mainly middle-aged adults where mild and moderate hearing impairment at high frequencies is commonplace, Lutman [41] reported a specificity estimate of only 73%, despite good recording conditions. There are fewer data from which to judge whether DPOAEs can be recorded in 100% or normal ears, although it becomes increasingly difficult to record DPOAEs as frequency is reduced below 2 kHz. Gorga et al. [22] have compared the ability of TEOAEs and DPOAEs to predict normal hearing, and found TEOAEs to be better below 2 kHz whilst DPOAEs are better above 2 kHz.
The ability of OAEs to predict the magnitude of HTL, rather than dichotomised groupings, has received little attention. TEOAEs seem more suited to simply distinguishing normal from abnormal, whilst DPOAEs at higher frequencies (e.g. 4 kHz) may give graded predictions of hearing threshold level.
A novel form of TEOAEs utilises a special sequence of clicks that allow the response to a click to be overlapped with the subsequent click stimulus [69]. The mathematical properties of a maximum length sequence (MLS) allow the overlapping stimuli and responses to be unravelled so that the averaged response is no longer contaminated by the stimulus. This technique allows clicks to be presented at a very high repetition rate, enabling the collection of an average of many more responses in a given duration. As the quality of an average depends on the number of responses included, better quality recordings can be obtained within a practical recording time. This advantage is diluted due to a reduction of response amplitude with increasing stimulus rate, for physiological reasons, but there is potentially a net gain from using the MLS technique. The MLS is a pseudo-random binary sequence of present or absent clicks and with long sequences the proportion of absent clicks approaches one half.
2.6 MEASUREMENT OF NOISE EXPOSURE For the purposes of assessing risk to hearing, noise levels are measured using the A-weighting scale, which weights frequencies according to the sensitivity of the human ear. Sound pressure levels measured using A-weighting are given units of dB(A). All sound level meters incorporate A-weighting, which is defined in IEC 651 [30].
For steady noises, a simple sound level meter is sufficient to measure the noise level by sampling over a period of a few seconds. However, most noises fluctuate and a longer period of sampling is required to obtain a meaningful reading. This requires the use of an integrating sound levels meter, which summates the noise energy over the sampling period and divides by time, in order to give the average level in energy terms. A steady noise with a level that is numerically equal to the integrated and averaged level contains the same energy and therefore poses an equivalent risk to hearing. Therefore, the integrated and averaged level is referred to as the equivalent continuous sound level, generally abbreviated Leq.
Personnel may only be exposed to noise during a part of the day, or part of the week, which reduces risk of hearing damage. Risk is dependent on the total A-weighted energy reaching the ear and therefore daily risk can be characterised by the level of a noise that, if present for a nominal working day of 8 hours, contains the same energy as the pattern of noise that actually
11
occurs. This equivalent daily noise level is symbolised by LEP,d. Most guidance documents for permissible noise exposures are phrased in terms of LEP,d.
Cumulative risk from noise exposure is assessed by further integration of noise energy over the lifetime of an individual. This can be achieved by multiplication in energy terms of LEP,d by the number of days per week, weeks per year and number of years of exposure to derive the noise immission level (NIL, see above).
Noise surveys typically entail measurement of noise levels in the vicinity of the exposed person, with the aim of estimating the level occurring at the position of the head in the absence of the person. However, when personnel move around during their work, that approach is problematic and resort is made to noise dosimetry using what is in effect a wearable integrating sound level meter. Small portable devices are available that can be attached to the lapel or to protective equipment such as a hard hat. They usually log parameters of the noise exposure history over a period of several hours in a way that can be read out on a master display unit afterwards. In this way, it is possible to estimate Leq for the period of measurement and hence estimate LEP,d.
2.7 PREVENTION OF NOISE-INDUCED HEARING LOSS Noise-induced hearing loss is preventable in virtually all situations by taking one or more of three steps, as advised in the Regulations. First, noise reduction should be implemented wherever possible to achieve the lowest levels that are reasonably practicable. Reduction to 80 dB(A) should be sufficient for the purposes of hearing conservation for virtually all personnel, but further reduction is desirable if it is reasonably practical to improve comfort and performance and to safeguard the minority of people who may be very susceptible to noise. Second, sound exposure received by personnel should be reduced as far as reasonably possible by enclosing noise sources or placing barriers in the transmission path or by reducing the duration of exposure to noise. As a final resort, personal hearing protection can be used to reduce the sound energy reaching the ears of exposed people.
2.7.1 Quantification of effectiveness of hearing protection Hearing protectors vary in their attenuation characteristics. This variation is a function of the materials used to construct the device and how well the device conforms to the ear, thus preventing sound leakage past the device. For ear muffs, sound may leak between the soft plastic sealing cushion and the skin. For ear plugs, sound may leak between the plug and the skin of the ear canal. For ear plugs, the attenuation may vary according to how deeply the plug is inserted.
The effectiveness of hearing protectors is quantified in terms of sound attenuation in decibels at a number of preferred frequencies. The sound attenuation is the amount by which the sound level is reduced when travelling from outside the protector to the eardrum.
The most commonly used method of measurement is Real Ear Attenuation at Threshold (REAT). The results of the REAT measurements are usually quoted as a mean value and standard deviation. For practical application, the attenuation is assumed to be lower than the mean value, because approximately 50% of subjects will experience less attenuation than the mean. An allowance equal to one or two standard deviations may be subtracted from the mean value. If the results were normally distributed, an allowance of one standard deviation would give the attenuation exceeded in approximately 84% of the population. An allowance of two standard deviations would give the attenuation exceeded by approximately 98% of the population.
Mean attenuation values for practical hearing protectors are greater at high frequencies (above 1 kHz) than at lower frequencies simply due to the physics of sound transmission. Foam earplugs and earmuffs are generally more effective than other forms of earplug.
12
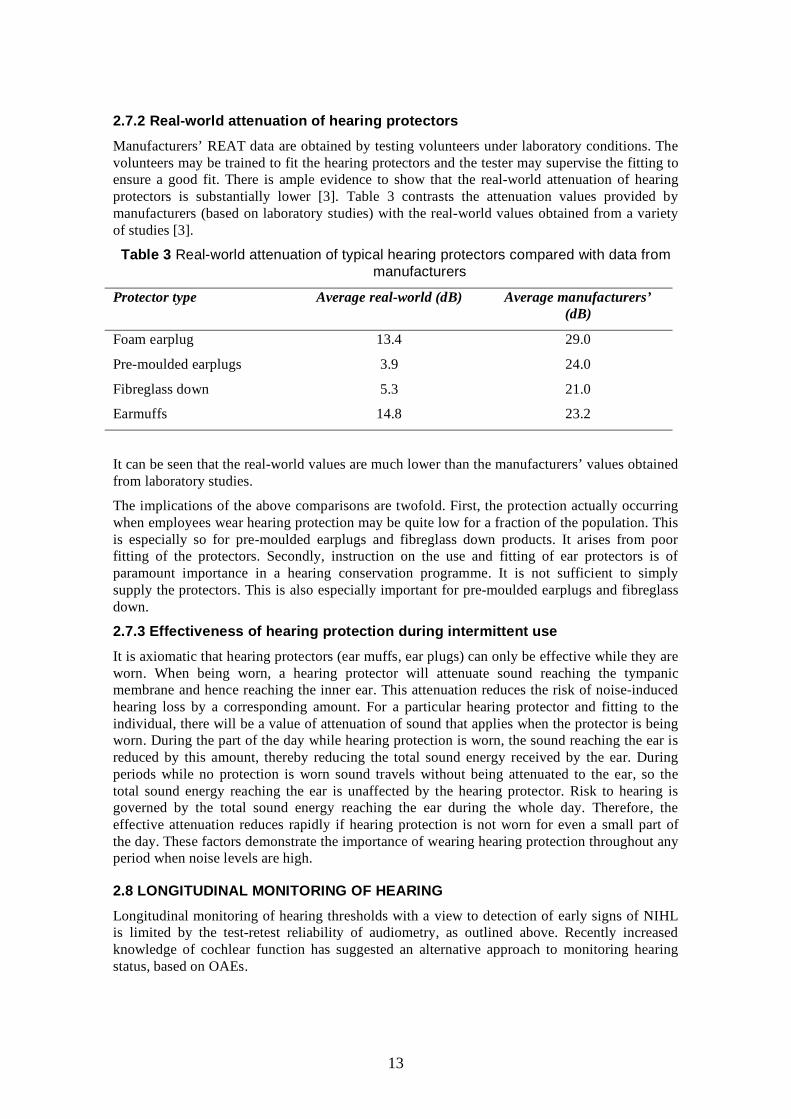
2.7.2 Real-world attenuation of hearing protectors Manufacturers’ REAT data are obtained by testing volunteers under laboratory conditions. The volunteers may be trained to fit the hearing protectors and the tester may supervise the fitting to ensure a good fit. There is ample evidence to show that the real-world attenuation of hearing protectors is substantially lower [3]. Table 3 contrasts the attenuation values provided by manufacturers (based on laboratory studies) with the real-world values obtained from a variety of studies [3].
Table 3 Real-world attenuation of typical hearing protectors compared with data from manufacturers
Protector type Average real-world (dB) Average manufacturers’ (dB)
Foam earplug 13.4 29.0
Pre-moulded earplugs 3.9 24.0
Fibreglass down 5.3 21.0
Earmuffs 14.8 23.2
It can be seen that the real-world values are much lower than the manufacturers’ values obtained from laboratory studies.
The implications of the above comparisons are twofold. First, the protection actually occurring when employees wear hearing protection may be quite low for a fraction of the population. This is especially so for pre-moulded earplugs and fibreglass down products. It arises from poor fitting of the protectors. Secondly, instruction on the use and fitting of ear protectors is of paramount importance in a hearing conservation programme. It is not sufficient to simply supply the protectors. This is also especially important for pre-moulded earplugs and fibreglass down.
2.7.3 Effectiveness of hearing protection during intermittent use It is axiomatic that hearing protectors (ear muffs, ear plugs) can only be effective while they are worn. When being worn, a hearing protector will attenuate sound reaching the tympanic membrane and hence reaching the inner ear. This attenuation reduces the risk of noise-induced hearing loss by a corresponding amount. For a particular hearing protector and fitting to the individual, there will be a value of attenuation of sound that applies when the protector is being worn. During the part of the day while hearing protection is worn, the sound reaching the ear is reduced by this amount, thereby reducing the total sound energy received by the ear. During periods while no protection is worn sound travels without being attenuated to the ear, so the total sound energy reaching the ear is unaffected by the hearing protector. Risk to hearing is governed by the total sound energy reaching the ear during the whole day. Therefore, the effective attenuation reduces rapidly if hearing protection is not worn for even a small part of the day. These factors demonstrate the importance of wearing hearing protection throughout any period when noise levels are high.
2.8 LONGITUDINAL MONITORING OF HEARING Longitudinal monitoring of hearing thresholds with a view to detection of early signs of NIHL is limited by the test-retest reliability of audiometry, as outlined above. Recently increased knowledge of cochlear function has suggested an alternative approach to monitoring hearing status, based on OAEs.
13
The ability of OAEs to predict changes in HTL over time in humans has received only limited study. This is of particular importance if OAEs are to find practical application for monitoring in subjects exposed to potentially hazardous noise. Two studies have examined subjects before and after temporary threshold shifts (TTS) due to noise. Plinkert et al. [59] found that TEOAE and DPOAE amplitudes reduced in 13 soldiers with TTS, whereas OAEs remained stable in control subjects not exposed to noise. The test subjects were selected as those most sensitive to TTS out of a group of 194 soldiers. Kvaerner et al. [37] reported reductions in TEOAE amplitude and TTS in 13 employees exposed to industrial noise at 85-90 dB(A), but no correlation between the amount of TEOAE reduction and the amount of TTS. A field study has addressed the feasibility of using OAEs to monitor permanent threshold shifts (PTS). Hotz et al. [29] demonstrated that TEOAE amplitude in the frequency range from 2 to 4 kHz was reduced in 147 male subjects after a 17-week military training period. Comparison with measures of PTS led the authors to conclude that TEOAEs may be a more sensitive indicator to detect early cochlear damage than pure tone audiometry. A more recent study in 92 solders exposed to impulse noise during military service by Konopka et al. [36] showed significant shifts in hearing threshold levels only at frequencies of 10 and 12 kHz, but decrements in TEOAE at 2, 3 and 4 kHz with greatest change at 2 kHz. Duvdavaney and Furst [19] also examined 84 combat solders and showed slight hearing loss at conventional frequencies as well as decreases in TEOAEs following exposure to noise from weapons. They provide preliminary evidence that a combination of low TEOAE amplitude and normal hearing thresholds are predictive of susceptibility to subsequent noise-induced hearing loss.
There are limited studies of personnel exposed to occupational noise other than weapons firing. Sliwinska-Kowalska and Kotylo [65] reported decreased TEOAE amplitude in two groups of noise-exposed industrial workers, compared with controls but no decrease in DPOAEs and hearing thresholds. Lapsley Miller at al. [38] measured hearing threshold levels and both distortion product and transiently evoked OAEs in 69 noise-exposed employees compared to 42 non-exposed controls. The noise exposures involved were only specified as exposed to more than 350 hours of non-impulse noise or more than 100 rounds of gunfire per year. Small mean increases in hearing thresholds and decreases in OAEs occurred in the noise-exposed group compared to the controls. There were indications that decreased TEOAEs predicted those individuals with material hearing threshold shifts, but the authors state that use of OAEs for this purpose is premature. In a later study of 338 military personnel serving a tour of duty on an aircraft carrier, Lapsley Miller et al. [39] measured hearing threshold levels and both distortion product and transiently evoked OAEs before the tour and afterwards, 9 months later. Personnel were exposed to high and very high levels of noise requiring use of single or double hearing protection. There were no quiet recovery periods due to the substantial ambient noise levels onboard ship. The use and adequacy of hearing protection were not complete, so that some personnel would receive hazardous noise exposure. There was no significant mean change in hearing threshold levels but mean OAE amplitudes did decrease significantly. While there was correlation between distortion product and transiently evoked OAE changes, there was no significant correlation between hearing threshold shifts and OAE shifts. This study also provides preliminary evidence that low TEOAE amplitude may predict susceptibility to noise-induced hearing loss, with TEOAE amplitude at 4 kHz being the best predictor. Seizas et al. [63] analysed longitudinal audiometric results from 456 apprentices and students in the construction industry as well as DPOAEs in terms of risk factors. There was a significantly raised risk of hearing loss in the more exposed apprentices and associated with longer period of working in the industry. A similar pattern was found for DPOAEs, leading the authors to suggest that DPOAEs may be useful for monitoring purposes. More recently, Shupak et al. [64] followed 138 ship engine room recruits for 2 years compared to 100 non-exposed controls, using audiometry and both distortion product and transiently evoked OAEs. Significant increases in hearing threshold levels and TEOAEs occurred in the noise-exposed group after 2 years; significant DPOAE shifts occurred only for the left ear. Although TEOAE shifts at 1 year
14
predicted hearing threshold level at 2 years, the predictive value was too low for the authors to recommend this approach in practice.
Our previous research conducted for the HSE examined the repeatability of a wide range of OAE measures in the short-, medium- and long-term [50]. The research also examined the sensitivity of OAEs in relation to differences in HTL amongst subjects. This work allowed the construction of an index of repeatability that could be used to compare the OAE methods with audiometry in terms of repeatability, and hence by inference their sensitivity to identify changes in hearing status against background variability. A number of OAE measures were more sensitive than audiometry, thus defined. Table 29 of our previous report to the HSE lists the best methods ranked in order of the index of variability. The TEOAE methods were generally more sensitive than DPOAE methods. The study had included two classes of TEOAE method obtained using different apparatus. Conventional TEOAEs were recorded using the Otodynamics EchoPort system and utilised conventional synchronous time-domain averaging of responses to clicks presented at constant intervals at a rate of approximately 50/s. Maximum length sequence (MLS-) TEOAEs were recorded with a prototype commercial system produced by Natus. The MLS-TEOAE method is based on an invention by the Institute of Hearing Research with which the investigators have been closely associated and presents clicks in a pseudo-random sequence that can overlap the response interval [43, 69]. This allows stimulation rates up to 5000/s and offers the possibility of more efficient data capture or greater repeatability. The results of the repeatability study indicated that the MLS-TEOAE instrument produced the five highest ranked measures, followed by conventional TEOAEs in sixth place. However, the first place was occupied by a measure obtained from the MLS instrument using a conventional stimulus sequence. Thus, the most important factor appears to be related to the instrumentation rather than the stimulus sequence, although the potential benefits of MLS stimulation deserve further investigation.
15

16
3 METHODS
3.1 RECRUITMENT OF COMPANIES AND PARTICIPANTS 3.1.1 Recruitment of companies Numerous companies in and around the cities of Nottingham and Southampton were initially targeted, based on the nature of their business and likelihood of high noise levels. Recruitment in Southampton proved to be very difficult due to a decline in manufacturing industry in the area over the last decade, so companies were recruited at a later date from the Greater Manchester area. Companies within a 50-mile radius of Nottingham and Manchester were identified from sources such as local commerce and industry business lists and yellow pages. More than 2000 companies were approached in total. A leaflet was sent to these companies requesting the participation of the companies and their employees, including a brief explanation of the study aims and what was involved (see Appendix 1). The confidential nature of the data collected was highlighted. The leaflet was sent to the Health and Safety (H&S) manager, addressed personally if this was known, along with a reply slip and a reply-paid envelope addressed to the relevant research organisation (MRC Institute of Hearing Research, Institute of Sound and Vibration Research or MRC Hearing and Communication Group). To register interest in the study, the company was asked to fill in and return the slip to the research organisation. Telephone follow-up was also employed. On receipt of a positive response, researchers visited the company to discuss the details of the study with the H&S manager or occupational health professional and a senior member of the management team. The company was also checked for suitability. Criteria for suitability were as follows.
a) at least five employees aged 16-25 years that would be willing to take part b) a quiet room available to test participants if they were unable to attend the clinics at the
research organisations c) employer willing for their employees to be tested and to allow noise and compliance
measurements within the workplace d) noise levels approximately 85 dB(A) or above for companies providing noise
employees2
e) ‘noise’ companies were required to provide measures to protect employee’s hearing from damage by workplace noise3
Initially, it was anticipated that participants would attend the research organisations for testing, primarily so hearing thresholds could be tested in soundproof conditions. However, it quickly transpired that companies were reluctant for their employees to be absent from the work. (Reluctance by employees was seldom encountered.) Therefore, in most cases testing was performed on-site in a quiet room. Some companies had soundproofed booths and these were used for audiometry if available.
During the initial visit the researchers clarified that feedback on the employee’s hearing test results and the compliance assessments would not be made available to the company until the end of the study. Hearing test results would only be released with the consent of the employee. Delayed disclosure of compliance assessments was to prevent the company changing its noise prevention practice as a result of being in this study. However, informal noise measurements made by the researchers at the initial visit were made available to the company. There was no remuneration for the participating companies, although advantages of taking part in the study such as highlighting good hearing preservation practice and the importance of raising awareness
2 To ensure this, spot measures of noise levels in the relevant work areas were made with a sound level meter (Brüel and Kjaer type 2260)3 Although compliance with the Regulations was one of the factors being investigated, it was considered unethical to recruit companies who were blatantly non-compliant with the Regulations by not providing hearing protection.
17
of hearing damage by noise were emphasised. On agreeing to take part in the study, a senior member of the management team was asked to sign a consent form (Appendix 2).
There were major difficulties recruiting companies to participate in the study for a number of reasons.
a) The main reason was that many companies were concerned that an outside agency coming into their premises could potentially lead to claims from employees for compensation for hearing damage, particularly should they be found to be failing to comply with the Regulations. The vast majority of companies agreeing to take part during the initial meeting considered they were complying well with the Regulations.
b) The manufacturing industry in the UK is declining and subsequently the number of companies with noisy environments is also declining. In 2002, it was reported that there had been a 5% decline in manufacturing in the previous 12 months [27].
c) With the decline of the manufacturing industry the number of young employees being recruited, such as apprentices, is also declining.
d) The introduction of the Regulations in 1989 meant that companies were actively taking precautions to reduce noise levels and so there were fewer companies employing people working in noise than in previous decades.
e) Companies did not want to release their employees in work time due to disruption of their processes and loss of productivity.
f) Recruitment of non-noise companies should have been less problematic. However, the study design called for noise and non-noise employees to be matched for sex and occupational group. The majority of noise workers were male (85%) with a manual occupation and there was some difficulty recruiting male, manual workers who worked in quiet environments.
3.1.2 Recruitment of participants Once the companies had consented to take part in the study, participants were recruited using one or more of the following methods.
a) Names and addresses were given to the researchers and an invitation letter, information sheet (see Appendix 3), reply slip and reply-paid envelope were posted directly to the potential participants. Participants willing to take part returned the signed reply slip in the reply-paid envelope to the research organisations.
b) The invitation letter, information sheet and reply-paid envelope were distributed among employees by the person who managed the on-site co-ordination, usually the company H&S manager or occupational nurse. The reply slips were either returned to the research organisations directly or to the on-site co-ordinator.
c) A notice was put up in the workplace asking those that were interested in participating in the study to contact the H&S manager/occupational nurse.
The method of recruitment was discussed with the company and the researchers followed the preference of the company. Once participants had agreed to take part in the study, appointments were made for them to be seen using one of the following methods:
a) The on-site co-ordinator would liaise with the researcher and arrange a time when the employee would be given time out from work to attend the test appointment, either on-site or at the research organisation.
b) The researcher would liaise directly with the employee and arrange an appointment to attend either on-site or at the research organisation in the employee’s own time.
Signed informed consent was obtained from the participant (Appendix 4, participant consent form). Employees were offered participation expenses of £10 for the first visit and either £20 or £30 for subsequent visits. The latter was offered to some employees because they were only able to attend in their own time and this was an added incentive. Those who travelled to the
18
19
research organisations for testing were also paid their travel expenses. One of the companies requested that participation expenses were paid to the company’s social fund. Participants were tested either on-site or at the research organisations.
The participants were identified as working either in a noise or non-noise environment. A participant was classed as working in a noise environment if noise levels were equal to or exceeded 85 dB(A) for at least an hour per day. Participants were classed as working in a non-noise environment if noise levels were less than 80 dB(A). Some of the non-noise participants may report some occupational noise exposure if they had a need to enter any noisy areas. Attempts were made to match non-noise participants to the noise participants by sex and occupational group. Although matching was not exact, non-noise participants were recruited from similar occupational groups to the noise participants (for further details on classification of occupational group, see 3.4). In this way, comparison across substantially different socio-economic groups was avoided. Lutman et al. [48] have shown that non-manual occupational groups have systematically better hearing on average than manual occupational groups, even after excluding people who have been exposed to noise at work.
Approval was obtained from University Ethics Committees associated with the research organisations4.
3.2 HEARING MEASURES 3.2.1 Pure-tone audiometry Pure-tone audiometry (PTA) was conducted to obtain hearing threshold levels (HTL) using either a Danplex DA65 audiometer with TDH-49 earphones and Audiocups or Siemens Unity audiometer with THD-49 earphones. The Audiocups provided attenuation of background noise when testing in a quiet room. The Siemens audiometer was used only in a soundproof room. Initially, the study protocol was to measure HTLs at visits 1 and 4 only. However, due to the relatively short test time to obtain a pure-tone audiogram, the benefit of having a standard measure of hearing and the relatively high participation attrition rate, it was decided part way through the study that a pure-tone audiogram would be obtained at every visit. For the majority of participants, PTA was performed in a quiet room on the company site. Occasionally, PTA was performed in an on-site soundproof booth if this was available. A small sub-set of participants was tested at the research centres, and then PTA was performed in a soundproof booth meeting the requirements of BS EN ISO 8253-1 [9]. Spectacles and head ornaments (e.g. ear-rings) were removed. Air-conduction thresholds were obtained at 0.5, 1, 2, 3, 4, 6 and 8 kHz and bone conduction thresholds were obtained at 0.5, 1 and 2 kHz. A retest at 1 kHz for air-conduction was obtained to ensure good test-retest reliability. Pure-tone thresholds were obtained using the method described in BS EN ISO 8253-1. It was emphasised that participants must respond even to very quiet sounds. The ear reported to be the better hearing ear was tested first. If the participant reported hearing in both ears as the same, then the left ear was tested first. The bone vibrator was placed on the mastoid prominence of the ear that was worse by air-conduction.
Standard daily and weekly Stage A checks of the audiometers were performed according to the British Society of Audiology recommended procedure [4]. Stage B checks, measuring output levels and frequency of pure tones for both air and bone conduction measurements, were performed objectively using a sound level meter (Brüel and Kjaer type 2260), approximately every six weeks [4]. Air conduction output levels were measured using an artificial ear (Brüel and Kjaer type 4153) with a ½ -inch microphone (Brüel and Kjaer type 4192) and bone conduction vibratory levels were measured using a mechanical coupler (Brüel and Kjaer type 4 Medical School Ethics Committee at Nottingham; School of Psychological Sciences Research Ethics Committee at Manchester; Institute of Sound and Vibration Research Human Experimentation Safety and Ethics Committee at Southampton.
20
4930). If output levels differed by more than 1 dB from the expected value according to BS EN ISO 389-1 [6] for air-conduction, or BS EN ISO 389-3 [7] for bone-conduction, the level was adjusted to be within 0.5 dB of the expected value. Extended stage B checks including measurement of rise-fall times were carried out on an annual basis according to BS EN 60645-1 [5].
3.2.2 Otoscopy Otoscopy was performed to check that there was no debris or wax in the ear canal nor ear infections that may affect the hearing threshold levels or otoacoustic emissions. Prior to the middle ear function tests, an otoscopic examination was made of the ear canal and tympanic membrane. The status of the ear canal was recorded as clear, partially obstructed or completely obstructed. In the event that wax was fully occluding the ear canal the participant was advised to see their GP for wax removal and testing was deferred until after the wax was removed. The tympanic membrane was classified as either normal (i.e. no obvious abnormalities) or abnormal (e.g. tympanosclerosis or tympanic membrane perforation).
3.2.3 Middle ear function tests Middle ear function tests were performed to establish whether there was any middle ear disorder that might affect hearing threshold levels or otoacoustic emissions. Middle ear disorder is usually intermittent and therefore it was necessary to document middle ear status at every test session. Middle ear function tests comprised tympanometry and acoustic reflex thresholds, which were measured using a Danplex Handtymp 3000. A tympanogram was recorded from +200 daPa to −200 daPa. Middle ear pressure was recorded to the nearest 5 daPa and middle ear compliance to the nearest 0.1 ml. The tympanogram shape was recorded as either as normal (type A), flat (type B) or other abnormal shape (e.g. double-peaked). Acoustic reflex thresholds were measured at 0.5, 1, 2 and 4 kHz when the ear-canal pressure was at atmospheric pressure (0 daPa).
3.2.4 Transient evoked otoacoustic emissions Transient evoked otoacoustic emissions (TEOAE) were obtained using the Maximum Length Sequence (MLS) hardware and software developed by the Medical Research Council’s Institute of Hearing Research (IHR). An Otodynamics adult SGS probe was used to deliver broadband click stimuli and to record the TEOAEs. The probe was coupled to the ear canal with Otodynamics ear tips (e.g. T11M). TEOAEs were obtained in a linear mode at click opportunity rates of 50, 1000 and 5000 clicks per second and at click intensity levels of 50, 60 and 70 dB pe SPL. The recording window was 5-17 ms. A 5-ms post-stimulus pause minimised the effects of stimulus artefacts, such as ringing. Each TEOAE waveform was based on the average of 1300 responses to clicks for the 50/s click rate, 12288 responses for the 1000/s click opportunity rate5 and 61440 responses for the 5000/s click opportunity rate. This resulted in a 25-30 second recording time for each trace. Responses that exceeded the rejection template (6000 µPa for the 50/s click rate and 500 µPa for the 1000/s and 5000/s click rates) were rejected, as these were deemed to be contaminated by noise. The order of the click rate presentations was 50/s, 1000/s then 5000/s, and at each click rate the intensity levels were presented in the order of 70, 60 then 50 dB pe SPL. Two replicate averages were obtained for each stimulus set, resulting in 36 waveforms per participant (2 ears × 2 replications × 3 rates × 3 levels). TEOAEs were recorded in a quiet room. The left ear was always tested first. During testing, the participant was asked to sit as quietly and as still as possible, in order to minimise noise levels.
The click and microphone sensitivity levels were checked at six-weekly intervals. The TEOAE probe was inserted into a hard-walled cavity with a volume of 1 ml; click and microphone levels measured using bespoke software created by IHR. At approximately 3-4 month intervals, the
5 The click opportunity rate is approximately twice the average click rate (see Scientific Background)
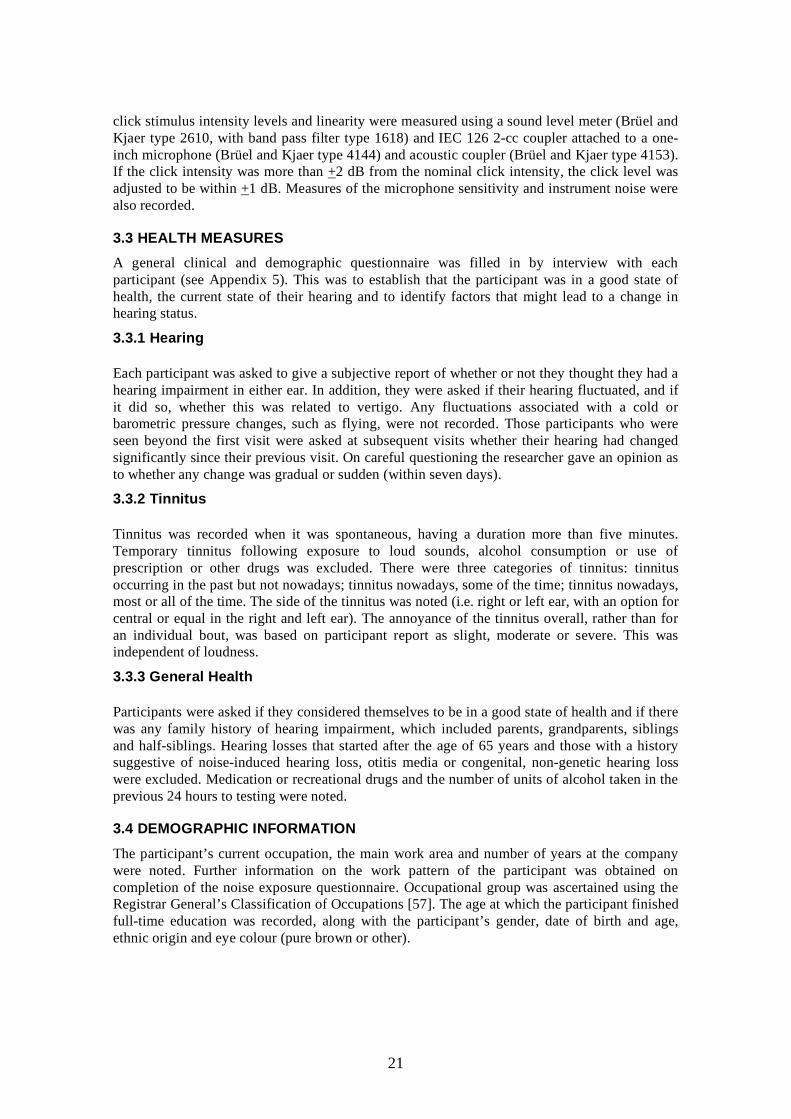
21
click stimulus intensity levels and linearity were measured using a sound level meter (Brüel and Kjaer type 2610, with band pass filter type 1618) and IEC 126 2-cc coupler attached to a one-inch microphone (Brüel and Kjaer type 4144) and acoustic coupler (Brüel and Kjaer type 4153). If the click intensity was more than +2 dB from the nominal click intensity, the click level was adjusted to be within +1 dB. Measures of the microphone sensitivity and instrument noise were also recorded.
3.3 HEALTH MEASURES A general clinical and demographic questionnaire was filled in by interview with each participant (see Appendix 5). This was to establish that the participant was in a good state of health, the current state of their hearing and to identify factors that might lead to a change in hearing status.
3.3.1 Hearing Each participant was asked to give a subjective report of whether or not they thought they had a hearing impairment in either ear. In addition, they were asked if their hearing fluctuated, and if it did so, whether this was related to vertigo. Any fluctuations associated with a cold or barometric pressure changes, such as flying, were not recorded. Those participants who were seen beyond the first visit were asked at subsequent visits whether their hearing had changed significantly since their previous visit. On careful questioning the researcher gave an opinion as to whether any change was gradual or sudden (within seven days).
3.3.2 Tinnitus Tinnitus was recorded when it was spontaneous, having a duration more than five minutes. Temporary tinnitus following exposure to loud sounds, alcohol consumption or use of prescription or other drugs was excluded. There were three categories of tinnitus: tinnitus occurring in the past but not nowadays; tinnitus nowadays, some of the time; tinnitus nowadays, most or all of the time. The side of the tinnitus was noted (i.e. right or left ear, with an option for central or equal in the right and left ear). The annoyance of the tinnitus overall, rather than for an individual bout, was based on participant report as slight, moderate or severe. This was independent of loudness.
3.3.3 General Health Participants were asked if they considered themselves to be in a good state of health and if there was any family history of hearing impairment, which included parents, grandparents, siblings and half-siblings. Hearing losses that started after the age of 65 years and those with a history suggestive of noise-induced hearing loss, otitis media or congenital, non-genetic hearing loss were excluded. Medication or recreational drugs and the number of units of alcohol taken in the previous 24 hours to testing were noted.
3.4 DEMOGRAPHIC INFORMATION The participant’s current occupation, the main work area and number of years at the company were noted. Further information on the work pattern of the participant was obtained on completion of the noise exposure questionnaire. Occupational group was ascertained using the Registrar General’s Classification of Occupations [57]. The age at which the participant finished full-time education was recorded, along with the participant’s gender, date of birth and age, ethnic origin and eye colour (pure brown or other).

22
3.5 PATIENT MANAGEMENT The results of the pure-tone audiogram were explained to the participant in conjunction with the middle ear tests. If hearing impairment was revealed, participants were referred to their GP for further management such as a full hearing assessment at the local Audiology department or removal of wax. If there was any temporary threshold shift or temporary tinnitus as a result of social noise exposure, participants were advised that they might be damaging their hearing. They were advised to not stand near speakers at concerts, nightclubs or “raves” and to attend less regularly, to turn down the volume levels when listening to “iPods” or personal stereos.
3.6 NOISE EXPOSURE HISTORY ASSESSMENT The purpose of this assessment was to estimate the cumulative noise exposure during the whole of the participant’s lifetime up to the time that they entered the study, and then to ascertain the amount of noise they were exposed to between visits. Noise levels for occupational (past and present) and social noise exposure were estimated using reported vocal effort to communicate with another person when (i) both were 1.2 m apart and facing each other, (ii) neither were wearing hearing protection, (iii) neither had a hearing impairment and (iv) normal gesturing was used (see Table 4; [67]). To obtain an estimate of the cumulative noise exposure a noise questionnaire (see Appendix 6) was completed by interview.
3.6.1 Occupational noise Occupational noise exposure was categorised as either current (the study workplace) or past (previous workplaces). Each job was broken down into individual tasks. For each individual task where the noise levels were estimated to be greater than 80 dB(A), the following information was obtained.
a) estimated noise level using the speech communication table (see above) b) total duration (years, weeks, days and hours) c) type of hearing protection worn; nominal attenuation values were attributed to the type
of hearing protection worn (see Table 5) d) percentage of time the hearing protection was worn e) after-effects affecting hearing and tinnitus, in which ears, and whether these were
permanent or temporary
The above information was the used to estimate the noise exposure for each task using the following equation, which is based on the equal energy principle.
U = 10(L-A-90)/10 × Y× W× D× H / 2080
Where U = units of cumulative noise exposure L = estimated noise level in dB(A) A = hearing protection attenuation in dB Y = years of exposure W = weeks per year of exposure D = days per week of exposure H = hours per day of exposure
This resulted in units of noise exposure, which are then used to derive a Noise Immission Rating6 (NIR) (Table 6).
6 The NIR values are equivalent to continuous exposures 8 H/D, 5 D/W, 48 W/Y at the following levels throughout a full 50-year working lifetime. NIR = 0 is equivalent to continuous noise not exceeding 80 dB(A), NIR = 1 to 81-90 dB(A), NIR = 2 to 91-100 dB(A), NIR = 3 to 101-110 dB(A), NIR = 4 to over 110 dB(A).
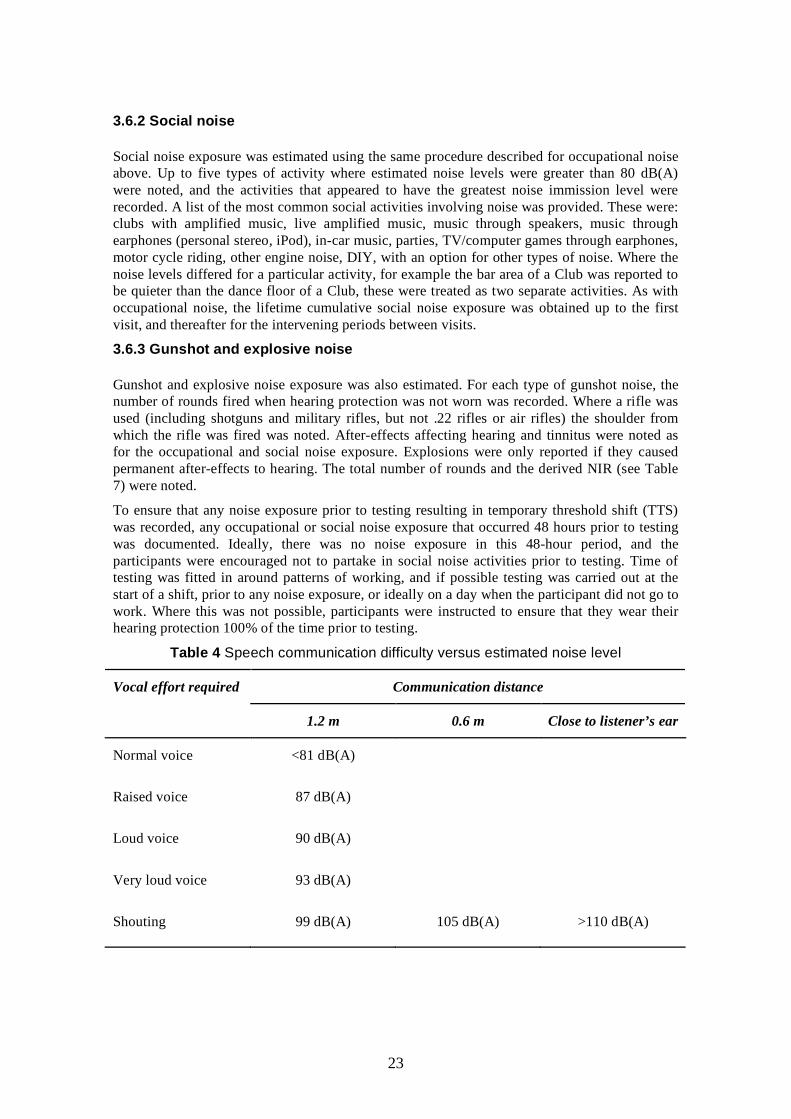
23
3.6.2 Social noise Social noise exposure was estimated using the same procedure described for occupational noise above. Up to five types of activity where estimated noise levels were greater than 80 dB(A) were noted, and the activities that appeared to have the greatest noise immission level were recorded. A list of the most common social activities involving noise was provided. These were: clubs with amplified music, live amplified music, music through speakers, music through earphones (personal stereo, iPod), in-car music, parties, TV/computer games through earphones, motor cycle riding, other engine noise, DIY, with an option for other types of noise. Where the noise levels differed for a particular activity, for example the bar area of a Club was reported to be quieter than the dance floor of a Club, these were treated as two separate activities. As with occupational noise, the lifetime cumulative social noise exposure was obtained up to the first visit, and thereafter for the intervening periods between visits.
3.6.3 Gunshot and explosive noise Gunshot and explosive noise exposure was also estimated. For each type of gunshot noise, the number of rounds fired when hearing protection was not worn was recorded. Where a rifle was used (including shotguns and military rifles, but not .22 rifles or air rifles) the shoulder from which the rifle was fired was noted. After-effects affecting hearing and tinnitus were noted as for the occupational and social noise exposure. Explosions were only reported if they caused permanent after-effects to hearing. The total number of rounds and the derived NIR (see Table 7) were noted.
To ensure that any noise exposure prior to testing resulting in temporary threshold shift (TTS) was recorded, any occupational or social noise exposure that occurred 48 hours prior to testing was documented. Ideally, there was no noise exposure in this 48-hour period, and the participants were encouraged not to partake in social noise activities prior to testing. Time of testing was fitted in around patterns of working, and if possible testing was carried out at the start of a shift, prior to any noise exposure, or ideally on a day when the participant did not go to work. Where this was not possible, participants were instructed to ensure that they wear their hearing protection 100% of the time prior to testing.
Table 4 Speech communication difficulty versus estimated noise level
Communication distance Vocal effort required
1.2 m 0.6 m Close to listener’s ear
Normal voice <81 dB(A)
Raised voice 87 dB(A)
Loud voice 90 dB(A)
Very loud voice 93 dB(A)
Shouting 99 dB(A) 105 dB(A) >110 dB(A)
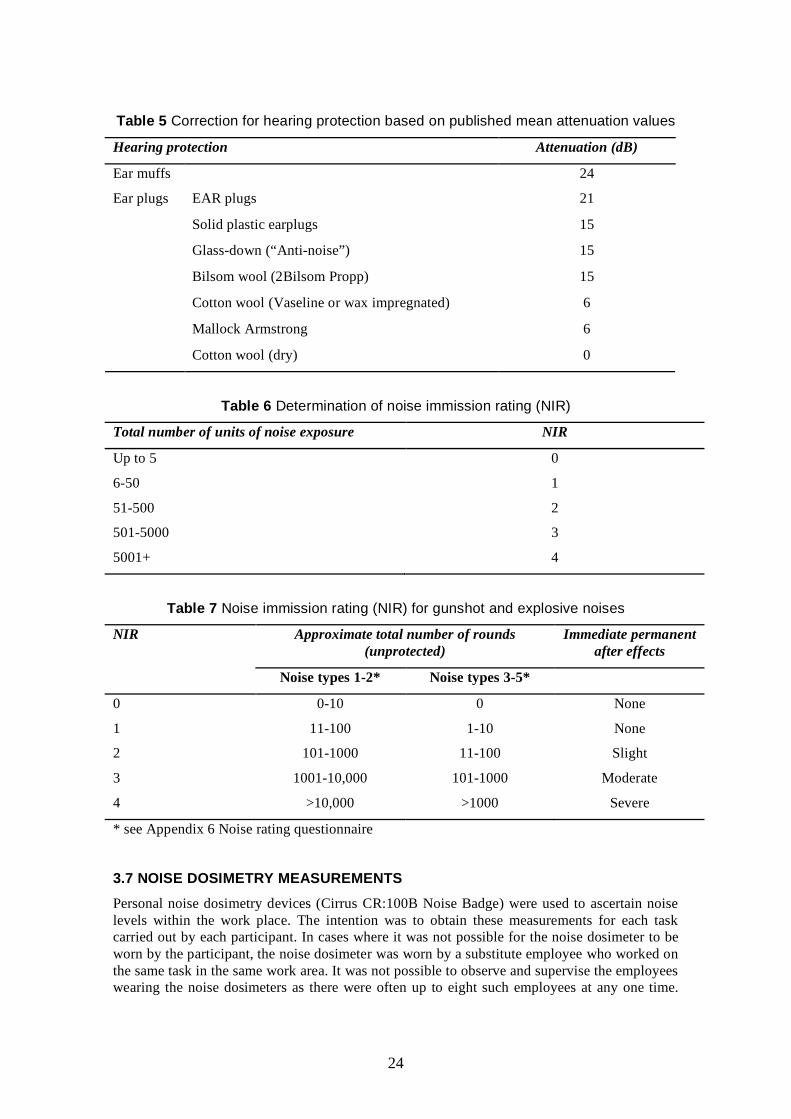
24
Table 5 Correction for hearing protection based on published mean attenuation values
Hearing protection Attenuation (dB)
Ear muffs 24
EAR plugs 21
Solid plastic earplugs 15
Glass-down (“Anti-noise”) 15
Bilsom wool (2Bilsom Propp) 15
Cotton wool (Vaseline or wax impregnated) 6
Mallock Armstrong 6
Ear plugs
Cotton wool (dry) 0
Table 6 Determination of noise immission rating (NIR)
Total number of units of noise exposure NIR
Up to 5 0
6-50 1
51-500 2
501-5000 3
5001+ 4
Table 7 Noise immission rating (NIR) for gunshot and explosive noises
NIR Approximate total number of rounds (unprotected)
Immediate permanent after effects
Noise types 1-2* Noise types 3-5*
0 0-10 0 None
1 11-100 1-10 None
2 101-1000 11-100 Slight
3 1001-10,000 101-1000 Moderate
4 >10,000 >1000 Severe
* see Appendix 6 Noise rating questionnaire
3.7 NOISE DOSIMETRY MEASUREMENTS Personal noise dosimetry devices (Cirrus CR:100B Noise Badge) were used to ascertain noise levels within the work place. The intention was to obtain these measurements for each task carried out by each participant. In cases where it was not possible for the noise dosimeter to be worn by the participant, the noise dosimeter was worn by a substitute employee who worked on the same task in the same work area. It was not possible to observe and supervise the employees wearing the noise dosimeters as there were often up to eight such employees at any one time.
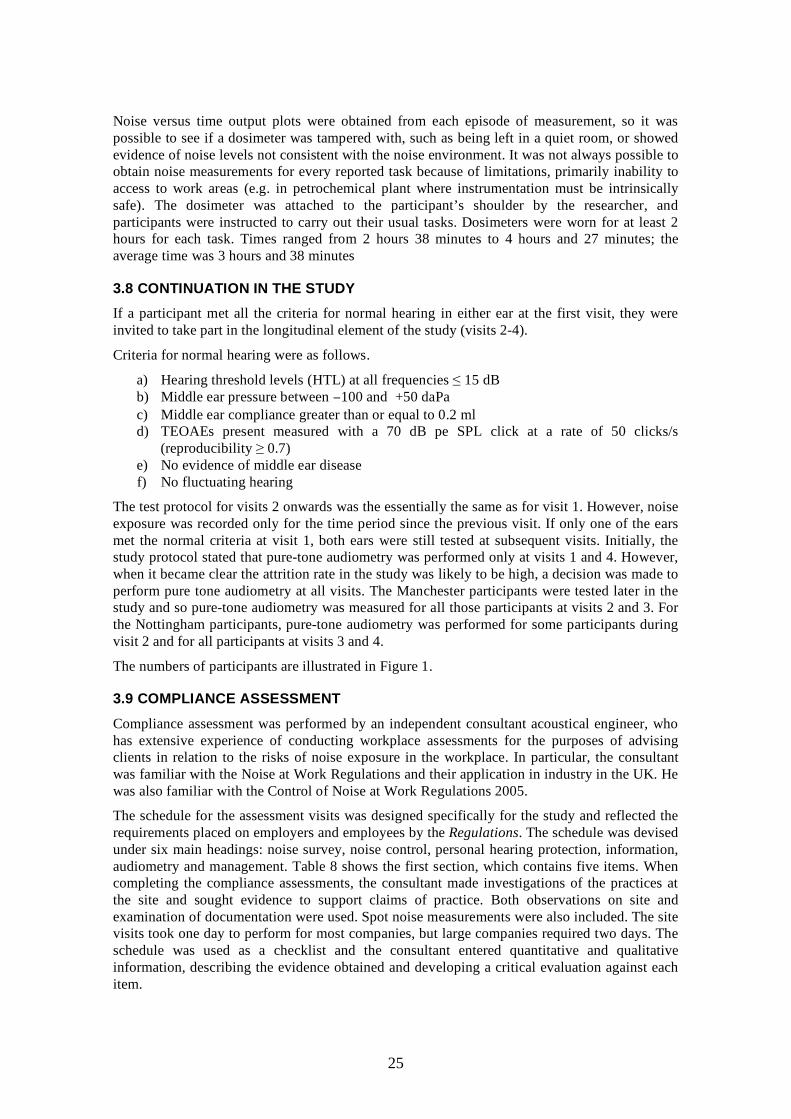
25
Noise versus time output plots were obtained from each episode of measurement, so it was possible to see if a dosimeter was tampered with, such as being left in a quiet room, or showed evidence of noise levels not consistent with the noise environment. It was not always possible to obtain noise measurements for every reported task because of limitations, primarily inability to access to work areas (e.g. in petrochemical plant where instrumentation must be intrinsically safe). The dosimeter was attached to the participant’s shoulder by the researcher, and participants were instructed to carry out their usual tasks. Dosimeters were worn for at least 2 hours for each task. Times ranged from 2 hours 38 minutes to 4 hours and 27 minutes; the average time was 3 hours and 38 minutes
3.8 CONTINUATION IN THE STUDY If a participant met all the criteria for normal hearing in either ear at the first visit, they were invited to take part in the longitudinal element of the study (visits 2-4).
Criteria for normal hearing were as follows.
a) Hearing threshold levels (HTL) at all frequencies ≤ 15 dB b) Middle ear pressure between −100 and +50 daPa c) Middle ear compliance greater than or equal to 0.2 ml d) TEOAEs present measured with a 70 dB pe SPL click at a rate of 50 clicks/s
(reproducibility ≥ 0.7) e) No evidence of middle ear disease f) No fluctuating hearing
The test protocol for visits 2 onwards was the essentially the same as for visit 1. However, noise exposure was recorded only for the time period since the previous visit. If only one of the ears met the normal criteria at visit 1, both ears were still tested at subsequent visits. Initially, the study protocol stated that pure-tone audiometry was performed only at visits 1 and 4. However, when it became clear the attrition rate in the study was likely to be high, a decision was made to perform pure tone audiometry at all visits. The Manchester participants were tested later in the study and so pure-tone audiometry was measured for all those participants at visits 2 and 3. For the Nottingham participants, pure-tone audiometry was performed for some participants during visit 2 and for all participants at visits 3 and 4.
The numbers of participants are illustrated in Figure 1.
3.9 COMPLIANCE ASSESSMENT Compliance assessment was performed by an independent consultant acoustical engineer, who has extensive experience of conducting workplace assessments for the purposes of advising clients in relation to the risks of noise exposure in the workplace. In particular, the consultant was familiar with the Noise at Work Regulations and their application in industry in the UK. He was also familiar with the Control of Noise at Work Regulations 2005.
The schedule for the assessment visits was designed specifically for the study and reflected the requirements placed on employers and employees by the Regulations. The schedule was devised under six main headings: noise survey, noise control, personal hearing protection, information, audiometry and management. Table 8 shows the first section, which contains five items. When completing the compliance assessments, the consultant made investigations of the practices at the site and sought evidence to support claims of practice. Both observations on site and examination of documentation were used. Spot noise measurements were also included. The site visits took one day to perform for most companies, but large companies required two days. The schedule was used as a checklist and the consultant entered quantitative and qualitative information, describing the evidence obtained and developing a critical evaluation against each item.
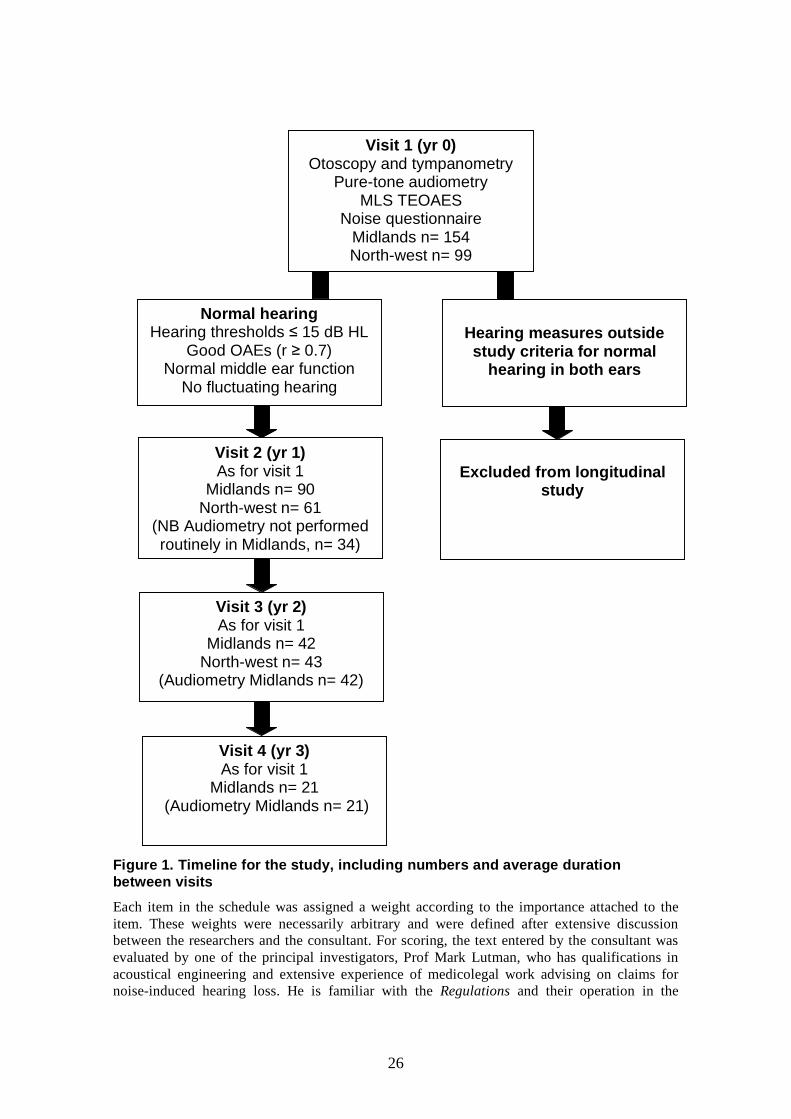
26
Figure 1. Timeline for the study, including numbers and average duration between visits Each item in the schedule was assigned a weight according to the importance attached to the item. These weights were necessarily arbitrary and were defined after extensive discussion between the researchers and the consultant. For scoring, the text entered by the consultant was evaluated by one of the principal investigators, Prof Mark Lutman, who has qualifications in acoustical engineering and extensive experience of medicolegal work advising on claims for noise-induced hearing loss. He is familiar with the Regulations and their operation in the
Visit 1 (yr 0) Otoscopy and tympanometry
Pure-tone audiometry MLS TEOAES
Noise questionnaire Midlands n= 154 North-west n= 99
Normal hearing Hearing thresholds ≤ 15 dB HL
Good OAEs (r ≥ 0.7) Normal middle ear function
No fluctuating hearing
Hearing measures outside study criteria for normal
hearing in both ears
Visit 2 (yr 1) As for visit 1
Midlands n= 90 North-west n= 61
(NB Audiometry not performed routinely in Midlands, n= 34)
Excluded from longitudinal
study
Visit 3 (yr 2) As for visit 1
Midlands n= 42 North-west n= 43
(Audiometry Midlands n= 42)
Visit 4 (yr 3) As for visit 1
Midlands n= 21 (Audiometry Midlands n= 21)
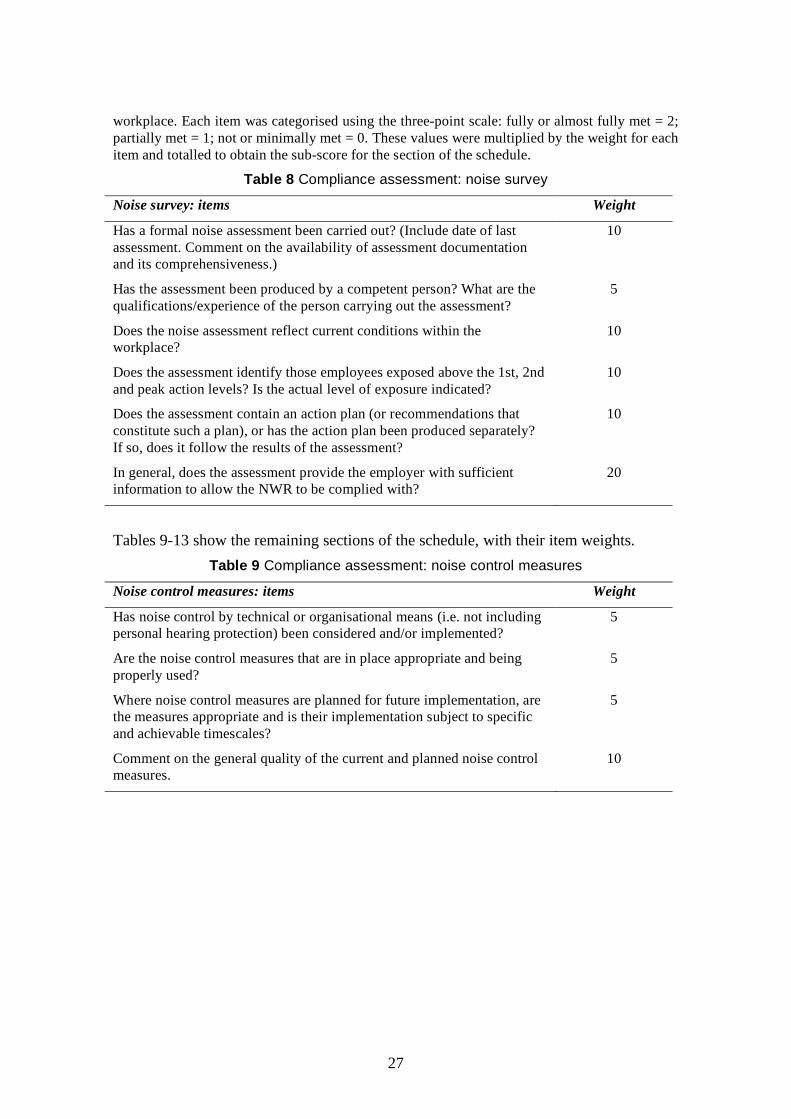
27
workplace. Each item was categorised using the three-point scale: fully or almost fully met = 2; partially met = 1; not or minimally met = 0. These values were multiplied by the weight for each item and totalled to obtain the sub-score for the section of the schedule.
Table 8 Compliance assessment: noise survey
Noise survey: items Weight
Has a formal noise assessment been carried out? (Include date of last assessment. Comment on the availability of assessment documentation and its comprehensiveness.)
10
Has the assessment been produced by a competent person? What are the qualifications/experience of the person carrying out the assessment?
5
Does the noise assessment reflect current conditions within the workplace?
10
Does the assessment identify those employees exposed above the 1st, 2nd and peak action levels? Is the actual level of exposure indicated?
10
Does the assessment contain an action plan (or recommendations that constitute such a plan), or has the action plan been produced separately? If so, does it follow the results of the assessment?
10
In general, does the assessment provide the employer with sufficient information to allow the NWR to be complied with?
20
Tables 9-13 show the remaining sections of the schedule, with their item weights. Table 9 Compliance assessment: noise control measures
Noise control measures: items Weight
Has noise control by technical or organisational means (i.e. not including personal hearing protection) been considered and/or implemented?
5
Are the noise control measures that are in place appropriate and being properly used?
5
Where noise control measures are planned for future implementation, are the measures appropriate and is their implementation subject to specific and achievable timescales?
5
Comment on the general quality of the current and planned noise control measures.
10
28
Table 10 Compliance assessment: personal hearing protection
Noise control measures: items Weight
Are Ear Protection Zones properly identified and delineated by means of appropriate signs? Do the EPZs conform to the recommendations of the assessment?
10
Is hearing protection made available to employees exposed to between 1st and 2nd action levels?
20
Is hearing protection supplied to all employees exposed at or above the 2nd and peak action levels?
20
Do employees have ready access to hearing protection, e.g. for disposable types or replacement of reusable types?
10
Has the hearing protection supplied been selected for suitability, including its performance against the specific characteristics of the noises?
5
Are employees given a choice of hearing protectors to suit their personal preference?
5
Is specific training on the full and proper use of hearing protection provided to appropriate employees?
10
Is there a system of monitoring of hearing protection usage where its use is mandatory?
10
Are all employees working in or passing through EPZ observed to be wearing hearing protection? Are they using hearing protection correctly?
10
Comment on the overall quality of the hearing conservation programme in relation to personal hearing protection.
20
Table 11 Compliance assessment: information, instruction and training
Noise control measures: items Weight
Have employees been provided with information, instruction and training on noise? Is there evidence for this?
10
Is the information, instruction and training appropriate to the levels of exposure and to allow the employees to carry out their duties under the NWR and to protect themselves?
10
Is the training programme well documented including logs of attendance? Have appropriate individuals attended for training?
5
Do the employees demonstrate understanding of the matters on which they have been trained?
5
Comment on overall quality and comprehensiveness of information, instruction and training.
10
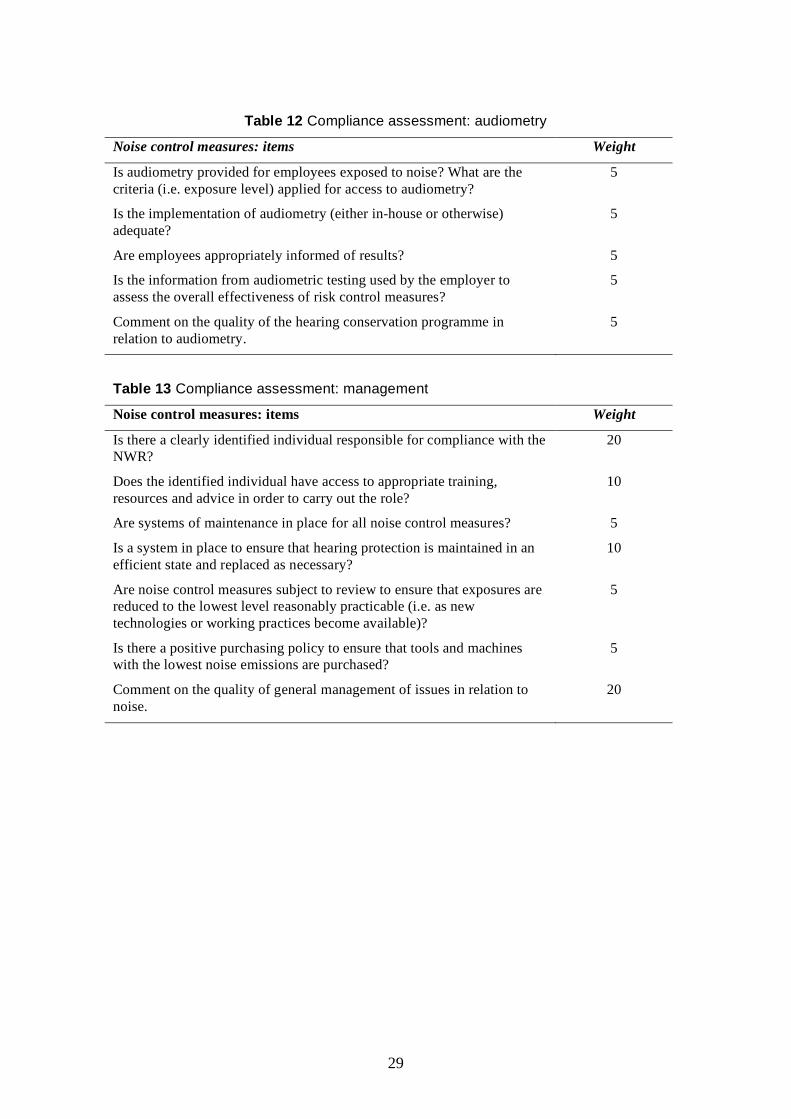
29
Table 12 Compliance assessment: audiometry
Noise control measures: items Weight
Is audiometry provided for employees exposed to noise? What are the criteria (i.e. exposure level) applied for access to audiometry?
5
Is the implementation of audiometry (either in-house or otherwise) adequate?
5
Are employees appropriately informed of results? 5
Is the information from audiometric testing used by the employer to assess the overall effectiveness of risk control measures?
5
Comment on the quality of the hearing conservation programme in relation to audiometry.
5
Table 13 Compliance assessment: management
Noise control measures: items Weight
Is there a clearly identified individual responsible for compliance with the NWR?
20
Does the identified individual have access to appropriate training, resources and advice in order to carry out the role?
10
Are systems of maintenance in place for all noise control measures? 5
Is a system in place to ensure that hearing protection is maintained in an efficient state and replaced as necessary?
10
Are noise control measures subject to review to ensure that exposures are reduced to the lowest level reasonably practicable (i.e. as new technologies or working practices become available)?
5
Is there a positive purchasing policy to ensure that tools and machines with the lowest noise emissions are purchased?
5
Comment on the quality of general management of issues in relation to noise.
20

30
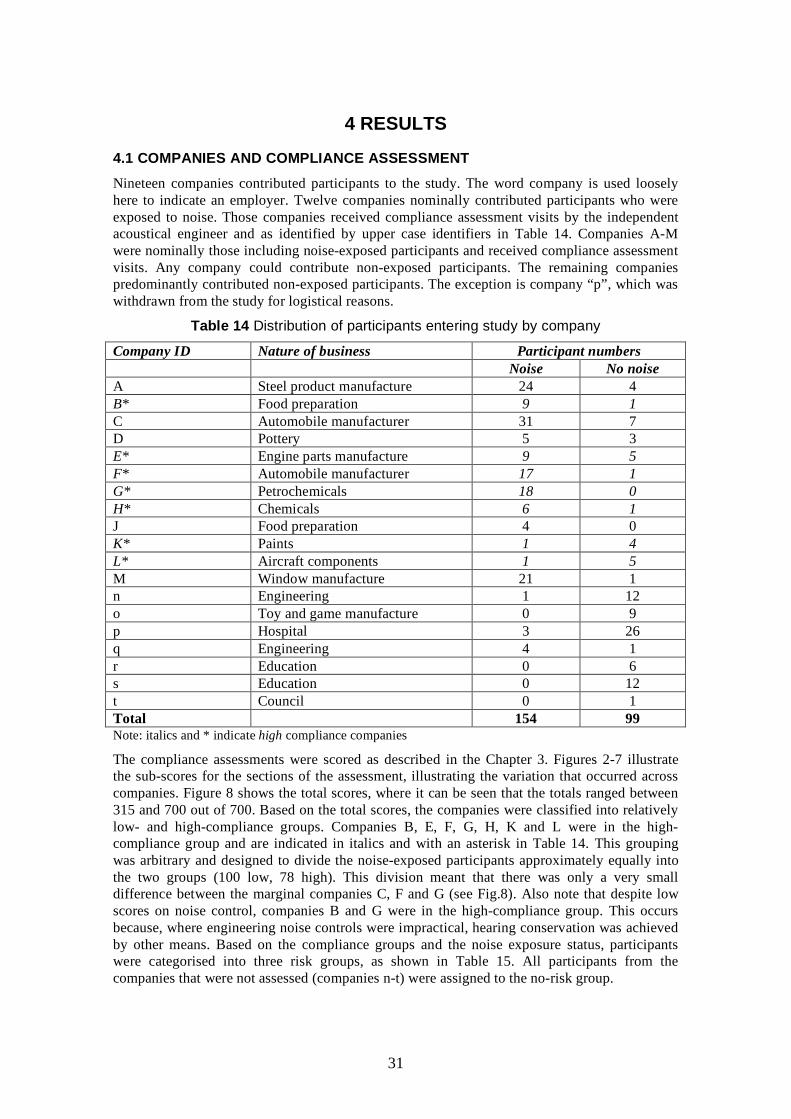
31
4 RESULTS
4.1 COMPANIES AND COMPLIANCE ASSESSMENT Nineteen companies contributed participants to the study. The word company is used loosely here to indicate an employer. Twelve companies nominally contributed participants who were exposed to noise. Those companies received compliance assessment visits by the independent acoustical engineer and as identified by upper case identifiers in Table 14. Companies A-M were nominally those including noise-exposed participants and received compliance assessment visits. Any company could contribute non-exposed participants. The remaining companies predominantly contributed non-exposed participants. The exception is company “p”, which was withdrawn from the study for logistical reasons.
Table 14 Distribution of participants entering study by company
Company ID Nature of business Participant numbers Noise No noise A Steel product manufacture 24 4 B* Food preparation 9 1 C Automobile manufacturer 31 7 D Pottery 5 3 E* Engine parts manufacture 9 5 F* Automobile manufacturer 17 1 G* Petrochemicals 18 0 H* Chemicals 6 1 J Food preparation 4 0 K* Paints 1 4 L* Aircraft components 1 5 M Window manufacture 21 1 n Engineering 1 12 o Toy and game manufacture 0 9 p Hospital 3 26 q Engineering 4 1 r Education 0 6 s Education 0 12 t Council 0 1 Total 154 99 Note: italics and * indicate high compliance companies
The compliance assessments were scored as described in the Chapter 3. Figures 2-7 illustrate the sub-scores for the sections of the assessment, illustrating the variation that occurred across companies. Figure 8 shows the total scores, where it can be seen that the totals ranged between 315 and 700 out of 700. Based on the total scores, the companies were classified into relatively low- and high-compliance groups. Companies B, E, F, G, H, K and L were in the high-compliance group and are indicated in italics and with an asterisk in Table 14. This grouping was arbitrary and designed to divide the noise-exposed participants approximately equally into the two groups (100 low, 78 high). This division meant that there was only a very small difference between the marginal companies C, F and G (see Fig.8). Also note that despite low scores on noise control, companies B and G were in the high-compliance group. This occurs because, where engineering noise controls were impractical, hearing conservation was achieved by other means. Based on the compliance groups and the noise exposure status, participants were categorised into three risk groups, as shown in Table 15. All participants from the companies that were not assessed (companies n-t) were assigned to the no-risk group.
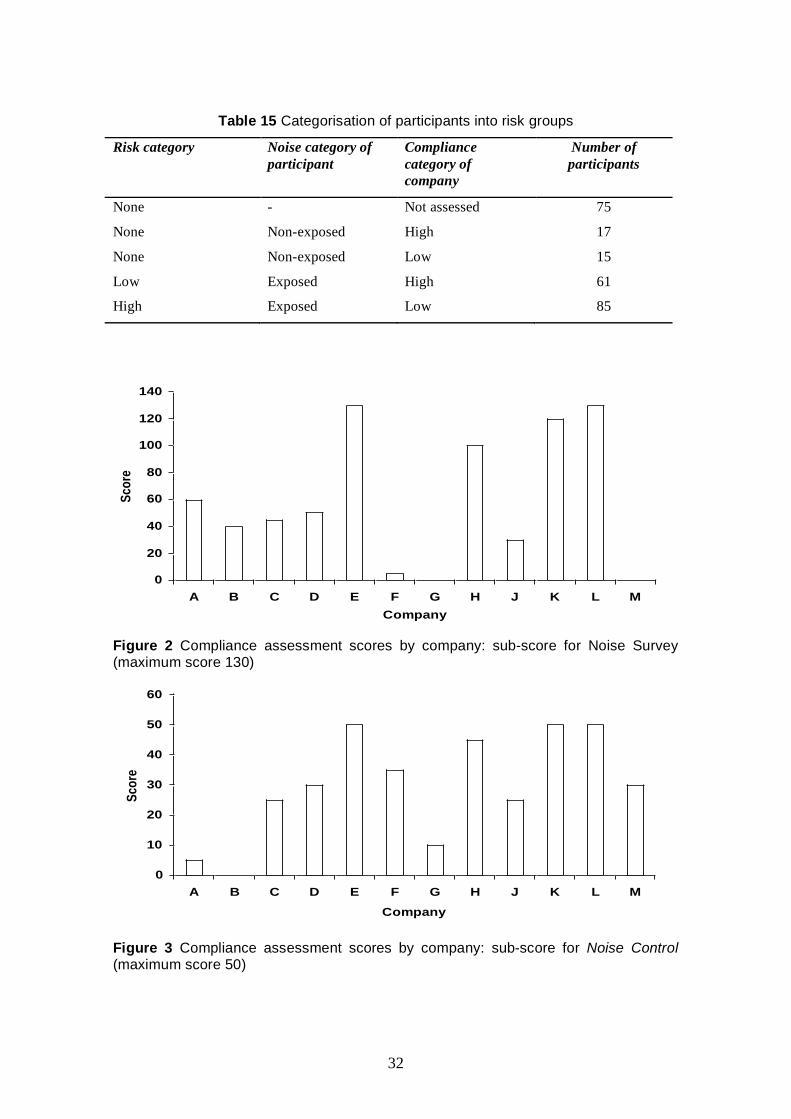
32
Table 15 Categorisation of participants into risk groups
Risk category Noise category of participant
Compliance category of company
Number of participants
None - Not assessed 75
None Non-exposed High 17
None Non-exposed Low 15
Low Exposed High 61
High Exposed Low 85
0
20
40
60
80
100
120
140
A B C D E F G H J K L MCompany
Scor
e
Figure 2 Compliance assessment scores by company: sub-score for Noise Survey (maximum score 130)
0
10
20
30
40
50
60
A B C D E F G H J K L M
Company
Scor
e
Figure 3 Compliance assessment scores by company: sub-score for Noise Control (maximum score 50)
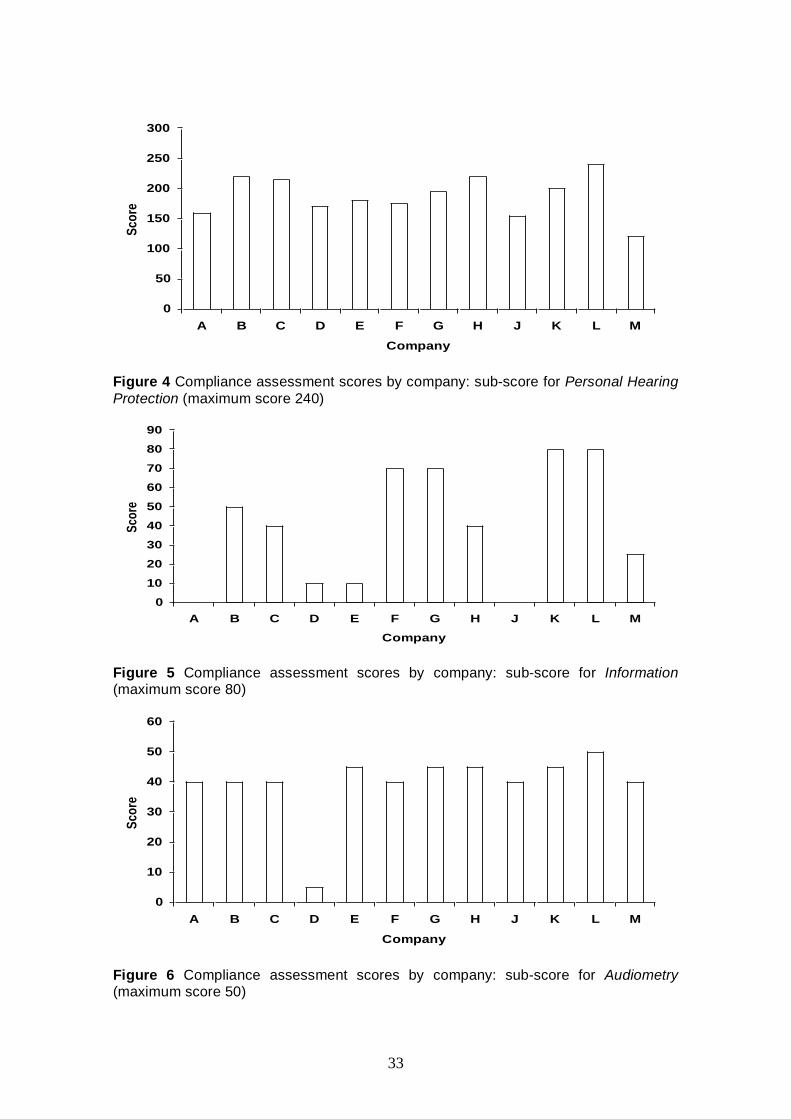
33
0
50
100
150
200
250
300
A B C D E F G H J K L M
Company
Scor
e
Figure 4 Compliance assessment scores by company: sub-score for Personal Hearing Protection (maximum score 240)
0
10
20
30
40
50
60
70
80
90
A B C D E F G H J K L M
Company
Scor
e
Figure 5 Compliance assessment scores by company: sub-score for Information (maximum score 80)
0
10
20
30
40
50
60
A B C D E F G H J K L M
Company
Scor
e
Figure 6 Compliance assessment scores by company: sub-score for Audiometry (maximum score 50)
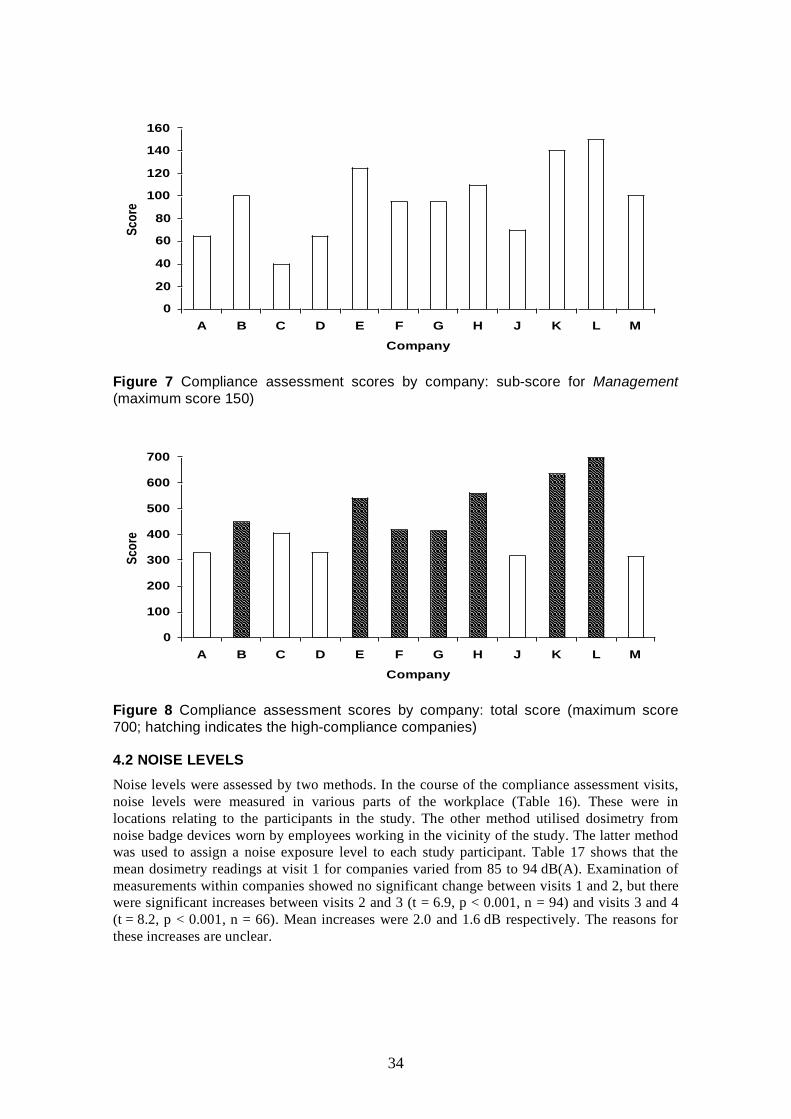
34
0
20
40
60
80
100
120
140
160
A B C D E F G H J K L M
Company
Scor
e
Figure 7 Compliance assessment scores by company: sub-score for Management (maximum score 150)
0
100
200
300
400
500
600
700
A B C D E F G H J K L M
Company
Scor
e
Figure 8 Compliance assessment scores by company: total score (maximum score 700; hatching indicates the high-compliance companies)
4.2 NOISE LEVELS Noise levels were assessed by two methods. In the course of the compliance assessment visits, noise levels were measured in various parts of the workplace (Table 16). These were in locations relating to the participants in the study. The other method utilised dosimetry from noise badge devices worn by employees working in the vicinity of the study. The latter method was used to assign a noise exposure level to each study participant. Table 17 shows that the mean dosimetry readings at visit 1 for companies varied from 85 to 94 dB(A). Examination of measurements within companies showed no significant change between visits 1 and 2, but there were significant increases between visits 2 and 3 (t = 6.9, p < 0.001, n = 94) and visits 3 and 4 (t = 8.2, p < 0.001, n = 66). Mean increases were 2.0 and 1.6 dB respectively. The reasons for these increases are unclear.
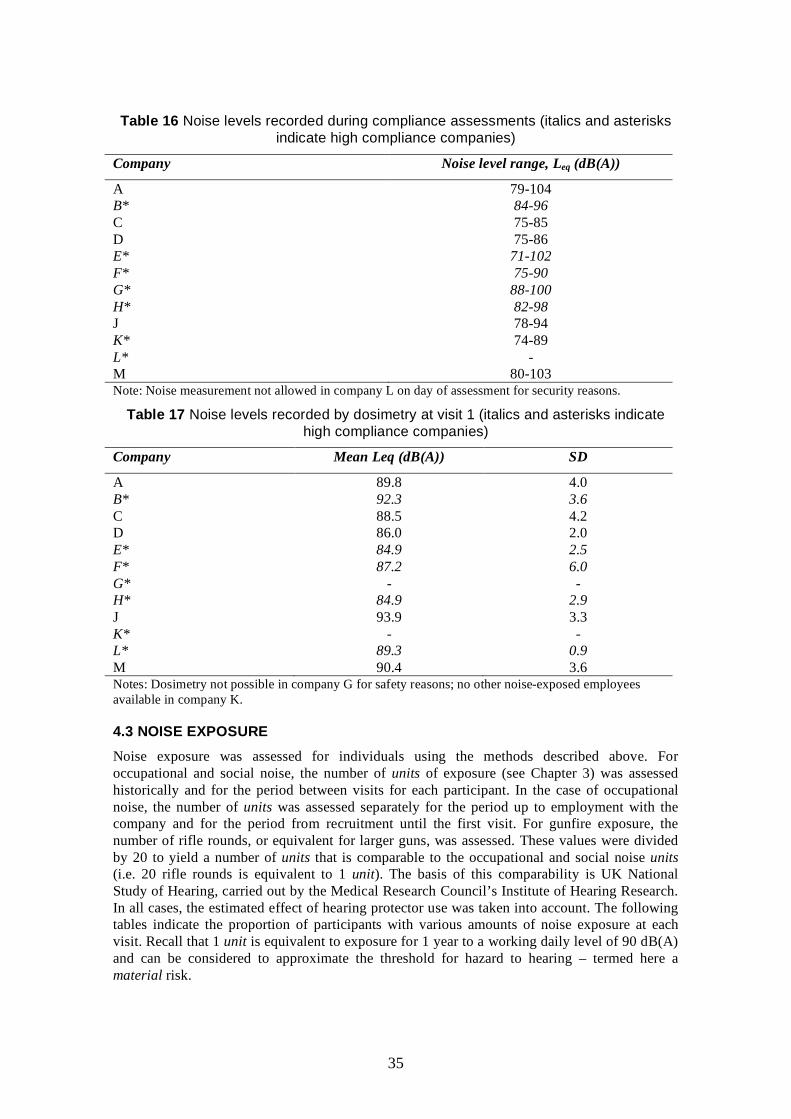
35
Table 16 Noise levels recorded during compliance assessments (italics and asterisks indicate high compliance companies)
Company Noise level range, Leq (dB(A))
A 79-104 B* 84-96 C 75-85 D 75-86 E* 71-102 F* 75-90 G* 88-100 H* 82-98 J 78-94 K* 74-89 L* - M 80-103 Note: Noise measurement not allowed in company L on day of assessment for security reasons.
Table 17 Noise levels recorded by dosimetry at visit 1 (italics and asterisks indicate high compliance companies)
Company Mean Leq (dB(A)) SD
A 89.8 4.0 B* 92.3 3.6 C 88.5 4.2 D 86.0 2.0 E* 84.9 2.5 F* 87.2 6.0 G* - - H* 84.9 2.9 J 93.9 3.3 K* - - L* 89.3 0.9 M 90.4 3.6 Notes: Dosimetry not possible in company G for safety reasons; no other noise-exposed employees available in company K.
4.3 NOISE EXPOSURE Noise exposure was assessed for individuals using the methods described above. For occupational and social noise, the number of units of exposure (see Chapter 3) was assessed historically and for the period between visits for each participant. In the case of occupational noise, the number of units was assessed separately for the period up to employment with the company and for the period from recruitment until the first visit. For gunfire exposure, the number of rifle rounds, or equivalent for larger guns, was assessed. These values were divided by 20 to yield a number of units that is comparable to the occupational and social noise units (i.e. 20 rifle rounds is equivalent to 1 unit). The basis of this comparability is UK National Study of Hearing, carried out by the Medical Research Council’s Institute of Hearing Research. In all cases, the estimated effect of hearing protector use was taken into account. The following tables indicate the proportion of participants with various amounts of noise exposure at each visit. Recall that 1 unit is equivalent to exposure for 1 year to a working daily level of 90 dB(A) and can be considered to approximate the threshold for hazard to hearing – termed here a material risk.
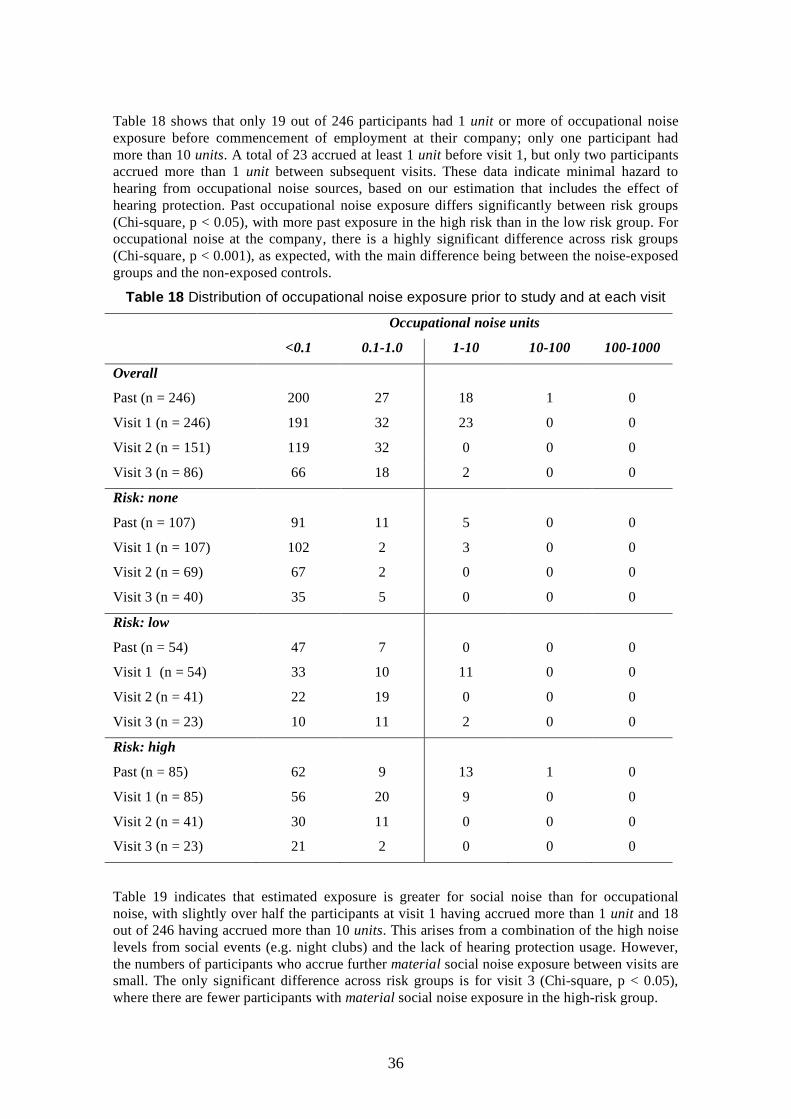
36
Table 18 shows that only 19 out of 246 participants had 1 unit or more of occupational noise exposure before commencement of employment at their company; only one participant had more than 10 units. A total of 23 accrued at least 1 unit before visit 1, but only two participants accrued more than 1 unit between subsequent visits. These data indicate minimal hazard to hearing from occupational noise sources, based on our estimation that includes the effect of hearing protection. Past occupational noise exposure differs significantly between risk groups (Chi-square, p < 0.05), with more past exposure in the high risk than in the low risk group. For occupational noise at the company, there is a highly significant difference across risk groups (Chi-square, p < 0.001), as expected, with the main difference being between the noise-exposed groups and the non-exposed controls.
Table 18 Distribution of occupational noise exposure prior to study and at each visit
Occupational noise units
<0.1 0.1-1.0 1-10 10-100 100-1000
Overall
Past (n = 246) 200 27 18 1 0
Visit 1 (n = 246) 191 32 23 0 0
Visit 2 (n = 151) 119 32 0 0 0
Visit 3 (n = 86) 66 18 2 0 0
Risk: none
Past (n = 107) 91 11 5 0 0
Visit 1 (n = 107) 102 2 3 0 0
Visit 2 (n = 69) 67 2 0 0 0
Visit 3 (n = 40) 35 5 0 0 0
Risk: low
Past (n = 54) 47 7 0 0 0
Visit 1 (n = 54) 33 10 11 0 0
Visit 2 (n = 41) 22 19 0 0 0
Visit 3 (n = 23) 10 11 2 0 0
Risk: high
Past (n = 85) 62 9 13 1 0
Visit 1 (n = 85) 56 20 9 0 0
Visit 2 (n = 41) 30 11 0 0 0
Visit 3 (n = 23) 21 2 0 0 0
Table 19 indicates that estimated exposure is greater for social noise than for occupational noise, with slightly over half the participants at visit 1 having accrued more than 1 unit and 18 out of 246 having accrued more than 10 units. This arises from a combination of the high noise levels from social events (e.g. night clubs) and the lack of hearing protection usage. However, the numbers of participants who accrue further material social noise exposure between visits are small. The only significant difference across risk groups is for visit 3 (Chi-square, p < 0.05), where there are fewer participants with material social noise exposure in the high-risk group.
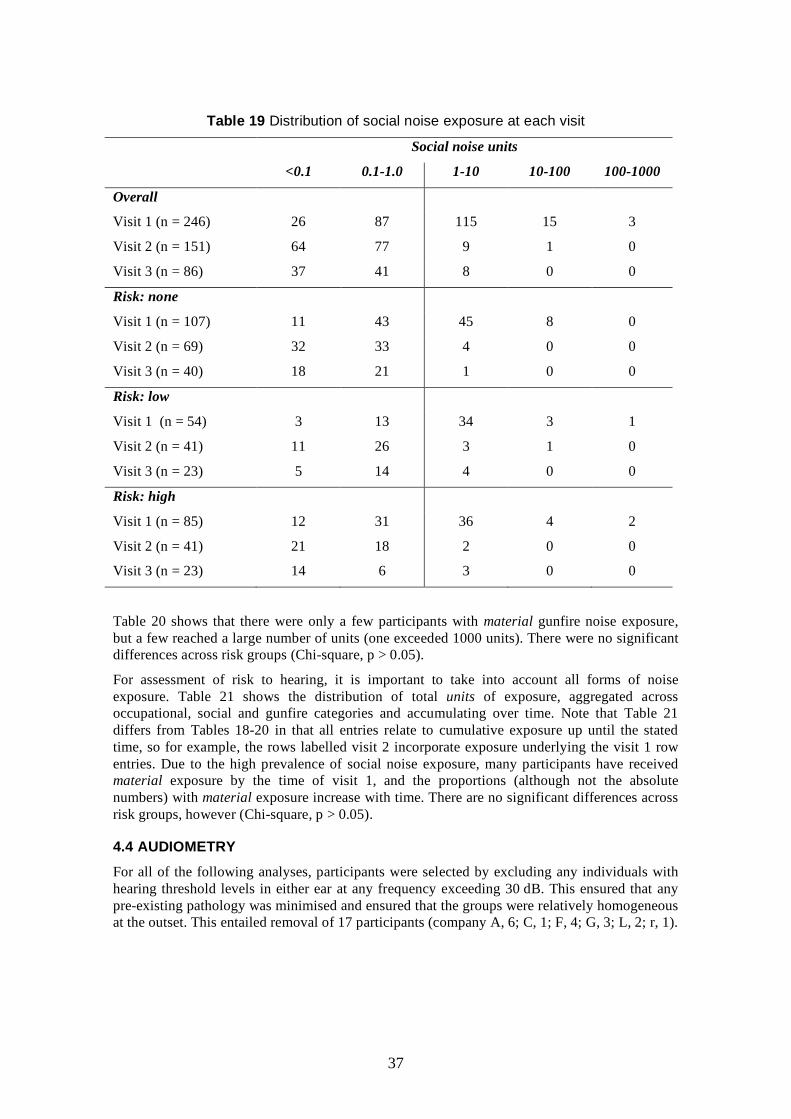
37
Table 19 Distribution of social noise exposure at each visit
Social noise units
<0.1 0.1-1.0 1-10 10-100 100-1000
Overall
Visit 1 (n = 246) 26 87 115 15 3
Visit 2 (n = 151) 64 77 9 1 0
Visit 3 (n = 86) 37 41 8 0 0
Risk: none
Visit 1 (n = 107) 11 43 45 8 0
Visit 2 (n = 69) 32 33 4 0 0
Visit 3 (n = 40) 18 21 1 0 0
Risk: low
Visit 1 (n = 54) 3 13 34 3 1
Visit 2 (n = 41) 11 26 3 1 0
Visit 3 (n = 23) 5 14 4 0 0
Risk: high
Visit 1 (n = 85) 12 31 36 4 2
Visit 2 (n = 41) 21 18 2 0 0
Visit 3 (n = 23) 14 6 3 0 0
Table 20 shows that there were only a few participants with material gunfire noise exposure, but a few reached a large number of units (one exceeded 1000 units). There were no significant differences across risk groups (Chi-square, p > 0.05).
For assessment of risk to hearing, it is important to take into account all forms of noise exposure. Table 21 shows the distribution of total units of exposure, aggregated across occupational, social and gunfire categories and accumulating over time. Note that Table 21 differs from Tables 18-20 in that all entries relate to cumulative exposure up until the stated time, so for example, the rows labelled visit 2 incorporate exposure underlying the visit 1 row entries. Due to the high prevalence of social noise exposure, many participants have received material exposure by the time of visit 1, and the proportions (although not the absolute numbers) with material exposure increase with time. There are no significant differences across risk groups, however (Chi-square, p > 0.05).
4.4 AUDIOMETRY For all of the following analyses, participants were selected by excluding any individuals with hearing threshold levels in either ear at any frequency exceeding 30 dB. This ensured that any pre-existing pathology was minimised and ensured that the groups were relatively homogeneous at the outset. This entailed removal of 17 participants (company A, 6; C, 1; F, 4; G, 3; L, 2; r, 1).
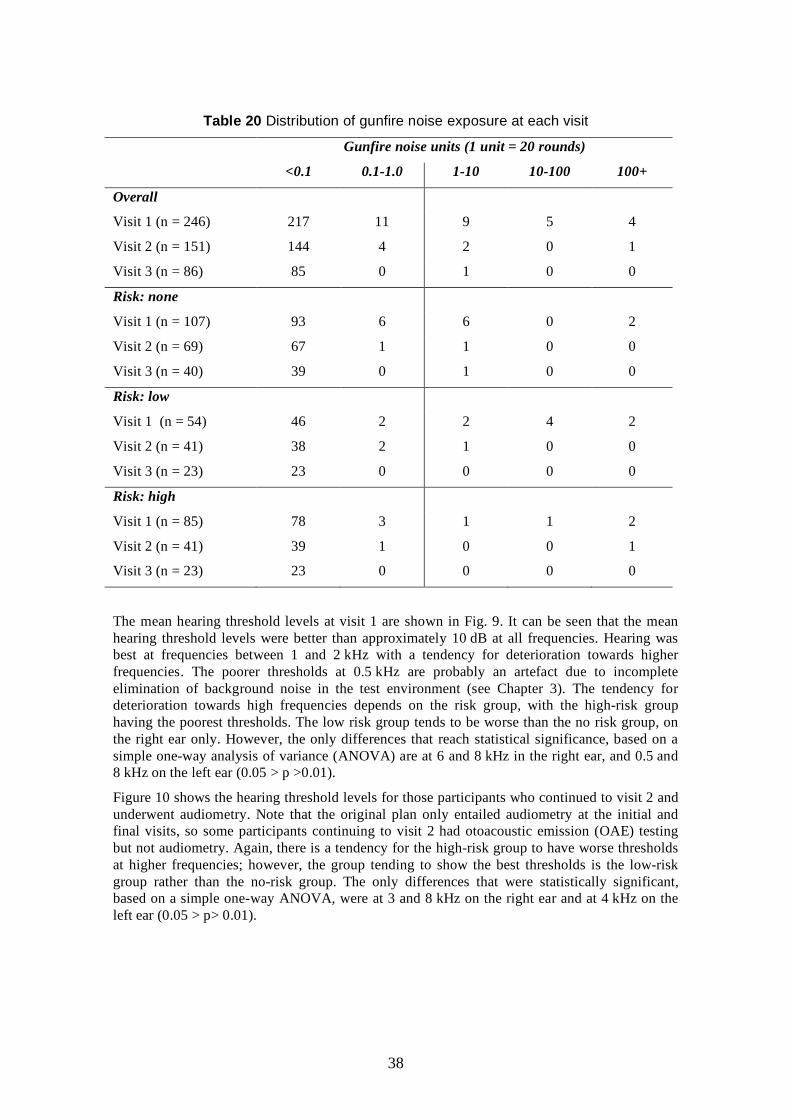
38
Table 20 Distribution of gunfire noise exposure at each visit
Gunfire noise units (1 unit = 20 rounds)
<0.1 0.1-1.0 1-10 10-100 100+
Overall
Visit 1 (n = 246) 217 11 9 5 4
Visit 2 (n = 151) 144 4 2 0 1
Visit 3 (n = 86) 85 0 1 0 0
Risk: none
Visit 1 (n = 107) 93 6 6 0 2
Visit 2 (n = 69) 67 1 1 0 0
Visit 3 (n = 40) 39 0 1 0 0
Risk: low
Visit 1 (n = 54) 46 2 2 4 2
Visit 2 (n = 41) 38 2 1 0 0
Visit 3 (n = 23) 23 0 0 0 0
Risk: high
Visit 1 (n = 85) 78 3 1 1 2
Visit 2 (n = 41) 39 1 0 0 1
Visit 3 (n = 23) 23 0 0 0 0
The mean hearing threshold levels at visit 1 are shown in Fig. 9. It can be seen that the mean hearing threshold levels were better than approximately 10 dB at all frequencies. Hearing was best at frequencies between 1 and 2 kHz with a tendency for deterioration towards higher frequencies. The poorer thresholds at 0.5 kHz are probably an artefact due to incomplete elimination of background noise in the test environment (see Chapter 3). The tendency for deterioration towards high frequencies depends on the risk group, with the high-risk group having the poorest thresholds. The low risk group tends to be worse than the no risk group, on the right ear only. However, the only differences that reach statistical significance, based on a simple one-way analysis of variance (ANOVA) are at 6 and 8 kHz in the right ear, and 0.5 and 8 kHz on the left ear (0.05 > p >0.01).
Figure 10 shows the hearing threshold levels for those participants who continued to visit 2 and underwent audiometry. Note that the original plan only entailed audiometry at the initial and final visits, so some participants continuing to visit 2 had otoacoustic emission (OAE) testing but not audiometry. Again, there is a tendency for the high-risk group to have worse thresholds at higher frequencies; however, the group tending to show the best thresholds is the low-risk group rather than the no-risk group. The only differences that were statistically significant, based on a simple one-way ANOVA, were at 3 and 8 kHz on the right ear and at 4 kHz on the left ear (0.05 > p> 0.01).
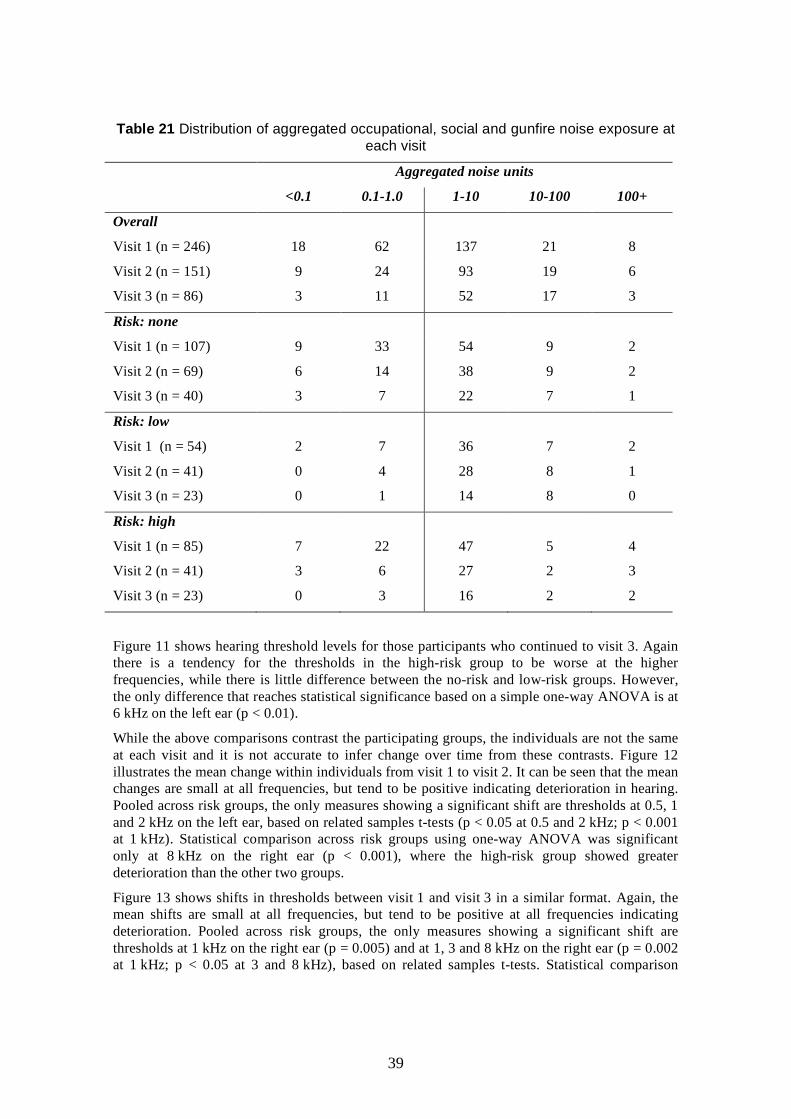
39
Table 21 Distribution of aggregated occupational, social and gunfire noise exposure at each visit
Aggregated noise units
<0.1 0.1-1.0 1-10 10-100 100+
Overall
Visit 1 (n = 246) 18 62 137 21 8
Visit 2 (n = 151) 9 24 93 19 6
Visit 3 (n = 86) 3 11 52 17 3
Risk: none
Visit 1 (n = 107) 9 33 54 9 2
Visit 2 (n = 69) 6 14 38 9 2
Visit 3 (n = 40) 3 7 22 7 1
Risk: low
Visit 1 (n = 54) 2 7 36 7 2
Visit 2 (n = 41) 0 4 28 8 1
Visit 3 (n = 23) 0 1 14 8 0
Risk: high
Visit 1 (n = 85) 7 22 47 5 4
Visit 2 (n = 41) 3 6 27 2 3
Visit 3 (n = 23) 0 3 16 2 2
Figure 11 shows hearing threshold levels for those participants who continued to visit 3. Again there is a tendency for the thresholds in the high-risk group to be worse at the higher frequencies, while there is little difference between the no-risk and low-risk groups. However, the only difference that reaches statistical significance based on a simple one-way ANOVA is at 6 kHz on the left ear (p < 0.01).
While the above comparisons contrast the participating groups, the individuals are not the same at each visit and it is not accurate to infer change over time from these contrasts. Figure 12 illustrates the mean change within individuals from visit 1 to visit 2. It can be seen that the mean changes are small at all frequencies, but tend to be positive indicating deterioration in hearing. Pooled across risk groups, the only measures showing a significant shift are thresholds at 0.5, 1 and 2 kHz on the left ear, based on related samples t-tests (p < 0.05 at 0.5 and 2 kHz; p < 0.001 at 1 kHz). Statistical comparison across risk groups using one-way ANOVA was significant only at 8 kHz on the right ear (p < 0.001), where the high-risk group showed greater deterioration than the other two groups.
Figure 13 shows shifts in thresholds between visit 1 and visit 3 in a similar format. Again, the mean shifts are small at all frequencies, but tend to be positive at all frequencies indicating deterioration. Pooled across risk groups, the only measures showing a significant shift are thresholds at 1 kHz on the right ear (p = 0.005) and at 1, 3 and 8 kHz on the right ear (p = 0.002 at 1 kHz; p < 0.05 at 3 and 8 kHz), based on related samples t-tests. Statistical comparison
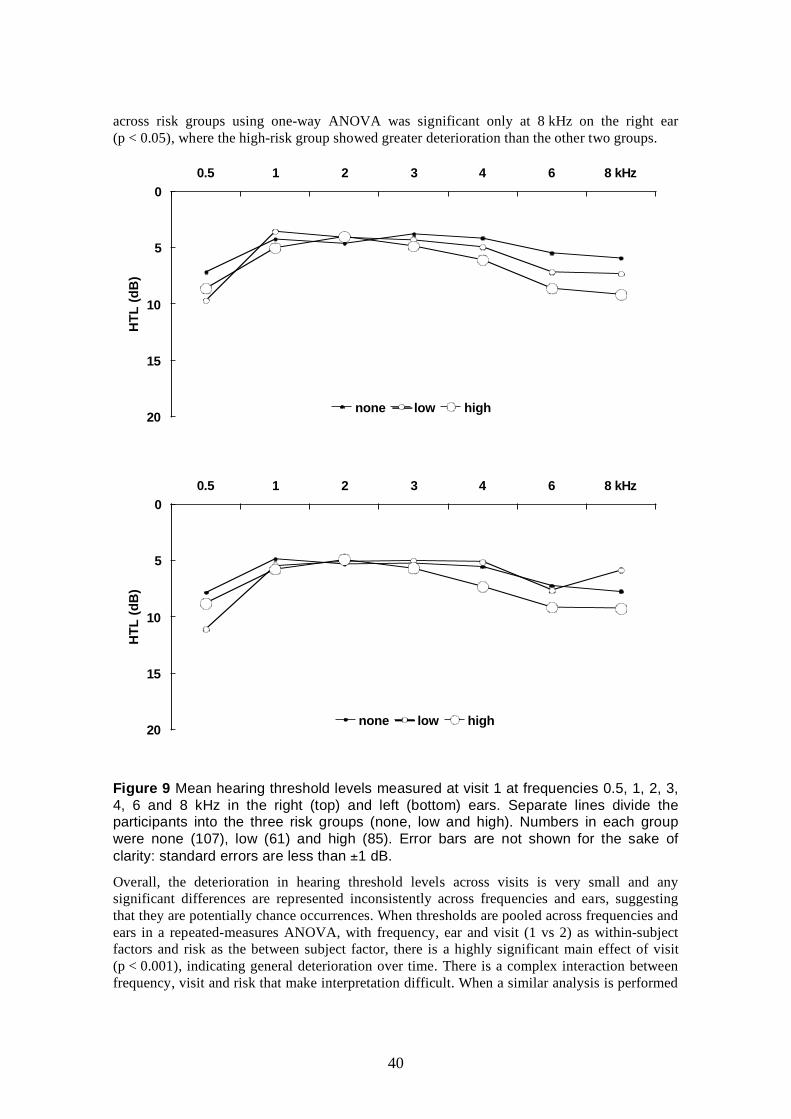
40
across risk groups using one-way ANOVA was significant only at 8 kHz on the right ear (p < 0.05), where the high-risk group showed greater deterioration than the other two groups.
0
5
10
15
20
0.5 1 2 3 4 6 8 kHz
HTL
(dB
)
none low high
0
5
10
15
20
0.5 1 2 3 4 6 8 kHz
HTL
(dB
)
none low high
Figure 9 Mean hearing threshold levels measured at visit 1 at frequencies 0.5, 1, 2, 3, 4, 6 and 8 kHz in the right (top) and left (bottom) ears. Separate lines divide the participants into the three risk groups (none, low and high). Numbers in each group were none (107), low (61) and high (85). Error bars are not shown for the sake of clarity: standard errors are less than ±1 dB. Overall, the deterioration in hearing threshold levels across visits is very small and any significant differences are represented inconsistently across frequencies and ears, suggesting that they are potentially chance occurrences. When thresholds are pooled across frequencies and ears in a repeated-measures ANOVA, with frequency, ear and visit (1 vs 2) as within-subject factors and risk as the between subject factor, there is a highly significant main effect of visit (p < 0.001), indicating general deterioration over time. There is a complex interaction between frequency, visit and risk that make interpretation difficult. When a similar analysis is performed
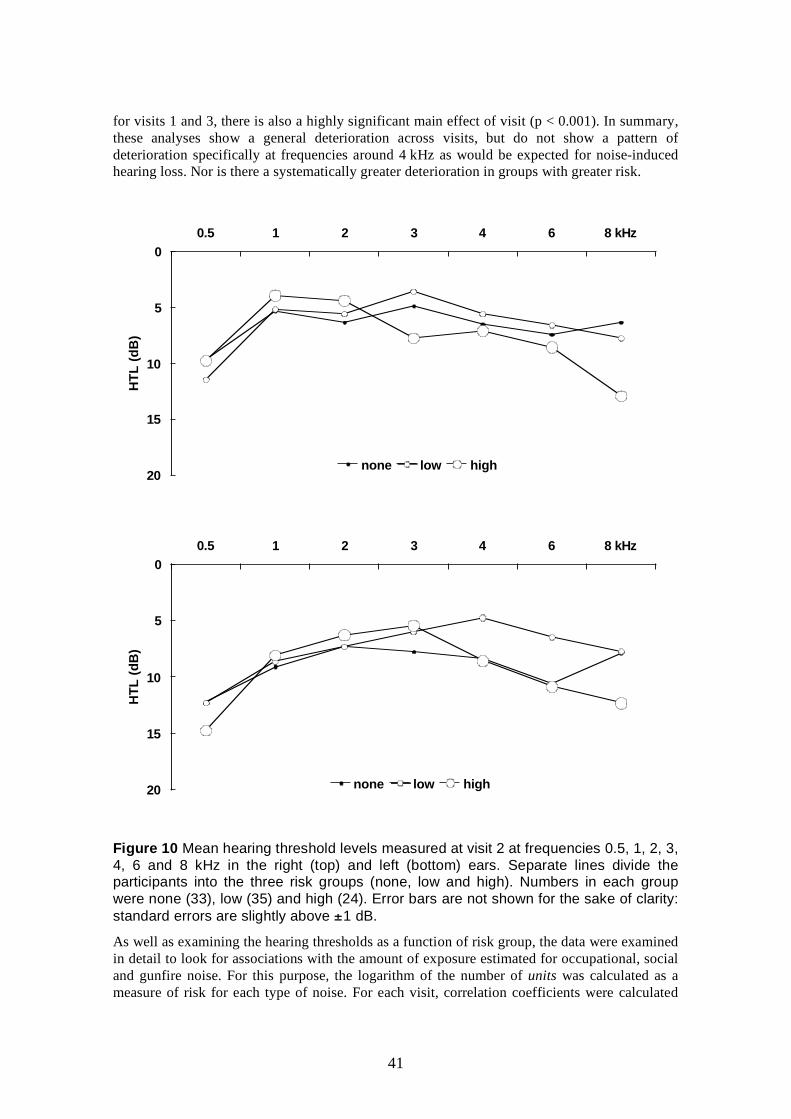
41
for visits 1 and 3, there is also a highly significant main effect of visit (p < 0.001). In summary, these analyses show a general deterioration across visits, but do not show a pattern of deterioration specifically at frequencies around 4 kHz as would be expected for noise-induced hearing loss. Nor is there a systematically greater deterioration in groups with greater risk.
0
5
10
15
20
0.5 1 2 3 4 6 8 kHz
HTL
(dB
)
none low high
0
5
10
15
20
0.5 1 2 3 4 6 8 kHz
HTL
(dB
)
none low high
Figure 10 Mean hearing threshold levels measured at visit 2 at frequencies 0.5, 1, 2, 3, 4, 6 and 8 kHz in the right (top) and left (bottom) ears. Separate lines divide the participants into the three risk groups (none, low and high). Numbers in each group were none (33), low (35) and high (24). Error bars are not shown for the sake of clarity: standard errors are slightly above ±1 dB.
As well as examining the hearing thresholds as a function of risk group, the data were examined in detail to look for associations with the amount of exposure estimated for occupational, social and gunfire noise. For this purpose, the logarithm of the number of units was calculated as a measure of risk for each type of noise. For each visit, correlation coefficients were calculated
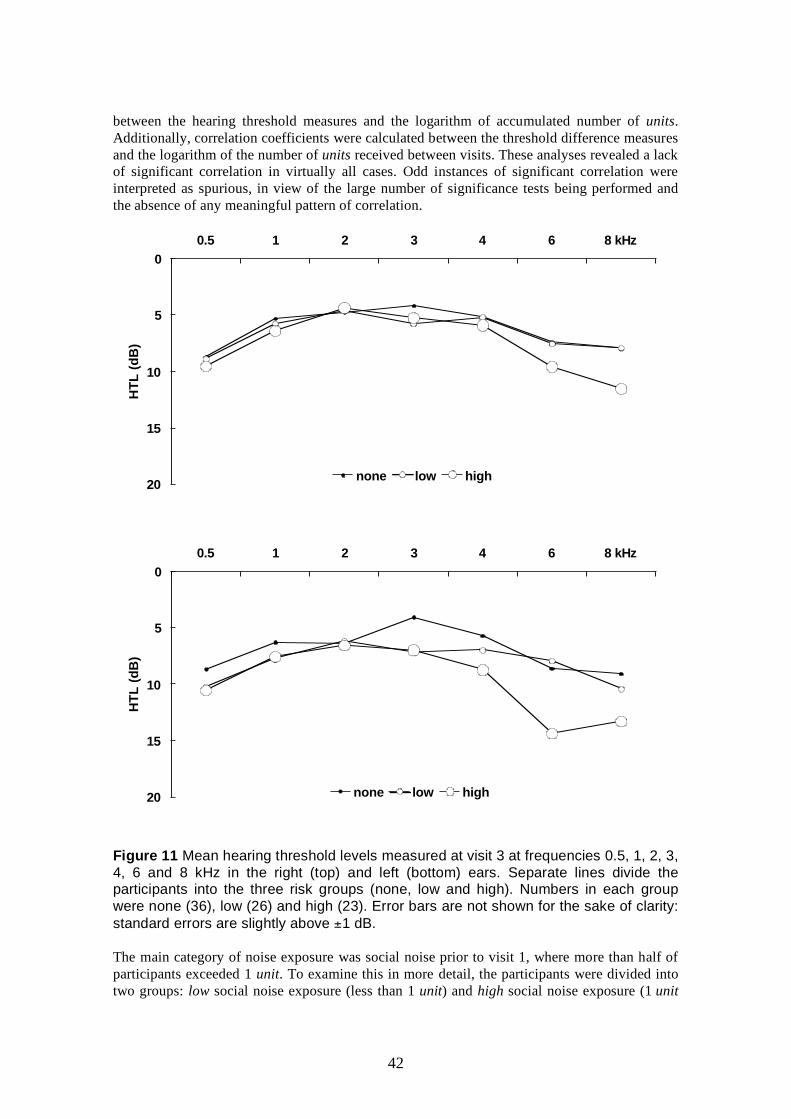
42
between the hearing threshold measures and the logarithm of accumulated number of units. Additionally, correlation coefficients were calculated between the threshold difference measures and the logarithm of the number of units received between visits. These analyses revealed a lack of significant correlation in virtually all cases. Odd instances of significant correlation were interpreted as spurious, in view of the large number of significance tests being performed and the absence of any meaningful pattern of correlation.
0
5
10
15
20
0.5 1 2 3 4 6 8 kHz
HTL
(dB
)
none low high
0
5
10
15
20
0.5 1 2 3 4 6 8 kHz
HTL
(dB
)
none low high
Figure 11 Mean hearing threshold levels measured at visit 3 at frequencies 0.5, 1, 2, 3, 4, 6 and 8 kHz in the right (top) and left (bottom) ears. Separate lines divide the participants into the three risk groups (none, low and high). Numbers in each group were none (36), low (26) and high (23). Error bars are not shown for the sake of clarity: standard errors are slightly above ±1 dB.
The main category of noise exposure was social noise prior to visit 1, where more than half of participants exceeded 1 unit. To examine this in more detail, the participants were divided into two groups: low social noise exposure (less than 1 unit) and high social noise exposure (1 unit
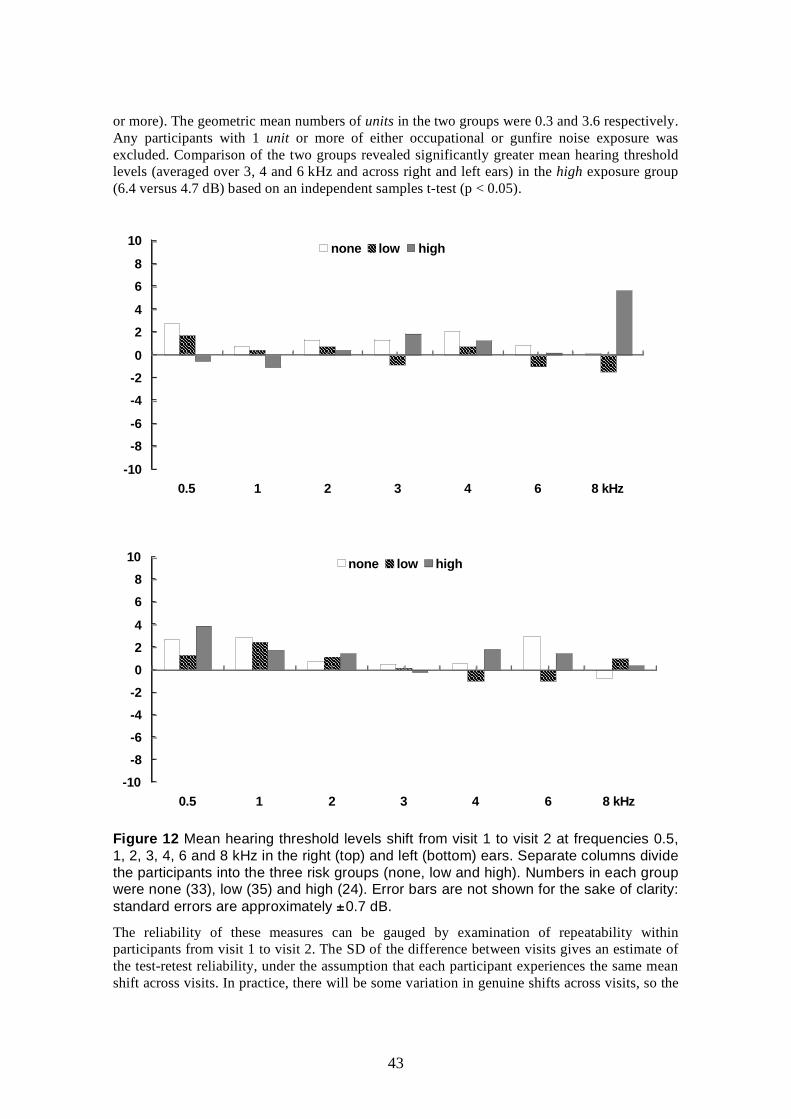
43
or more). The geometric mean numbers of units in the two groups were 0.3 and 3.6 respectively. Any participants with 1 unit or more of either occupational or gunfire noise exposure was excluded. Comparison of the two groups revealed significantly greater mean hearing threshold levels (averaged over 3, 4 and 6 kHz and across right and left ears) in the high exposure group (6.4 versus 4.7 dB) based on an independent samples t-test (p < 0.05).
-10
-8-6
-4-20
24
68
10
0.5 1 2 3 4 6 8 kHz
none low high
-10-8-6-4-2024
68
10
0.5 1 2 3 4 6 8 kHz
none low high
Figure 12 Mean hearing threshold levels shift from visit 1 to visit 2 at frequencies 0.5, 1, 2, 3, 4, 6 and 8 kHz in the right (top) and left (bottom) ears. Separate columns divide the participants into the three risk groups (none, low and high). Numbers in each group were none (33), low (35) and high (24). Error bars are not shown for the sake of clarity: standard errors are approximately ±0.7 dB.
The reliability of these measures can be gauged by examination of repeatability within participants from visit 1 to visit 2. The SD of the difference between visits gives an estimate of the test-retest reliability, under the assumption that each participant experiences the same mean shift across visits. In practice, there will be some variation in genuine shifts across visits, so the
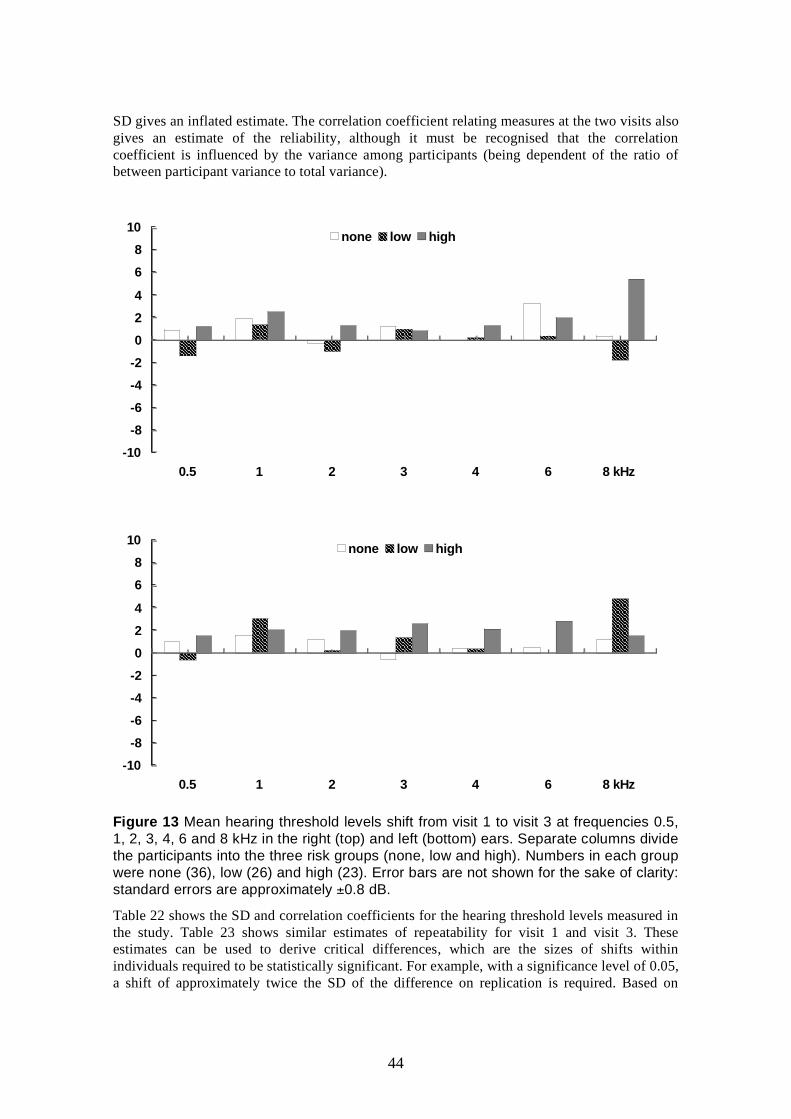
44
SD gives an inflated estimate. The correlation coefficient relating measures at the two visits also gives an estimate of the reliability, although it must be recognised that the correlation coefficient is influenced by the variance among participants (being dependent of the ratio of between participant variance to total variance).
-10-8-6-4-2024
68
10
0.5 1 2 3 4 6 8 kHz
none low high
-10-8-6-4-2024
68
10
0.5 1 2 3 4 6 8 kHz
none low high
Figure 13 Mean hearing threshold levels shift from visit 1 to visit 3 at frequencies 0.5, 1, 2, 3, 4, 6 and 8 kHz in the right (top) and left (bottom) ears. Separate columns divide the participants into the three risk groups (none, low and high). Numbers in each group were none (36), low (26) and high (23). Error bars are not shown for the sake of clarity: standard errors are approximately ±0.8 dB.
Table 22 shows the SD and correlation coefficients for the hearing threshold levels measured in the study. Table 23 shows similar estimates of repeatability for visit 1 and visit 3. These estimates can be used to derive critical differences, which are the sizes of shifts within individuals required to be statistically significant. For example, with a significance level of 0.05, a shift of approximately twice the SD of the difference on replication is required. Based on
45
tables 22 and 23, the critical difference is in the region of 10-20 dB. This represents the smallest individual shift that can be detected with this level of probability. Note that the higher correlation at higher frequencies is a reflection of the greater range of thresholds among participants at high frequencies; correlation is a poor measure of reliability when the range is low.
Table 22 Measures of repeatability of hearing thresholds between visits 1 and 2
Right ear Left ear Frequency (kHz) SD difference
(dB) Correlation SD difference
(dB) Correlation
0.5 8.0 0.08 6.6 0.35
1 5.0 0.50 4.3 0.49
2 4.7 0.71 4.3 0.59
3 5.1 0.54 4.5 0.54
4 5.9 0.60 5.0 0.73
6 7.2 0.46 7.5 0.53
8 8.0 0.57 7.1 0.66
Table 23 Measures of repeatability of hearing thresholds between visits 1 and 3
Right ear Left ear Frequency (kHz) SD difference
(dB) Correlation SD difference
(dB) Correlation
0.5 5.6 0.41 6.2 0.35
1 4.8 0.51 5.6 0.38
2 6.2 0.51 5.7 0.28
3 6.0 0.37 6.5 0.20
4 7.0 0.41 8.3 0.42
6 8.8 0.29 8.0 0.50
8 10.6 0.25 9.5 0.45
4.5 OTOACOUSTIC EMISSIONS The number of OAE measures obtained per participant was very high, with 720 values per visit among the raw measures. Extensive analysis of these measures suggested that they could be represented by a smaller set of summary measures to make the analysis and its presentation here more tractable. The analysis here concentrates on the measure that is conventionally named response. This is an estimate of the sound pressure level (SPL) of the OAE after accounting for the noise in the recording. Response is the SPL of the recorded components that are common to the two interleaved averages obtained during recording, conventionally denoted by A and B. Analogously to the way that the power of a signal is obtained mathematically by summating across frequency the product of the Fourier transform of the signal and its complex conjugate, the response measure is derived by summating across frequency the real part of the cross-product of the Fourier transform of A and the complex conjugate of the Fourier transform of B.
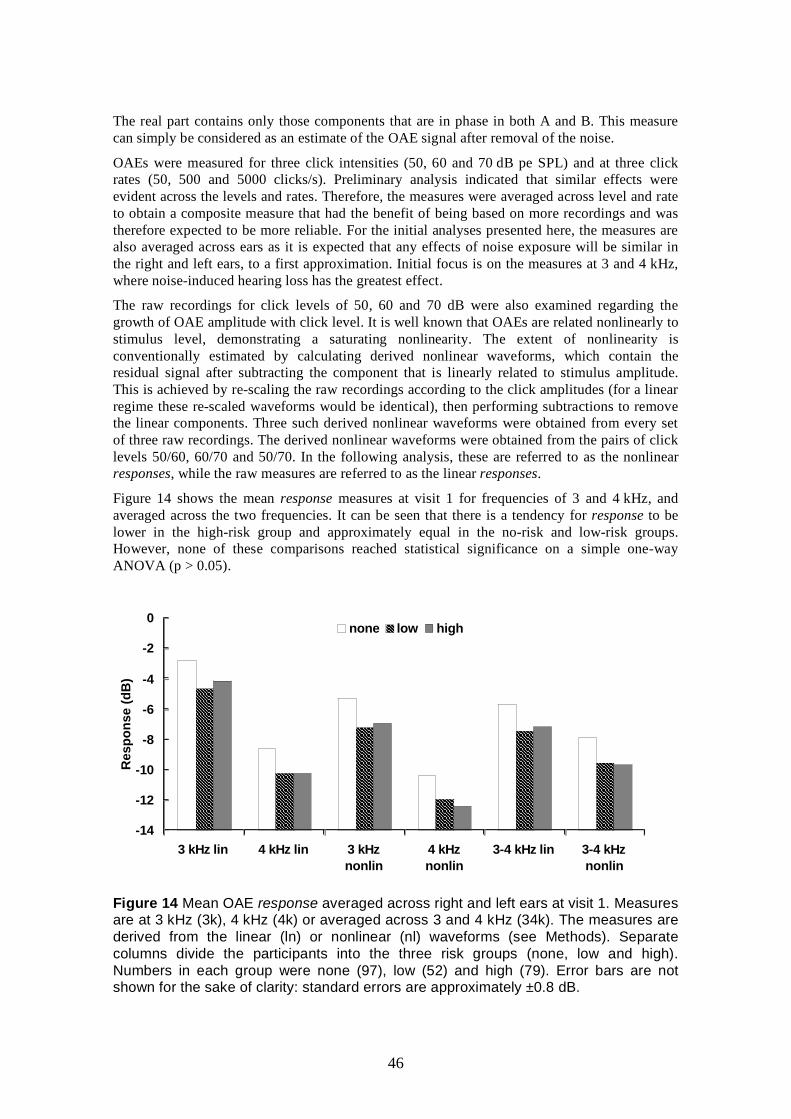
46
The real part contains only those components that are in phase in both A and B. This measure can simply be considered as an estimate of the OAE signal after removal of the noise.
OAEs were measured for three click intensities (50, 60 and 70 dB pe SPL) and at three click rates (50, 500 and 5000 clicks/s). Preliminary analysis indicated that similar effects were evident across the levels and rates. Therefore, the measures were averaged across level and rate to obtain a composite measure that had the benefit of being based on more recordings and was therefore expected to be more reliable. For the initial analyses presented here, the measures are also averaged across ears as it is expected that any effects of noise exposure will be similar in the right and left ears, to a first approximation. Initial focus is on the measures at 3 and 4 kHz, where noise-induced hearing loss has the greatest effect.
The raw recordings for click levels of 50, 60 and 70 dB were also examined regarding the growth of OAE amplitude with click level. It is well known that OAEs are related nonlinearly to stimulus level, demonstrating a saturating nonlinearity. The extent of nonlinearity is conventionally estimated by calculating derived nonlinear waveforms, which contain the residual signal after subtracting the component that is linearly related to stimulus amplitude. This is achieved by re-scaling the raw recordings according to the click amplitudes (for a linear regime these re-scaled waveforms would be identical), then performing subtractions to remove the linear components. Three such derived nonlinear waveforms were obtained from every set of three raw recordings. The derived nonlinear waveforms were obtained from the pairs of click levels 50/60, 60/70 and 50/70. In the following analysis, these are referred to as the nonlinear responses, while the raw measures are referred to as the linear responses.
Figure 14 shows the mean response measures at visit 1 for frequencies of 3 and 4 kHz, and averaged across the two frequencies. It can be seen that there is a tendency for response to be lower in the high-risk group and approximately equal in the no-risk and low-risk groups. However, none of these comparisons reached statistical significance on a simple one-way ANOVA (p > 0.05).
-14
-12
-10
-8
-6
-4
-2
0
3 kHz lin 4 kHz lin 3 kHznonlin
4 kHznonlin
3-4 kHz lin 3-4 kHznonlin
Res
pons
e (d
B)
none low high
Figure 14 Mean OAE response averaged across right and left ears at visit 1. Measures are at 3 kHz (3k), 4 kHz (4k) or averaged across 3 and 4 kHz (34k). The measures are derived from the linear (ln) or nonlinear (nl) waveforms (see Methods). Separate columns divide the participants into the three risk groups (none, low and high). Numbers in each group were none (97), low (52) and high (79). Error bars are not shown for the sake of clarity: standard errors are approximately ±0.8 dB.
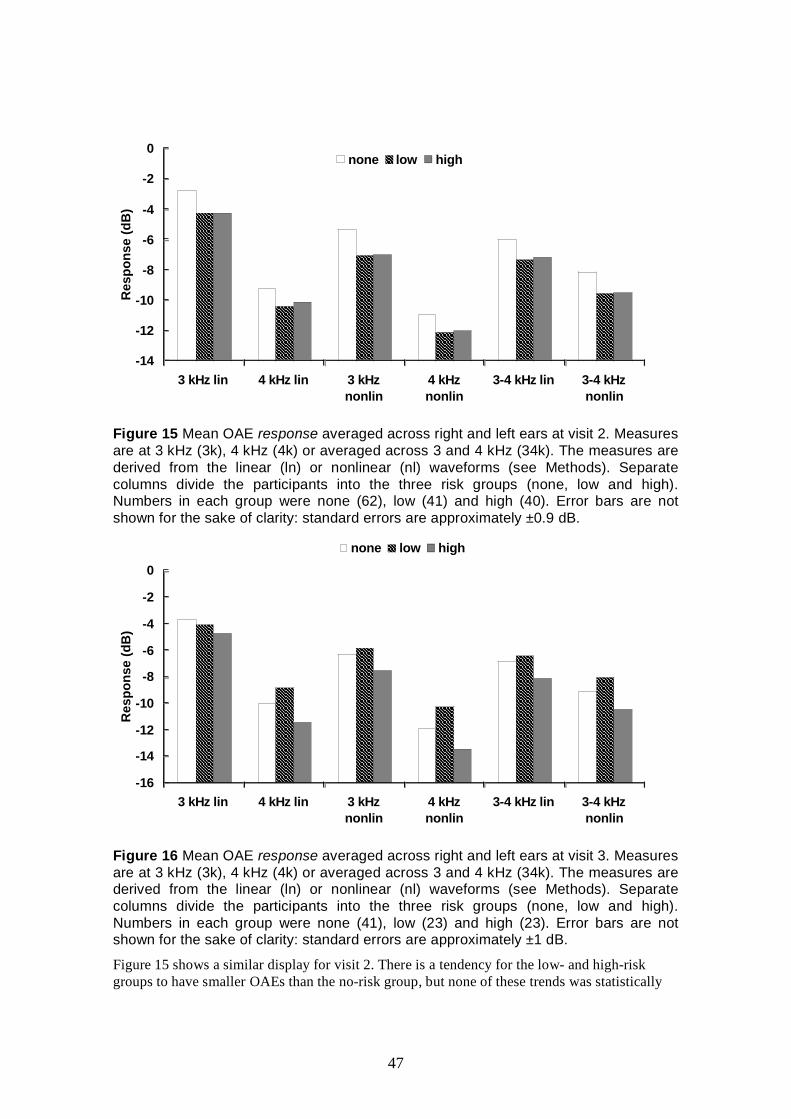
47
-14
-12
-10
-8
-6
-4
-2
0
3 kHz lin 4 kHz lin 3 kHznonlin
4 kHznonlin
3-4 kHz lin 3-4 kHznonlin
Res
pons
e (d
B)
none low high
Figure 15 Mean OAE response averaged across right and left ears at visit 2. Measures are at 3 kHz (3k), 4 kHz (4k) or averaged across 3 and 4 kHz (34k). The measures are derived from the linear (ln) or nonlinear (nl) waveforms (see Methods). Separate columns divide the participants into the three risk groups (none, low and high). Numbers in each group were none (62), low (41) and high (40). Error bars are not shown for the sake of clarity: standard errors are approximately ±0.9 dB.
-16
-14
-12
-10
-8
-6
-4
-2
0
3 kHz lin 4 kHz lin 3 kHznonlin
4 kHznonlin
3-4 kHz lin 3-4 kHznonlin
Res
pons
e (d
B)
none low high
Figure 16 Mean OAE response averaged across right and left ears at visit 3. Measures are at 3 kHz (3k), 4 kHz (4k) or averaged across 3 and 4 kHz (34k). The measures are derived from the linear (ln) or nonlinear (nl) waveforms (see Methods). Separate columns divide the participants into the three risk groups (none, low and high). Numbers in each group were none (41), low (23) and high (23). Error bars are not shown for the sake of clarity: standard errors are approximately ±1 dB.
Figure 15 shows a similar display for visit 2. There is a tendency for the low- and high-risk groups to have smaller OAEs than the no-risk group, but none of these trends was statistically
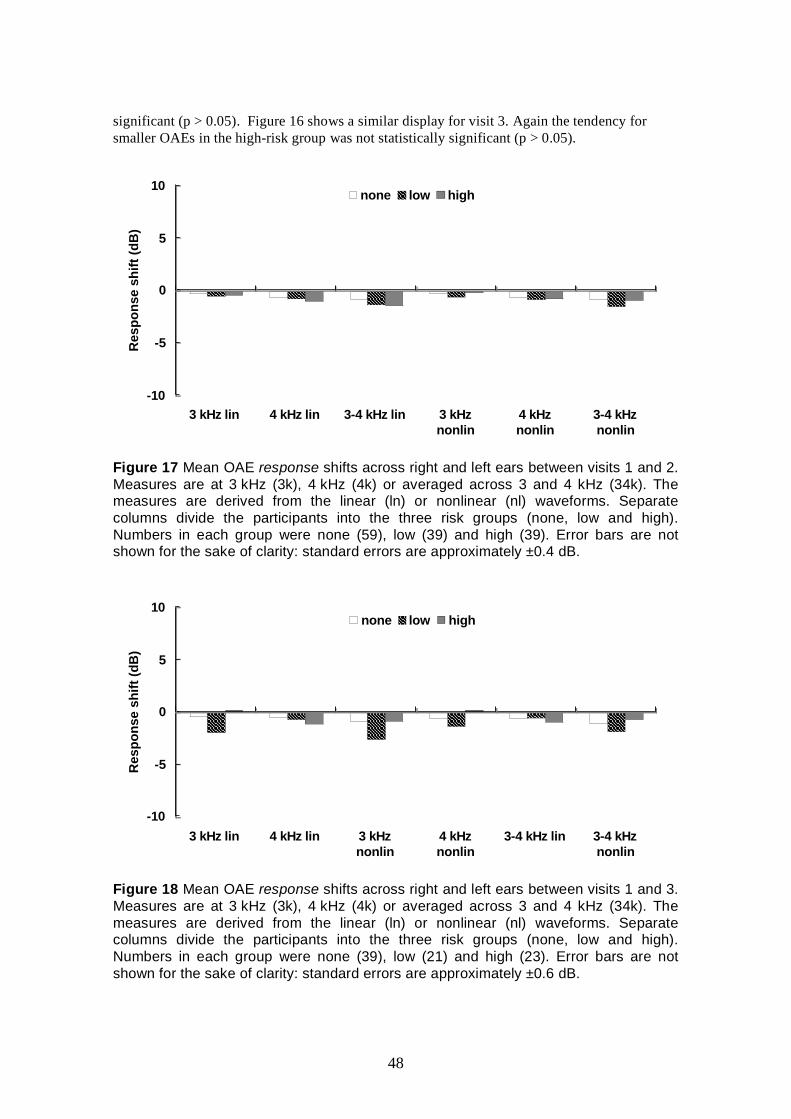
48
significant (p > 0.05). Figure 16 shows a similar display for visit 3. Again the tendency for smaller OAEs in the high-risk group was not statistically significant (p > 0.05).
-10
-5
0
5
10
3 kHz lin 4 kHz lin 3-4 kHz lin 3 kHznonlin
4 kHznonlin
3-4 kHznonlin
Res
pons
e sh
ift (d
B)
none low high
Figure 17 Mean OAE response shifts across right and left ears between visits 1 and 2. Measures are at 3 kHz (3k), 4 kHz (4k) or averaged across 3 and 4 kHz (34k). The measures are derived from the linear (ln) or nonlinear (nl) waveforms. Separate columns divide the participants into the three risk groups (none, low and high). Numbers in each group were none (59), low (39) and high (39). Error bars are not shown for the sake of clarity: standard errors are approximately ±0.4 dB.
-10
-5
0
5
10
3 kHz lin 4 kHz lin 3 kHznonlin
4 kHznonlin
3-4 kHz lin 3-4 kHznonlin
Res
pons
e sh
ift (d
B)
none low high
Figure 18 Mean OAE response shifts across right and left ears between visits 1 and 3. Measures are at 3 kHz (3k), 4 kHz (4k) or averaged across 3 and 4 kHz (34k). The measures are derived from the linear (ln) or nonlinear (nl) waveforms. Separate columns divide the participants into the three risk groups (none, low and high). Numbers in each group were none (39), low (21) and high (23). Error bars are not shown for the sake of clarity: standard errors are approximately ±0.6 dB.
49
Similar analyses for the response measures at 1 and 2 kHz did not reveal any significant shifts.
Shifts at 3 and 4 kHz (Figs. 17-18) were examined in relation to risk group using simple one-way ANOVA. The shifts between visit 1 and visit 3 were statistically significant (p < 0.05) at 3 kHz and the 3-4-kHz average for both linear and nonlinear measures. Further analysis utilised repeated-measures ANOVA, with frequency, linearity and visit as within-subject factors and risk as the between subject factor. When comparing visits 1 and 2, there was a significant main effect of visit (p < 0.005) and a significant interaction between visit and frequency (p < 0.01). There were no significant interactions involving risk. When comparing visits 1 and 3, there was a significant main effect of visit (p < 0.005). There were significant interactions between risk and visit (p = 0.025), and visit × frequency × risk (p = 0.005). The main effect of risk did not quite reach statistical significance (p = 0.06). The interactions reflect mainly the fact that the low-risk group had larger OAEs than the other groups at visit 1, but worsened to be similar to the other groups at visit 3. This was particularly evident at 3 kHz. This pattern was also evident in the comparison between visit 1 and visit 2, but did not reach statistical significance.
The reason why OAEs should be larger in the low-risk group than either the no-risk or high-risk groups at visit 1, yet not at visit 2 or visit 3, is obscure. However, a similar pattern of interactions was also evident in the OAE response at 1 and 2 kHz, although there were not significant main effects of visit.
As well as examining the OAE measures as a function of risk group, the data were examined in detail to look for associations with the amount of exposure estimated for occupational, social and gunfire noise. For this purpose, the logarithm of the number of units was calculated as a measure of risk for each type of noise. For each visit, correlation coefficients were calculated between the OAE measures and the logarithm of accumulated number of units. Additionally, correlation coefficients were calculated between the OAE difference measures and the logarithm of the number of units received between visits. These analyses revealed a lack of significant correlation in virtually all cases. Odd instances of significant correlation were interpreted as spurious, in view of the large number of significance tests being performed and the absence of any meaningful pattern of correlation.
Comparison of the low and high social noise exposure groups (see section 4.4) did not reveal any significant differences in the OAE measures centred on 3 and 4 kHz (p > 0.05). The largest difference between the groups was 0.6 dB.
The reliability of these measures can be gauged by examination of repeatability within participants from visit 1 to visit 2. The SD of the difference between visits gives an estimate of the test-retest reliability, under the assumption that each participant experiences the same mean shift across visits. In practice, there will be some variation in genuine shifts across visits, so the SD gives an inflated estimate. The correlation coefficient relating measures at the two visits also gives an estimate of the reliability, although it must be recognised that the correlation coefficient is influenced by the variance among participants (being dependent of the ratio of between participant variance to total variance). Table 24 shows the SD and correlation coefficients for the summary OAE measures derived in the study, as described above. Table 25 shows similar estimates of repeatability for visit 1 and visit 3. The estimates show poorer repeatability than in Table 24, presumably because of the longer interval between visits. These estimates can be used to derive critical differences, which are the sizes of shifts within individuals required to be statistically significant. For example, with a significance level of 0.05, a shift of approximately twice the SD of the difference on replication is required. Based on tables 24 and 25, that critical difference is in the region of 7.5-12.5 dB. This represents the smallest individual shift that can be detected with this level of probability.
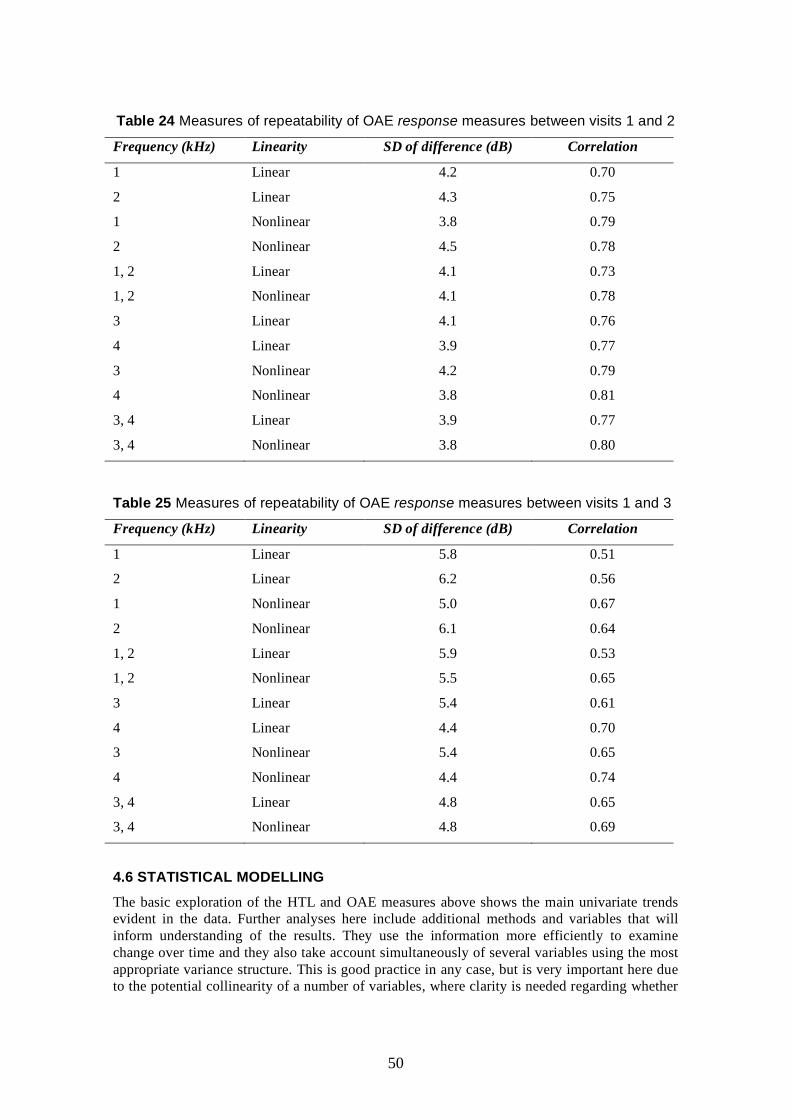
50
Table 24 Measures of repeatability of OAE response measures between visits 1 and 2
Frequency (kHz) Linearity SD of difference (dB) Correlation
1 Linear 4.2 0.70
2 Linear 4.3 0.75
1 Nonlinear 3.8 0.79
2 Nonlinear 4.5 0.78
1, 2 Linear 4.1 0.73
1, 2 Nonlinear 4.1 0.78
3 Linear 4.1 0.76
4 Linear 3.9 0.77
3 Nonlinear 4.2 0.79
4 Nonlinear 3.8 0.81
3, 4 Linear 3.9 0.77
3, 4 Nonlinear 3.8 0.80
Table 25 Measures of repeatability of OAE response measures between visits 1 and 3
Frequency (kHz) Linearity SD of difference (dB) Correlation
1 Linear 5.8 0.51
2 Linear 6.2 0.56
1 Nonlinear 5.0 0.67
2 Nonlinear 6.1 0.64
1, 2 Linear 5.9 0.53
1, 2 Nonlinear 5.5 0.65
3 Linear 5.4 0.61
4 Linear 4.4 0.70
3 Nonlinear 5.4 0.65
4 Nonlinear 4.4 0.74
3, 4 Linear 4.8 0.65
3, 4 Nonlinear 4.8 0.69
4.6 STATISTICAL MODELLING The basic exploration of the HTL and OAE measures above shows the main univariate trends evident in the data. Further analyses here include additional methods and variables that will inform understanding of the results. They use the information more efficiently to examine change over time and they also take account simultaneously of several variables using the most appropriate variance structure. This is good practice in any case, but is very important here due to the potential collinearity of a number of variables, where clarity is needed regarding whether
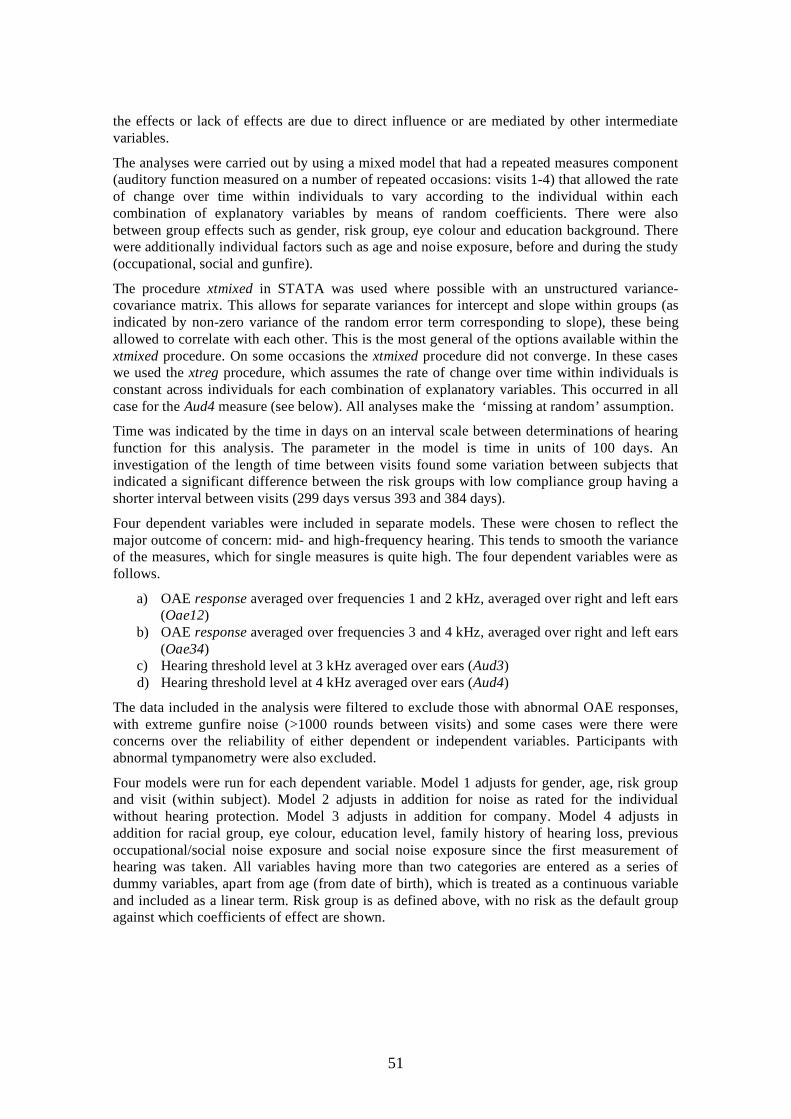
51
the effects or lack of effects are due to direct influence or are mediated by other intermediate variables.
The analyses were carried out by using a mixed model that had a repeated measures component (auditory function measured on a number of repeated occasions: visits 1-4) that allowed the rate of change over time within individuals to vary according to the individual within each combination of explanatory variables by means of random coefficients. There were also between group effects such as gender, risk group, eye colour and education background. There were additionally individual factors such as age and noise exposure, before and during the study (occupational, social and gunfire).
The procedure xtmixed in STATA was used where possible with an unstructured variance-covariance matrix. This allows for separate variances for intercept and slope within groups (as indicated by non-zero variance of the random error term corresponding to slope), these being allowed to correlate with each other. This is the most general of the options available within the xtmixed procedure. On some occasions the xtmixed procedure did not converge. In these cases we used the xtreg procedure, which assumes the rate of change over time within individuals is constant across individuals for each combination of explanatory variables. This occurred in all case for the Aud4 measure (see below). All analyses make the ‘missing at random’ assumption.
Time was indicated by the time in days on an interval scale between determinations of hearing function for this analysis. The parameter in the model is time in units of 100 days. An investigation of the length of time between visits found some variation between subjects that indicated a significant difference between the risk groups with low compliance group having a shorter interval between visits (299 days versus 393 and 384 days).
Four dependent variables were included in separate models. These were chosen to reflect the major outcome of concern: mid- and high-frequency hearing. This tends to smooth the variance of the measures, which for single measures is quite high. The four dependent variables were as follows.
a) OAE response averaged over frequencies 1 and 2 kHz, averaged over right and left ears (Oae12)
b) OAE response averaged over frequencies 3 and 4 kHz, averaged over right and left ears (Oae34)
c) Hearing threshold level at 3 kHz averaged over ears (Aud3) d) Hearing threshold level at 4 kHz averaged over ears (Aud4)
The data included in the analysis were filtered to exclude those with abnormal OAE responses, with extreme gunfire noise (>1000 rounds between visits) and some cases were there were concerns over the reliability of either dependent or independent variables. Participants with abnormal tympanometry were also excluded.
Four models were run for each dependent variable. Model 1 adjusts for gender, age, risk group and visit (within subject). Model 2 adjusts in addition for noise as rated for the individual without hearing protection. Model 3 adjusts in addition for company. Model 4 adjusts in addition for racial group, eye colour, education level, family history of hearing loss, previous occupational/social noise exposure and social noise exposure since the first measurement of hearing was taken. All variables having more than two categories are entered as a series of dummy variables, apart from age (from date of birth), which is treated as a continuous variable and included as a linear term. Risk group is as defined above, with no risk as the default group against which coefficients of effect are shown.
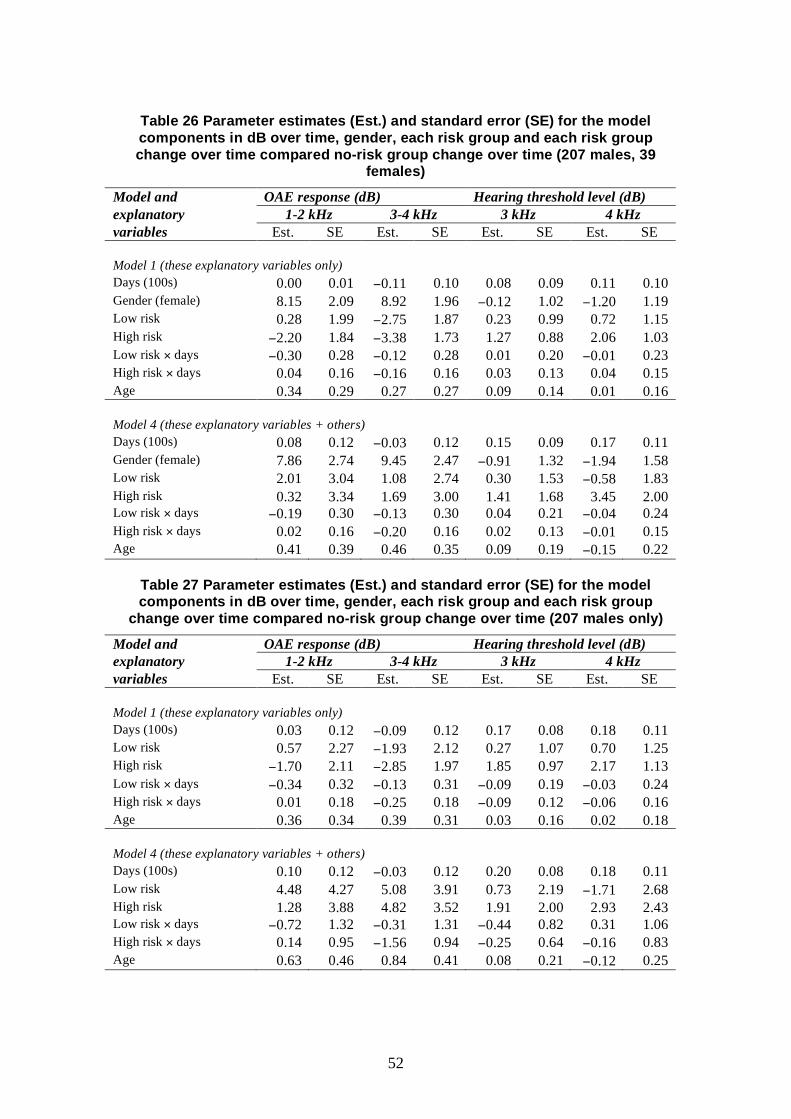
52
Table 26 Parameter estimates (Est.) and standard error (SE) for the model components in dB over time, gender, each risk group and each risk group change over time compared no-risk group change over time (207 males, 39
females)
Model and OAE response (dB) Hearing threshold level (dB) explanatory 1-2 kHz 3-4 kHz 3 kHz 4 kHz variables Est. SE Est. SE Est. SE Est. SE Model 1 (these explanatory variables only) Days (100s) 0.00 0.01 −0.11 0.10 0.08 0.09 0.11 0.10 Gender (female) 8.15 2.09 8.92 1.96 −0.12 1.02 −1.20 1.19 Low risk 0.28 1.99 −2.75 1.87 0.23 0.99 0.72 1.15 High risk −2.20 1.84 −3.38 1.73 1.27 0.88 2.06 1.03 Low risk × days −0.30 0.28 −0.12 0.28 0.01 0.20 −0.01 0.23 High risk × days 0.04 0.16 −0.16 0.16 0.03 0.13 0.04 0.15 Age 0.34 0.29 0.27 0.27 0.09 0.14 0.01 0.16 Model 4 (these explanatory variables + others) Days (100s) 0.08 0.12 −0.03 0.12 0.15 0.09 0.17 0.11 Gender (female) 7.86 2.74 9.45 2.47 −0.91 1.32 −1.94 1.58 Low risk 2.01 3.04 1.08 2.74 0.30 1.53 −0.58 1.83 High risk 0.32 3.34 1.69 3.00 1.41 1.68 3.45 2.00 Low risk × days −0.19 0.30 −0.13 0.30 0.04 0.21 −0.04 0.24 High risk × days 0.02 0.16 −0.20 0.16 0.02 0.13 −0.01 0.15 Age 0.41 0.39 0.46 0.35 0.09 0.19 −0.15 0.22
Table 27 Parameter estimates (Est.) and standard error (SE) for the model components in dB over time, gender, each risk group and each risk group
change over time compared no-risk group change over time (207 males only)
Model and OAE response (dB) Hearing threshold level (dB) explanatory 1-2 kHz 3-4 kHz 3 kHz 4 kHz variables Est. SE Est. SE Est. SE Est. SE Model 1 (these explanatory variables only) Days (100s) 0.03 0.12 −0.09 0.12 0.17 0.08 0.18 0.11 Low risk 0.57 2.27 −1.93 2.12 0.27 1.07 0.70 1.25 High risk −1.70 2.11 −2.85 1.97 1.85 0.97 2.17 1.13 Low risk × days −0.34 0.32 −0.13 0.31 −0.09 0.19 −0.03 0.24 High risk × days 0.01 0.18 −0.25 0.18 −0.09 0.12 −0.06 0.16 Age 0.36 0.34 0.39 0.31 0.03 0.16 0.02 0.18 Model 4 (these explanatory variables + others) Days (100s) 0.10 0.12 −0.03 0.12 0.20 0.08 0.18 0.11 Low risk 4.48 4.27 5.08 3.91 0.73 2.19 −1.71 2.68 High risk 1.28 3.88 4.82 3.52 1.91 2.00 2.93 2.43 Low risk × days −0.72 1.32 −0.31 1.31 −0.44 0.82 0.31 1.06 High risk × days 0.14 0.95 −1.56 0.94 −0.25 0.64 −0.16 0.83 Age 0.63 0.46 0.84 0.41 0.08 0.21 −0.12 0.25
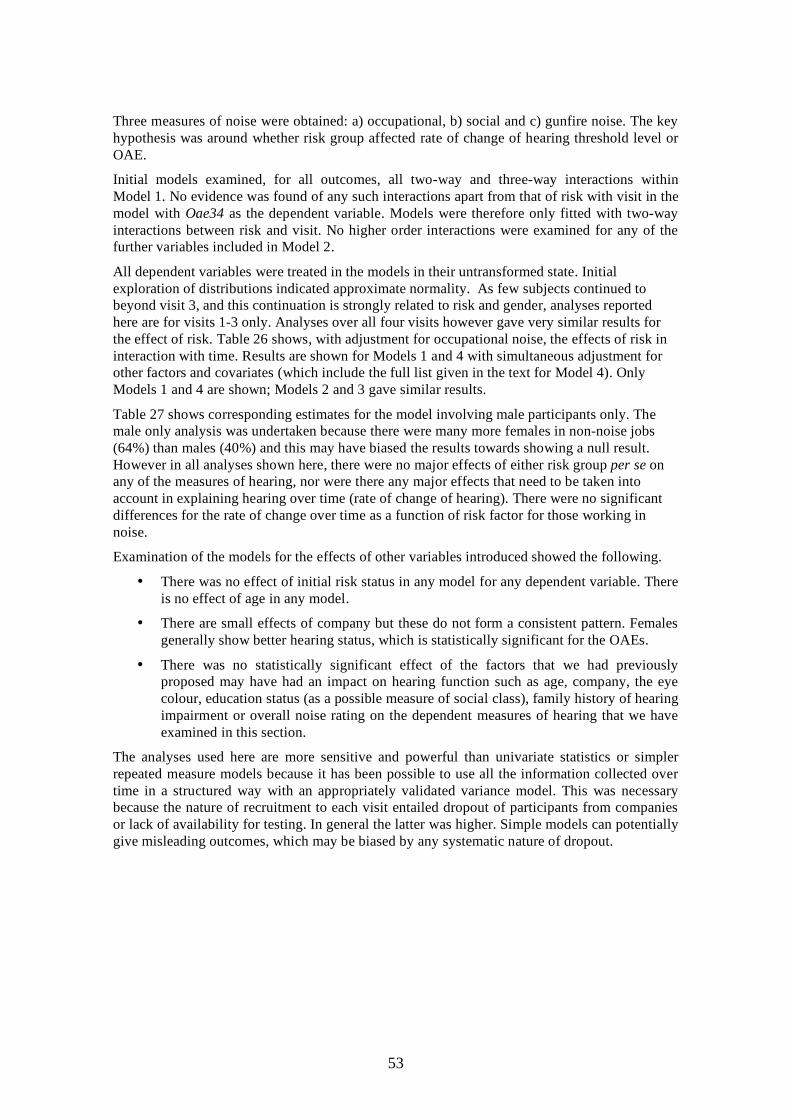
53
Three measures of noise were obtained: a) occupational, b) social and c) gunfire noise. The key hypothesis was around whether risk group affected rate of change of hearing threshold level or OAE.
Initial models examined, for all outcomes, all two-way and three-way interactions within Model 1. No evidence was found of any such interactions apart from that of risk with visit in the model with Oae34 as the dependent variable. Models were therefore only fitted with two-way interactions between risk and visit. No higher order interactions were examined for any of the further variables included in Model 2.
All dependent variables were treated in the models in their untransformed state. Initial exploration of distributions indicated approximate normality. As few subjects continued to beyond visit 3, and this continuation is strongly related to risk and gender, analyses reported here are for visits 1-3 only. Analyses over all four visits however gave very similar results for the effect of risk. Table 26 shows, with adjustment for occupational noise, the effects of risk in interaction with time. Results are shown for Models 1 and 4 with simultaneous adjustment for other factors and covariates (which include the full list given in the text for Model 4). Only Models 1 and 4 are shown; Models 2 and 3 gave similar results.
Table 27 shows corresponding estimates for the model involving male participants only. The male only analysis was undertaken because there were many more females in non-noise jobs (64%) than males (40%) and this may have biased the results towards showing a null result. However in all analyses shown here, there were no major effects of either risk group per se on any of the measures of hearing, nor were there any major effects that need to be taken into account in explaining hearing over time (rate of change of hearing). There were no significant differences for the rate of change over time as a function of risk factor for those working in noise.
Examination of the models for the effects of other variables introduced showed the following.
• There was no effect of initial risk status in any model for any dependent variable. There is no effect of age in any model.
• There are small effects of company but these do not form a consistent pattern. Females generally show better hearing status, which is statistically significant for the OAEs.
• There was no statistically significant effect of the factors that we had previously proposed may have had an impact on hearing function such as age, company, the eye colour, education status (as a possible measure of social class), family history of hearing impairment or overall noise rating on the dependent measures of hearing that we have examined in this section.
The analyses used here are more sensitive and powerful than univariate statistics or simpler repeated measure models because it has been possible to use all the information collected over time in a structured way with an appropriately validated variance model. This was necessary because the nature of recruitment to each visit entailed dropout of participants from companies or lack of availability for testing. In general the latter was higher. Simple models can potentially give misleading outcomes, which may be biased by any systematic nature of dropout.
54
5 DISCUSSION
5.1 VALIDITY OF ANALYSES, POTENTIAL BIASES 5.1.1 Audiometry The main measures of auditory function used in the study were audiometry and OAEs. The audiometric method used has been standardised internationally for clinical use, as described in Chapter 3. An important potential source of error was interference from background noise in the test environment. The initial research plan envisaged that the principal hearing threshold measures would be carried out at the start and end of the study in sound-attenuating audiometric booths at the research laboratories. That would have entailed participants travelling to the research laboratories twice. However, it became clear early on in the study that many companies would only agree to their employees taking part in the study if testing was done on-site to minimise time away from the workplace. Furthermore, as the study progressed, it was recognised that participant numbers and attrition posed the greatest threats to the study. Adherence to the original plan would have meant that final audiometric measures would only have been available for the few participants who persevered until the end of the study. Therefore, the plan was changed to include audiometric measurement at every visit. This entailed a change to the audiometric method, so that noise-excluding Audiocups were used instead of a sound-attenuating booth in the majority of cases where employees could not be tested in the laboratory, as indicated in Chapter 3. Testing was carried out away from the noisy parts of the workplace, usually in a quiet medical room or office. The combination of a quiet room and Audiocups was considered satisfactory, based on our previous experience of audiometric testing in a domiciliary setting. Examination of the audiometric results (see Fig. 9) shows that mean thresholds in the no-risk and low-risk groups at visit 1 were close to 5 dB at frequencies in the range 1-4 kHz. This is consistent with findings of the UK National Study of Hearing [46] and other population studies in the UK [66] that suggest that the mean hearing thresholds in otologically normal young adults is closer to 5 dB than the theoretical value of 0 dB. Moreover, examination of the distribution of individual thresholds shows recorded thresholds as low as −10 dB and absence of any signs of truncation of the distribution. Taken together, these findings suggest that the hearing thresholds are valid and uncontaminated by interference by background noise, at least at frequencies of 1 kHz and above.
Examination of mean hearing thresholds also shows worse hearing thresholds at 0.5 kHz than at frequencies of 1-4 kHz. Mean hearing thresholds at 0.5 kHz are approximately 10 dB. This suggests that hearing thresholds at 0.5 kHz are masked somewhat by background noise in the test environment. Interference by background noise is greatest at low frequencies because the attenuation of sound by building structures and by the audiometric earphones and enclosures is least at low frequencies, for purely physical reasons. Interference by background noise is seldom a problem at high audiometric frequencies.
5.1.2 Otoacoustic emissions OAEs were recorded using non-standard equipment that allowed utilisation of the maximum length sequence (MLS) technique. That technique has been used previously in our studies of hearing monitoring techniques [24, 50, 58] and found to be more sensitive to small changes over time than conventional techniques. However, we also employed a conventional method using regular click stimuli and non-overlapping recording epochs, so that our results can be compared with other studies. The probe used in our apparatus is the standard Otodynamics probe used in a range of proprietary instruments and is available commercially as a replacement part. Therefore, as the acoustic characteristics of the probe are a major determinant of the recorded OAE [52], our conventional recordings should be comparable with other studies.
55
One advantage of the MLS-OAE method is that a much larger number of clicks are presented in a given recording time, compared to the conventional approach. This allows the averaging of more responses and consequently an improvement in the signal-to-noise ratio of the overall recording. This feature contributes to the greater within-subject repeatability of MLS-OAEs and their greater sensitivity to change in our previous studies. The extent to which the present study was able to capitalise on this advantage is discussed below.
As with audiometry, OAE recordings are potentially contaminated by background noise in the recording environment. However, they are less susceptible than audiometry for several reasons. First, the probe is sealed in the ear canal, reducing the transmission of noise into the ear. Second, the intrinsic noise level of the recording microphone (typically 20-25 dB(A)) introduces masking of the response so that noise below that level is unimportant. Third, the recording apparatus is able to exclude momentary noise interference at the expense of slightly prolonged test time. Fourth, the averaging process reduces the effect of noise that is uncorrelated with the recorded response.
Examination of the OAE results (Fig. 14) shows the mean amplitudes of recorded responses at 3 and 4 kHz. It is difficult to compare these values with other published studies because of the variation in analysis methods and the different methods of reporting. However, examination of the broadband responses obtained using the conventional method (not shown in Chapter 4) indicates mean values of approximately 17 dB for the linear response to clicks at 70 dB, which is in keeping with other studies [21]. Individual values as low as −10 dB were obtained, suggesting that there is not a problem of noise floor that would interfere with measuring changes within individuals.
The click intensities used in the present study were 50, 60 and 70 dB pe SPL, which is lower than have been used in most previous studies. The default levels used by the Otodynamics ILO88 apparatus and its descendants are 80 and 90 dB, delivered in a nonlinear recording sequence whereby, in effect the 90 dB click is used to control for linear stimulus related components in the 80 dB responses. The rationale for using lower intensities is that they are more closely related to the non-saturated amplification introduced by the inner hair cells of the cochlear (see Background chapter). Previous studies have supported the contention that using lower intensities conveys greater sensitivity to differences in or changes to cochlear function [38, 50, 55, 58]. However, responses to lower intensities are smaller than responses to higher intensities, leading to lower signal-to-noise ratio. This may, by contrast, reduce the sensitivity of the method.
Analysis of the OAE recordings according to stimulus rate (and comparison of conventional versus MLS approaches) and stimulus level did not reveal any particular advantages of either higher rate or lower click intensity, as has been hypothesised. Results obtained across rates and levels tended to correlate with each other. Therefore, the approach taken for the main analysis was to pool results across methods to maximise stability. This approach also simplified the main analyses in relation to noise exposure and risk group. Similarly, results derived for the four frequency ranges centred on 1, 2, 3 and 4 kHz were pooled to give two frequency ranges: 1-2 kHz and 3-4 kHz.
5.1.3 Calibration
Calibration of audiometers and OAE measurement apparatus was rigorous, with adjustment at intervals of approximately 6 weeks when there was variation exceeding 1 dB. Therefore, any measured changes in hearing threshold level or OAE greater than this tolerance cannot be attributed to drift in the instrument performance. For longitudinal studies where small average shifts are expected, accuracy and frequency of calibration are vital.
56
5.1.4 Middle-ear disorder Temporary conductive hearing loss caused by middle-ear disorder could affect both audiometry and OAE measures. The most common cause of middle-ear disorder is upper respiratory tract infection. The effects of this were minimised by excluding all cases with abnormal tympanometry on the day of testing, defined as a middle-ear pressure outside the range from −100 to +50 daPa or middle-ear admittance below 0.2 ml. Exclusion was specific to ear, so that for example a case with abnormal tympanometry in the left ear only would be excluded from analyses involving the left ear, but not from analyses involving only the right ear.
5.1.5 Compliance rating Compliance ratings were based on a survey for each company carried out on one occasion. Therefore, some aspects of the survey might have differed on other days during the study period and the analyses have necessarily assumed that the survey results are representative of the entire period. There is no way to test this assumption from the data available. A complicating factor is the introduction of the Control of Noise at Work Regulations that became effective in April 2006. The CNWR impose greater obligations on employers and may have led to changes in practice in the company around that time. However, the CNWR had been heavily publicised for some years in advance and it is feasible that some companies would have anticipated their introduction by changing practice well ahead of 2006. By contrast, some other companies may have delayed making changes until the introduction of the CNWR, or even later. Therefore, the target for compliance considered by the companies is probably a mixture of the earlier NWR and the later CNWR.
Many aspects of the compliance rating schedule are generic and apply equally to both the NWR and the CNWR; for example, implementing noise surveys and assessing risk to individual employees or groups of similarly exposed employees, education about noise hazards and training in the use and maintenance of hearing protection. The generally observed weaknesses in compliance are outlined below. None of these weaknesses is specific to the CNWR and the ratings probably apply equally to either set of regulations. Neither are the weaknesses likely to vary materially from day to day. Therefore, the rating data obtained are probably representative of the overall situation in each company throughout the study.
5.1.6 Risk groups The risk groups were defined on the basis of the compliance ratings by dividing the companies into two groups having roughly equal numbers of participants. This arbitrary division means that the low- and high-risk categories are defined in relative rather than absolute terms. It is not possible to assess whether a similar division would be obtained for companies selected randomly in the UK. In all probability, the companies that volunteered for the study were towards the high compliance end of the spectrum of UK industry. This assertion is bolstered by the comments of health and safety managers at several companies, who were proud of what they had achieved in terms of hearing conservation practice. Therefore, the compliance results from the present study should not be interpreted as representative of UK industry.
The no-risk group was defined on the basis of information from the company on the activities of the individual as well as preliminary measurements of noise level within the workplace by the project researchers. Noise levels experienced by the no-risk group were below 80 dB(A) and we can be confident that noise hazard at work was negligible. This is supported by noise exposure estimates (see Results chapter) showing only 3% of participants having material occupational noise exposure at work prior to visit 1 and none thereafter. By contrast the percentages in the low- and high-risk groups at visit 1 were 33% and 16% even after taking account of wearing hearing protection.
57
5.1.7 Noise exposure estimation The method used for noise exposure estimation has been used for research studies in the UK since the early 1980s. A crucial part of the procedure is the estimation of noise level, which may be based on a number of alternative sources of information. In virtually all cases the method used was based on reported communication difficulty. Being a subjective measure, it is potentially prone to inaccuracy and bias. However, analysis of data from the present study, comparing the dosimetry measurements with estimates of noise levels based on self-reported communication difficulty, has shown that there is no overall bias. Differences between methods were within 3 dB in 43% of cases and within 6 dB in 84% of cases [28]. Therefore, for group comparisons and modelling, noise level estimation from self-reported communication difficulty is appropriate.
Other aspects of the noise exposure calculation depend on the accuracy of self-reported hearing protection use and the accuracy of attenuation estimates for hearing protectors. There are no data from which we can verify hearing protector usage. Nor is there any way that we can know how well hearing protectors were placed on (muffs) or in (plugs) the ears, and hence how effectively they may have attenuated sound. It is well known that real-world attenuation is lower than the assumed attenuation derived from standard methods of measurement [3]. Most participants wore foam ERA plugs, for which we have estimated an attenuation value of 21 dB(A). This may appear to be an over-estimate, particularly if participants did not fit them deeply into the ear canals. The published data from Berger et al. [3] suggest a figure of approximately 13 dB for the assumed real-world protection of foam plugs. However, it should be recognised that the assumed protection is the protection exceeded in 84% of people, whereas for our analysis and modelling a mean figure would be more appropriate. The mean value can be estimated from the Berger et al. [3] data by adding one standard deviation, where the estimated standard deviation is approximately 8 dB. However, when applied to typical occupational noise levels measured in dB(A), this value should be reduced (the National Institute for Occupational Safety and Health in the US suggests a reduction of 7 dB). Therefore, the value of 21 dB that we have used may be too high and the estimates of noise exposure shown in Table 18 may be too low.
In addition to the attenuation value used in the calculation, the proportion of time hearing protection was worn is required. While it is possible to use this value mathematically in the estimation formula, the effective attenuation drops dramatically with even small proportions of non-use. Furthermore, participants may easily exaggerate the proportion of time used, omitting short periods of non-use. Therefore, we used a binary approach: the full attenuation value was used when participants reported using hearing protection all of the time or virtually all of the time, otherwise attenuation was assumed to be 0 dB.
The remaining information used to estimate noise exposure is the duration of exposure, which is calculated from self-reports of hours per day, days per week, weeks per year and years of exposure. The procedure is reliant on the participants’ ability to recall this information and was based on typical duration for tasks, not maximum, so as not to results in over-estimate of noise exposure.
5.1.8 Participant recruitment Companies and participants were recruited non-randomly to the study. The shortage of companies willing to participate and the limited numbers of recruits in the companies entailed taking a convenience sample of both companies and participants within companies. This necessity almost certainly introduced a bias into company recruitment, with all companies having respectable records of health and safety behaviour with regard to noise. This poses a limitation on the conclusions that can be placed on the study. Greater weaknesses in compliance with the Regulations presumably exist in UK industry, but the effects of those cannot be quantified by the present study. Indeed, whilst recruitment into studies such as this relies on less
58
compliant companies volunteering to participate, there are clearly inherent methodological difficulties with getting a true representation of Regulations compliance UK-wide.
The way in which participants volunteered for the study made it impossible to assess whether there was a bias either in favour of perhaps individuals more susceptible to the effects of noise, or alternatively individuals who are less susceptible. People who were concerned about their hearing or who had noticed a change in hearing ability may have been more inclined to volunteer, but the study is unable to assess this.
5.2 COMPLIANCE WITH NOISE AT WORK REGULATIONS Generally observed weaknesses were identified as those where the average rating was less than half of the maximum available. The weaknesses were as follows.
• Does the assessment identify those employees exposed above the 1st, 2nd and peak action levels? Is the actual level of exposure indicated?
• In general, does the assessment provide the employer with sufficient information to allow the Regulations to be complied with?
• Where noise control measures are planned for future implementation, are the measures appropriate and is their implementation subject to specific and achievable timescales?
• Is the information, instruction and training appropriate to the levels of exposure and to allow the employees to carry out their duties under the Regulations and to protect themselves?
• Comment on overall quality and comprehensiveness of information, instruction and training.
• Is a system in place to ensure that hearing protection is maintained in an efficient state and replaced as necessary?
• Are noise control measures subject to review to ensure that exposures are reduced to the lowest level reasonably practicable (i.e. as new technologies or working practices become available)?
Improvements could be achieved by taking simple steps that would not entail much greater costs. For example, when noise surveys are undertaken, these should be planned in relation to the employees that may be at risk. It is not sufficient simply to measure the noise levels (Leq) at various locations. It is also necessary to identify the individuals that work in those areas and the durations of exposure. The information gathered must allow the noise dose accrued by any individual to be accumulated across different locations where they may work, in order to perform a risk assessment for each individual. Where categories of employees follow similar patterns, they may be dealt with as a group. It is only with such information that the employer can perform a proper risk assessment and hence comply with the regulations.
Improvement in the quality of information and training on the use of hearing protection would improve compliance in many companies. There needs to be a continuous programme of awareness raising and re-training to ensure that employees recognise the risks of noise exposure and protect themselves adequately. These activities should be documented. In addition, the need for replacement or maintenance of protective equipment must be reinforced.
Overall, a quality assurance process and an action plan for improvement are required and these need to be re-addressed at regular intervals. Clear identification of a person with responsibility for hearing conservation, who has sufficient authority to ensure the quality assurance and action plan are implemented, is fundamental.
59
5.3 POWER OF STUDY TO DETECT EFFECTS OVER TIME AND DIFFERENCES BETWEEN RISK GROUPS The power to detect differences in hearing threshold levels over time depends on the repeatability of hearing threshold determination (Tables 22-23). The critical difference is the smallest change that can be identified with confidence, which is in the range 10-20 dB for individual participants. For comparisons within groups, the difference decreases according to the square root of the number of participants in the groups. When comparing thresholds at visits 1 and 2, the number of participants overall was 92 and in the noise-exposed groups was 59. Therefore, the critical differences for group comparisons were in the range of approximately 1.0-2.5 dB. When comparing visits 1 and 3, the group sizes were slightly lower and the critical differences a little larger. For the OAE measures, the critical differences for individuals were in the range 7.5-12.5 dB. When comparing visits 1 and 2, the number of participants overall was 137 and in the noise-exposed group was 78. Therefore, the critical differences for group comparisons were in the range of approximately 0.6-1.4, with slightly larger values when comparing visits 1 and 3. In round figures, the study should be able to demonstrate mean changes between visits in the region of 2 dB for hearing threshold levels and 1 dB for OAEs.
When comparing risk groups, the sizes of groups were in the range approximately 25-40. Therefore, critical differences would be approximately 3 dB for audiometry and 2 dB for OAEs.
Power to detect differences between groups at each visit depends on the variation within groups. For hearing threshold levels, the SD values were in the range approximately 5-9 dB. Sizes at visit 1 for the low- and high-risk groups were 85 and 107. Therefore, the magnitude of a mean difference in hearing threshold that could be detected with an estimated power of 0.8 was approximately 2.5 dB. At visit 2 the group sizes were 35 and 24, giving power to detect differences of 4.3 dB; at visit 3 group sizes were 26 and 23, giving an estimated power to detect mean differences of 4.6 dB.
Corresponding SD values for OAEs were approximately 5-6 dB. Group sizes at visit 1 were 52 and 79 for the low- and high-risk groups. Therefore, the magnitude of a mean difference in the OAE measures that could be detected with a power of 0.8 was approximately 2 dB. At visit 2, group sizes were 41 and 40, giving power to detect differences of 2.5 dB; at visit 3 group sizes were 23 and 23, giving power to detect mean differences of approximately 3 dB.
The above values must be compared with the magnitude of the effects on hearing threshold levels and OAEs that might be expected to occur due to noise exposure. For a man or woman exposed to a daily steady noise level of 90 dB(A) without hearing protection for a year, the median expected hearing loss at 4 kHz is 3.3 dB, according to ISO 1999. After 2 years the expected loss is 5.3 dB; after 3 years 6.5 dB. At a noise level of 85 dB(A), the corresponding hearing loss values are 1.4, 2.3 and 2.9 dB. Changes in OAEs are expected to be of a similar magnitude [50]. An exposure at 90 dB(A) for 1 year is equivalent to 1 unit, defined as material exposure above. Tables 18-21 show that the vast majority of participants had estimated noise exposures below 1 unit, based on the assumptions about use and effectiveness of hearing protection. However, if hearing protection had not been used effectively, participants would have received noise levels at the ear in the range from 85 to over 90 dB(A), as can be seen from the dosimetry data shown in Table 17. The average level is approximately 88-89 dB(A). If hearing protector usage were ineffective, expected mean hearing loss due to noise at 4 kHz calculated from ISO 1999 would be approximately 2.6 dB after 1 year, 4.2 dB after 2 years and 5.3 dB after 3 years; the study would probably be able to show significant group differences at least between the non-exposed controls and the noise-exposed participants. The study would also probably be able to show gross differences between effectiveness of hearing protector usage across the low- and high-risk groups.
For social noise, the high social noise group had a geometric average exposure of 3.6 units and ISO 1999 would predict 6.0 dB greater hearing loss at 4 kHz than in the low social noise
60
exposure group. For the standard deviations observed for hearing threshold level averaged across 3, 4 and 6 kHz and across right and left ears, the group sizes gave an 80% power to detect a difference of 2.0 dB. In fact, the study showed a significant difference of 1.7 dB. For the OAE measures, the study had 80% power to detect a difference of 2.7 dB, whereas actual differences were less than 0.6 dB (not significant). Following visit 1, very few participants received material social noise exposure. Similarly, for gunfire noise, very few participants received material exposure. In both of these circumstances, the study would have insufficient power to detect effects of exposure.
5.4 COMPARISONS WITH PUBLISHED LITERATURE Previous longitudinal studies involving measurement of hearing thresholds and OAEs in people exposed to noise have been outlined in the Chapter 2. Several of those studies involved military exposure to noise from weapons, which may not be comparable to the present study. Weapons produce impulsive noise with high instantaneous sound pressure levels that may be as high as 180-190 dB. Even when hearing protection is worn, the sound pressure levels reaching the ear may exceed levels allowable in the Regulations. However, the impulses are discrete events and may be separated by extensive periods of relative quiet, potentially enabling the inner ear to recover. Nonetheless, without hearing protection, or with poorly positioned hearing protection, the very high sound pressure levels my cause acute structural damage to the inner ear, by a mechanism that is quite different to that involved with chronic exposure to lower steady noise levels. Consequently, comparison of studies of military impulse noise with the present study is questionable.
Longitudinal studies of non-impulsive noise are rare and limited by restricted participant numbers, lack of knowledge of noise exposures affecting individuals, uncertainty about the extent and effectiveness of hearing protection, variations in age and variation in initial hearing status. Older participants may have already accrued hearing loss at the start of the study, leaving them less likely to show further hearing loss. Similarly, participants with hearing loss for other reasons at the start of the study may show less change in hearing due to noise. Alternatively, preceding damage to the cochlea could reduce the reserves of available hair cells and make the cochlea more prone to the effects of noise exposure. Studies also generally suffer from confounding by the effects of social noise, which is not quantified in many studies. Lack of appropriate controls is also generally a problem. These difficulties, of course affect the present study also, although we have restricted the age and auditory status of eligible participants and estimated concurrent exposure to social and gunfire noise.
The study by Shupak et al. [64] appears to have introduced the most rigorous controls. Participants comprised recruits to the Israeli Navy aged 18-20 years, divided into a group of 135 exposed to engine room noise in the range 87-117 dB(A) and 100 controls involved in office duties. All engine room operators regularly used moulded earplugs or earmuffs during their work shifts, but compliance was not monitored for the study. All participants had baseline hearing thresholds no greater than 20 dB at any frequency. The number of participants reduced to 42 noise-exposed and 45 controls after 2 years. The OAE measure employed in the study involved a conventional nonlinear protocol with clicks nominally at 80 dB pe SPL, which is higher than desirable to maximize sensitivity to hearing threshold shifts. Neither hearing threshold levels nor TEOAEs differed between noise-exposed and control groups after 1 year. Differences became apparent after 2 years. Mean hearing threshold shifts are not tabulated but appear from graphs to be approximately 5 dB at frequencies 4-6 kHz. Mean TEOAE shifts were approximately 2 dB at 2-4 kHz. These are somewhat larger than those in the present study (see Results Figures 13 and 18), which may reflect higher noise levels and/or less effective hearing protection in the Shupak et al. study.
The repeatability of hearing threshold level and OAE measures has been evaluated in few field studies. Our own previous study for the HSE entailed field measurements in a small sample
61
over an interval of approximately 9 months, involving techniques very similar to the present study. Critical differences obtained for the best OAE measures were in the region of 3-6 dB and for audiometry 9-12 dB. However, those measurements were performed by a doctoral student whose entire thesis was based on OAEs, which may exaggerate the repeatability that can be achieved in practice. The critical differences for OAEs in the present study were 7-5-12.5 dB, which are about twice as large but relate to a longer interval of 1-2 years. The estimates may be inflated by genuine variations in auditory status between measurements. Lapsley Miller et al. [38] used an alternative measure of significant threshold shift (STS), which is similar to the critical difference. Values of STS obtained for single audiometric frequencies were 15-25 dB, which compares with critical differences of 10-20 dB in the present study. For TEOAEs, the estimated significant emission shift (SES) values were 3.5-6.5 dB, which are lower than obtained in the present study. It is unclear why the repeatability of OAEs in the present study was poorer than expected from previous work and obtained in another comparable study. This limitation of the present study had an impact on the power of the study to demonstrate significant shifts in OAEs.
5.5 EFFECTIVENESS OF NOISE AT WORK REGULATIONS The main findings of the present study are a lack of significant differences in auditory function between the risk groups. This indicates that even the relatively high-risk group were not showing significant changes in auditory function compared to non-exposed controls. Nor were there significantly different changes between the relatively low- and high-risk groups. The levels of noise at the workplaces involved in the study and the durations of exposure were sufficient to cause shifts in hearing threshold levels that should have been detectable, if the Regulations had been ineffective. Therefore, within the limitations of the present study we were unable to show short-term lack of effectiveness of the Regulations in terms of prevention of damage to the auditory system. If the Regulations were entirely ineffective, that would have been apparent.
5.6 THEORETICAL AND PRACTICAL IMPLICATIONS Analyses of the effects of occupational, social and gunfire noise were unable to show significant correlation with estimated noise exposure, with the exception of comparison of the low and high social noise groups at visit 1 when participants with any other material noise exposure were excluded. For occupational and gunfire noise, this lack of association in to be expected, as the numbers of participants exposed to material amounts of noise were small. The same is true for social noise after visit 1.
For social noise exposure prior to visit 1, there was material exposure in more than half of participants and in 18 participants exposure exceeded 10 units (equivalent to exposure to 90 dB(A) for 10 years). The geometric mean numbers of in the low and high social noise exposure groups were 0.3 and 3.6 respectively. Based on ISO 1999, this difference would be expected to cause an excess hearing loss in the latter group at 4 kHz of 6.0 dB. However, the results showed a difference of only 1.7 dB. This contrast implies that either the method of estimation exaggerated social noise exposure, or that social noise exposure is less hazardous than expected from studies of occupational noise exposure. The fact that social noise exposure is an enjoyable activity might possibly influence risk, although this is merely conjecture. The pattern of intermittent exposure to relatively high noise levels, with extended quiet recovery periods may also reduce the harmful effects. At face value, the present study suggests that participants who have been exposed to high levels of social noise have only damaged their hearing minimally, on average. Insofar as the study participants are representative of young adults in the UK, there does not seem to be a major population risk to hearing from social noise, as was indicated in Smith et al [67]. That study showed no significant difference in hearing thresholds in those who had been exposed to material social noise compared to those who had
62
not. However, OAE amplitude at 2 kHz in the exposed group was significantly lower, suggesting some sub-clinical inner ear damage.
While the repeatability of OAEs obtained in the present study was better than for hearing threshold levels, it was poorer than expected. Furthermore, longitudinal studies published after the commencement of the present study have thrown some doubt on the usefulness of OAE measures to identify shifts in hearing threshold levels. For example, Lapsley Miller et al. [39] have shown combinations of all four combinations of changed/unchanged hearing thresholds and changed/unchanged OAEs. There were no significant correlations between changes in audiometric thresholds and changes in otoacoustic emissions. Nonetheless, they conclude that OAEs may show damage to the inner ears before changes are evident in the audiogram. A similar conclusion was reached by Ferguson et al [21]. Taking this evidence together, it is premature to recommend use of OAEs as an alternative to audiometry for monitoring in hearing conservation programmes. However, further research may show it has a supplementary role to play.
There are interesting indications from other studies that reduced TEOAE amplitude compared to the audiogram may be a predictor of subsequent noise-induced hearing loss. This is consistent with the model proposed by Bamiou and Lutman [2], whereby initial noise-induced damage involves loss of outer hair cells without change in hearing threshold level. This occurs because of redundancy in the system, whereby a partial complement of hair cells is sufficient to support normal hearing. However, the amplitude of OAEs may relate more closely to the number of functioning outer hair cells. Although the present study has not identified significant noise-induced hearing loss, and is therefore unable to test the above proposition, it is possible that future research will underpin the use of OAE measurement as a predictor of future noise-induced hearing loss. This raises the possibility of OAE measurements being used to identify personnel in whom effective use of hearing protection is a priority.
Although the present study was unable to show greater noise-induced hearing loss or reduced cochlear function in participants in the relatively high-risk (relatively low compliance) group, this does not mean that low compliance is acceptable. Observations from the study indicate where improvements could be made in the operation of hearing conservation programmes, to achieve better compliance with the Regulations. Improvements are identified in the section above and would not be expensive. The schedule used in the present study was useful to highlight shortcomings in compliance with the Regulations and could be developed as a tool to assist companies in self-assessment of their procedures. It would not be difficult to develop the schedule into an internet-based tool available to heath and safety managers.
5.7 SUGGESTIONS FOR FURTHER WORK Further work should focus on the relationship between the onset of noise-induced hearing loss and OAEs. This can best be achieved in longitudinal studies, although such studies are difficult to implement. Ideally, participants should be exposed to sufficient noise so that there is measurable hearing loss in a reasonably short time to fit into a feasible study duration. This implies substantial ethical problems and may entail the identification of special populations where a degree of hazardous noise exposure is acceptable.
Findings of such studies are of interest either if there is agreement between hearing thresholds and OAEs or if there are differences. Agreement would support the notion that OAEs can be used instead of audiometry to identify noise-induced hearing damage at the earliest opportunity. Differences between the development of noise-induced hearing loss and changes in OAEs may help to further understanding of the mechanisms of hearing loss. If reduction of OAEs can be shown to be a pre-cursor of noise-induced hearing loss, as has been intimated by previous studies and is consistent with some theoretical models, there may be a practical application of OAEs in hearing conservation programmes. By identifying individuals with decreasing OAE
63
amplitude, or with already reduced OAEs, it may be possible to highlight those who are particularly at risk of noise-induced hearing loss. Such individuals could be targets for extra surveillance or intensive training and instruction on the need for and use of hearing protection.
The limited duration of the present study limited the magnitude of any effects of noise that might occur. Ideally the study would continue for several further years. However, attrition of participant numbers was already problematic over 2-3 years and the difficulties posed by a longer study should not be under-estimated.

64
65
6 CONCLUSIONS AND RECOMMENDATIONS
1. For the levels of occupational noise encountered in the present study, which were in the range 85-94 dB(A) in terms of Leq, measures that were in place in the companies recruited into this study were sufficient to avoid detectable noise-induced changes in auditory function over a period of approximately 3 years. The study had power to detect noise-induced hearing deterioration at a rate of approximately 1-2 dB per year.
2. There was no detectable variation of auditory function consistent with variation of compliance with the Regulations. In other words, insofar as compliance varied across the companies involved in the study, there was no evidence to suggest that lower compliance leads to greater risk of noise-induced hearing loss. The extent of compliance demonstrated by the companies in the study appears to be sufficient to conserve auditory function in people exposed to the moderate noise levels encountered for 3 years.
3. Compliance with the Noise at Work Regulations, or the Control of Noise at Work Regulations, could be improved by attention to specific aspects. Noise surveys must be linked to the exposure patterns of individuals so that risk assessments can be performed at the level of the individual. There needs to be a continuous programme of awareness raising and re-training to ensure that employees recognise the risks of noise exposure and protect themselves adequately. Quality assurance processes and action plans for improvements are required and these need to be re-addressed at regular intervals. Clear identification of a person with responsibility for hearing conservation, who has sufficient authority to ensure the quality assurance and action plan are implemented, is fundamental.
4. A small effect of social noise exposure accumulated before the study was evident, amounting to a mean threshold shift of less than 2 dB averaged over the frequencies 3, 4 and 6 kHz. No effect on otoacoustic emissions was detectable. The small mean threshold shift was less than predicted from the estimated social noise exposure and may arise from over-estimation of exposure. Alternatively, irregular patterns of social noise exposure may be less hazardous than regular exposure to occupational noise containing the same sound energy, or other characteristics of social noise may make it less hazardous.
5. Audiometry as practised in industry is not particularly sensitive for identifying noise-induced hearing loss, due to intrinsic test-retest variability. Changes in hearing threshold in the region of 15 dB are required before confidence can be attached to any changes within individuals.
6. It is not yet clear whether measurement of otoacoustic emissions is useful for monitoring auditory function in people exposed to noise. Although the measurements have shown some promise, it would be premature to implement practical programmes of otoacoustic emission measurement until further research provides a better base of evidence. It needs to be established whether changes in otoacoustic emissions may occur before changes in hearing threshold levels, thus indicating noise-induced damage at an earlier stage. Alternatively, it needs to be established whether audiometry and otoacoustic emissions may have complementary roles.
7. There are indications from previous studies that reduced otoacoustic emissions may act as a biomarker, being predictive of future susceptibility to noise-induced hearing loss. Further research is warranted to explore this possibility.
8. Longitudinal studies are difficult to implement and generally suffer from attrition of participants over time. Nonetheless, they are the only way to show noise-induced hearing loss directly and further efforts are required to implement studies with a longer duration than the present study, lasting perhaps 10 or even 20 years.

66
67
7 REFERENCES 1. Alberti P W. Noise and the ear. In: Scott-Brown’s Otolaryngology, Volume 2, Adult
Audiology, Stephens D (ed.). Oxford: Butterworth-Heinemann, 1997: 2/11/1-34.
2. Bamiou D, Lutman ME. Interaction of NIHL and ageing: epidemiological aspects. In: Luxon L, Prasher D (eds). Noise and its effects. Chichester: John Wiley, 2007; 64-84.
3. Berger EH, Franks JR, Llindgren F. International review of field studies of hearing protector attenuation. Chapter 29 in Axelsson A, Borchgrevink H, Hamernik R, Hellström P, Henderson D, Salvi RJ. Scientific basis of noise-induced hearing loss. New York: Thieme, 1996
4. British Society of Audiology. Pure tone air and bone conduction threshold audiometry with and without masking and determination of uncomfortable loudness levels. Reading: British Society of Audiology, 2004.
5. BS EN 60645-1. Electroacoustics - Audiological Equipment - Part 1: Pure-Tone Audiometers. London: BSI British Standards, 2001.
6. BS EN ISO 389-1. Acoustics. Reference zero for the calibration of audiometric equipment - Part 1: Reference equivalent threshold sound pressure levels for pure tones and supra-aural earphones. London: BSI British Standards, 2000.
7. BS EN ISO 389-3. Acoustics. Reference zero for the calibration of audiometric equipment - Part 3: Reference equivalent threshold force levels for pure tones and bone vibrators. London: BSI British Standards, 1999.
8. BS EN ISO 7029. Acoustics. Statistical distribution of hearing thresholds as a function of age. London: BSI British Standards, 2000.
9. BS EN ISO 8253-1. Acoustics. Audiometric test methods - Part 1: Basic pure tone air and bone conduction threshold audiometry. London: BSI British Standards, 1998.
10. Buller G, Lutman ME. Automatic classification of transiently evoked otoacoustic emissions using an artificial neural network, Br J Audiol 1998; 32: 235-247.
11. Burns W, Robinson DW. Hearing and noise in industry. London: HMSO, 1970.
12. Cane M A, Lutman M E, O'Donoghue G M. Transient evoked otoacoustic emissions in patients with cerebello-pontine angle tumours. American Journal of Otology 1994; 15: 207-216.
13. Cane M A, O'Donoghue G M, Lutman M E. The feasibility of using otoacoustic emissions to monitor cochlear function during acoustic neuroma surgery. Scand Audiol 1992; 21: 173-176.
14. Cope Y, Lutman M E. Otoacoustic emissions In: Paediatric Audiology 0-5 Years, Second Edition, McCormick B, ed. London: Whurr Publishers Ltd, 1993.
15. Davis A C. Longitudinal study of hearing. Acta Otolaryngol 1991; Suppl 476: 12-22.
16. Davis A, Smith P, Ferguson M, Lutman M. Hearing in young adults - Are those with high levels of leisure noise exposure different? Paper presented to Second European Conference on Protection Against Noise, London 16-19, 1997.
17. Davis A. Hearing in adults. London: Whurr, 1995.
18. Davis AC. The prevalence of hearing impairment and reported hearing disability amongst adults in Great Britain. Int J Epidemiol 1989; 18: 911-917.
68
19. Duvdevany A, Furst M. The effect of longitudinal noise exposure on behavioral audiograms and transient-evoked otoacoustic emissions. Int J Audol 2007; 46: 119-127.
20. Erlandsson B, Hakanson H, Ivarsson A, Nilsson R. Comparison of hearing threshold measured by manual pure-tone and by self-recording (Békésy) audiometry. Audiology 1979; 18: 414-429.
21. Ferguson MA, Smith PA, Davis AC, Lutman ME. Transient-evoked otoacoustic emissions in a representative population sample aged 18-25 years. Audiology 2000; 39: 125-134.
22. Gorga MP, Neely ST, Bergman BM, Beauchaine KL. A comparison of transient-evoked otoacoustic emissions in normal-hearing and hearing-impaired subjects. J Acoust Soc Am 1993; 94: 2693-2648.
23. Hall A J, Lutman ME. Methods for early identification of noise-induced hearing loss. Audiology 1999; 38: 277-280.
24. Hall, AJ. Otoacoustic emissions and hearing threshold. PhD thesis, University of Southampton, 2005.
25. Health and Safety Executive. Noise at Work Regulations 1989. Sudbury: HSE Books, 1989.
26. Health and Safety Executive. Control of Noise at Work Regulations 2005. Sudbury: HSE Books, 2005.
27. Hewitt P. The future of manufacturing industry. London: Merrill Lynch, 2002.
28. Hills K, Ferguson M, Davis A, Lutman M. Effectiveness of the Noise at Work Regulations II: Validation of reported speech communication difficulty to estimate occupational noise levels. Poster presented to the Annual Conference of the British Society of Audiology, 2005.
29. Hotz MA, Probst R, Harris FR, Hauser R. Monitoring the effects of noise exposure using transiently evoked otoacoustic emissions. Acta Otolaryngol 1993, 113, 478-482.
30. IEC 651.Sound level meters. Geneva: International Electrotechnical Commission, 1979.
31. ISO 1999. Acoustics – Determination of occupational noise exposure and noise induced hearing impairment. Geneva: International Organization for Standardization, 1990.
32. ISO 7029. Acoustics. Statistical distribution of hearing thresholds as a function of age. Geneva: International Organization for Standardization, 2000.
33. Johnson AC, Juntunen L, Nylen P, Borg E, Hoglund G. (1988) Effect of interaction between noise and toluene on auditory function in the rat. Acta Otolaryngol; 105: 56–63.
34. Kapadia S, Lutman M E. Detailed investigations into ears with weak transiently evoked otoacoustic emissions: Distortion product measurements. Br J Audiol 1996; 30: 98-9.
35. Kapadia S, Lutman M E. Are normal hearing thresholds a sufficient condition for click- evoked otoacoustic emissions? J Acoust Soc Am 1997; 101: 3566-3576.
36. Konopka W, Pawlaczyk-Luszczynska M, Sliwinska-Kowalska M, Grzanka A, Zalewski P. Effects of impulse noise on transiently evoked otoacoustic emission in soldiers. Int J Audol 2005; 44: 3-7.
37. Kvaerner KJ, Engdahl B, Arnesen AR, Mair IWS. Temporary threshold shift and otoacoustic emissions after industrial noise exposure. Scand Audiol 1995, 24; 137-141.
38. Lapsley Miller JA, Marshall L, Heller LM. A longitudinal study of changes in evoked otoacoustic emissions and pure-tone thresholds as measured in a hearing conservation program. Int J Audol 2004; 43:307–322.
69
39. Lapsley Miller JA, Marshall L, Heller LM, Hughes LM. Low-level otoacoustic emissions may predict susceptibility to noise-induced hearing loss. J. Acoust. Soc. Am. 2006; 120: 280-296.
40. Lower M C, Lawton B W, Lutman M E, Davis R A. Noise from toys and its effect on hearing, Report C/CSU/4754. London: Department of Trade and Industry, 1997.
41. Lutman M E. Evoked otoacoustic emissions in adults: implications for screening. Audiology in Practice 1989; 6(3): 6-8.
42. Lutman M E. Reliable identification of click-evoked otoacoustic emissions using signal-processing techniques. Br J Audiol 1993; 27: 103-108.
43. Lutman M E, Cane M A. Effects of stimulus rate on the input-output function of transient otoacoustic emissions obtained using maximum length sequences. Br J Audiol 1993; 27: 364.
44. Lutman M E, Cane M A, Smith P A. Comparison of manual and computer-controlled self-recorded audiometric methods for serial monitoring of hearing. Br J Audiol 1989; 23: 305-315.
45. Lutman M E, Davis A C. Distributions of hearing threshold levels in populations exposed to noise. In: Scientific Basis of Noise-Induced Hearing Loss, Axelsson A, Borchgrevink H, Hamernik R P, Helström P, Henderson D, Salvi R J, eds. New York: Thieme Medical Publishers, 1996: 378-396.
46. Lutman M E, Davis A C. The distribution of hearing threshold levels in the general population aged 18-30 years, Audiology 1994; 33: 327-350.
47. Lutman ME, Davis AC, Fortnum HM, Wood S. Field sensitivity of targeted neonatal hearing screening by transient-evoked otoacoustic emissions. Ear Hear 1997; 18: 265-276.
48. Lutman ME, Davis AC, Spencer H. Occupational noise and demographic factors in hearing, Acta otolaryngologica 1991, Suppl 476: 74-84.
49. Lutman M E, Davis A C, Spencer H S. Interpreting NIHL by comparison of noise exposed subjects with appropriate controls. In: Noise & Man '93. Noise as a Public Health Problem. Proceedings of the 6th International Congress, 5-9 Juillet 1993, Volume 3, Vallet M, ed.. Actes INRETS No. 34, Institut National de Recherche sur les Transports et leur Sécurité, Arcueil, France, 1993: 114-121.
50. Lutman M E, Hall A J. Novel methods for early identification of noise-induced hearing loss. Draft report to HSE, 1999.
51. Lutman ME, Gatehouse S, Worthington K. Frequency resolution as a function of hearing threshold level and age, J Acoust Soc Am 1989; 89: 320-328.
52. Lutman M E, Jennings K, Davis A C Houston H G, Meredith R, Coloration of click- evoked otoacoustic emissions by characteristics of the recording apparatus. In: Advances in otoacoustic emissions - Volume I. Fundamentals and clinical applications, Grandori F, ed., Milan: Commission of the European Communities, Directorate-General for Science, Research and Development, Biomedical and Health Research Programme, 1994, 36-47.
53. Lutman M E, Mason S M and Sheppard S. Differential diagnostic potential of otoacoustic emissions: A case study. Audiology 1989; 28:205-210.
54. Lutman M E, Saunders G H. Lack of association between otoacoustic emissions and hearing difficulty in subjects with normal hearing thresholds. J Acoust Soc Am 1992; 92: 1184-1185.
70
55. Marshall L, Heller LM. Reliability of transient-evoked otoacoustic emissions. Ear Hear. 1996; 17: 237–254.
56. MRC Institute of Hearing Research. Damage to hearing arising from leisure noise, a review of the literature. Br J Audiol 1986; 20: 157-164.
57. Office of Population Censuses and Surveys. Classification of occupations. London: HMSO, 1990.
58. Parazzini M, Hall AJ, Lutman ME, Kapadia S, Effect of aspirin on phase gradient of 2f1-f2 distortion product otoacoustic emissions, Hearing Research, 205, 2005, 44-52.
59. Plinkert PK, Hemmert W, Zenner HP. Methodenvergleich zur fruherkennung einer larmvulnerabilitat es innerohres. Amplitudenreduktion otoakusticher emissionen am empfindlichsten bei subriskanter impulsschallreizung. HNO 1995, 43; 89-97.
60. Probst R, Lonsbury-Martin BL, Martin GK. A review of otoacoustic emissions. J Acoust Soc Am 1989; 89; 2027-2067.
61. Robinson DW. Noise exposure and hearing: A new look at the experimental data. Health and Safety Executive Contract Research Report No. 1., 1987.
62. Schäper M, Demes P, Zupanic M, Blaszkewicz M, Seeber A. Occupational Toluene Exposure and Auditory Function: Results from a Follow-up Study. Ann. Occup. Hyg. 2003; 47: 493–502.
63. Seixas NS, Kujawa SG, Norton S, Sheppard L, Neitzel R, Slee A. Predictors of hearing threshold levels and distortion product otoacoustic emissions among noise exposed young adults. Occup Environ Med 2004; 61: 899–907.
64. Shupak A, Tal D, Sharoni Z, Oren M, Ravid A, Pratt H. Otoacoustic Emissions in Early Noise-Induced Hearing Loss. Otol Neurotol 2007; 28: 745-752.
65. Sliwinska-Kowalska M, Kotylo P. Otoacoustic emissions in industrial hearing loss assessment. Noise & Health 3(12), 75-84.
66. Smith P, Davis A, Ferguson M, Lutman M. Hearing in young adults: Report to ISO/TC43/WG1, Noise & Health 1999; 4: 1-10.
67. Smith P, Davis A, Ferguson M, Lutman M. The prevalence and type of social noise exposure in young adults in England. Noise and Health 2000; 6: 41-56.
68. Smith PA, Davis AC, Ferguson MA, Lutman ME. The effect of social noise exposure on hearing threshold levels in young adults. Paper presented to Second European Conference on Protection Against Noise, London 16-19, 1997.
69. Thornton A R D. High rate otoacoustic emissions. J Acoust Soc Am 1993; 94: 132-136.
71
APPENDIX 1: COMPANY RECRUITMENT LEAFLET EPIDEMIOLOGICAL EVIDENCE FOR THE EFFECTIVENESS OF THE NOISE AT
WORK REGULATIONS
Aim of Study:
The aim of the present investigation is to confirm that current regulations in place designed to protect employees hearing in the workplace (the Noise at Work Regulations) are effective in preventing the onset of noise induced hearing loss. The study will assess whether any discernible benefit will arise from tightening the controls already in place.
How can your company help?
The study will monitor the hearing of a sample of recent recruits over a period of three years. We would greatly appreciate your assistance in providing suitable volunteers. The volunteers would have been recruited within the last two years and be 16 to 25 years of age. A volunteer will simply be required to undergo some basic hearing tests, none of which are at all invasive or unpleasant.
The chosen participants would initially be required to partake in a study of audiometry, which is a basic measure of hearing. The interview and hearing tests involved would take approximately two hours and can be carried out on site.
After this initial testing, subsequent annual visits will be made by our researchers to carry out a brief test on the participants, which takes approximately 20 minutes, plus a short interview. We will also assess noise levels in the working environment (these measurements in the workplace are solely for the use of the researchers and on no accounts will be divulged to any third party, including the Health and Safety Executive).
Finally, there will be another set of tests to replicate the initial testing carried out.
In addition, we will contract a specialist agency to visit your company and perform an assessment of how you are implementing the Noise at Work Regulations. This information will also be kept strictly confidential.
What’s in it for my company?
The benefits to your company can be seen as follows:
• To reinforce to employees the importance of protecting their hearing. Often hearing protection is provided, but not worn.
• To highlight good working practices, and the importance of the health and safety of your workforce.
• If your employees give consent you will receive copies of their hearing test results.
• We pay for an independent noise assessor to visit your company and copies of their findings will be made available to you.
• The study is of national importance, and you will receive feedback from the results obtained at the end of the study.
What do the volunteers get out of it?
• Volunteers taking part in the study will have their hearing levels tested by highly trained hearing professionals, and if they remain in the study, monitored over a three-year period.
• They will become more aware of how hearing levels can change, and how this can be exacerbated by noise exposure in the work place and during leisure activities. By understanding this, the importance of using any noise protection provided at work will become clearer.
72
• They will be a part of a nationally important study which may influence the ‘Noise at Work Regulations’, and through that be of benefit to everyone working in industry across the UK.
• As a thank-you, £10.00 will be given to each volunteer at each stage of testing.
What happens next?
The next step is that we would like to arrange a visit for one of our researchers to visit you to discuss the project further and answer any queries you might have. This meeting will be an ideal time to raise any issues of concern and develop a rapport between you (as the main point of contact) and our research team. Alternatively, you can contact the research team using the contact list overleaf.
Contacts Nottingham:
Miss Kezia Hills, MRC Institute of Hearing Research, Clinical Section, Eye, Ear, Nose and Throat Centre, Queen’s Medical Centre, Nottingham, NG7 2UH E-mail: [email protected] Tel: (0115) 849 3351
Ms Melanie Ferguson, MRC Institute of Hearing Research, Address and phone as above. E-mail: [email protected]
Southampton:
Mr Graham Horswell, Institute of Sound and Vibration Research (HABC), University of Southampton, Highfield, Southampton SO17 1BJ E-mail: [email protected] Tel: (023) 8059 7604
Prof Mark E Lutman, Institute of Sound and Vibration Research (HABC), Address and phone as above. E-mail: [email protected]
EPIDEMIOLOGICAL EVIDENCE FOR THE EFFECTIVENESS OF THE NOISE AT WORK REGULATIONS
400
600
800
1000
1200
1400
1600
M i l l i s e c o n d s
73
APPENDIX 2 COMPANY CONSENT FORM
Re: Study on Epidemiological Evidence for the Noise at Work Regulations This form is to confirm that your company has consented to: (i) allow staff from the MRC Institute of Hearing Research to test members of staff as
participants in the above study (ii) allow an independent noise assessor to visit to assess the noise levels in the workplace. In signing the form you will also be agreeing that any copies of the participant’s hearing test results that your company will receive, will not be used to that individual’s detriment, therefore complying with the data protection act. Company Name __________________________________________ (Please print) Your Name ______________________________________________ (Please print) Job Title ________________________________________________ Signature___________________________________________ Date _____________ Witness Name____________________________________________ Witness Signature ____________________________________ Date ____________
MRC Institute of Hearing Research Clinical Section Eye, Ear Nose and Throat Centre Queen’s Medical Centre Nottingham NG7 2UH United Kingdom
Telephone (0115) 849 3351 International +44 115 849 3351 Fax (0115) 849 3352
Website www.ihr.mrc.ac.uk E-mail [email protected]
74
APPENDIX 3 PARTICIPANT INFORMATION SHEET
EPIDEMIOLOGICAL EVIDENCE FOR THE NOISE AT WORK REGULATIONS
Introduction
Noise-induced hearing loss (NIHL) accrued in industry is the most common preventable form of hearing impairment, accounting for at least a third but maybe up to a half of hearing impairments in people under 50 years old. NIHL occurs progressively and often unnoticed until it has reached a certain degree where the damage is irreversible. Most of this damage will have occured within the first five years of working life. The Noise at Work Regulations ensure that employees are not exposed to levels of noise that may cause NIHL.
What is the purpose of the study?
The aim of the project is to confirm that the Noise at Work Regulations, designed to protect employees hearing in the work place, are effective in preventing the onset of noise induced hearing loss. To do this, we intend to monitor the hearing of several hundred workers aged between 16 and 25 years across a 3-year period to see if hearing changes. We will also measure the noise levels at your workplace. This project is of national importance and will be of benefit to everyone working in industry in the United Kingdom.
The research project is to be carried out in two geographical areas, one based in the clinical section of the MRC Institute of Hearing Research (IHR) in Nottingham and the other in the Institute of Sound and Vibrational Research based at Southampton University.
Do I have to take part?
The company that you work for has agreed to take part in this research project, which means that we have been able to contact you with regards to taking part in the project. However this does not mean that you have to take part in this project, as participation is voluntary.
If you do decide to take part you will be asked to sign a consent form. You will still be free to withdraw from the project at any time and, without giving a reason.
What happens if I take part?
If you decide to take part, you will be required to attend an initial screening session at your place of work for some hearing tests. If you are a suitable candidate, a member of our team will also visit you at your work place annually in order to test your hearing. You will be offered a £10.00 attendance fee for each set of tests you take part in. Each visit is described in some detail overleaf.
Visits 1 and 4 These visits will last approximately two hours. Each visit will comprise of a series of simple hearing tests, where you will be asked to press a button when you hear a sound. There will also be a test where you will be asked to sit still while noises are played and recorded in your ear via a small probe that is smaller than an ear plug and sits in your ear. We will then ask you some questions about your exposure to leisure and occupational noise. Any information obtained during this and any consecutive visits will remain completely confidential, unless you give prior consent for your employer to receive a copy of your hearing test results. If your hearing is normal we will continue seeing you as part of the study. If there is a problem with your hearing we will explain this and advise on further action.
75
Visits 2 and 3
A representative from the IHR will visit you at your work place annually after your initial test session. During this visit a shorter hearing test will be carried out and you will then be asked questions about leisure and occupational noise, as before. This visit is expected to last for 20 minutes and will take place at the beginning of your working day.
What are the benefits of taking part?
You will have your hearing levels tested by highly trained hearing professionals, and if you remain in the study, your hearing will be monitored over a three-year period.
You will become more aware of how your hearing levels can change, and how this can be exacerbated by noise exposure in the work place and during leisure activities. By understanding this, the importance of using any noise protection provided at work will become clearer. Also guidance on how you can ensure your hearing is maintained at optimum age/hearing levels throughout your lifetime will be provided.
You will be a part of a nationally important study, which may influence the ‘Noise at Work Regulations’, and through that be of benefit to everyone working in industry across the UK.
Who is organising the study?
The Medical Research Council’s Institute of Hearing Research and The Institute of Sound and Vibration Research are organising and carrying out the research project.
Confidentiality
All information that you give us will be kept confidential. The company that you work for will not receive any information relating to a specific individuals hearing without their prior consent.
The results of this research project will be widely available, however names of individual subjects will not be included in any reports that are published from the project.
If you have any queries or problems with the research project, the staff will be happy to help, either over the telephone or, at your appointments. If you should wish to make a complaint, we will always take the matter seriously and investigate it thoroughly according to the Medical Research Councils complaints procedure.
What if there is something wrong?
If during the course of your participation in the research trial a deficit in your hearing, or a problem with your ears is noticed, you will be informed and advised to visit your GP. While the member of staff that assesses you is a professional audiologist they do not hold a medical qualification.
Other concerns
If you have any other questions that you would like to ask, or you feel that you need more information about any aspect of the research project before making up your mind, please feel free to contact the MRC Institute of Hearing Research directly, either by telephone or post (contact details at the top of page 1). Alternatively you can e-mail your query to [email protected]
Thank you for reading this information leaflet and we hope that we will see you in the near future.
76
APPENDIX 4 PARTICIPANT CONSENT FORM
Title of Project: Epidemiological evidence for the effectiveness of the noise at work regulations
Name of Investigators: Kim Holmes, Melanie Ferguson
Healthy Volunteer’s Consent Form
Please read this form and sign it once the above named or their designated representative, has explained fully the aims and procedures of the study to you
• I voluntarily agree to take part in this study.
• I confirm that I have been given a full explanation by the above named and that I have read and understand the information sheet given to me which is attached.
• I have been given the opportunity to ask questions and discuss the study with one of the above investigators or their deputies on all aspects of the study and have understood the advice and information given as a result.
• I agree to the above investigators contacting my general practitioner [and teaching or university authority if appropriate] to make known my participation in the study where relevant.
• I agree to comply with the reasonable instructions of the supervising investigator and will notify him immediately of any unexpected unusual symptoms or deterioration of health.
• I authorise the investigators to disclose the results of my participation in the study but not my name.
• I understand that information about me recorded during the study will be kept in a secure database. If data is transferred to others it will be made anonymous. Data will be kept for 7 years after the results of this study have been published.
• I authorise the investigators to disclose to me any abnormal test results.
• I understand that I can ask for further instructions or explanations at any time.
• I understand that I am free to withdraw from the study at any time, without having to give a reason for withdrawing.
• I confirm that I have disclosed relevant medical information before the study.
• I shall receive an inconvenience allowance of £10.00 per session, plus travel expenses.
• I have not been a subject in any other research study in the last three months which involved: taking a drug; being paid a disturbance allowance; having an invasive procedure (eg venepuncture >50ml, endoscopy) or exposure to ionising radiation.
MRC Institute of Hearing Research Clinical Section Eye, Ear Nose and Throat Centre Queen’s Medical Centre Nottingham NG7 2UH United Kingdom
77
• I confirm that I have not been exposed to more than 5 mSv of ionising radiation in the last 12 months.
• I authorise the investigators to disclose the results of my hearing test to my employers. (delete this if not applicable)
Name: …………………………………………………………………………………………
Address: ……………………………………………………………………………………..
Telephone number: ………………………………………………………………………….
Signature: …………………………………………. Date: ……………………………….
I confirm that I have fully explained the purpose of the study and what is involved to:
………………………………………………………………………………………………….
I have given the above named a copy of this form together with the information sheet.
Investigators Signature: ……………………….. Name: ………………………………
Study Volunteer Number: …………………………………………………………………..
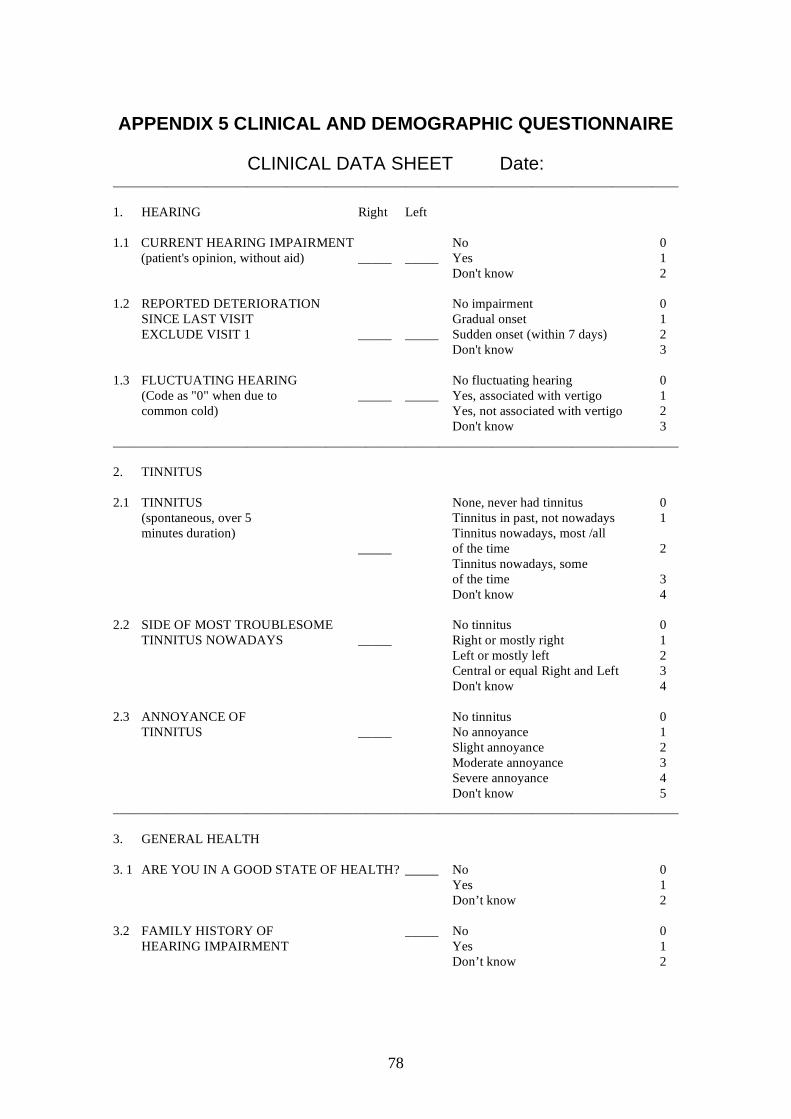
78
APPENDIX 5 CLINICAL AND DEMOGRAPHIC QUESTIONNAIRE
CLINICAL DATA SHEET Date: _____________________________________________________________________________________ 1. HEARING Right Left 1.1 CURRENT HEARING IMPAIRMENT No 0
(patient's opinion, without aid) _____ _____ Yes 1 Don't know 2 1.2 REPORTED DETERIORATION No impairment 0 SINCE LAST VISIT Gradual onset 1 EXCLUDE VISIT 1 _____ _____ Sudden onset (within 7 days) 2 Don't know 3 1.3 FLUCTUATING HEARING No fluctuating hearing 0 (Code as "0" when due to _____ _____ Yes, associated with vertigo 1 common cold) Yes, not associated with vertigo 2 Don't know 3 _____________________________________________________________________________________ 2. TINNITUS 2.1 TINNITUS None, never had tinnitus 0 (spontaneous, over 5 Tinnitus in past, not nowadays 1 minutes duration) Tinnitus nowadays, most /all _____ of the time 2 Tinnitus nowadays, some of the time 3 Don't know 4 2.2 SIDE OF MOST TROUBLESOME No tinnitus 0 TINNITUS NOWADAYS _____ Right or mostly right 1 Left or mostly left 2 Central or equal Right and Left 3 Don't know 4 2.3 ANNOYANCE OF No tinnitus 0 TINNITUS _____ No annoyance 1 Slight annoyance 2 Moderate annoyance 3 Severe annoyance 4 Don't know 5 _____________________________________________________________________________________ 3. GENERAL HEALTH 3. 1 ARE YOU IN A GOOD STATE OF HEALTH? _____ No 0 Yes 1 Don’t know 2 3.2 FAMILY HISTORY OF _____ No 0 HEARING IMPAIRMENT Yes 1 Don’t know 2
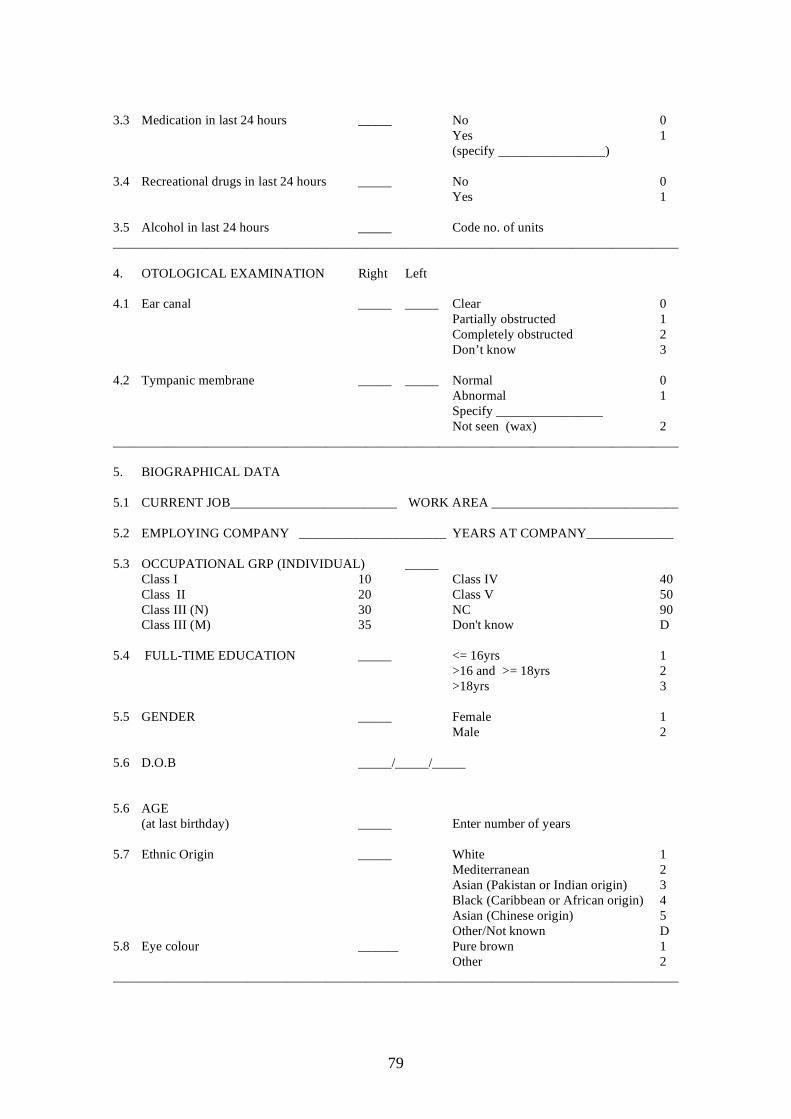
79
3.3 Medication in last 24 hours _____ No 0 Yes 1 (specify ________________) 3.4 Recreational drugs in last 24 hours _____ No 0 Yes 1 3.5 Alcohol in last 24 hours _____ Code no. of units _____________________________________________________________________________________ 4. OTOLOGICAL EXAMINATION Right Left 4.1 Ear canal _____ _____ Clear 0 Partially obstructed 1 Completely obstructed 2 Don’t know 3 4.2 Tympanic membrane _____ _____ Normal 0 Abnormal 1 Specify ________________ Not seen (wax) 2 _____________________________________________________________________________________ 5. BIOGRAPHICAL DATA 5.1 CURRENT JOB_________________________ WORK AREA ____________________________ 5.2 EMPLOYING COMPANY ______________________ YEARS AT COMPANY_____________ 5.3 OCCUPATIONAL GRP (INDIVIDUAL) _____ Class I 10 Class IV 40 Class II 20 Class V 50 Class III (N) 30 NC 90 Class III (M) 35 Don't know D 5.4 FULL-TIME EDUCATION _____ <= 16yrs 1 >16 and >= 18yrs 2 >18yrs 3 5.5 GENDER _____ Female 1 Male 2 5.6 D.O.B _____/_____/_____ 5.6 AGE (at last birthday) _____ Enter number of years 5.7 Ethnic Origin _____ White 1 Mediterranean 2 Asian (Pakistan or Indian origin) 3 Black (Caribbean or African origin) 4 Asian (Chinese origin) 5 Other/Not known D 5.8 Eye colour ______ Pure brown 1 Other 2 _____________________________________________________________________________________
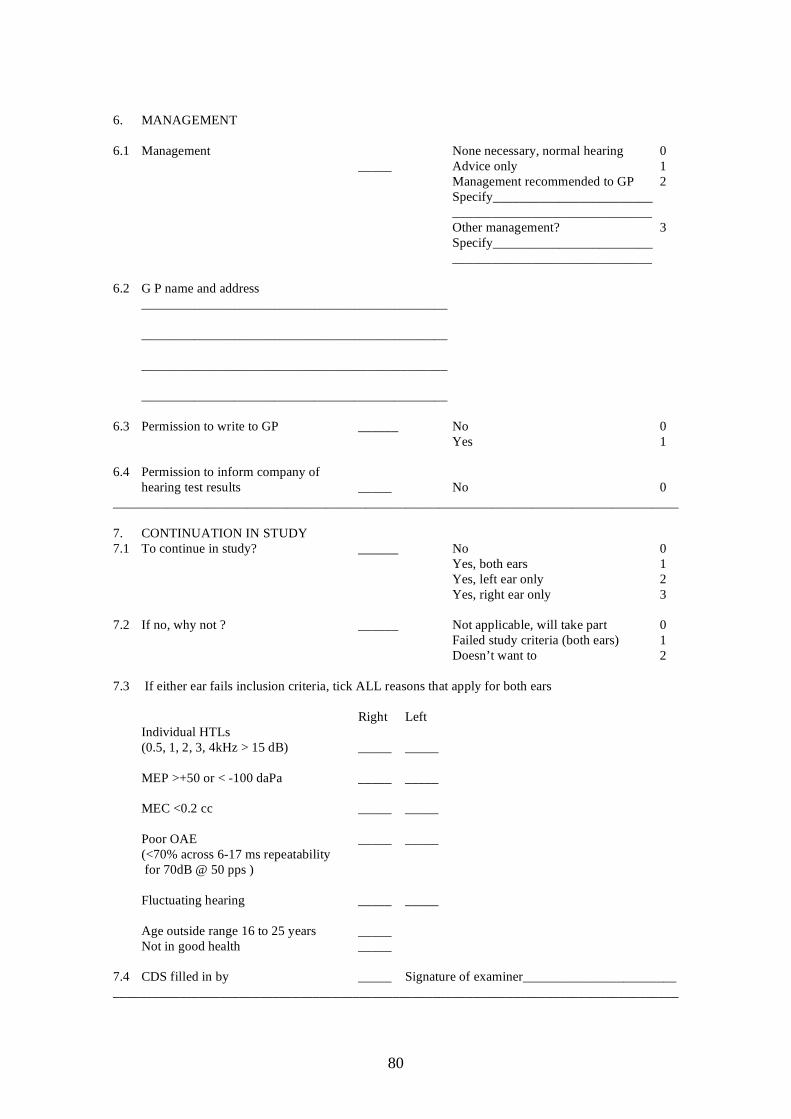
80
6. MANAGEMENT 6.1 Management None necessary, normal hearing 0 _____ Advice only 1 Management recommended to GP 2 Specify________________________ ______________________________ Other management? 3 Specify________________________ ______________________________ 6.2 G P name and address ______________________________________________ ______________________________________________ ______________________________________________ ______________________________________________ 6.3 Permission to write to GP ______ No 0 Yes 1 6.4 Permission to inform company of hearing test results _____ No 0 _____________________________________________________________________________________ 7. CONTINUATION IN STUDY 7.1 To continue in study? ______ No 0 Yes, both ears 1 Yes, left ear only 2 Yes, right ear only 3 7.2 If no, why not ? ______ Not applicable, will take part 0 Failed study criteria (both ears) 1 Doesn’t want to 2 7.3 If either ear fails inclusion criteria, tick ALL reasons that apply for both ears Right Left Individual HTLs (0.5, 1, 2, 3, 4kHz > 15 dB) _____ _____ MEP >+50 or < -100 daPa _____ _____ MEC <0.2 cc _____ _____ Poor OAE _____ _____ (<70% across 6-17 ms repeatability for 70dB @ 50 pps ) Fluctuating hearing _____ _____ Age outside range 16 to 25 years _____ Not in good health _____ 7.4 CDS filled in by _____ Signature of examiner_______________________ _____________________________________________________________________________________
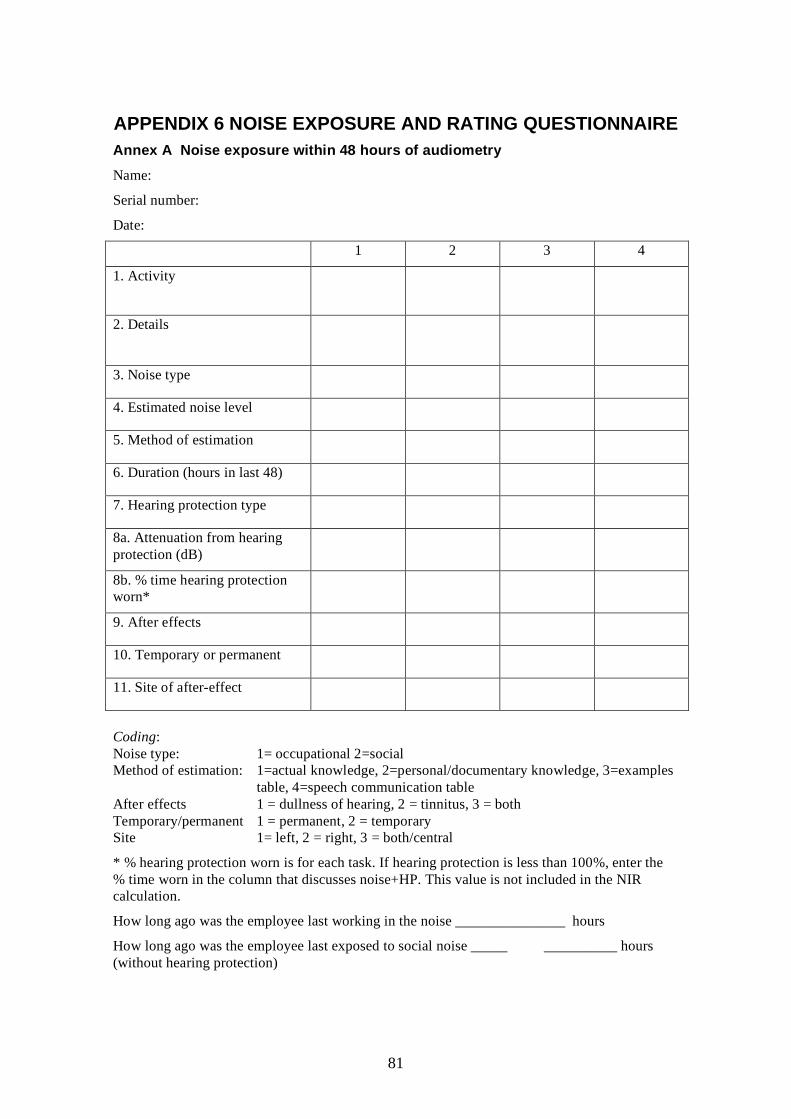
81
APPENDIX 6 NOISE EXPOSURE AND RATING QUESTIONNAIRE Annex A Noise exposure within 48 hours of audiometry Name:
Serial number:
Date:
1 2 3 4
1. Activity
2. Details
3. Noise type
4. Estimated noise level
5. Method of estimation
6. Duration (hours in last 48)
7. Hearing protection type
8a. Attenuation from hearing protection (dB)
8b. % time hearing protection worn*
9. After effects
10. Temporary or permanent
11. Site of after-effect
Coding: Noise type: 1= occupational 2=social Method of estimation: 1=actual knowledge, 2=personal/documentary knowledge, 3=examples
table, 4=speech communication table After effects 1 = dullness of hearing, 2 = tinnitus, 3 = both Temporary/permanent 1 = permanent, 2 = temporary Site 1= left, 2 = right, 3 = both/central
* % hearing protection worn is for each task. If hearing protection is less than 100%, enter the % time worn in the column that discusses noise+HP. This value is not included in the NIR calculation.
How long ago was the employee last working in the noise _______________ hours
How long ago was the employee last exposed to social noise _____ __________ hours (without hearing protection)
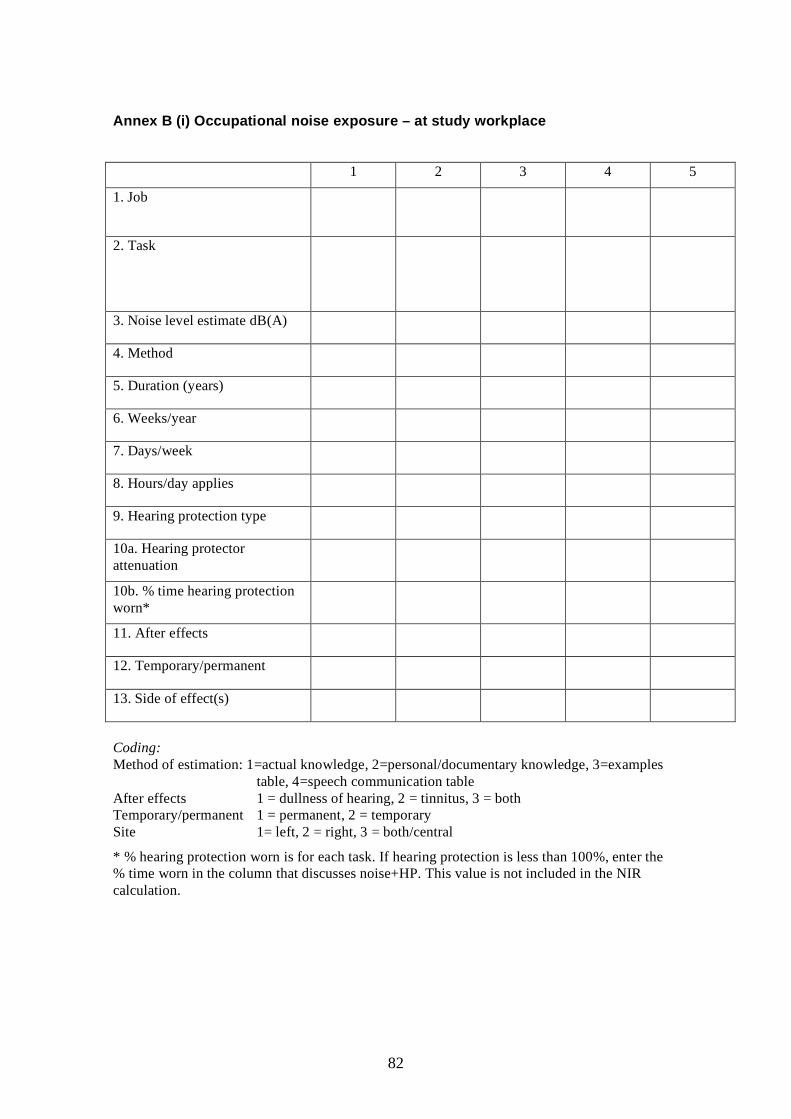
82
Annex B (i) Occupational noise exposure – at study workplace
1 2 3 4 5
1. Job
2. Task
3. Noise level estimate dB(A)
4. Method
5. Duration (years)
6. Weeks/year
7. Days/week
8. Hours/day applies
9. Hearing protection type
10a. Hearing protector attenuation
10b. % time hearing protection worn*
11. After effects
12. Temporary/permanent
13. Side of effect(s)
Coding: Method of estimation: 1=actual knowledge, 2=personal/documentary knowledge, 3=examples
table, 4=speech communication table After effects 1 = dullness of hearing, 2 = tinnitus, 3 = both Temporary/permanent 1 = permanent, 2 = temporary Site 1= left, 2 = right, 3 = both/central
* % hearing protection worn is for each task. If hearing protection is less than 100%, enter the % time worn in the column that discusses noise+HP. This value is not included in the NIR calculation.
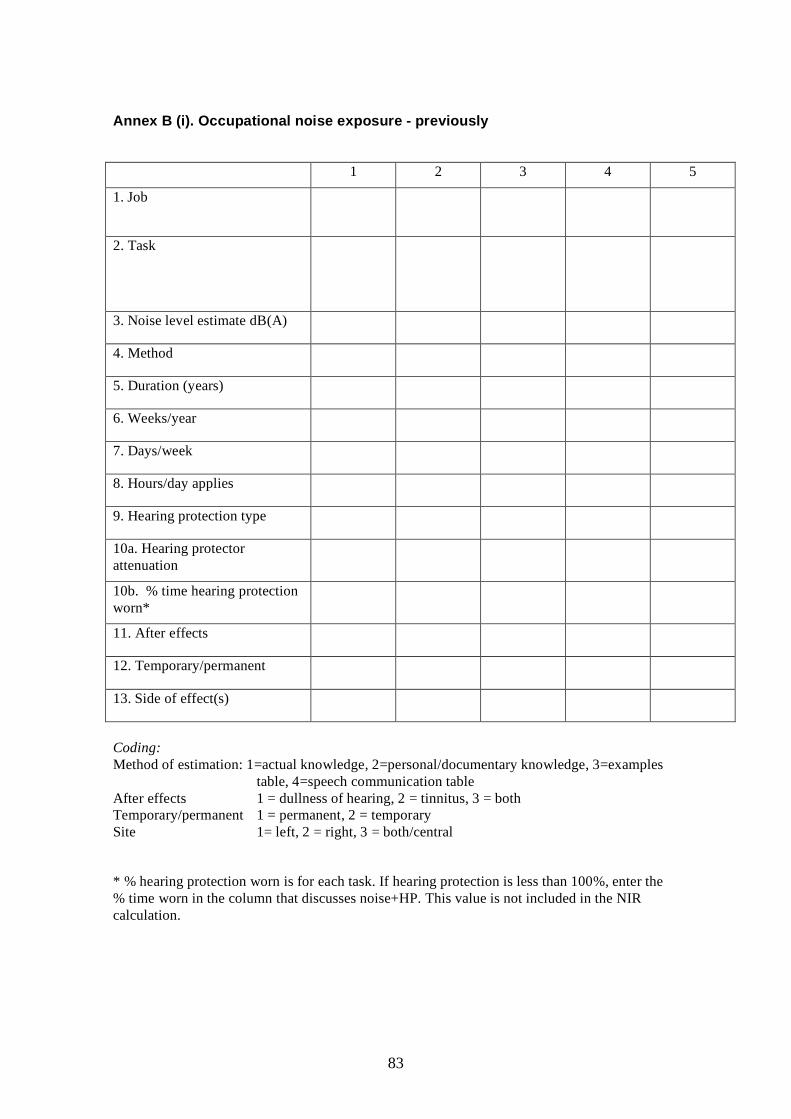
83
Annex B (i). Occupational noise exposure - previously
1 2 3 4 5
1. Job
2. Task
3. Noise level estimate dB(A)
4. Method
5. Duration (years)
6. Weeks/year
7. Days/week
8. Hours/day applies
9. Hearing protection type
10a. Hearing protector attenuation
10b. % time hearing protection worn*
11. After effects
12. Temporary/permanent
13. Side of effect(s)
Coding: Method of estimation: 1=actual knowledge, 2=personal/documentary knowledge, 3=examples
table, 4=speech communication table After effects 1 = dullness of hearing, 2 = tinnitus, 3 = both Temporary/permanent 1 = permanent, 2 = temporary Site 1= left, 2 = right, 3 = both/central
* % hearing protection worn is for each task. If hearing protection is less than 100%, enter the % time worn in the column that discusses noise+HP. This value is not included in the NIR calculation.
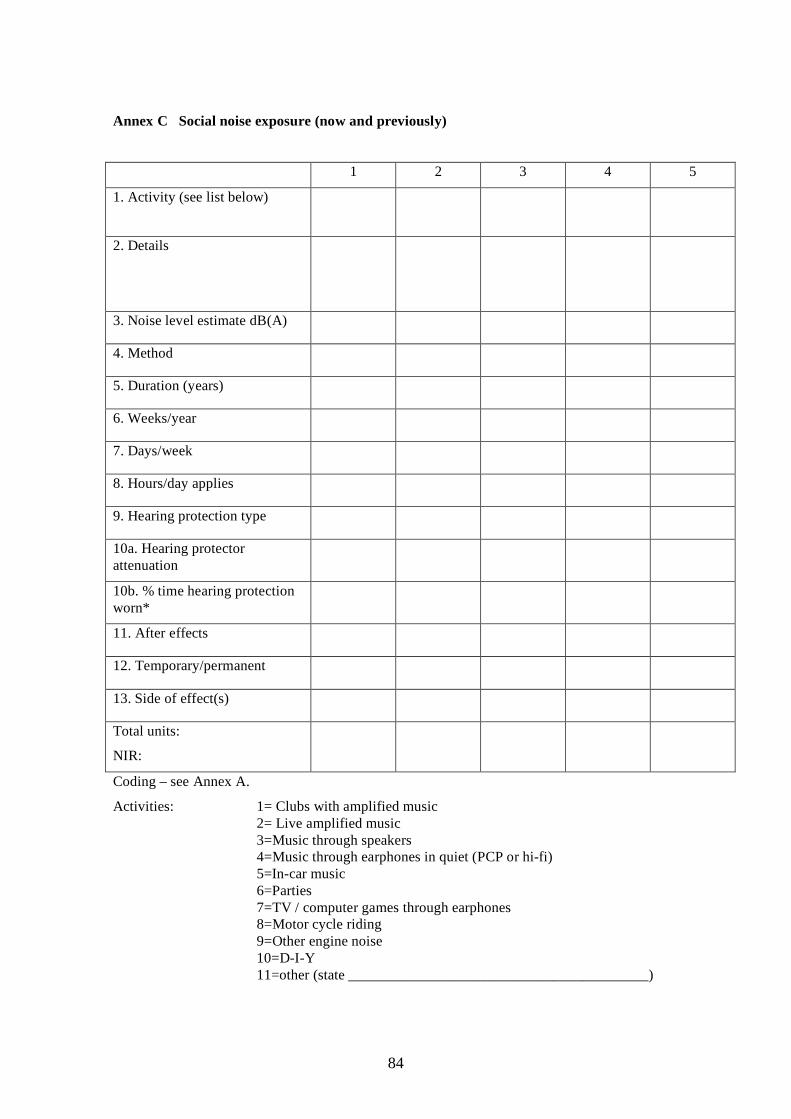
84
Annex C Social noise exposure (now and previously)
1 2 3 4 5
1. Activity (see list below)
2. Details
3. Noise level estimate dB(A)
4. Method
5. Duration (years)
6. Weeks/year
7. Days/week
8. Hours/day applies
9. Hearing protection type
10a. Hearing protector attenuation
10b. % time hearing protection worn*
11. After effects
12. Temporary/permanent
13. Side of effect(s)
Total units:
NIR:
Coding – see Annex A.
Activities: 1= Clubs with amplified music 2= Live amplified music 3=Music through speakers 4=Music through earphones in quiet (PCP or hi-fi) 5=In-car music 6=Parties 7=TV / computer games through earphones 8=Motor cycle riding 9=Other engine noise 10=D-I-Y 11=other (state _________________________________________)
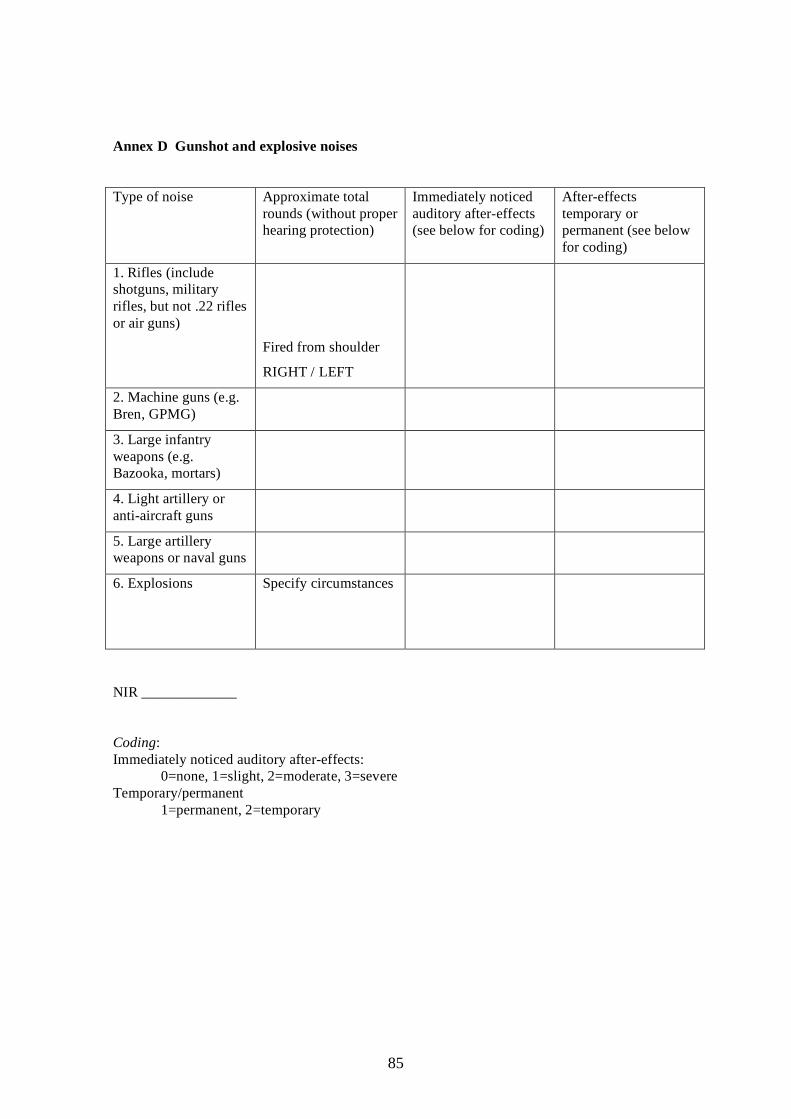
85
Annex D Gunshot and explosive noises
Type of noise Approximate total rounds (without proper hearing protection)
Immediately noticed auditory after-effects (see below for coding)
After-effects temporary or permanent (see below for coding)
1. Rifles (include shotguns, military rifles, but not .22 rifles or air guns)
Fired from shoulder
RIGHT / LEFT
2. Machine guns (e.g. Bren, GPMG)
3. Large infantry weapons (e.g. Bazooka, mortars)
4. Light artillery or anti-aircraft guns
5. Large artillery weapons or naval guns
6. Explosions Specify circumstances
NIR _____________ Coding: Immediately noticed auditory after-effects:
0=none, 1=slight, 2=moderate, 3=severe Temporary/permanent 1=permanent, 2=temporary

Published by the Health and Safety Executive 12/08
Epidemiological evidence for the effectiveness of the noise at work regulations
Health and Safety Executive
RR669
www.hse.gov.uk
The Noise at Work Regulations 1989 and the Control of Noise at Work Regulations 2005 (the Regulations) are designed to minimise risk of occupational noise-induced hearing loss in the UK. The present study examined their effectiveness in a longitudinal field study, where participants were seen annually over a period of 3 years. Audiometric and otoacoustic emission measures were obtained in 154 recruits aged 18-25 years at risk of noise-induced hearing loss through occupational exposure and 99 non-exposed controls. The study had power to detect approximately 1-2 dB change per year, which is a smaller change than would be expected in the noise-exposed participants without protection. There were no significant effects on auditory function, or rate of change in function, of risk group when other potential explanatory variables were taken into account. Nor were there significant effects when contrasting exposed participants working in companies demonstrating relatively lower or higher compliance with the Regulations. Noise levels in exposed participants averaged approximately 88-89 dB(A) before accounting for hearing protection. The only significant effects on hearing demonstrated in the study were small effects of estimated social noise prior to the study, for example at nightclubs or from personal audio systems.
Limitations of the study arise from the range of noise level encountered and the restricted duration of the study, which precludes showing longer-term effects. The companies involved in the study are not necessarily representative of the UK in terms of their compliance. Within these limitations, no evidence for lack of effectiveness of the Regulations was found.
This report and the work it describes were funded by the Health and Safety Executive (HSE). Its contents, including any opinions and/or conclusions expressed, are those of the authors alone and do not necessarily reflect HSE policy.