Embed Size (px)
Citation preview
Evidence Based Medicine &
Basic Critical Appraisal
David ErskineLondon & SE
Medicines Information Service
Why do we need evidence?
Resources should be allocated to things that are EFFECTIVE
The only way of judging effectiveness is EVIDENCE
“In God we trust – all others bring data”
Why do we need evidence?
Move towards:
EVIDENCE-BASED MEDICINE
Move away from:
EMINENCE- BASED MEDICINE
What we really, really want is
EVIDENCE-INFORMED MEDICINE
Evidence-based medicine 5 steps
Converting information needs into answerable questions
Finding the best evidence with which to answer question
Critically appraising evidence for validity and usefulness
Applying the results in clinical practice
Evaluating performance
What is an answerable question? - step 1
Should contain the following components:
The intervention you are interested in The population you are interested in The outcomes you are interested in
Finding evidence - step 2Workshop
What are ‘good’ sources of evidence?
Think about sources of evidence that you have used – were they useful?
What makes a ‘good’ source of evidence?
Finding evidence - step 2
Can search many of these sources simultaneously using: TRIP (via NLH) OSRS (via NeLM) NKS single search engine(via NLH)?????
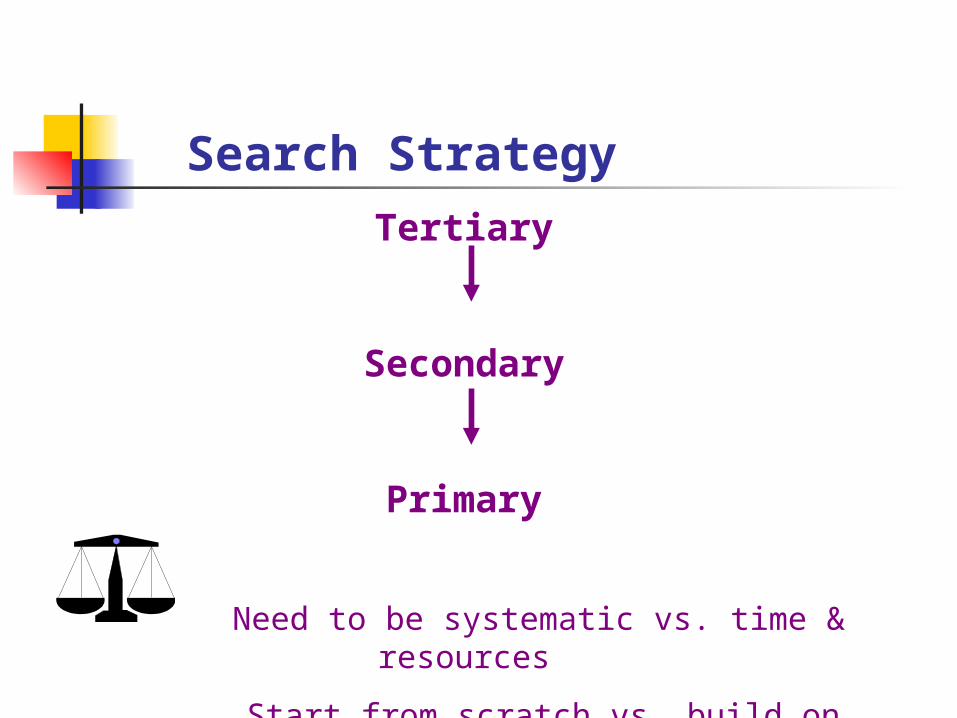
Search Strategy
Tertiary
Secondary
Primary
Need to be systematic vs. time & resources
Start from scratch vs. build on previous work
Appraising evidence - step 3
Validity - closeness to the truth, i.e. do we believe it?
Usefulness - clinical applicability, i.e. is it important?
Using efficacy data from clinical trials to
estimate Clinical Effectiveness
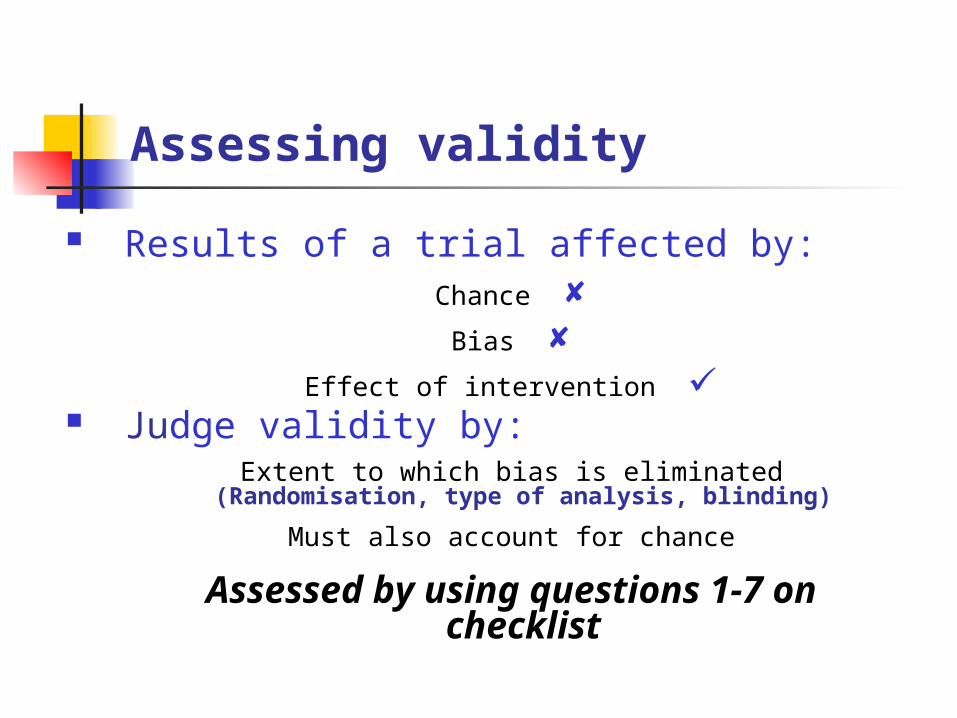
Assessing validity
Results of a trial affected by:Chance
Bias Effect of intervention
Judge validity by:Extent to which bias is eliminated
(Randomisation, type of analysis, blinding)
Must also account for chance
Assessed by using questions 1-7 on checklist
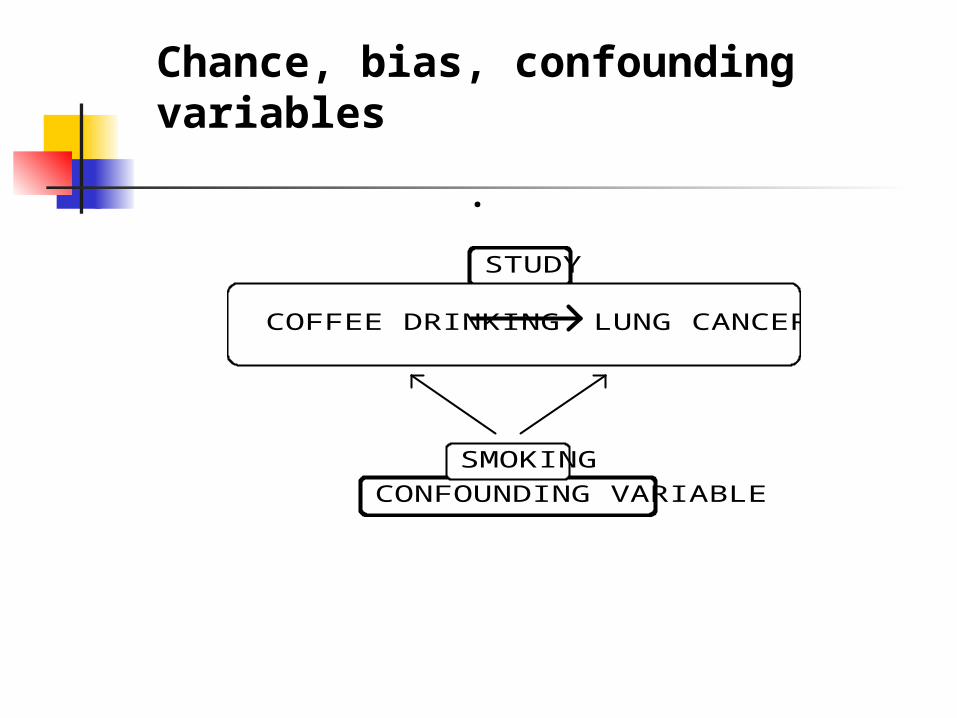
Chance, bias, confounding variables
.
COFFEE DRINKING LUNG CANCER
SMOKING
STUDY
CONFOUNDING VARIABLE
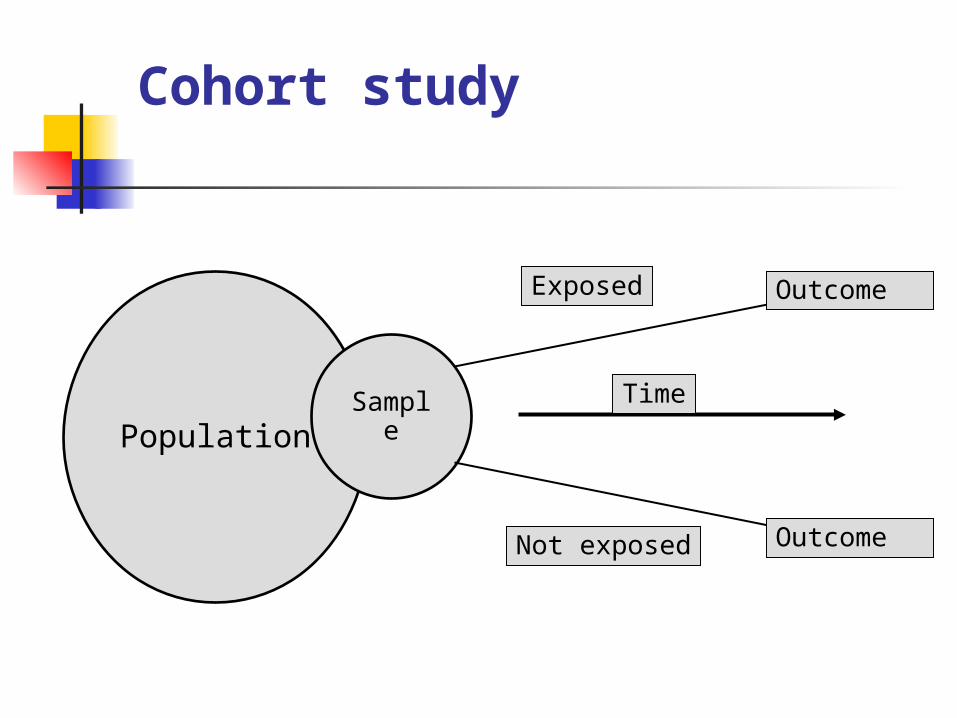
Cohort study
PopulationSample
Exposed
Not exposed
Outcome
Outcome
Time
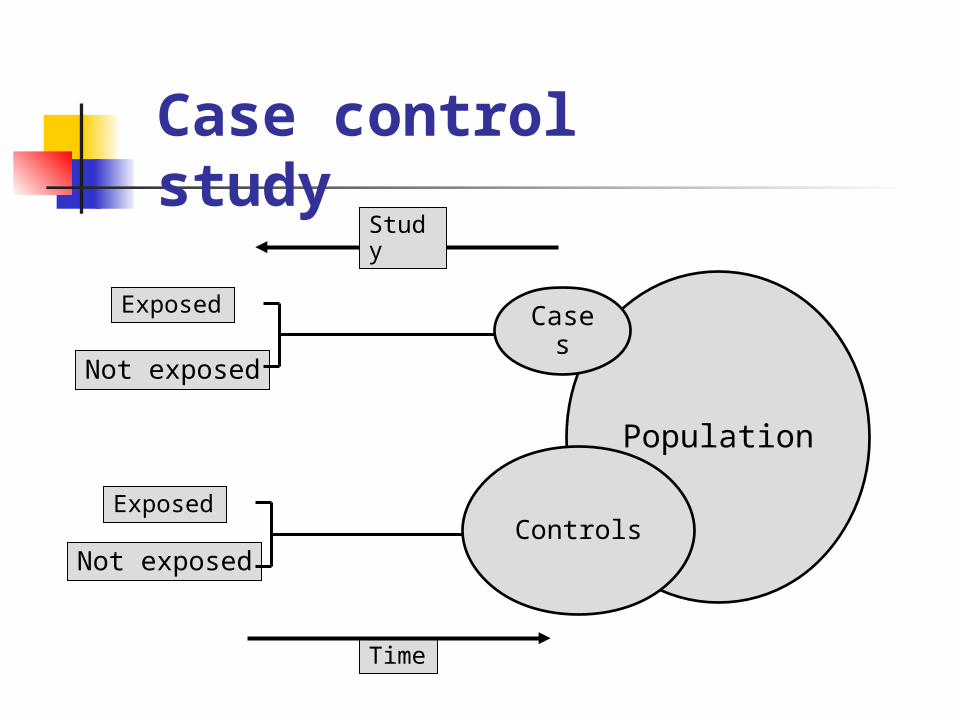
Case control study
Population
CasesExposed
Not exposed
Time
ControlsNot exposed
Exposed
Study
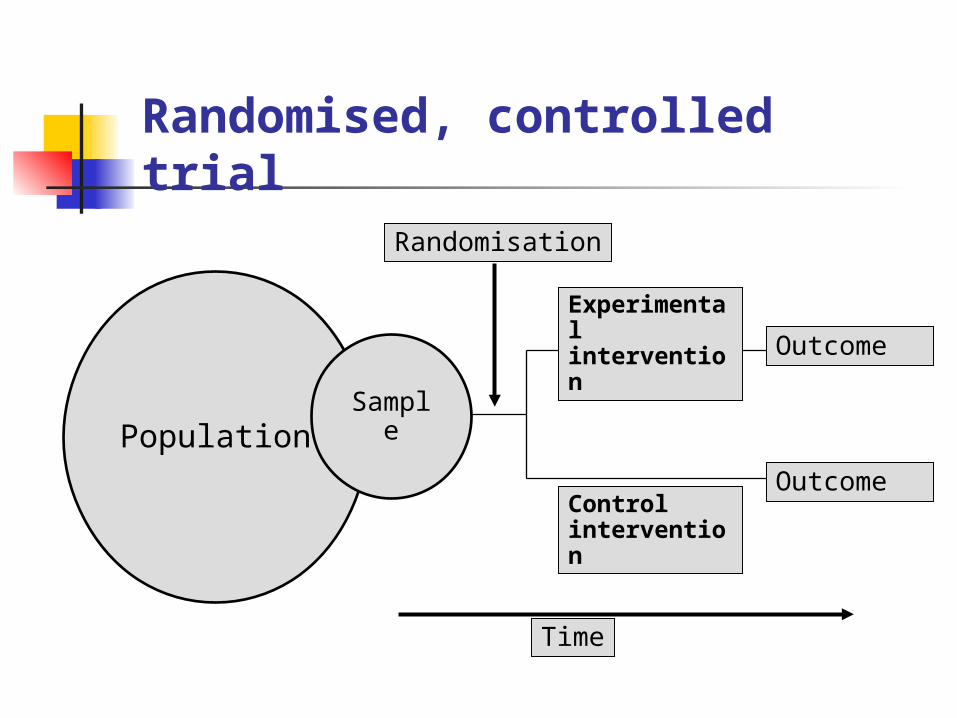
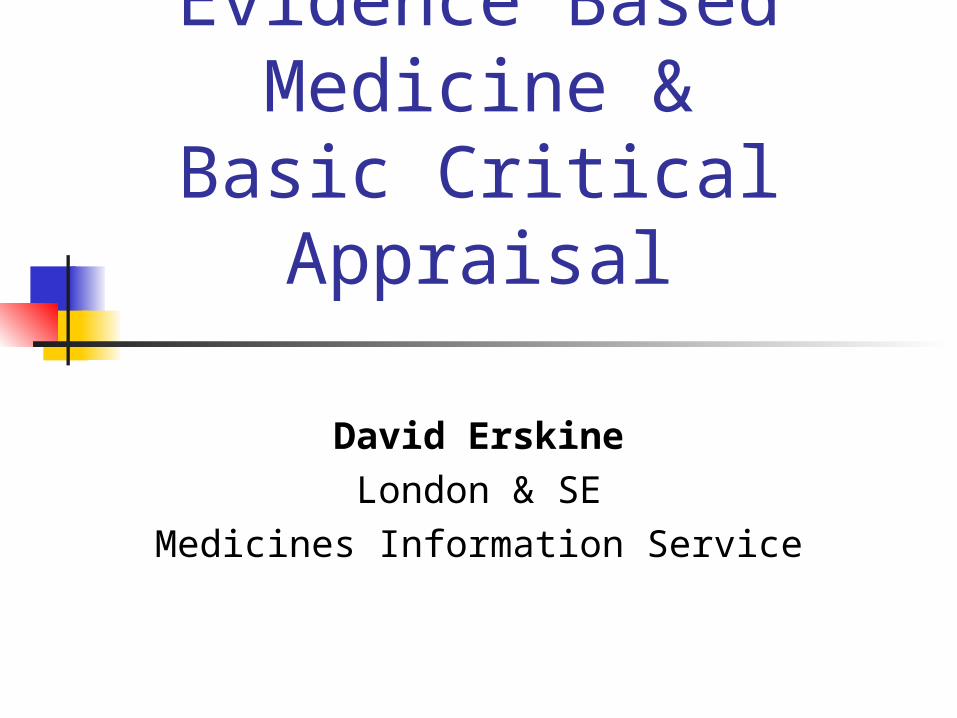
Randomised, controlled trial
PopulationSample
Outcome
Outcome
Experimental intervention
Control intervention
Randomisation
Time
Are the results of the trial valid?
Did the trial address a clearly focused issue? Define the population studied The intervention given The outcomes considered
Is an RCT an appropriate method to answer this question?
How were patients assigned to treatment groups?
What is randomisation?
Why is it important?
What are acceptable methods of randomisation?
What methods of randomisation are considered dubious?
Where to find out details of the randomisation process used?
Note CONSORT statement- recommend that RCTs should report how the allocation sequence was generated and concealed until the patient was
randomised
How were patients assigned to treatment groups?
Could differences between groups have altered the outcome?
Are any differences reported?
Where do you check for yourself?
Was any method used to balance randomisation (stratification)?
Were patients, health workers and study personnel “blind” to treatment?
Why is this important? When is it less important? How is it done?
Want to minimise likelihood of observer bias and Hawthorne effects
Were all the patients who entered the trial properly accounted for at its conclusion?
Was follow-up complete?- if not how was missing data handled?
Were patients analysed in the groups to which they were randomised?
Intention to treat analysis vs. Per protocol or completer analysis
Aside from the experimental investigation, were the two groups treated in the same way?
Usually not such an important issue in placebo-controlled or comparative drug trials but assessing for possible bias introduced by differing intensity of follow up
Did the study have enough participants to minimise the play of chance?
Look for a power calculation Do you agree with their definition of
“important”
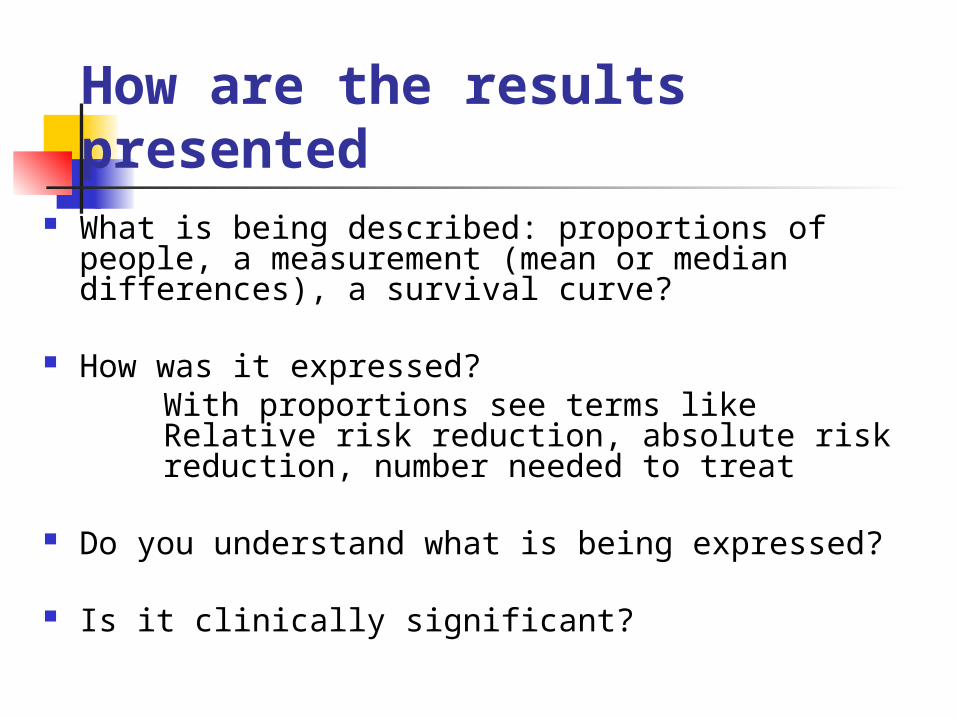
How are the results presented
What is being described: proportions of people, a measurement (mean or median differences), a survival curve?
How was it expressed?With proportions see terms like Relative risk reduction, absolute risk reduction, number needed to treat
Do you understand what is being expressed?
Is it clinically significant?
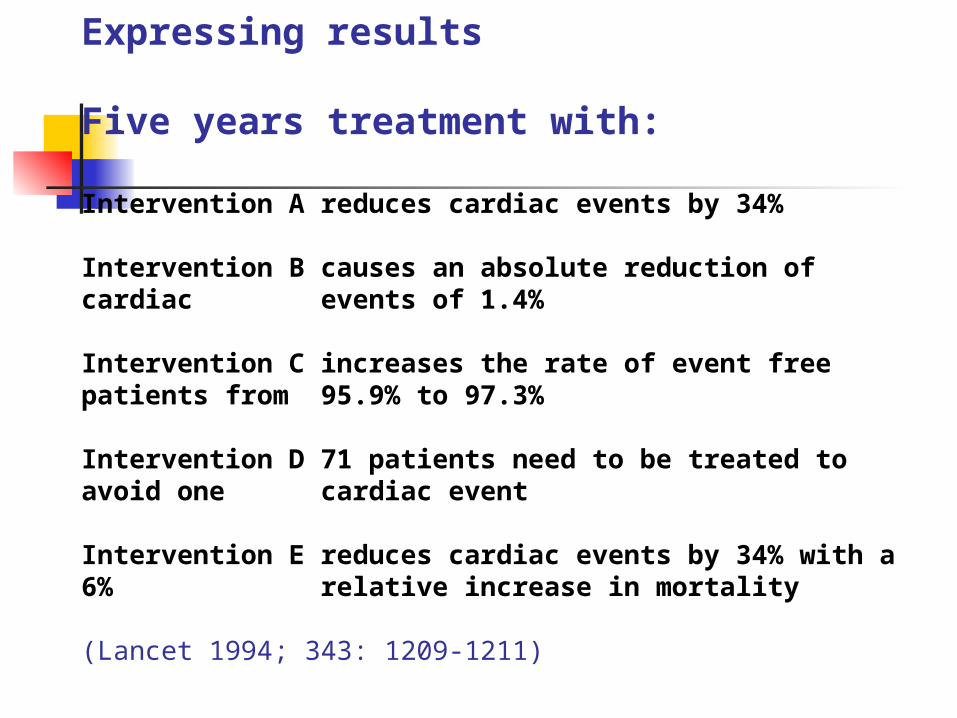
Expressing results
Five years treatment with:
Intervention A reduces cardiac events by 34%
Intervention B causes an absolute reduction of cardiac events of 1.4%
Intervention C increases the rate of event free patients from 95.9% to 97.3%
Intervention D 71 patients need to be treated to avoid one cardiac event
Intervention E reduces cardiac events by 34% with a 6% relative increase in mortality
(Lancet 1994; 343: 1209-1211)
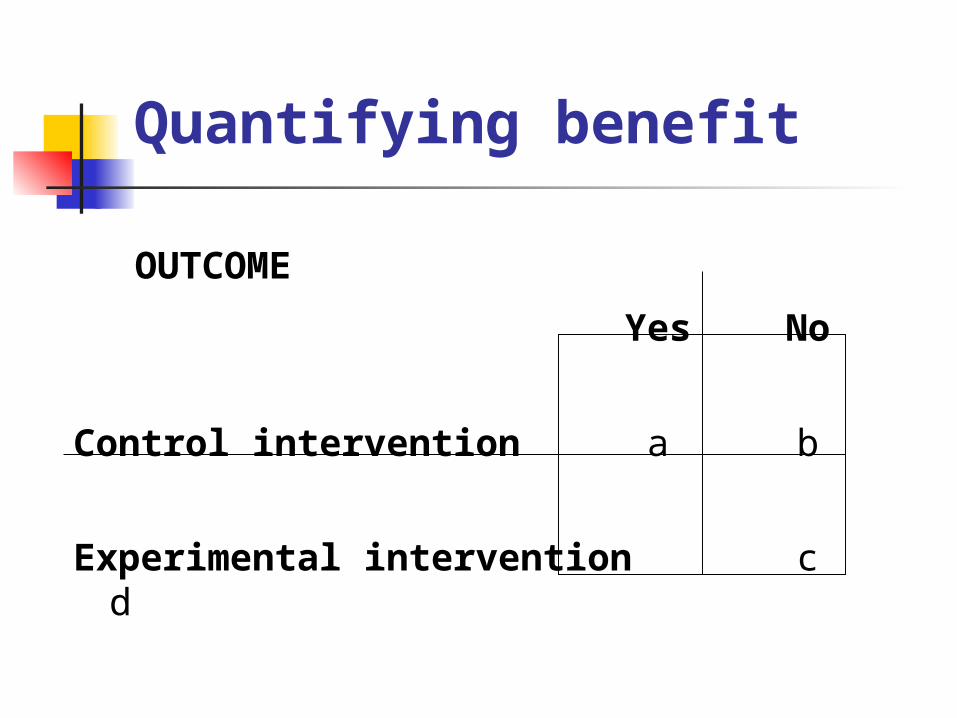
Quantifying benefit
OUTCOME
Yes No
Control intervention a b
Experimental intervention c d
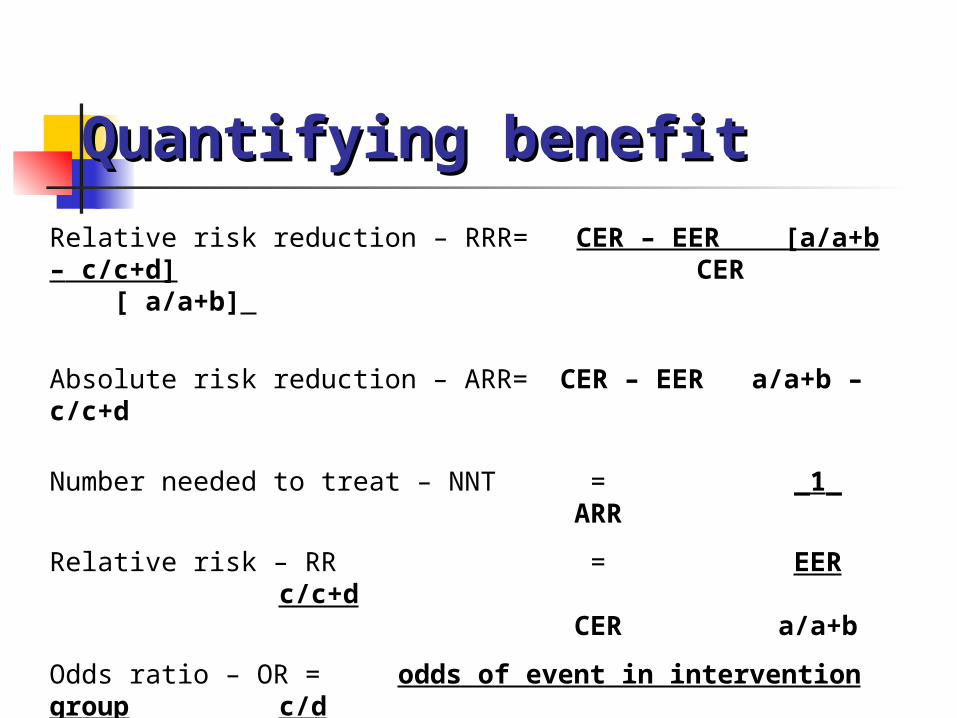
Relative risk reduction – RRR= CER – EER [a/a+b – c/c+d] CER [ a/a+b]
Absolute risk reduction – ARR= CER – EER a/a+b – c/c+d
Number needed to treat – NNT = _1_ARR
Relative risk – RR = EER c/c+d CER a/a+b
Odds ratio – OR = odds of event in intervention group c/d odds of event in control group a/b
Quantifying benefitQuantifying benefit
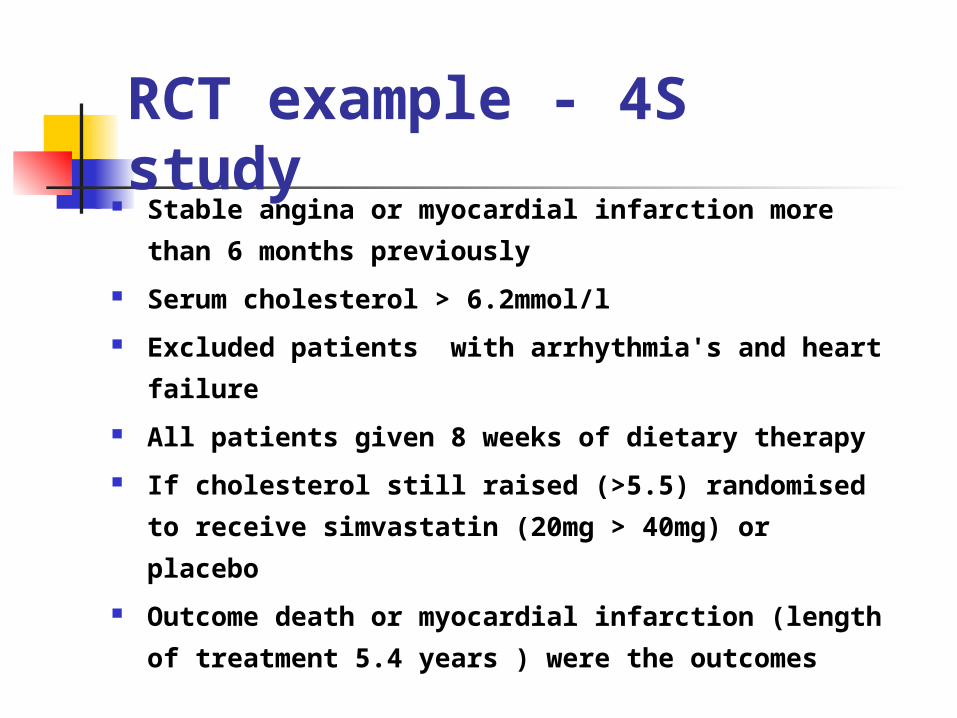
RCT example - 4S study
Stable angina or myocardial infarction more than
6 months previously
Serum cholesterol > 6.2mmol/l
Excluded patients with arrhythmia's and heart
failure
All patients given 8 weeks of dietary therapy
If cholesterol still raised (>5.5) randomised to
receive simvastatin (20mg > 40mg) or placebo
Outcome death or myocardial infarction (length
of treatment 5.4 years ) were the outcomes
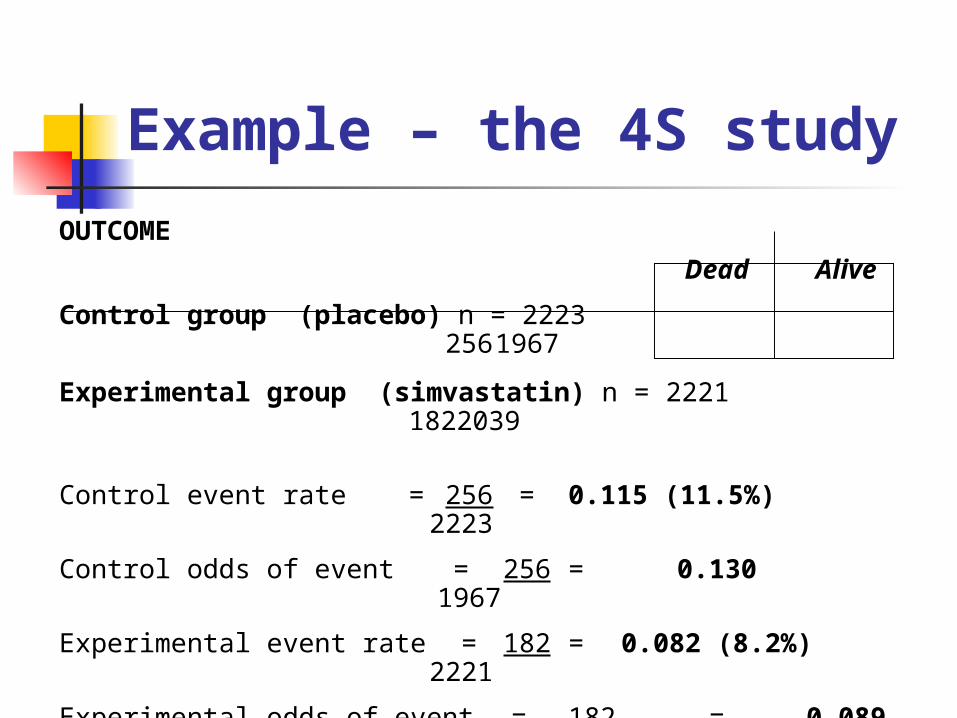
OUTCOME
Dead Alive
Control group (placebo) n = 2223 256 1967
Experimental group (simvastatin) n = 2221 182 2039
Control event rate = 256 = 0.115 (11.5%)2223
Control odds of event = 256 = 0.1301967
Experimental event rate = 182 = 0.082 (8.2%)2221
Experimental odds of event = 182 = 0.0892039
Example – the 4S study
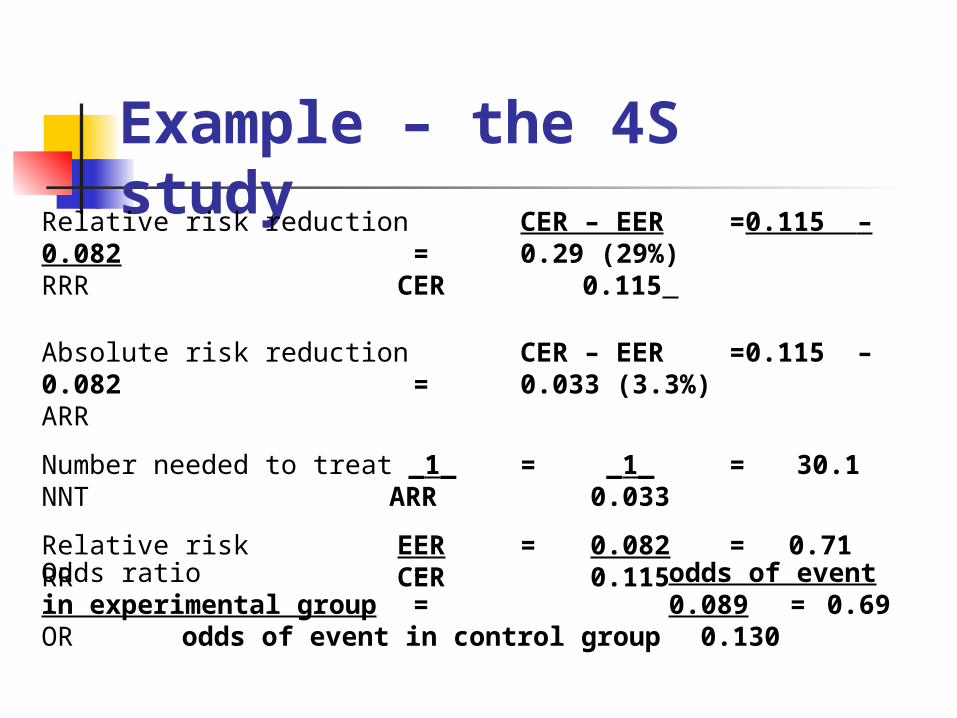
Example – the 4S study
Relative risk reduction CER – EER = 0.115 – 0.082 = 0.29 (29%)RRR CER 0.115
Absolute risk reduction CER – EER = 0.115 – 0.082 = 0.033 (3.3%) ARR
Number needed to treat _1_ = _1_ = 30.1NNT ARR 0.033
Relative risk EER = 0.082 = 0.71 RR CER 0.115
Odds ratio = odds of event in experimental group = 0.089 = 0.69OR odds of event in control group 0.130
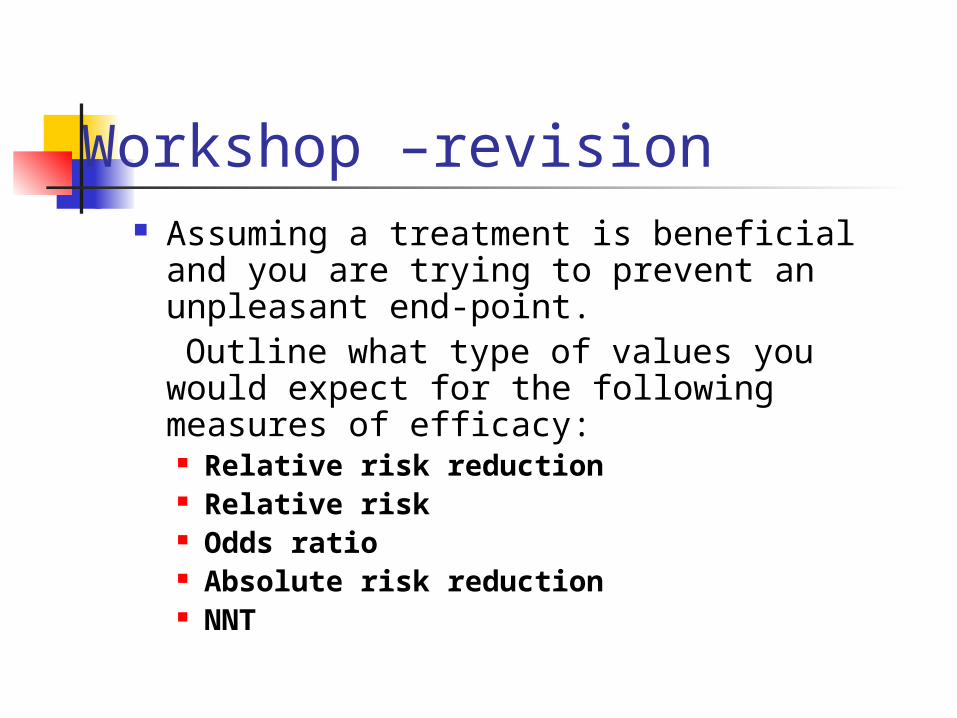
Workshop –revision Assuming a treatment is beneficial and you
are trying to prevent an unpleasant end-point.
Outline what type of values you would expect for the following measures of efficacy: Relative risk reduction Relative risk Odds ratio Absolute risk reduction NNT
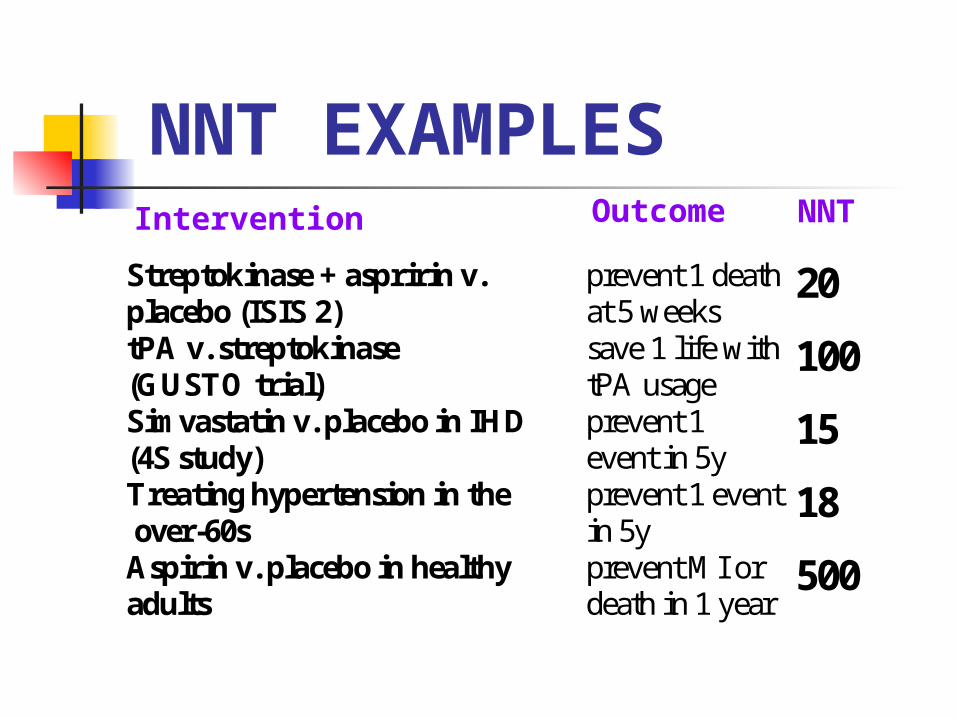
NNT EXAMPLES
Streptokinase + aspririn v. placebo (ISIS 2)
prevent 1 death at 5 weeks
20
tPA v. streptokinase (GUSTO trial)
save 1 life with tPA usage
100
Simvastatin v. placebo in IHD (4S study)
prevent 1 event in 5y
15
Treating hypertension in the over-60s
prevent 1 event in 5y
18
Aspirin v. placebo in healthy adults
prevent MI or death in 1 year
500
Intervention Outcome NNT
How precise are the results?
Limitations of the p-value- what does it tell you?
Use of confidence intervals• What are confidence intervals?• What does upper and lower limits tell you?• Would your decision about whether to use
this treatment be the same at the upper and lower confidence intervals?
CHANCE - p = 1 in 20 (0.05). > 1 in 20 (0.051) = not significant < 1 in 20 (0.049) = statistically
significant
CONFIDENCE INTERVALS the range of values between which we could
be 95% confidant that this result would lie if this trial was carried out 100 times (taken as result for general population)
How precise are the results?
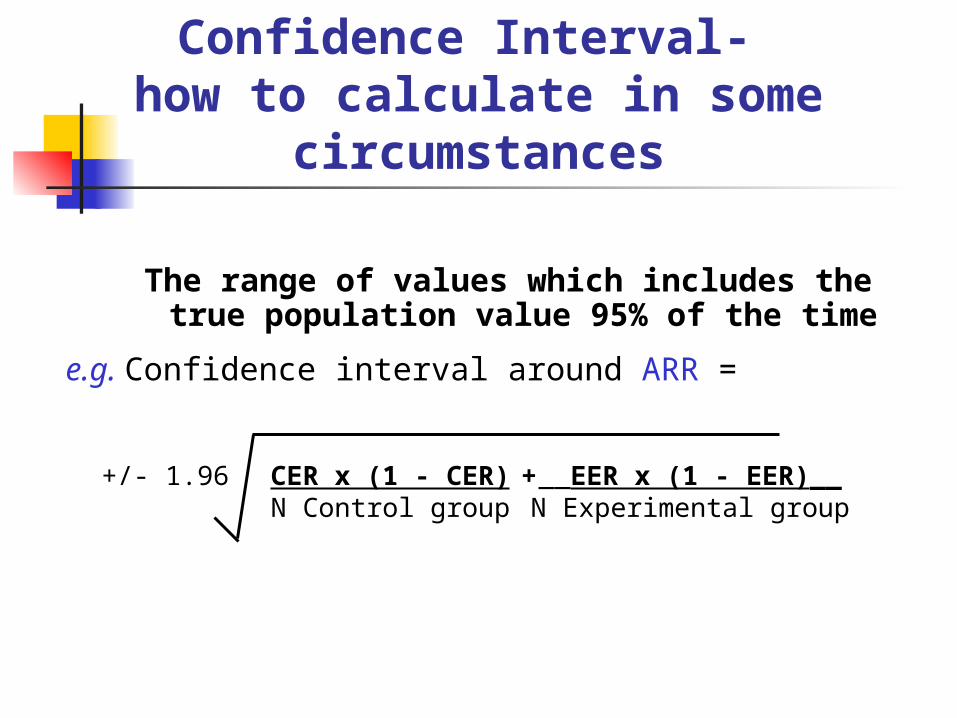
Confidence Interval- how to calculate in some
circumstances
The range of values which includes the true population value 95% of the time
e.g. Confidence interval around ARR =
+/- 1.96 CER x (1 - CER) + __EER x (1 - EER)__N Control group N Experimental group
Can the results be applied to the local population?
Look at inclusion and exclusion criteria- are they similar
Are there differences which make this trial irrelevant?
Be pragmatic!!
Were all the clinically important outcomes considered?
Consider outcomes reported from a range of perspectives- individual, family/ carers, policy maker, healthcare professional, wider community
Reports tend to concentrate on efficacy at the expense of harms and quality of life measures (participants and carers?)
Should policy or practice change as a result of the evidence contained in this trial?
Are the likely benefits worth the potential harms and costs? Have you got all the data you need to make
this assessment Can you access any missing data you need How does this intervention compare with other
interventions-and the results of related RCTs (if any)
Also need to consider service implications
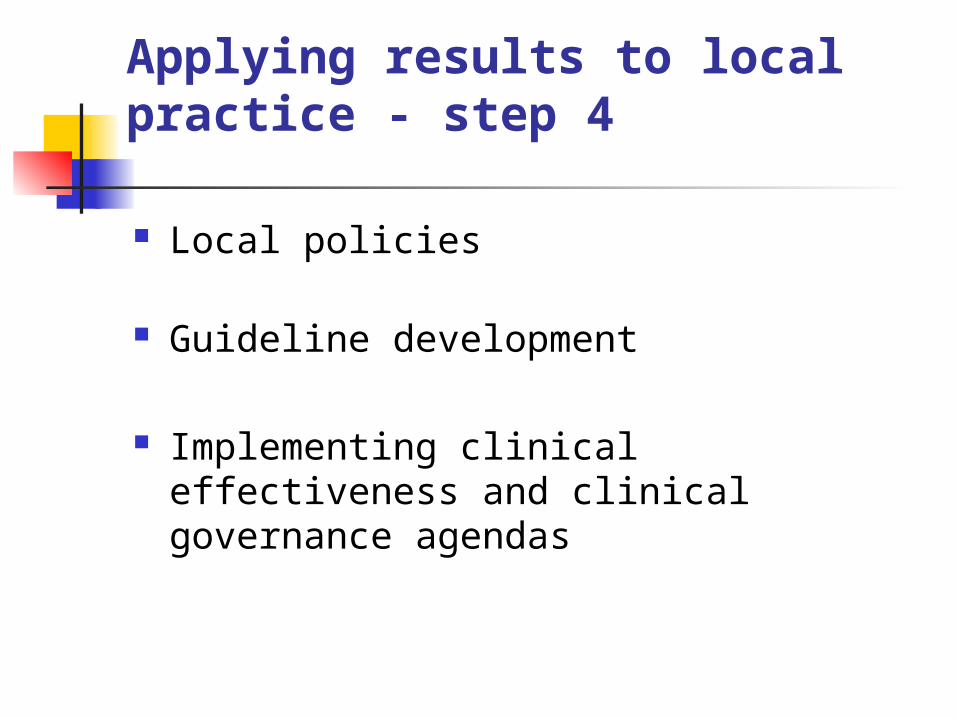
Applying results to local practice - step 4
Local policies
Guideline development
Implementing clinical effectiveness and clinical governance agendas
Evaluating performance - step 5
Clinical audit!
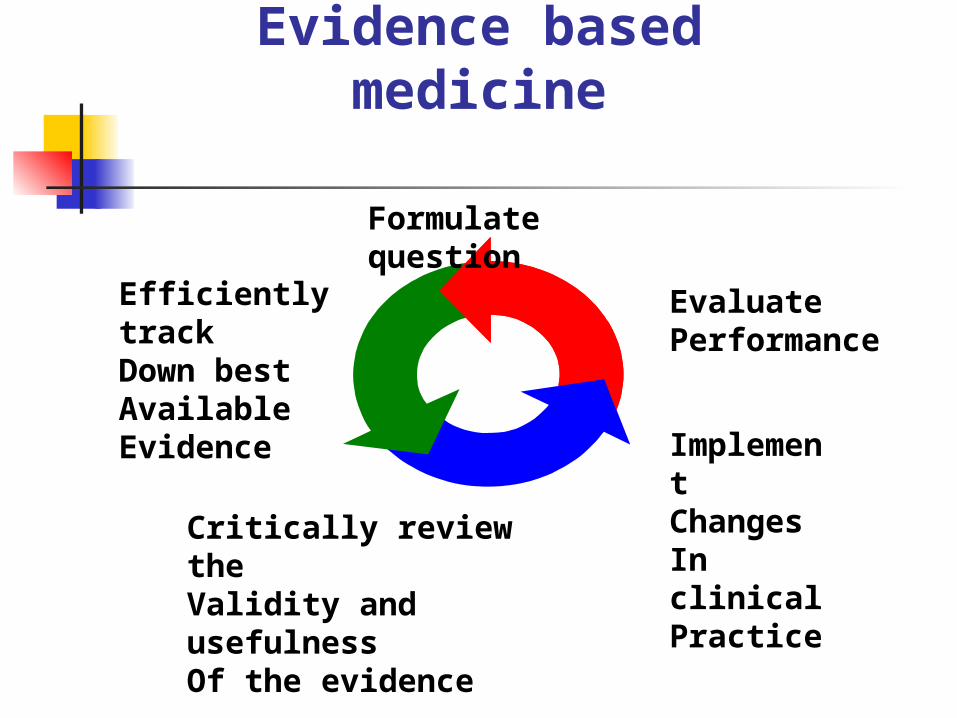
Evidence based medicine
Formulate question
Efficiently track Down bestAvailableEvidence
Critically review theValidity and usefulnessOf the evidence
Implement ChangesIn clinical Practice
Evaluate Performance
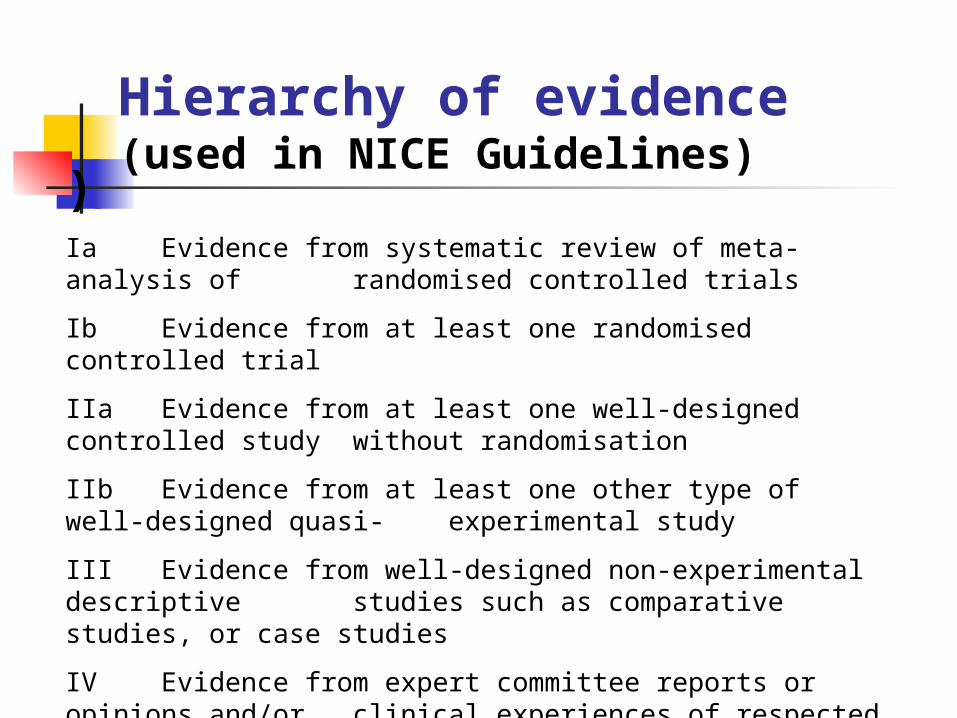
)Ia Evidence from systematic review of meta-analysis of
randomised controlled trials
Ib Evidence from at least one randomised controlled trial
IIa Evidence from at least one well-designed controlled study without randomisation
IIb Evidence from at least one other type of well-designed quasi- experimental study
III Evidence from well-designed non-experimental descriptive studies such as comparative studies, or case studies
IV Evidence from expert committee reports or opinions and/or clinical experiences of respected authorities
Hierarchy of evidence(used in NICE Guidelines)
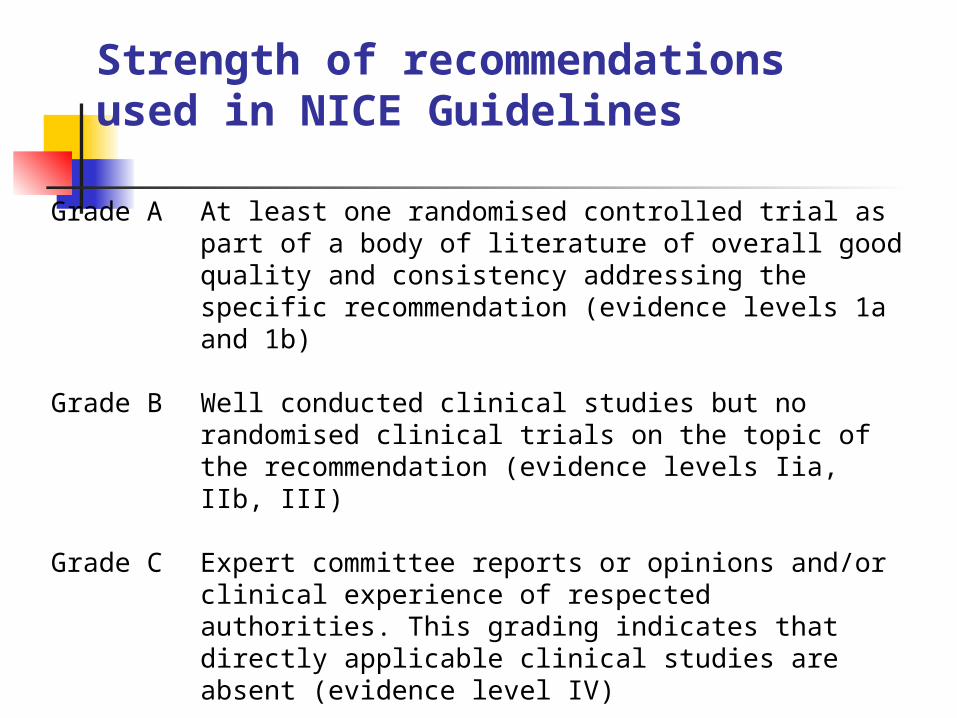
Grade A At least one randomised controlled trial as part of a body of literature of overall good quality and consistency addressing the specific recommendation (evidence levels 1a and 1b)
Grade B Well conducted clinical studies but no randomised clinical trials on the topic of the recommendation (evidence levels Iia, IIb, III)
Grade C Expert committee reports or opinions and/or clinical experience of respected authorities. This grading indicates that directly applicable clinical studies are absent (evidence level IV)
Good practice point: recommended good practice based on the clinical experience of the Guideline Development Group
Strength of recommendationsused in NICE Guidelines
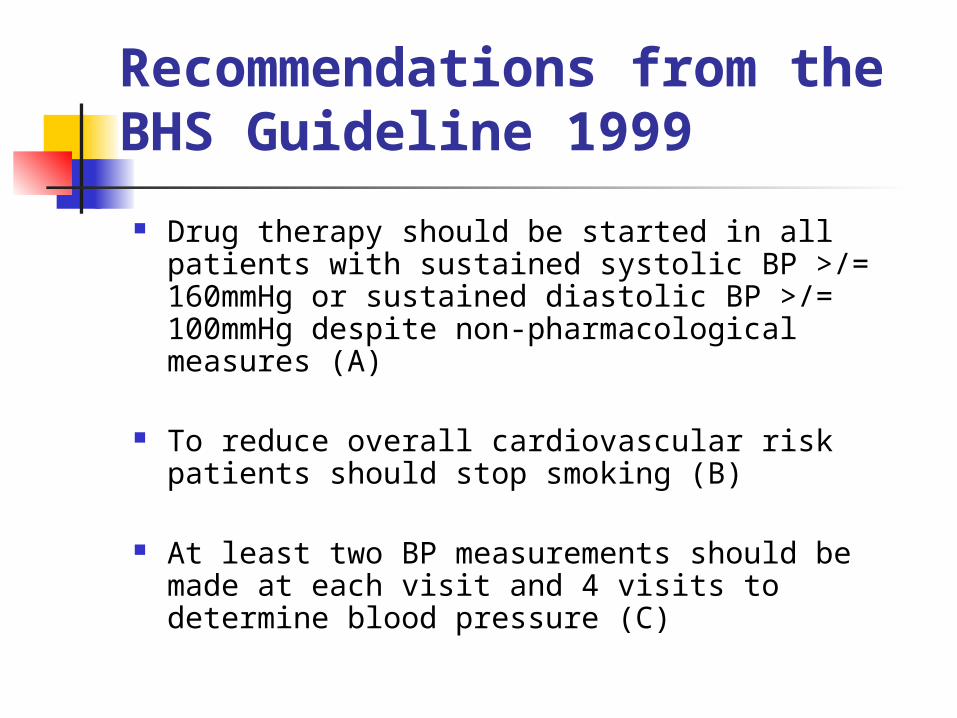
Recommendations from the BHS Guideline 1999
Drug therapy should be started in all patients with sustained systolic BP >/= 160mmHg or sustained diastolic BP >/= 100mmHg despite non-pharmacological measures (A)
To reduce overall cardiovascular risk patients should stop smoking (B)
At least two BP measurements should be made at each visit and 4 visits to determine blood pressure (C)
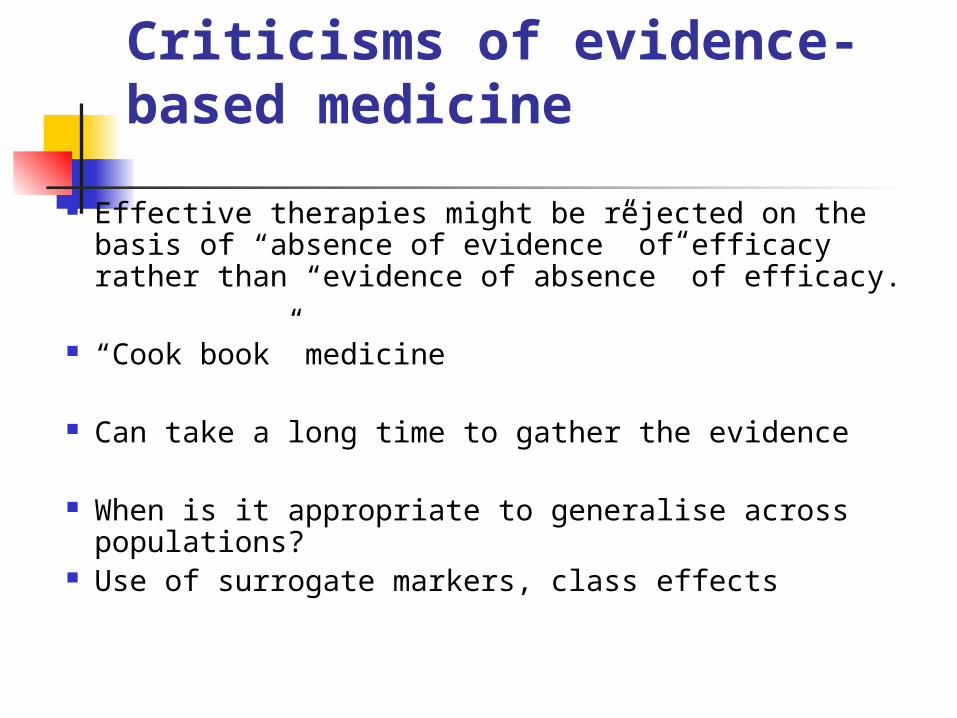
Criticisms of evidence-based medicine
Effective therapies might be rejected on the basis of “absence of evidence” of efficacy rather than “evidence of absence” of efficacy.
“Cook book” medicine
Can take a long time to gather the evidence
When is it appropriate to generalise across populations?
Use of surrogate markers, class effects
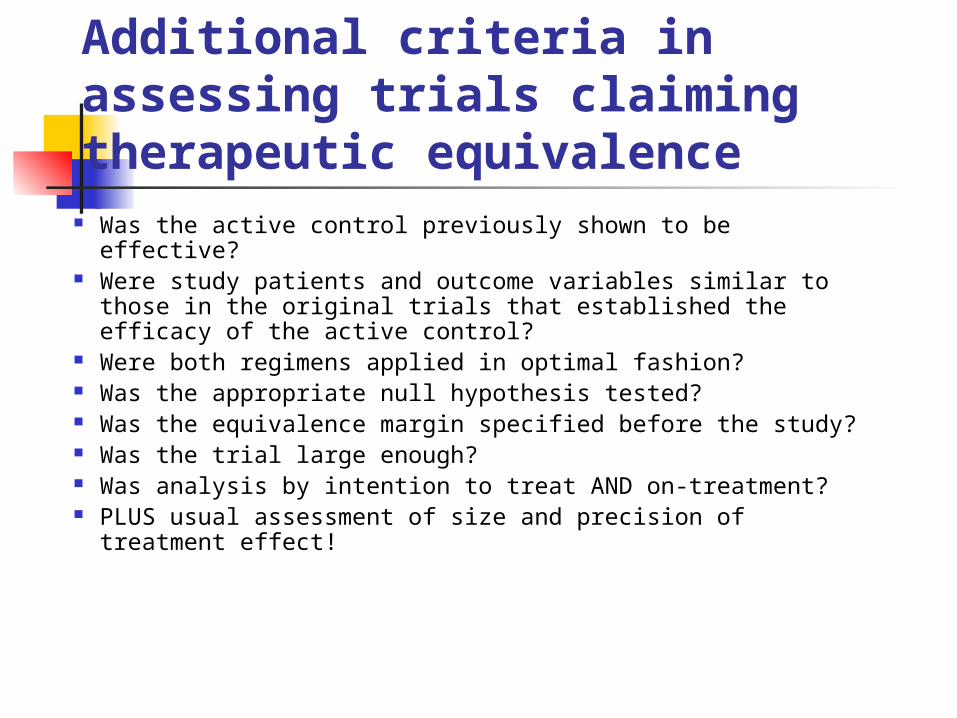
Additional criteria in assessing trials claiming therapeutic equivalence
Was the active control previously shown to be effective? Were study patients and outcome variables similar to
those in the original trials that established the efficacy of the active control?
Were both regimens applied in optimal fashion? Was the appropriate null hypothesis tested? Was the equivalence margin specified before the study? Was the trial large enough? Was analysis by intention to treat AND on-treatment? PLUS usual assessment of size and precision of
treatment effect!
REFERENCES CASP Tool www.phru.nhs.uk/casp/resourcescasp.htm
Additional Reading Montori V et al Users’ guide to detecting misleading claims in clinical
research reports BMJ 2004; 329: 1093-1096 Greenhalgh T. How to read a paper: Getting your bearings (deciding
what a paper is about). BMJ 1997; 315: 243-246 Greenhalgh T. How to read a paper: Assessing the methodological
quality of published papers. BMJ 1997; 315: 305-308 Guyatt GH, et al. Users’ Guides to the Medical Literature: II. How to use
an article about therapy or prevention. A. Are the results of the study valid? JAMA 1993; 270: 2598-2601
Guyatt GH, et al. Users’ Guides to the Medical Literature: II. How to use an article about therapy or prevention. B. What are the results and will they help me in caring for my patients? JAMA 1994; 271: 59-63
REFERENCES cont.
Statistics for the non-statisticianI: Different types of data need different statistical
testsGreenhalgh T BMJ 1997; 315: 364-6
II: “Significant” relations and their pitfallsGreenhalgh T BMJ 1997; 315: 422-5
Statistics in small doses- a series of articles available on UKMI web-site (http://www.ukmi.nhs.uk/activities/Research/default.asp?pageRef=27)