Embed Size (px)
Citation preview
Evidence Based Library and Information Practice 2015, 10.1
5
Evidence Based Library and Information Practice
Article
Enhancing Access to E-books
Karen Harker
Collection Assessment Librarian
University of North Texas Libraries
Denton, Texas, United States of America
Email: [email protected]
Catherine Sassen
Principal Catalog Librarian
University of North Texas Libraries
Denton, Texas, United States of America
Email: [email protected]
Received: 30 Sept. 2014 Accepted: 16 Dec. 2014
2015 Harker and Sassen. This is an Open Access article distributed under the terms of the Creative Commons‐
Attribution‐Noncommercial‐Share Alike License 4.0 International (http://creativecommons.org/licenses/by-nc-
sa/4.0/), which permits unrestricted use, distribution, and reproduction in any medium, provided the original work is
properly attributed, not used for commercial purposes, and, if transformed, the resulting work is redistributed under
the same or similar license to this one.
Abstract
Objective – The objective of the study was to determine if summary notes or table of contents
notes in catalogue records are associated with the usage of e-books in a large university library.
Methods – A retrospective cohort study, analyzing titles from three major collections of e-books
was employed. Titles were categorized based on the inclusion of the MARC 505 note (table of
contents) or MARC 520 note (summary) in the catalogue record. The usage was based on
standardized reports from 2012-2013. The measures of usage were the number of titles used and
the number of sections downloaded. Statistical methods used in the analysis included
correlations and odd ratios (ORs). The usage measures were stratified by publication year and
subject to adjust for the effects of these factors on usage.
Results – The analysis indicates that these enhancements to the catalogue record increase usage
significantly and notably. The probability of an e-book with one of the catalogue record
enhancements being used (as indicated by the OR) was over 80% greater than for titles lacking
Evidence Based Library and Information Practice 2015, 10.1
6
the enhancements, and nearly twice as high for titles with both features. The differences were
greatest among the oldest and the most recently published e-books, and those in science and
technology. The differences were least among the e-books published between 1998 and 2007 and
those in the humanities and social sciences.
Conclusion – Libraries can make their collections more accessible to users by enhancing
bibliographic records with summary and table of contents notes, and by advocating for their
inclusion in vendor-supplied records.
Introduction
While librarians may have suspected that a
certain percentage of their collections would be
more heavily used, it was the ground-breaking
work in the 1960s and 1970s that brought the
issue to light (Morse & Chen, 1975; Trueswell,
1968). Trueswell (1969) found that about 20% of
the collections at University of Massachusetts
and Mount Holyoke accounted for about 80% of
the titles used. Galvin and Kent’s (1977)
landmark study showed that about 40% of a
large academic collection at the University of
Pittsburgh had never been used. More recently,
a study from Auburn University demonstrated
that these principles of print book circulation
applied as well to electronic book usage (Best,
2008). But for all the circulation studies that
quantified the distribution of usage, there have
been relatively few studies that examined why
some books are used and others are not.
The University of North Texas Libraries
embarked on a pilot of patron-driven
acquisitions (PDA) through a single vendor in
2012. Until then, the usage of individual e-books
had not received much attention by the
university librarians. It was primarily due to the
direct association of usage to cost that we started
carefully tracking this information. The program
was quite successful, in that the percentage of
titles used at least once was greater than for
those e-books that librarians had previously
purchased. Furthermore, only 18% of librarian-
selected e-books were used again after their
initial use, while 57% of PDA titles were used
multiple times. We began to wonder about
factors associated with patron usage.
E-book titles were made available through the
Libraries’ online catalogue, as well as through
the vendor’s platform, and we determined that
the primary source for discovering these titles
was the catalogue. Thus, patrons who searched
the catalogue selected titles based solely on the
contents of the MARC records. We considered
what characteristics of the MARC records were
associated with titles that were selected. Two
characteristics were noticeable: inclusion of
tables of contents and summaries. Is inclusion of
tables of contents or summary statements in the
MARC record associated with a greater
likelihood of usage and the number of uses?
Literature Review
The enhancement of bibliographic records with
tables of contents and other features dates back
to the introduction of online catalogues. One of
the earliest catalogue use studies that included
this topic was the Online Catalog Public Access
Project (Matthews & Lawrence, 1984). The
Council on Library Resources (CLR) conducted
this study in cooperation with the Library of
Congress (LC), OCLC, the Research Libraries
Group (RLG), the University of California
Division of Library Automation, and Joseph
Matthews and Associates, a library consulting
firm (Matthews, 2014). Information was
gathered from thousands of individuals through
surveys and focus group interviews. When
asked about the most desired enhancements to
online catalogue records, library users specified
that they would like to be able to search a book’s
table of contents, summary, and index. (Markey,
1983, p. 141).
Evidence Based Library and Information Practice 2015, 10.1
7
Much later, in 2008, OCLC researchers
administered a pop-up survey to WorldCat
users and received 11,151 responses (Calhoun,
Cantrell, Gallagher & Hawk, 2009, p. 7).
WorldCat users were asked, "What changes
would be most helpful to you in identifying the
item that you need?", and the top five responses
included summaries/abstracts (18%) and tables
of contents (18%) (Calhoun et al., 2009, p. 13).
OCLC researchers also covered this topic in a
series of focus group interviews, comprised of
eight undergraduates, eight "casual searchers",
and finally, eight “scholars,” including graduate
students and faculty members (Calhoun et al.,
2009, p. 6). The focus group participants
indicated that summaries, abstracts and tables of
contents are helpful for "a quick verification to
determine if it is worth their time to even look at
an item" (Calhoun et al., 2009, p. 17).
Libraries attempted to address this issue as early
as the 1970s through bibliographic record
enhancement projects. For the Subject Access
Project, led by Cochrane (1978) at the University
of Toronto, researchers created a test database of
1,979 catalogue records enhanced with table of
contents and index information. When they
performed 90 searches, they retrieved 56
relevant items in the enhanced database
compared to 14 relevant items in the regular
database. Users of the enhanced database
reported that they were “able to find some items
which would be impossible to locate with L.C.
[Library of Congress] subject headings”
(Cochrane, p. 86). Cochrane identified several
benefits to searching enhanced records,
including “greater access to the books with
relevant information” and “greater precision,
insuring fewer non-relevant items in the search
output” (p. 85).
Researchers have tried to assess the value of
enhanced catalogue records by studying the
circulation rates of the items. In four separate
experimental studies, researchers measured the
circulation rate for materials before and after
their catalogue records were enhanced. In the
first study, no association was found between
catalogue records enhanced with only table of
contents notes and higher circulation rates
(Knutson, 1991). This study involved 291 records
divided into 3 groups: records enhanced with
subject headings and table of contents
information; records enhanced with table of
contents only; and records in the control group
that received no enhancements. The lack of
association of enhancements with circulation
rates may be explained by the small sample size.
In three other experimental studies, researchers
found that the circulation of titles increased
from 5% to 25% after record enhancement
(Dinkins & Kirkland, 2006; Faiks, Rademacher &
Sheehan, 2007; Chercourt & Marshall, 2013).
In five other investigations, researchers
conducted retrospective cohort studies to
determine if library materials with enhanced
catalogue records circulated more than those
with unenhanced records (Morris, 2001;
Madarash-Hill & Hill, 2004; Madarash-Hill &
Hill, 2005; Tosaka & Weng, 2011; Kirkland,
2013). In each of these studies, catalogue record
enhancements were associated with increased
circulation rates. Tosaka and Weng (2011)
conducted one of the largest of these studies at
the College of New Jersey Library, involving
88,538 titles in 4 subject fields (history, social
sciences, language and literature, and science
and technology). The researchers found that
titles published between 1990 and 2004 with
enhanced records had 30% to 50% higher
circulation than those with unenhanced records.
However, record enhancement had no effect on
the circulation of titles published between 2005
and 2008. The researchers found a correlation
between recent publication dates and
circulation, and suggested that library users
prefer more recent publications (Tosaka &
Weng, 2001, p. 420). The researchers also found
that table of contents notes were associated with
higher circulation, but not summary notes.
From the above research, it is apparent that
tables of contents provide additional keywords
that users need to identify resources. This
Evidence Based Library and Information Practice 2015, 10.1
8
enhancement increases user access to library
resources.
None of the nine prior studies examined the
usage of e-books in relation to catalogue record
enhancements. This study was designed to fill
that research gap.
Aims
We began our investigation by asking why
library users select certain e-books but not
others after viewing their catalogue records.
Based on the information gleaned from the
literature review, we focused our study on the
following research questions:
• What is the effect of table of contents or
summary statement in the catalogue
record on the number of uses of the e-
book and the probability of being used
at least once?
• What is the effect of year of publication
and subject on total uses, as well as on
the probability of being used?
• What is the effect of these catalogue
record enhancements on total uses and
the probability of a title being used at
least once, controlling for publication
year and subject?
From these questions, we developed these
hypotheses:
• Titles with either the table of contents or
a summary in the catalogue record
would have more uses than titles with
neither of these features, controlling for
publication year and subject.
• Titles with both table of contents and
summary in the catalogue record would
have more uses, controlling for
publication year and subject.
• Titles with either table of contents or
summary in the catalogue record would
have a greater probability of being used,
controlling for publication year and
subject.
• Titles with both table of contents and
summary in the catalogue record would
have a greater probability of being used,
controlling for publication year and
subject.
Methods
A retrospective cohort study design was
employed.
Data Collection
Three e-book collections were included in this
study: ebrary, EBSCO Ebooks and NetLibrary.
The ebrary collection was available on the
ebrary publishing platform. The EBSCO Ebooks
and NetLibrary collections were available on the
EBSCO publishing platform. The MARC records
were downloaded from the integrated library
system into a set of spreadsheets. The unit of
analysis was the MARC record, which
represented a unique e-book title from a
particular vendor. While no attempt was made
to analyze the distribution of titles by language,
it is clear that the vast majority of the titles were
in the English language. Usage data were
collected from the platforms in the form of
COUNTER Book Reports, either BR1 or BR2.
The COUNTER BR1 (supplied by EBSCO)
provides the “number of successful title
requests,” while the BR2 (supplied by ebrary)
reports the “number of successful section
requests” (COUNTER, 2008). The former
reports the number of titles used, while the latter
reports the number of chapters or other sections
downloaded. While these are not the same
measures, most platforms provide only one or
the other. Therefore, “use” in this study is
defined as either a request for an entire e-book
or the downloading of chapters or other
sections. The total usage for calendar years 2012
and 2013 was used as the measure of total usage.
Titles with a usage of one or more were flagged
as titles used. These two measures, total usage
(counts) and titles used (binomial), were the
Evidence Based Library and Information Practice 2015, 10.1
9
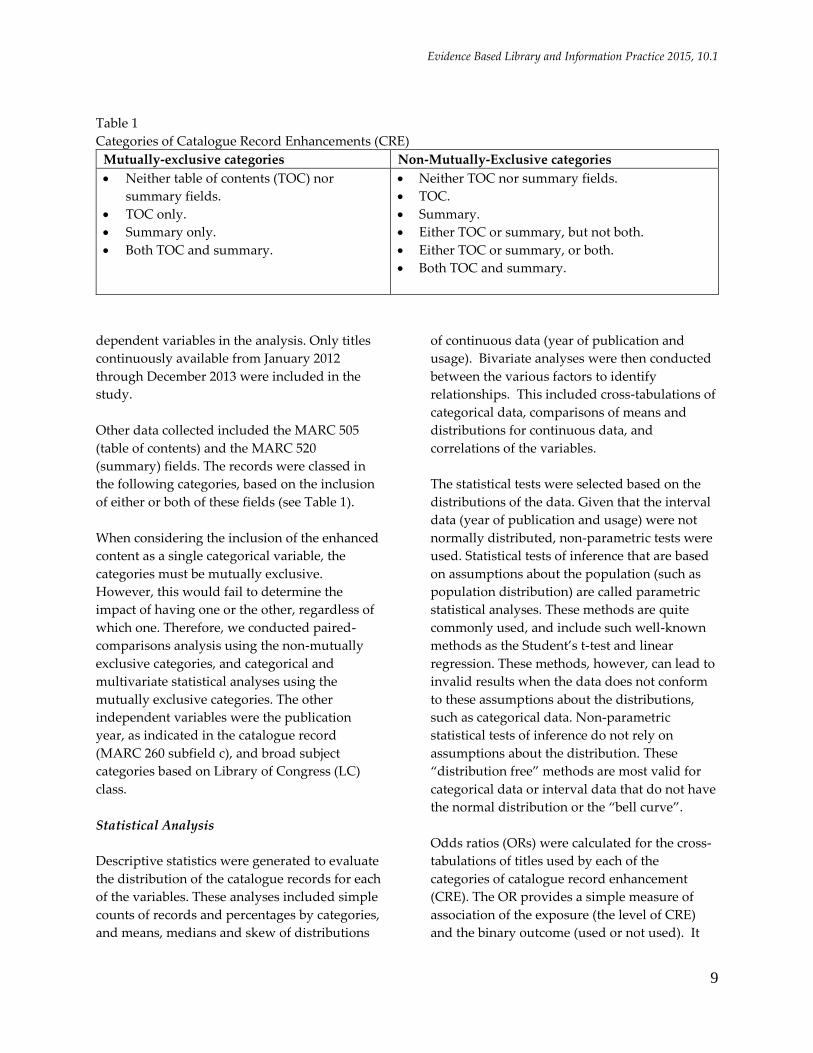
Table 1
Categories of Catalogue Record Enhancements (CRE)
Mutually-exclusive categories Non-Mutually-Exclusive categories
Neither table of contents (TOC) nor
summary fields.
TOC only.
Summary only.
Both TOC and summary.
Neither TOC nor summary fields.
TOC.
Summary.
Either TOC or summary, but not both.
Either TOC or summary, or both.
Both TOC and summary.
dependent variables in the analysis. Only titles
continuously available from January 2012
through December 2013 were included in the
study.
Other data collected included the MARC 505
(table of contents) and the MARC 520
(summary) fields. The records were classed in
the following categories, based on the inclusion
of either or both of these fields (see Table 1).
When considering the inclusion of the enhanced
content as a single categorical variable, the
categories must be mutually exclusive.
However, this would fail to determine the
impact of having one or the other, regardless of
which one. Therefore, we conducted paired-
comparisons analysis using the non-mutually
exclusive categories, and categorical and
multivariate statistical analyses using the
mutually exclusive categories. The other
independent variables were the publication
year, as indicated in the catalogue record
(MARC 260 subfield c), and broad subject
categories based on Library of Congress (LC)
class.
Statistical Analysis
Descriptive statistics were generated to evaluate
the distribution of the catalogue records for each
of the variables. These analyses included simple
counts of records and percentages by categories,
and means, medians and skew of distributions
of continuous data (year of publication and
usage). Bivariate analyses were then conducted
between the various factors to identify
relationships. This included cross-tabulations of
categorical data, comparisons of means and
distributions for continuous data, and
correlations of the variables.
The statistical tests were selected based on the
distributions of the data. Given that the interval
data (year of publication and usage) were not
normally distributed, non-parametric tests were
used. Statistical tests of inference that are based
on assumptions about the population (such as
population distribution) are called parametric
statistical analyses. These methods are quite
commonly used, and include such well-known
methods as the Student’s t-test and linear
regression. These methods, however, can lead to
invalid results when the data does not conform
to these assumptions about the distributions,
such as categorical data. Non-parametric
statistical tests of inference do not rely on
assumptions about the distribution. These
“distribution free” methods are most valid for
categorical data or interval data that do not have
the normal distribution or the “bell curve”.
Odds ratios (ORs) were calculated for the cross-
tabulations of titles used by each of the
categories of catalogue record enhancement
(CRE). The OR provides a simple measure of
association of the exposure (the level of CRE)
and the binary outcome (used or not used). It
Evidence Based Library and Information Practice 2015, 10.1
10
ranges from zero to infinity, and a value of one
indicates no difference in outcome between the
two exposure groups (has or does not have the
CRE). A value greater than one indicates a
greater probability of use for a title with that
level of CRE. A value less than one indicates that
the title without that feature has greater
probability of being used. The OR includes a
95% confidence interval (95% CI).
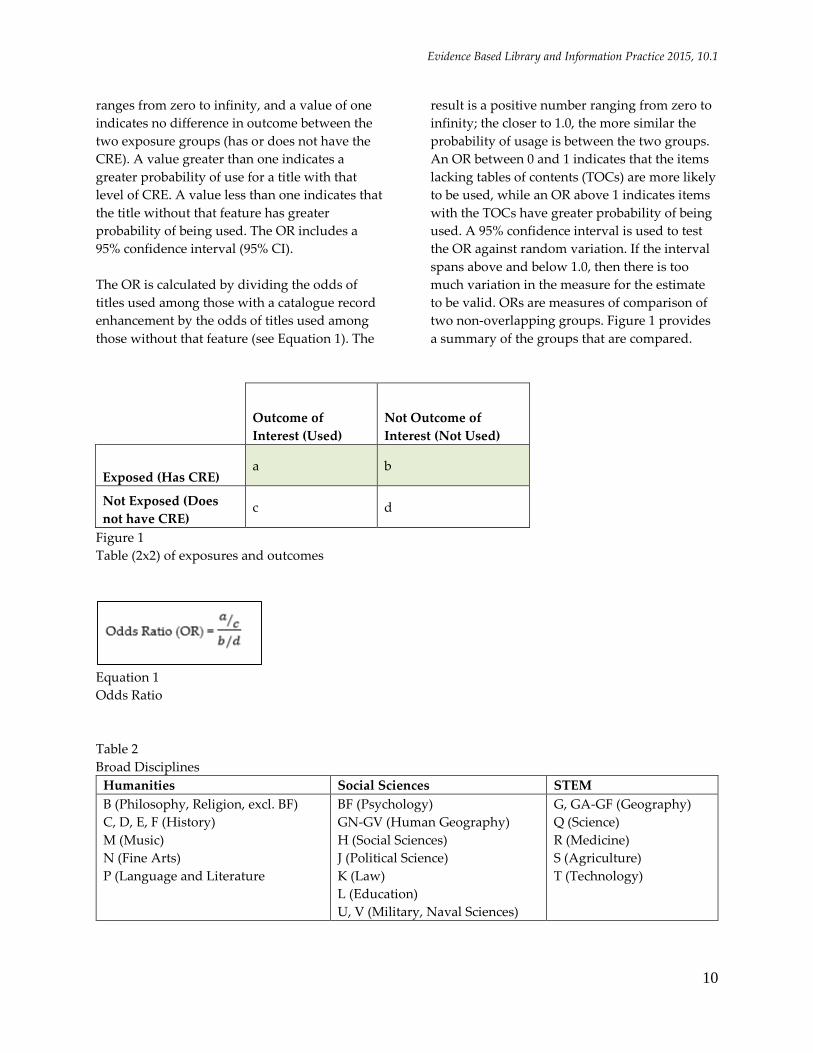
The OR is calculated by dividing the odds of
titles used among those with a catalogue record
enhancement by the odds of titles used among
those without that feature (see Equation 1). The
result is a positive number ranging from zero to
infinity; the closer to 1.0, the more similar the
probability of usage is between the two groups.
An OR between 0 and 1 indicates that the items
lacking tables of contents (TOCs) are more likely
to be used, while an OR above 1 indicates items
with the TOCs have greater probability of being
used. A 95% confidence interval is used to test
the OR against random variation. If the interval
spans above and below 1.0, then there is too
much variation in the measure for the estimate
to be valid. ORs are measures of comparison of
two non-overlapping groups. Figure 1 provides
a summary of the groups that are compared.
Outcome of
Interest (Used)
Not Outcome of
Interest (Not Used)
Exposed (Has CRE) a b
Not Exposed (Does
not have CRE) c d
Figure 1
Table (2x2) of exposures and outcomes
Equation 1
Odds Ratio
Table 2
Broad Disciplines
Humanities Social Sciences STEM
B (Philosophy, Religion, excl. BF)
C, D, E, F (History)
M (Music)
N (Fine Arts)
P (Language and Literature
BF (Psychology)
GN-GV (Human Geography)
H (Social Sciences)
J (Political Science)
K (Law)
L (Education)
U, V (Military, Naval Sciences)
G, GA-GF (Geography)
Q (Science)
R (Medicine)
S (Agriculture)
T (Technology)
Evidence Based Library and Information Practice 2015, 10.1
11
For comparing total uses across the factors, the
Kruskal-Wallis rank test was used to test for
significance. This is a non-parametric test of
significance of differences in the distributions of
uses between the two or more groups (with and
without the CRE).
To control for differences due to subject
coverage, the titles were categorized into one of
three broad disciplines: humanities, social
sciences and STEM (science, technology,
engineering and mathematics). These categories
are similar to those used by Michael Levine-
Clark (2014) in his recent analysis of e-books
from multiple collections. The only difference
was the inclusion of ranges on geography (LC
Class G), which we split between STEM and
social sciences (see Table 2). Differences in the
mean publication year and the inclusion of
catalogue record enhancements between these
broad disciplines were examined. In addition,
we analyzed differences in the mean usage and
ORs of being used to determine the effect of
discipline on usage.
To control for year of publication, the titles were
grouped by year, with roughly the same number
of titles in each group, and the mean uses, as
well as ORs of titles used, were compared
between the groups. Differences in the means
and the ORs between the groups were
indications of the amount of influence the year
of publication had on the effects of catalogue
record enhancements on usage.
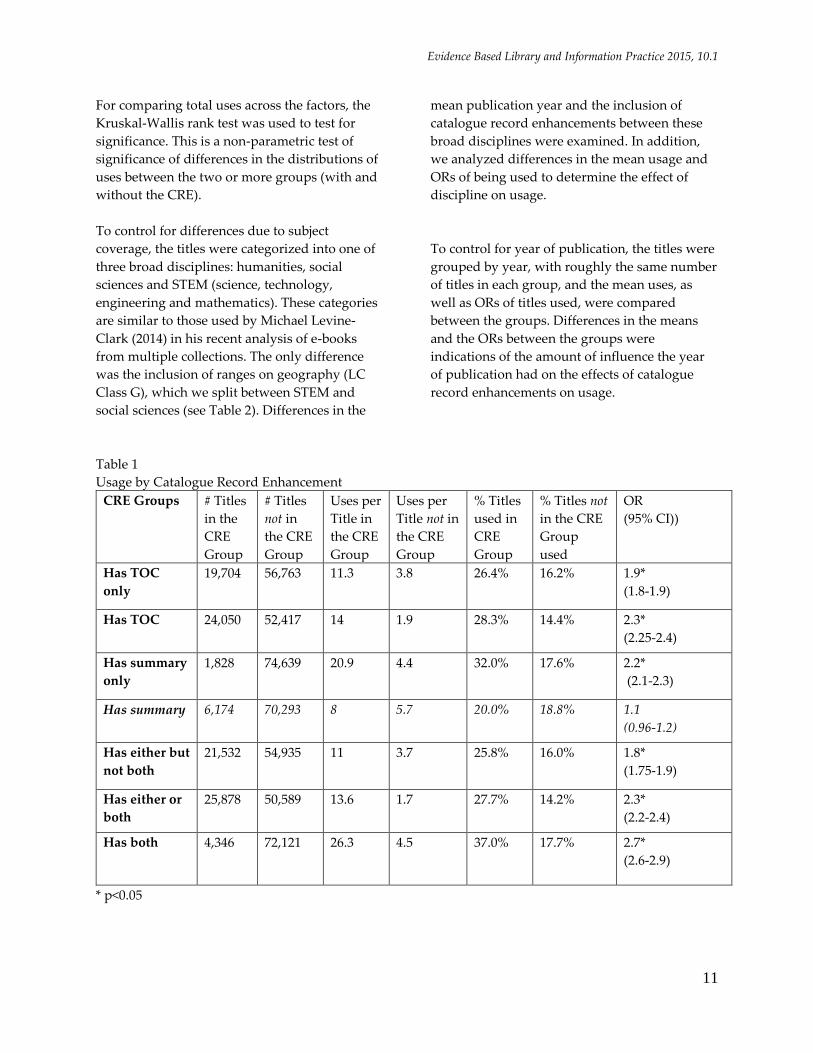
Table 1
Usage by Catalogue Record Enhancement
CRE Groups # Titles
in the
CRE
Group
# Titles
not in
the CRE
Group
Uses per
Title in
the CRE
Group
Uses per
Title not in
the CRE
Group
% Titles
used in
CRE
Group
% Titles not
in the CRE
Group
used
OR
(95% CI))
Has TOC
only
19,704 56,763 11.3 3.8 26.4% 16.2% 1.9*
(1.8-1.9)
Has TOC 24,050 52,417 14 1.9 28.3% 14.4% 2.3*
(2.25-2.4)
Has summary
only
1,828 74,639 20.9 4.4 32.0% 17.6% 2.2*
(2.1-2.3)
Has summary 6,174 70,293 8 5.7 20.0% 18.8% 1.1
(0.96-1.2)
Has either but
not both
21,532 54,935 11 3.7 25.8% 16.0% 1.8*
(1.75-1.9)
Has either or
both
25,878 50,589 13.6 1.7 27.7% 14.2% 2.3*
(2.2-2.4)
Has both 4,346 72,121 26.3 4.5 37.0% 17.7% 2.7*
(2.6-2.9)
* p<0.05
Evidence Based Library and Information Practice 2015, 10.1
12
Results
The data set used in the final analysis included a
total of 76,467 records from 3 collections. About
32% of the titles (24,050) had TOCs in the
catalogue records, and only about 8% of the
titles (6,174) included summaries. The
distribution of titles with TOCs and summaries
was not equal across platforms. Similarly, the
collections varied in the mean and median
publication years, with titles from the EBSCO or
NetLibrary sets more than ten years older than
the ebrary titles.
Usage by Catalogue Record Enhancements
(CRE)
There were apparent differences in the
publication year, mean usage, and number of
titles used between the groups that have and do
not have the enhanced catalogue content (see
Table 3). Those with the added content were
more recently published, and had much higher
mean usage and greater rate of titles used. A
wide range of analytical techniques was used to
determine if these differences were due to
publication year, subject, or chance.
The simplest method was a cross-tabulation of
titles used by the exposure (i.e., the enhanced
catalogue content). Using such a method, we can
provide an OR measure that describes the
probability that a title having the exposure (TOC
or summary in catalogue record) was used
against a title lacking the exposure.
Most of the ORs were significant, favouring the
inclusion of at least one of the catalogue record
enhancements, and the highest OR favoured
having both (see Table 3). The analysis shows
that a title with at least one of the features was
over 80% more likely to be used than those with
neither, and over twice as likely if it has both
features. Titles having the keyword summary
only, however, were not significantly more
likely to be used. It is clear that TOCs and
summaries in the catalogue record had a
positive effect on the title being used at least
once. The publication year in all of these groups,
however, was also associated with the inclusion
of catalogue record enhancements, and must be
taken into consideration before concluding that
the enhancements were, indeed, associated with
increased usage.
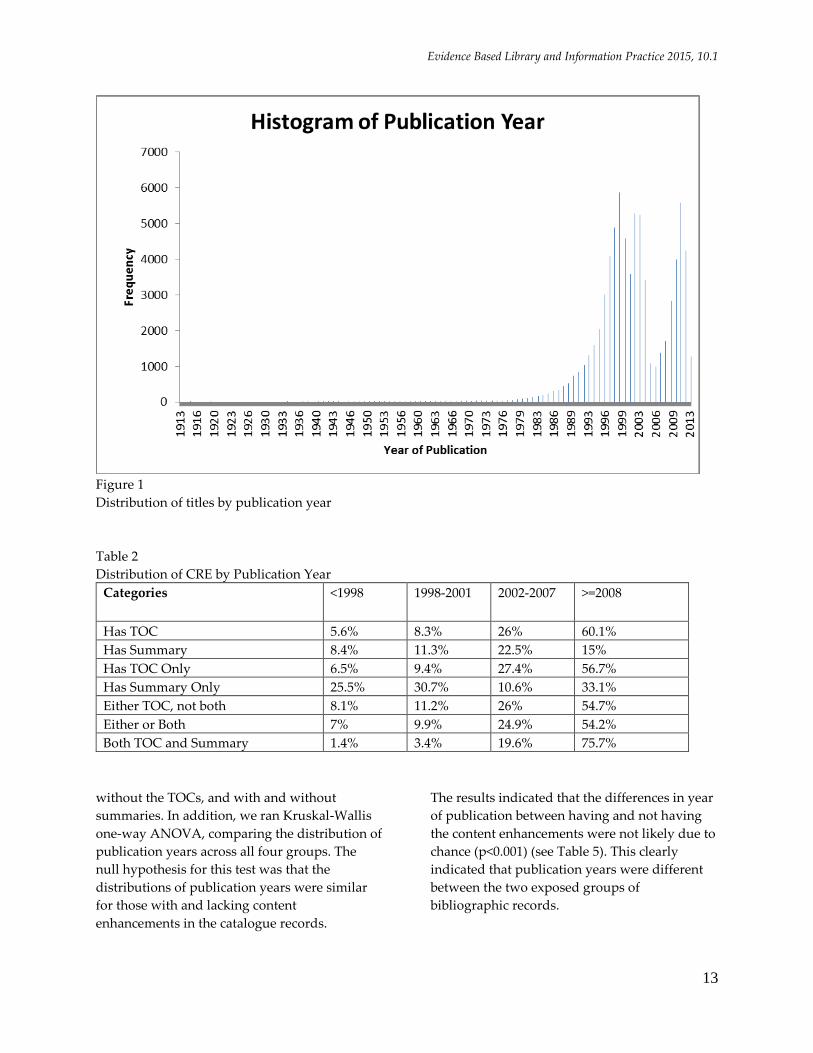
Distribution by Publication Year
Because the publication year had been identified
as a key factor in usage of items, we evaluated
the distribution of e-books by publication year
(Tosaka & Weng, 2011, p. 419; Morris, 2001, p.
34). Interestingly, the distribution of publication
years was bimodal (two “humps”) (see Figure
2). There is a drop in the number of titles
between 2003 and 2008. This, combined with
the severe skewing to the left, indicated that
statistical tests based on normal distributions
would not be appropriate. The titles were then
grouped by publication year into four
approximately equal groups based on their
distribution: <=1998, 1999-2001, 2002-2007,
>=2008.
The distribution of catalogue enhancements
varied across the publication year groups.
Generally, the more recently published books
had greater rates of these enhancements, as well
as lower rates of only one of the enhancements
(see Table 4).
Similar to Tosaka and Weng (2011, p. 417-418),
we determined that the e-book records with
TOCs and those with summaries tended to be
more recent than those without (see Table 3). To
determine if this variation could be random, we
used the non-parametric tests, Mann-Whitney U
and Kolmogonov-Smirnov tests, comparing the
mean publication years between those with and
Evidence Based Library and Information Practice 2015, 10.1
13
Figure 1
Distribution of titles by publication year
Table 2
Distribution of CRE by Publication Year
Categories <1998 1998-2001 2002-2007 >=2008
Has TOC 5.6% 8.3% 26% 60.1%
Has Summary 8.4% 11.3% 22.5% 15%
Has TOC Only 6.5% 9.4% 27.4% 56.7%
Has Summary Only 25.5% 30.7% 10.6% 33.1%
Either TOC, not both 8.1% 11.2% 26% 54.7%
Either or Both 7% 9.9% 24.9% 54.2%
Both TOC and Summary 1.4% 3.4% 19.6% 75.7%
without the TOCs, and with and without
summaries. In addition, we ran Kruskal-Wallis
one-way ANOVA, comparing the distribution of
publication years across all four groups. The
null hypothesis for this test was that the
distributions of publication years were similar
for those with and lacking content
enhancements in the catalogue records.
The results indicated that the differences in year
of publication between having and not having
the content enhancements were not likely due to
chance (p<0.001) (see Table 5). This clearly
indicated that publication years were different
between the two exposed groups of
bibliographic records.
Evidence Based Library and Information Practice 2015, 10.1
14
Table 5
Median Publication Year by Groups
# Titles Median Publication Year
Overall 73,936 2002
Has Neither 48,104 (65%) 1999
Has Summary Only 1,789 (2.4%) 2000
Has TOC Only 19,697 (26.6%) 2009
Has Both 4,346 (6%) 2010
Table 6
Usage by Publication Year Group
Publication Year Group Mean Uses % Used
<1998 0.45 1.6%
1998-2001 0.89 2.2%
2002-2007 3.09 2.7%
>=2008 18.31 4.6%
Table 7
Usage by Broad Discipline
n (%) Mean Uses % Used OR (95% CI)
Humanities 28,735 (38%) 4.5 2.4% 1.2 (1.1-1.3)
Social Sciences 29,778 (39%) 6.1 3.1% 0.8 (0.73-0.87)
STEM 17,684 (23%) 7.1 2.6% 1.07 (0.96-1.2)
Overall 76,197 (100%) 5.7 2.7%
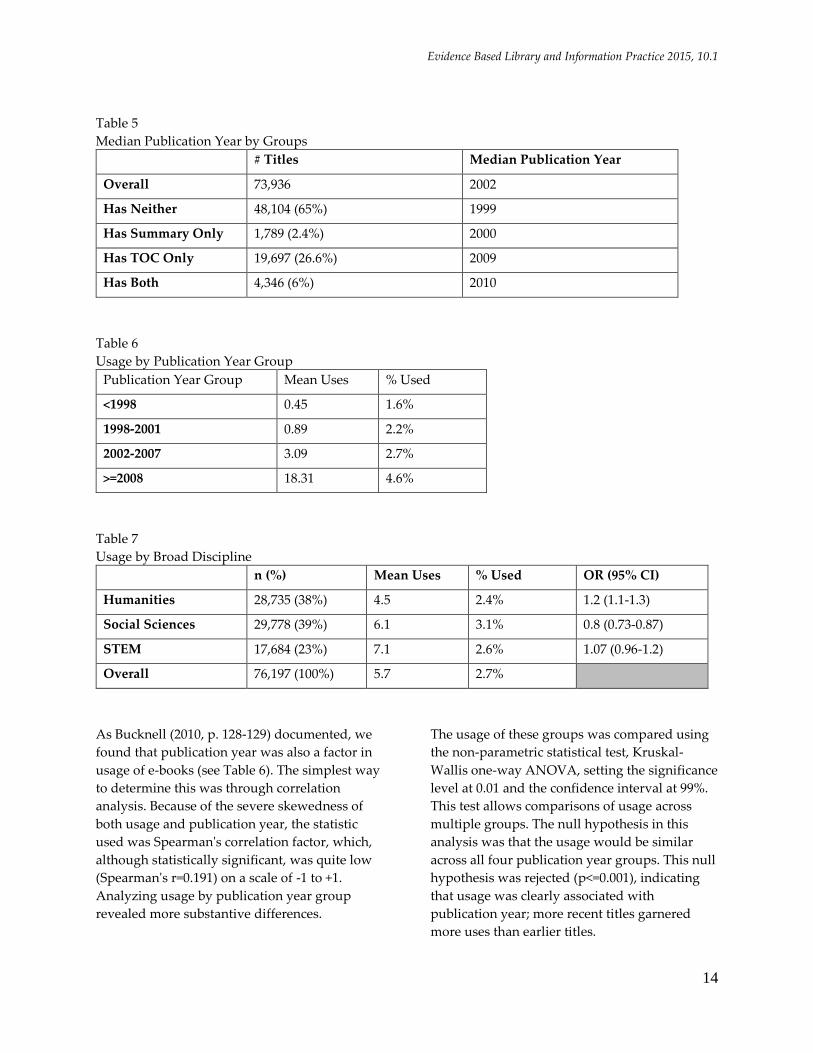
As Bucknell (2010, p. 128-129) documented, we
found that publication year was also a factor in
usage of e-books (see Table 6). The simplest way
to determine this was through correlation
analysis. Because of the severe skewedness of
both usage and publication year, the statistic
used was Spearman's correlation factor, which,
although statistically significant, was quite low
(Spearman's r=0.191) on a scale of -1 to +1.
Analyzing usage by publication year group
revealed more substantive differences.
The usage of these groups was compared using
the non-parametric statistical test, Kruskal-
Wallis one-way ANOVA, setting the significance
level at 0.01 and the confidence interval at 99%.
This test allows comparisons of usage across
multiple groups. The null hypothesis in this
analysis was that the usage would be similar
across all four publication year groups. This null
hypothesis was rejected (p<=0.001), indicating
that usage was clearly associated with
publication year; more recent titles garnered
more uses than earlier titles.
Evidence Based Library and Information Practice 2015, 10.1
15
Given the association of publication year on the
exposure variables (catalogue record
enhancements) and on the outcome (usage), it
was clear that publication year could confound
the effect of the catalogue record enhancements
on usage, making it difficult to tell the difference
between the effects of the age of the book and
those of the catalogue record enhancements
Usage Across Broad Disciplines
As mentioned above, the titles were categorized
into one of three broad disciplines based on their
LC classification. There was a negligible set (270
titles, 0.4%) that were not categorized due to
various reasons. The distribution of titles across
these three categories was not even, with just
under 40% in both humanities and social
sciences, and just over 20% in STEM. Usage of
titles within each category varied slightly (see
Table 7), with STEM titles having the most mean
uses per title (7) and social sciences titles having
a greater percentage of titles used at least once
(3%). While the ORs of the paired-comparisons
of these groups were statistically significant, the
size of their effect (20% greater or lesser odds of
usage) was not very notable. It appears that
broad discipline may have had a slight effect on
usage.
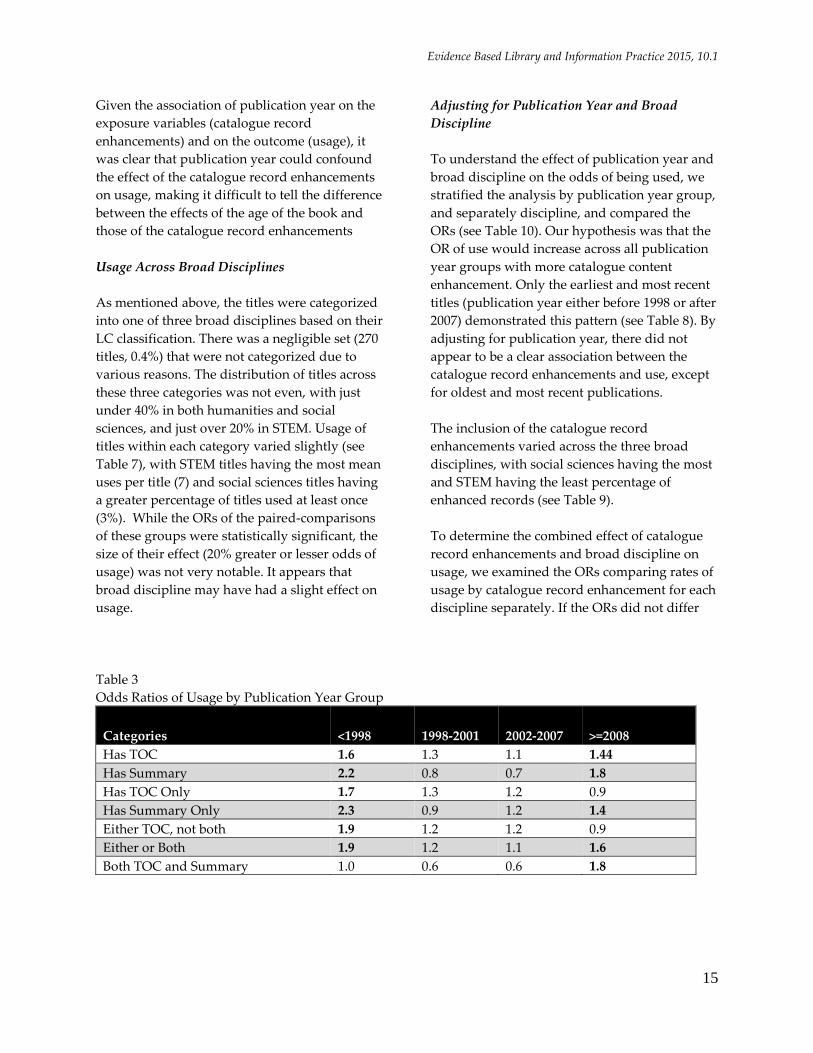
Adjusting for Publication Year and Broad
Discipline
To understand the effect of publication year and
broad discipline on the odds of being used, we
stratified the analysis by publication year group,
and separately discipline, and compared the
ORs (see Table 10). Our hypothesis was that the
OR of use would increase across all publication
year groups with more catalogue content
enhancement. Only the earliest and most recent
titles (publication year either before 1998 or after
2007) demonstrated this pattern (see Table 8). By
adjusting for publication year, there did not
appear to be a clear association between the
catalogue record enhancements and use, except
for oldest and most recent publications.
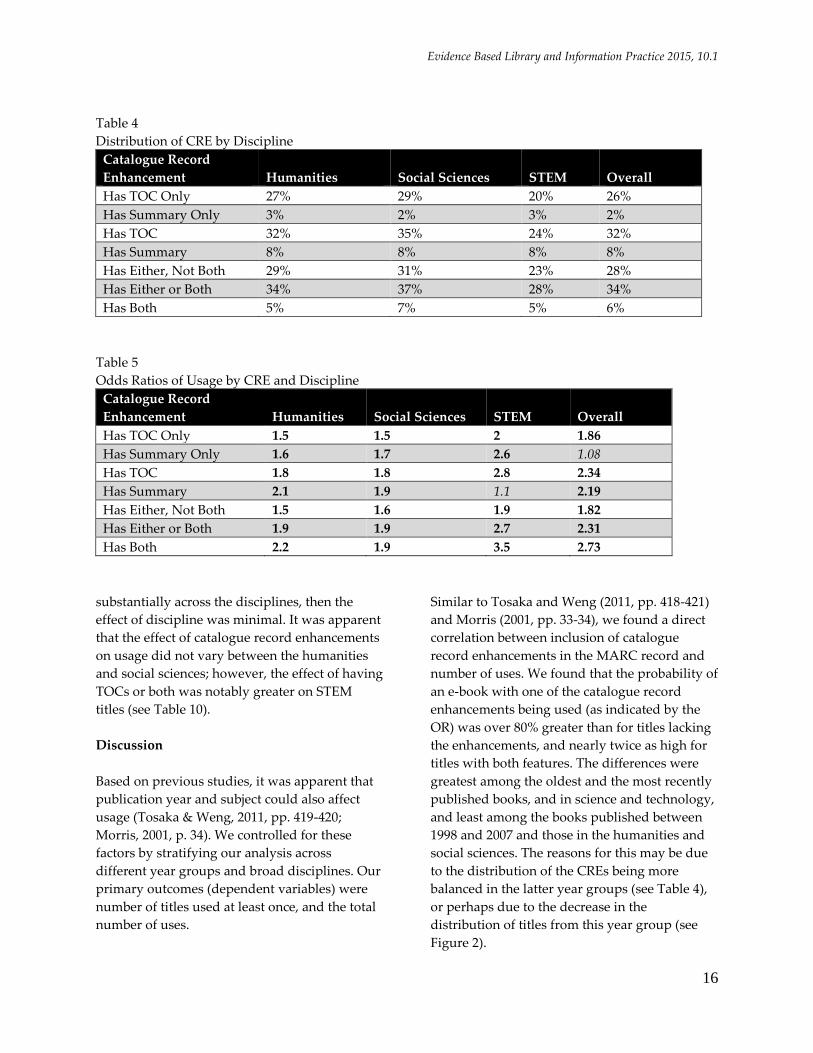
The inclusion of the catalogue record
enhancements varied across the three broad
disciplines, with social sciences having the most
and STEM having the least percentage of
enhanced records (see Table 9).
To determine the combined effect of catalogue
record enhancements and broad discipline on
usage, we examined the ORs comparing rates of
usage by catalogue record enhancement for each
discipline separately. If the ORs did not differ
Table 3
Odds Ratios of Usage by Publication Year Group
Categories <1998 1998-2001 2002-2007 >=2008
Has TOC 1.6 1.3 1.1 1.44
Has Summary 2.2 0.8 0.7 1.8
Has TOC Only 1.7 1.3 1.2 0.9
Has Summary Only 2.3 0.9 1.2 1.4
Either TOC, not both 1.9 1.2 1.2 0.9
Either or Both 1.9 1.2 1.1 1.6
Both TOC and Summary 1.0 0.6 0.6 1.8
Evidence Based Library and Information Practice 2015, 10.1
16
Table 4
Distribution of CRE by Discipline
Catalogue Record
Enhancement Humanities Social Sciences STEM Overall
Has TOC Only 27% 29% 20% 26%
Has Summary Only 3% 2% 3% 2%
Has TOC 32% 35% 24% 32%
Has Summary 8% 8% 8% 8%
Has Either, Not Both 29% 31% 23% 28%
Has Either or Both 34% 37% 28% 34%
Has Both 5% 7% 5% 6%
Table 5
Odds Ratios of Usage by CRE and Discipline
Catalogue Record
Enhancement Humanities Social Sciences STEM Overall
Has TOC Only 1.5 1.5 2 1.86
Has Summary Only 1.6 1.7 2.6 1.08
Has TOC 1.8 1.8 2.8 2.34
Has Summary 2.1 1.9 1.1 2.19
Has Either, Not Both 1.5 1.6 1.9 1.82
Has Either or Both 1.9 1.9 2.7 2.31
Has Both 2.2 1.9 3.5 2.73
substantially across the disciplines, then the
effect of discipline was minimal. It was apparent
that the effect of catalogue record enhancements
on usage did not vary between the humanities
and social sciences; however, the effect of having
TOCs or both was notably greater on STEM
titles (see Table 10).
Discussion
Based on previous studies, it was apparent that
publication year and subject could also affect
usage (Tosaka & Weng, 2011, pp. 419-420;
Morris, 2001, p. 34). We controlled for these
factors by stratifying our analysis across
different year groups and broad disciplines. Our
primary outcomes (dependent variables) were
number of titles used at least once, and the total
number of uses.
Similar to Tosaka and Weng (2011, pp. 418-421)
and Morris (2001, pp. 33-34), we found a direct
correlation between inclusion of catalogue
record enhancements in the MARC record and
number of uses. We found that the probability of
an e-book with one of the catalogue record
enhancements being used (as indicated by the
OR) was over 80% greater than for titles lacking
the enhancements, and nearly twice as high for
titles with both features. The differences were
greatest among the oldest and the most recently
published books, and in science and technology,
and least among the books published between
1998 and 2007 and those in the humanities and
social sciences. The reasons for this may be due
to the distribution of the CREs being more
balanced in the latter year groups (see Table 4),
or perhaps due to the decrease in the
distribution of titles from this year group (see
Figure 2).
Evidence Based Library and Information Practice 2015, 10.1
17
The limitations of which we were aware
included the limited number of e-book
platforms represented (two), the confluence of
COUNTER BR1 (titles used) with BR2 (sections
used) measures, the effects of assigned readings
on usage, and any preference by the patrons for
platform. When instructors request the library
purchase titles for assigned readings, our policy
is to purchase these titles as e-books with a
licence to allow multiple users access. The data
that identified such titles was not available for
analysis, so this could be a factor in the results.
Finally, while patrons may express their
preference for e-book platforms in surveys and
usability studies, demonstrated preference by
platform through purposeful selection and non-
selection should be examined more carefully.
Given the large sample size and the statistical
analyses, the results demonstrate a clear and
consistent relationship between catalogue record
enhancements and e-book usage of any kind.
Our next step is to conduct an experimental
study, adding such content to randomly selected
titles that had not been used. If an increase in
the usage of these titles results, we will plan to
add into the workflow the addition of these
fields to the catalogue records. We also plan to
extend this study to the use of printed materials,
particularly those housed in remote storage
facilities. We would like to know if adding such
content will increase their likelihood of
continued usage even after resources are
removed from the open stacks. Finally, it would
be interesting to examine the effects of
providing bibliographic records with thumbnail
cover images on usage.
Conclusion
Our primary reason for conducting this study
was to better understand why certain e-books
were used and others were not. Because usage
data indicated that users discovered most titles
in the catalogue, we focused on differences in
the MARC catalogue record. The inclusion of
enhancements to the catalogue records was our
first target, notably the MARC 505 field for
tables of contents (TOCs) and the MARC 520
field for summary statements. Our literature
review indicated that such enhancements could
be associated with increased likelihood of being
used in print, as well as increased number of
times being used. This study was a retrospective
cohort study, where titles were categorized and
their usage analyzed based on the inclusion of
defined catalogue record enhancements. One
cohort had MARC 505, another had MARC 520,
and a final had neither. From the first two
cohorts, we analyzed subgroups, including
those that had one or the other but not both, and
those with both. Because of the size of our
collection (more than 75,000 titles, of which
nearly 10,000 were used at least once), we were
able to conduct subgroup analyses using robust
statistical methods and significance criteria.
By studying information seeking behaviour, it is
possible to discover catalogue record
enhancements that have facilitated library users’
research. By adding these enhancements to
catalogue records, and by advocating for their
inclusion in vendor-supplied records, libraries
can make their catalogues and collections more
accessible to users.
References
Best, R. D. (2008). The University of Pittsburgh
study in an electronic environment:
Have e-books changed usage patterns of
monographs? Acquisitions Librarian, 19
(3-4), 311-323.
http://dx.doi.org/10.1080/0896357080202
6369
Bucknell, T. (2010). The ‘big deal’ approach to
acquiring e-books: A usage-based study,
Serials, 23(2), 126-134.
http://dx.doi.org/10.1629/23126
Calhoun, K. Cantrell, J., Gallagher, M., & Hawk,
J. (2009). Online catalogs: What users and
librarians want. Dublin, Ohio: OCLC.
Evidence Based Library and Information Practice 2015, 10.1
18
Chercourt, M. & Marshall, L. (2013). Making
keywords work: Connecting patrons to
resources through enhanced
bibliographic records. Technical Services
Quarterly, 30(3), 285-295.
http://dx.doi.org/10.1080/07317131.2013.
785786
Cochrane, P.A. (1978). Books are for use: Final
report of the Subject Access Project to the
Council on Library Resources. Syracuse,
N.Y.: School of Information Studies,
Syracuse University.
COUNTER (2008). COUNTER code of practice:
Journals and databases (Release 3).
Retrieved from
http://www.project.counter.org/r3/Relea
se3D9.pdf
Dinkins, D., & Kirkland, L. N. (2006). It's what's
inside that counts: Adding contents
notes to bibliographic records and its
impact on circulation. College &
Undergraduate Libraries, 13(1), 59-71.
http://dx.doi.org/10.1300/J106v13n01_07
Faiks, A., Radermacher, A., & Sheehan, A.
(2007). What about the book: Google-
izing the catalog with tables of contents.
[Special issue] Library Philosophy &
Practice (June), 1-12.
Galvin, T. J., & Kent, A. (1977). Use of a
university library collection: A progress
report on a Pittsburgh study. Library
Journal, 102(20), 2317-2320.
Kirkland, L. N. (2013). The relationship of
metadata to item circulation. Cataloging
& Classification Quarterly 51(5), 510-531.
http://dx.doi.org/10.1080/01639374.2012.
762963
Knutson, G. S. (1991). Subject enhancement:
Report on an experiment. College &
Research Libraries, 52(1), 65-79.
Levine-Clark, M. (2014, March) E-book usage:
Navigating the swell of information.
Paper presented at the 9th Electronic
Resources and Libraries Conference,
Austin, Texas. Retrieved from
http://www.slideshare.net/MichaelLevin
eClark/levineclark-michael-diving-into-
ebook-usage-assessing-the-swell-of-
information-electronic-resources-
libraries-austin-march-17-2014
Madarash-Hill, C. & Hill, J. B. (2004). Enhancing
access to IEEE conference proceedings:
A case study in the application of IEEE
Xplore full text and table of contents
enhancements. Science & Technology
Libraries, 24(3/4), 389-399.
http://dx.doi.org/10.1300/J122v24n03_09
Madarash-Hill, C. & Hill, J. B. (2005).
Electronically enriched enhancements in
catalog records: A use study of books
described on records with URL
enhancements versus those without.
Technical Services Quarterly, 23(2), 19-31.
http://dx.doi.org/10.1300/J124v23n02_02
Markey, K. (1983) Online catalog use: Results of
surveys and focus group interviews in
several libraries. Final report to the
Council on Library Resources (Vol. 2).
Dublin, Ohio: OCLC Online Computer
Library Center.
Matthews, J. R. (2014). Consulting services.
Retrieved from
http://www.joematthews.org/consulting
-services.html
Matthews, J. R., & Lawrence, G. S. (1984).
Further analysis of the CLR Online
Catalog Project. Information Technology
and Libraries, 3(4), 354-376.
Evidence Based Library and Information Practice 2015, 10.1
19
Morris, R. C. (2001). Online tables of
contents for books: Effect on
usage. Bulletin of the Medical
Library Association, 89(1): 29-36.
Morse, P. M., & Chen, C. (1975). Using
circulation desk data to obtain
unbiased estimates of book use.
Library Quarterly, 45(2), 179-194.
Tosaka, Y., & Weng, C. (2011).
Reexamining content-enriched
access: Its effect on usage and
discovery. College & Research
Libraries, 72(5), 412-427.
http://dx.doi.org/10.5860/crl-137
Trueswell, R. W. (1968). Some
circulation data from a research
library. College & Research
Libraries, 29(6), 493-495.
Trueswell, R. W. (1969). Some
behavioral patterns of library
users: The 80/20 rule. Wilson
Library Bulletin, 43(5), 458-461.


![The Future Of Evidence Based Library & Information …...• Koufogiannakis, D. "What is Evidence?." Evidence Based Library and Information Practice [Online], 6.2 (2011): 1-3. Web](https://img.pdfslide.us/doc/110x75/5f7cf3496507587599158016/the-future-of-evidence-based-library-information-a-koufogiannakis-d.jpg)