Embed Size (px)
Citation preview
Evidence and Evaluation Summary 2008-2015
2 | Live Life Well @ School
Suggested citation A Bravo, C Innes-Hughes, B J O’Hara, B McGill & C Rissel. Live Life Well @ School: Evidence and Evaluation Summary 2008-2015. North Sydney: NSW Ministry of Health, 2016.
Acknowledgements The authors would like to acknowledge the contribution of Rhonda Matthews, the NSW Department of Education, Catholic Education Commission NSW, Association of Independent Schools NSW and the Local Health District Health Promotion teams to the development and delivery of the Live Life Well @ School program.
NSW MINISTRY OF HEALTH 73 Miller Street NORTH SYDNEY NSW 2060 Tel. (02) 9391 9000 Fax. (02) 9391 9101 TTY. (02) 9391 9900 www.health.nsw.gov.au
This work is copyright. It may be reproduced in whole or in part for study or training purposes subject to the inclusion of an acknowledgement of the source. It may not be reproduced for commercial usage or sale. Reproduction for the purposes other than those indicated above requires written permission from the NSW Ministry of Health
© NSW Ministry of Health 2016
SHPN: (CPH) 160299 ISBN: 978-1-76000-474-3 ISBN (online): 978-1-76000-475-0
Further copies of this resource can be downloaded from www.healthykids.nsw.gov.au
August 2016
Evidence and Evaluation Summary 2008-2015 | 3
Contents
Executive Summary .............................................................................................................................4
1. Background & Evidence ................................................................................................................6
1.1 Prevalence of overweight and obesity in primary school aged children ................6
1.2 Consequences of overweight and obesity ........................................................................6
1.3 Importance of interventions in primary school aged children ..................................7
1.4 Evidence base for interventions in primary schools .....................................................7
2. The Live Life Well @ School program ....................................................................................9
2.1 Overview of the Live Life Well @ School program .........................................................9
2.2 School based policies and programs ............................................................................... 10
2.3 Program practices of the Live Life Well @ School program ..................................... 11
3. Evaluation of the Live Life Well @ School program....................................................... 12
3.1 Overview of the evaluation .................................................................................................... 12
3.2 Implementation of the Live Life Well @ School program ......................................... 12
3.2.1 Components of the Live Life Well @ School program ..................................... 12
3.2.2 Workshop delivery ........................................................................................................ 15
3.2.3 Conference delivery ...................................................................................................... 16
3.3 Adoption of the Live Life Well @ School program .....................................................17
3.3.1 Program adoption over time .......................................................................................17
3.3.2 Program adoption by priority population groups ............................................ 18
3.4 Impact of the Live Life Well @ School program .......................................................... 19
3.4.1 Practice achievements over time ............................................................................. 19
3.4.2 Practice achievements by priority population groups ....................................22
3.5 Data sources and limitations .............................................................................................. 26
3.5.1 Monitoring ........................................................................................................................ 26
3.5.2 Data collection processes ......................................................................................... 26
4. Future Directions ......................................................................................................................... 29
5. References ....................................................................................................................................... 25
4 | Live Life Well @ School
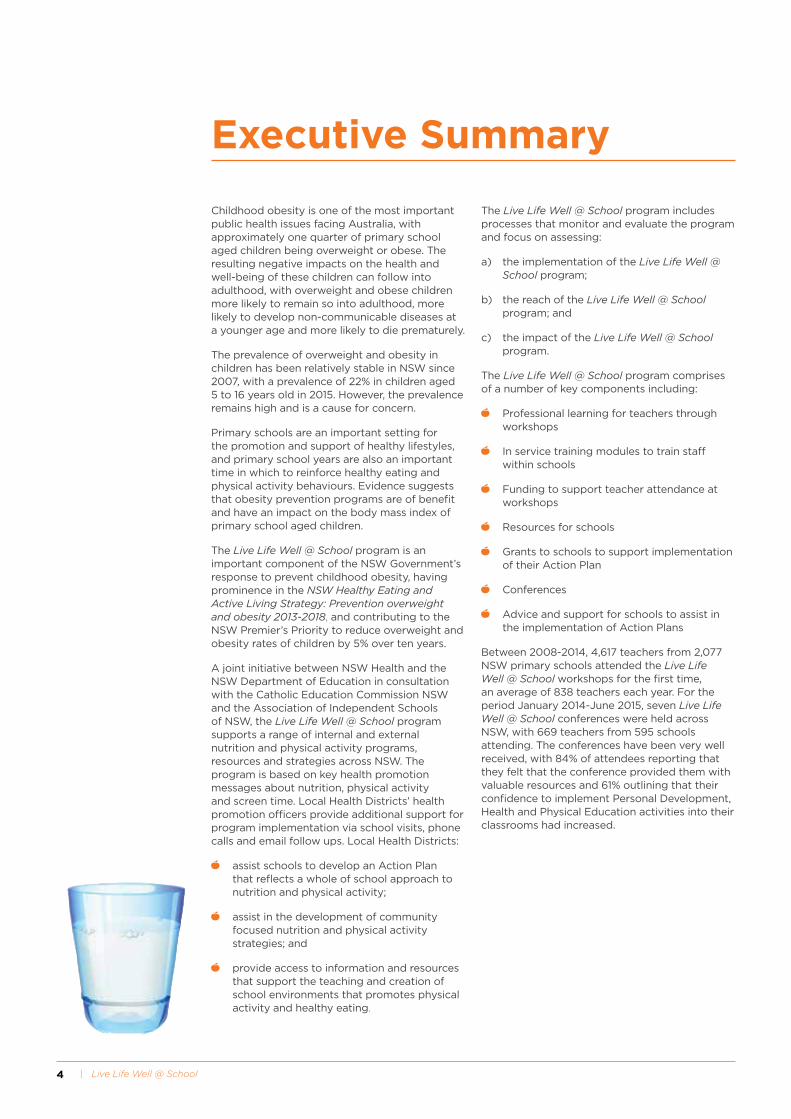
Childhood obesity is one of the most important public health issues facing Australia, with approximately one quarter of primary school aged children being overweight or obese. The resulting negative impacts on the health and well-being of these children can follow into adulthood, with overweight and obese children more likely to remain so into adulthood, more likely to develop non-communicable diseases at a younger age and more likely to die prematurely.
The prevalence of overweight and obesity in children has been relatively stable in NSW since 2007, with a prevalence of 22% in children aged 5 to 16 years old in 2015. However, the prevalence remains high and is a cause for concern.
Primary schools are an important setting for the promotion and support of healthy lifestyles, and primary school years are also an important time in which to reinforce healthy eating and physical activity behaviours. Evidence suggests that obesity prevention programs are of benefit and have an impact on the body mass index of primary school aged children.
The Live Life Well @ School program is an important component of the NSW Government’s response to prevent childhood obesity, having prominence in the NSW Healthy Eating and Active Living Strategy: Prevention overweight and obesity 2013-2018, and contributing to the NSW Premier’s Priority to reduce overweight and obesity rates of children by 5% over ten years.
A joint initiative between NSW Health and the NSW Department of Education in consultation with the Catholic Education Commission NSW and the Association of Independent Schools of NSW, the Live Life Well @ School program supports a range of internal and external nutrition and physical activity programs, resources and strategies across NSW. The program is based on key health promotion messages about nutrition, physical activity and screen time. Local Health Districts’ health promotion officers provide additional support for program implementation via school visits, phone calls and email follow ups. Local Health Districts:
assist schools to develop an Action Plan that reflects a whole of school approach to nutrition and physical activity;
assist in the development of community focused nutrition and physical activity strategies; and
provide access to information and resources that support the teaching and creation of school environments that promotes physical activity and healthy eating.
The Live Life Well @ School program includes processes that monitor and evaluate the program and focus on assessing:
a) the implementation of the Live Life Well @ School program;
b) the reach of the Live Life Well @ School program; and
c) the impact of the Live Life Well @ School program.
The Live Life Well @ School program comprises of a number of key components including:
Professional learning for teachers through workshops
In service training modules to train staff within schools
Funding to support teacher attendance at workshops
Resources for schools
Grants to schools to support implementation of their Action Plan
Conferences
Advice and support for schools to assist in the implementation of Action Plans
Between 2008-2014, 4,617 teachers from 2,077 NSW primary schools attended the Live Life Well @ School workshops for the first time, an average of 838 teachers each year. For the period January 2014-June 2015, seven Live Life Well @ School conferences were held across NSW, with 669 teachers from 595 schools attending. The conferences have been very well received, with 84% of attendees reporting that they felt that the conference provided them with valuable resources and 61% outlining that their confidence to implement Personal Development, Health and Physical Education activities into their classrooms had increased.
Executive Summary
Evidence and Evaluation Summary 2008-2015 | 5
There has been a steady significant growth of NSW schools adopting the Live Life Well @ School program, from 32% in 2012 to 77% in 2015 across all types of schools (Government, Catholic and Independent schools). These schools have achieved 70% or more of the Live Life Well @ School program practices related to promoting and encouraging healthy eating, improving physical activity and improving the quality of service delivery. There have also been significant increases in the proportion of schools with priority population groups that have adopted the Live Life Well @ School program:
Schools with a high proportion of attendance by Aboriginal children adopting Live Life Well @ School program principles have increased from 33% in 2012 to 75% in 2015;
Schools in disadvantaged communities adopting Live Life Well @ School program principles have increased from 35% in 2012 to 79% in 2015; and
Schools in remote communities adopting Live Life Well @ School program principles have increased from 10% in 2012 to 74% in 2015.
There has been significant increase in the proportion of primary schools achieving program practices in 2012. Between 2012 and 2015, there were increased levels of achievement for the majority of practices. In particular, the following practices showed substantial increases in achievement:
Practice 4: Physical activity during recess and/or lunch;
Practice 7: Teacher professional learning/development on healthy eating and physical activity;
Practice 8: School team/committee with executive membership to support the implementation of Live Life Well @ School;
Practice 9: School planning processes incorporate Live Life Well @ School strategies; and
Practice 10: School monitors and reports annually on Live Life Well @ School strategies.
In many instances remote schools had achieved a greater number of Live Life Well @ School practices than other schools. However, the following practice was less well achieved in these schools:
Practice 9: School planning processes incorporate Live Life Well @ School strategies- schools in remote locations were less likely to have achieved this practice when compared to both schools with a high proportion of Aboriginal children and schools in disadvantaged communities (51% compared to 74% and 69% respectively).
While the following practice had significantly higher achievement in these schools:
Practice 10: School monitors and reports annually on Live Life Well @ School strategies - schools in remote locations were more likely to have achieved this practice when compared to both schools with a high proportion of Aboriginal children and schools in disadvantaged communities (73% compared to 52% and 59% respectively).
The Live Life Well @ School program will continue to support and monitor the achievement of healthy eating and physical activity practices in primary schools across NSW. Future efforts will focus on refreshing program resources, revising program practices to reflect strengthened areas of the program, ongoing delivery of the conferences with a focus around less well achieved program practices, deploying and promoting Board of Studies Teaching and Educational Standards (BOSTES) approved online learning that builds teachers’ capacity to implement the program and importantly, engaging non-participating schools in the Live Life Well @ School program.
6 | Live Life Well @ School
1. Background & Evidence
1.2 Consequences of overweight and obesity
Worldwide, overweight or obese children are likely to remain so into adulthood; and are more likely to develop non-communicable diseases such as diabetes, cardiovascular diseases and certain types of cancer (endometrial, breast and colon); as well as experiencing other health consequences, for example musculoskeletal disorders at a younger age or into adulthood1.
In particular, Australian children who are overweight or obese are reported to be at increased risk of poor physical health from the age of 6 to 7 years6; have more cardio-metabolic risk factors and higher risk factors of non-alcohol fatty liver disease than those of a healthy weight; and experience psychological problems such as compromised perceived quality of life, depression, emotional and behavioural disorders and poor self-esteem7.
2007
10
20
30
40
50
60
70
80
90
100
2008 2009 2010 2011 2012 2013 2014 2015
Pe
rce
nt
Year
Boy
Girl
Boys and Girls
1.1 Prevalence of overweight and obesity in primary school aged children
Childhood obesity is one of the most serious public health challenges of this century1. In Australia, approximately one quarter of primary school*-aged children are overweight (15.5% of 5-7 year olds and 19.6% of 8-11 year olds) or obese (8.5 % of 5-7 year olds and 6.7% of 8-11 year olds)2.
While overweight and obesity is evident in Australian children across all socio-economic groups, disadvantaged children are more likely to develop persistent overweight and obesity than socially advantaged children, both in pre-school and primary school years3, 4.
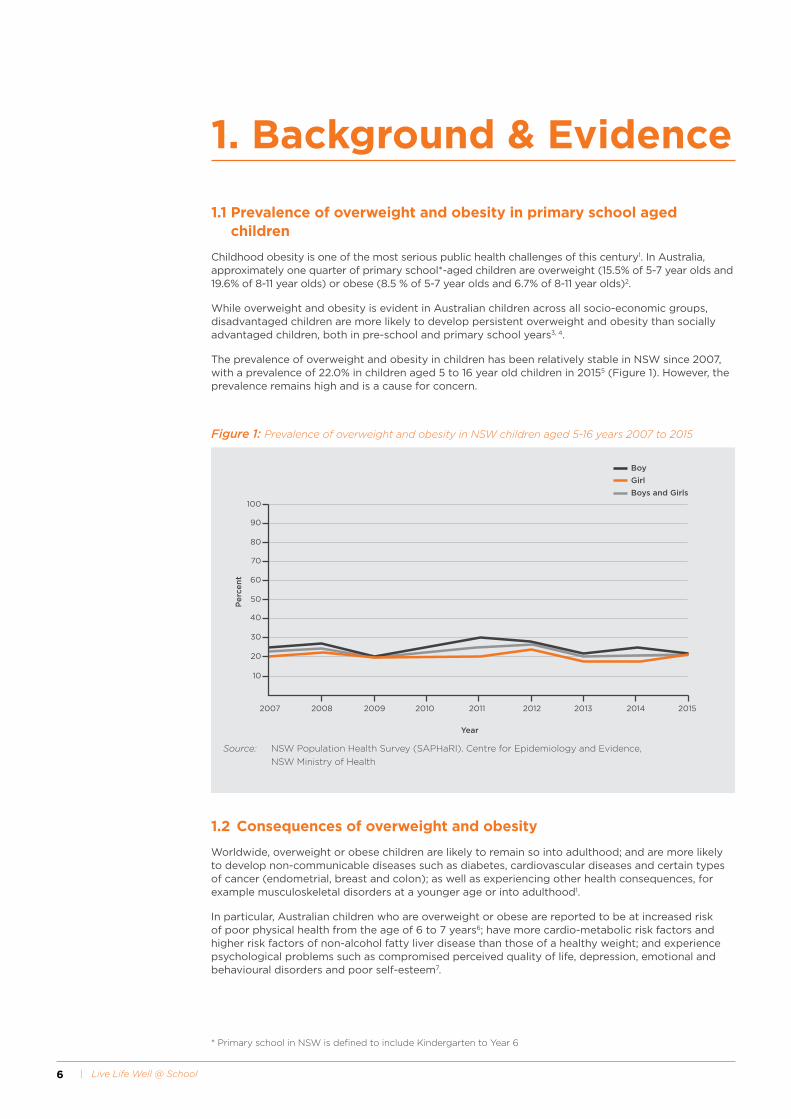
The prevalence of overweight and obesity in children has been relatively stable in NSW since 2007, with a prevalence of 22.0% in children aged 5 to 16 year old children in 20155 (Figure 1). However, the prevalence remains high and is a cause for concern.
Figure 1: Prevalence of overweight and obesity in NSW children aged 5-16 years 2007 to 2015
Source: NSW Population Health Survey (SAPHaRI). Centre for Epidemiology and Evidence,
NSW Ministry of Health
* Primary school in NSW is defined to include Kindergarten to Year 6
Evidence and Evaluation Summary 2008-2015 | 7
1.3 Importance of interventions in primary school aged children
Research suggests that encouraging a healthy body weight has the potential to reduce risks for later life as well as improve the health and wellbeing of children6, 8. The risk of becoming obese and developing related disease can be reduced in children at the population level by education, prevention and sustainable interventions addressing healthy lifestyle habits, which include the promotion of healthy eating and physical activity8, 9.
The NSW Schools Physical Activity and Nutrition Survey 2015 identified the need to address following lifestyle behaviours which could contribute to overweight and obesity in primary school aged children (from Year K to Year 6)10:
Physical activity levels and fundamental movement skills. Less than a quarter (23%) of primary school aged children meet the physical activity guidelines, and children who are overweight or obese having a lower skill proficiency in locomotor skills (sprint run, vertical jump, leap and side gallop) than their peers.
Levels of screen time. Less than two thirds of primary school aged children meet screen time guidelines on weekdays.
Food related behaviours. Only 5% of primary school children meet the daily recommended vegetable intake.
1.4 Evidence base for interventions in primary schools
Primary school aged children spend a large proportion of their day at school, which has an important role in their lives providing a safe and supportive environment for learning about and reinforcing healthy eating and physical activity behaviours during formative years8, 11, 12.
Research suggests that overweight and obesity interventions using a combination of nutrition and physical activity interventions (i.e. focussing on both sides of the energy balance) are effective in achieving weight reduction in school settings12-16. In addition, there is convincing evidence that long-running school-based interventions are effective in the short-term in reducing the prevalence of childhood obesity17. Further, there is strong evidence supporting the beneficial effects of child obesity prevention programs on body mass index (BMI), particularly those aimed at primary school aged children18.
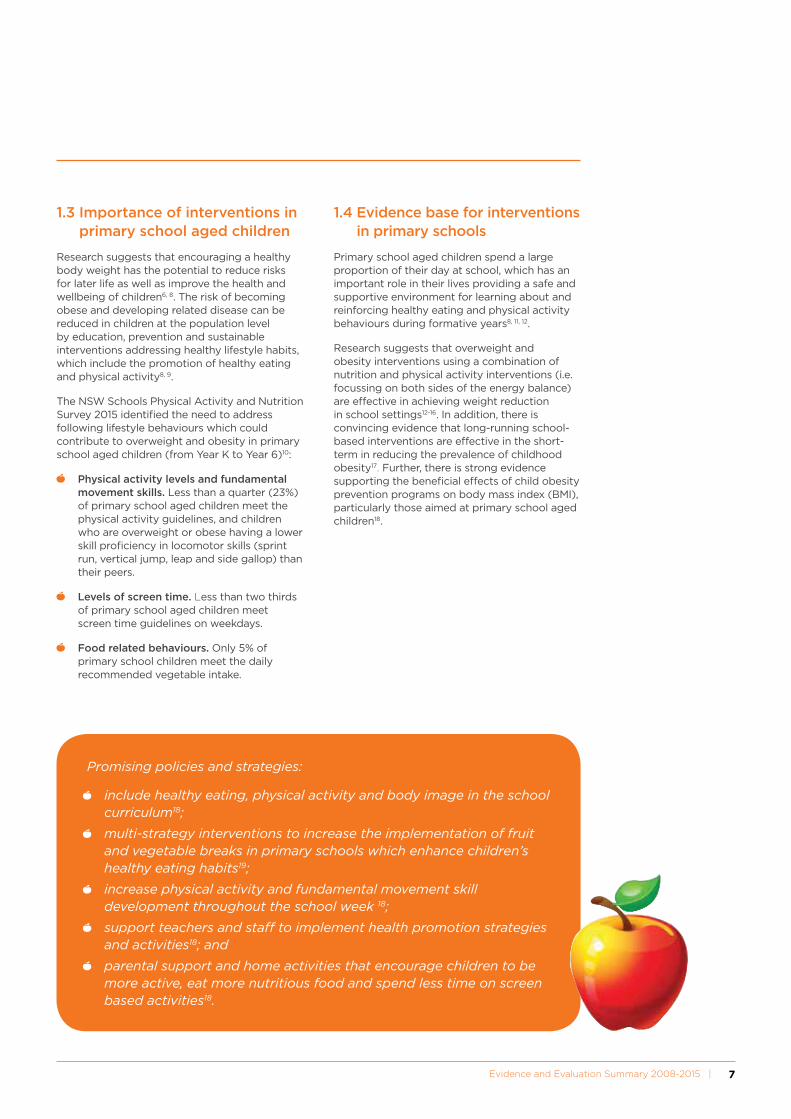
Promising policies and strategies:
include healthy eating, physical activity and body image in the school curriculum18;
multi-strategy interventions to increase the implementation of fruit and vegetable breaks in primary schools which enhance children’s healthy eating habits19;
increase physical activity and fundamental movement skill development throughout the school week 18;
support teachers and staff to implement health promotion strategies and activities18; and
parental support and home activities that encourage children to be more active, eat more nutritious food and spend less time on screen based activities18.

8 | Live Life Well @ School
Evidence and Evaluation Summary 2008-2015 | 9
2.1 Overview of the Live Life Well @ School program
The Live Life Well @ School program is an important component of the NSW Government’s response to the prevention of childhood obesity. The program has prominence in the NSW Healthy Eating and Active Living Strategy: Prevention overweight and obesity 2013-2018 and contributes to the NSW Premier’s Priority to reduce overweight and obesity rates of children by 5% over ten years.
The Live Life Well @ School program is a joint initiative between NSW Health and NSW Department of Education (DoE) in consultation with the Catholic Education Commission NSW and the Association of Independent Schools of NSW20. The program was implemented in Government schools in 2008, and in 2012 the program was expanded to include Catholic and Independent schools.
The Live Life Well @ School program provided a framework to consolidate pre-existing nutrition and physical activity programs, resources and strategies being offered across NSW, including Get Skilled: Get Active21, Crunch&Sip®22 and the Fresh Tastes @ School NSW Healthy School Canteen Strategy23. The program built on the outcomes and learning of previous state-wide programs such as the DoE’s Gold Medal Fitness24 and Gold Medal Healthy Lifestyle Programs (2000-2007) and was developed in line with Australian physical activity25 and healthy eating guidelines26, DoE policies around curriculum planning, assessing and reporting27 and the Fresh Tastes @ School NSW Healthy School Canteen Strategy23.
The Live Life Well @ School program offers professional learning for teachers to improve skills and confidence in teaching nutrition, fundamental movement skills and physical education as part of K-6 Personal Development, Health and Physical Education (PDHPE) NSW curriculum and other key learning areas.
Health promotion officers from Local Health Districts (LHDs) provide additional support for program implementation at the school. This support is provided via school visits, phone calls and email follow ups to:
assist schools to develop an Action Plan that reflects a whole of school approach to nutrition and physical activity;
assist in the development of school community focused nutrition and physical activity strategies; and
provide access to information and resources that support the teaching and creation of a school environment that promotes physical activity and healthy eating.
LHDs also target schools in disadvantaged communities, including those schools that have 10% or more students from Aboriginal or Torres Strait Islander background, schools that are located in disadvantaged communities and schools that are located in geographically remote areas of NSW. Such targeted activities and support, recognises the high prevalence of childhood obesity in these communities.
Ongoing monitoring of the implementation of the Live Life Well @ School program is supported by Population Health Intervention Monitoring System (PHIMS), which facilitates the collection of local level data and information by LHDs against the key components and practices of the Live Life Well @ School program.
2. The Live Life Well @ School program
The Live Life Well @ School program promotes ‘whole of school’ physical activity and nutrition initiatives in primary schools consistent with the WHO Health Promoting School Framework28 of classroom teaching, incorporating the school environment and community links
10 | Live Life Well @ School
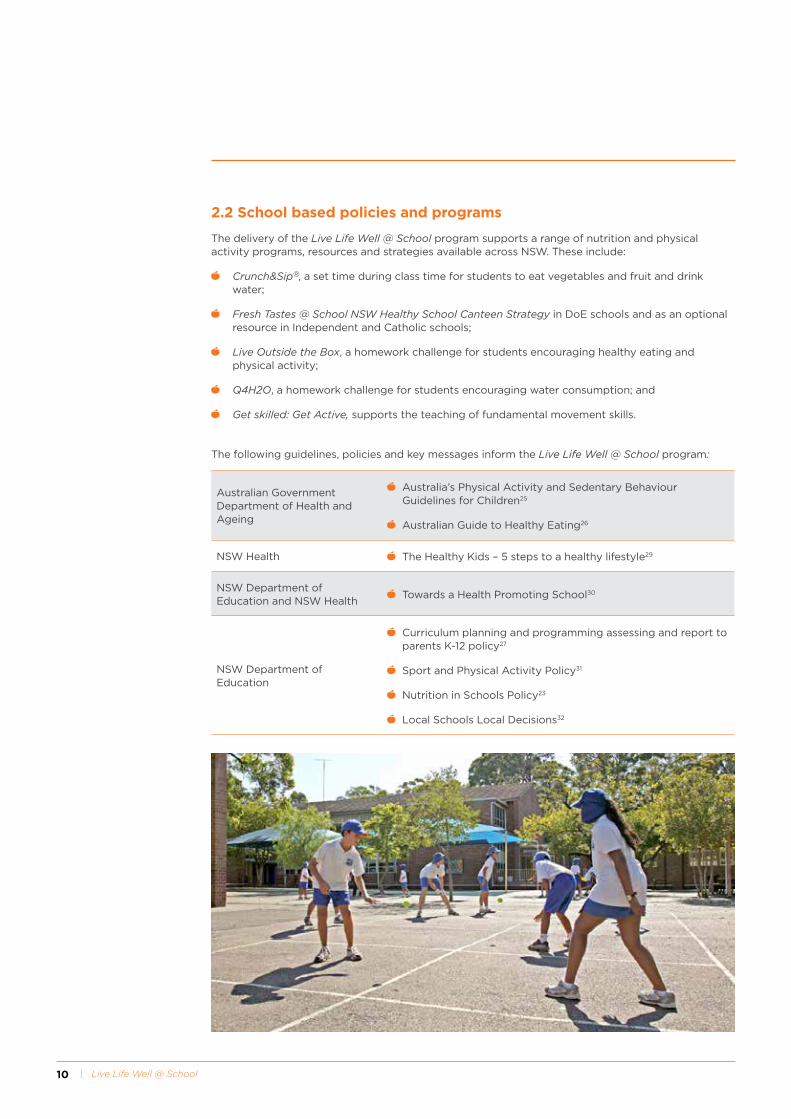
2.2 School based policies and programs
The delivery of the Live Life Well @ School program supports a range of nutrition and physical activity programs, resources and strategies available across NSW. These include:
Crunch&Sip®, a set time during class time for students to eat vegetables and fruit and drink water;
Fresh Tastes @ School NSW Healthy School Canteen Strategy in DoE schools and as an optional resource in Independent and Catholic schools;
Live Outside the Box, a homework challenge for students encouraging healthy eating and physical activity;
Q4H2O, a homework challenge for students encouraging water consumption; and
Get skilled: Get Active, supports the teaching of fundamental movement skills.
The following guidelines, policies and key messages inform the Live Life Well @ School program:
Australian Government Department of Health and Ageing
Australia’s Physical Activity and Sedentary Behaviour Guidelines for Children25
Australian Guide to Healthy Eating26
NSW Health The Healthy Kids – 5 steps to a healthy lifestyle29
NSW Department of Education and NSW Health
Towards a Health Promoting School30
NSW Department of Education
Curriculum planning and programming assessing and report to parents K-12 policy27
Sport and Physical Activity Policy31
Nutrition in Schools Policy23
Local Schools Local Decisions32
Evidence and Evaluation Summary 2008-2015 | 11
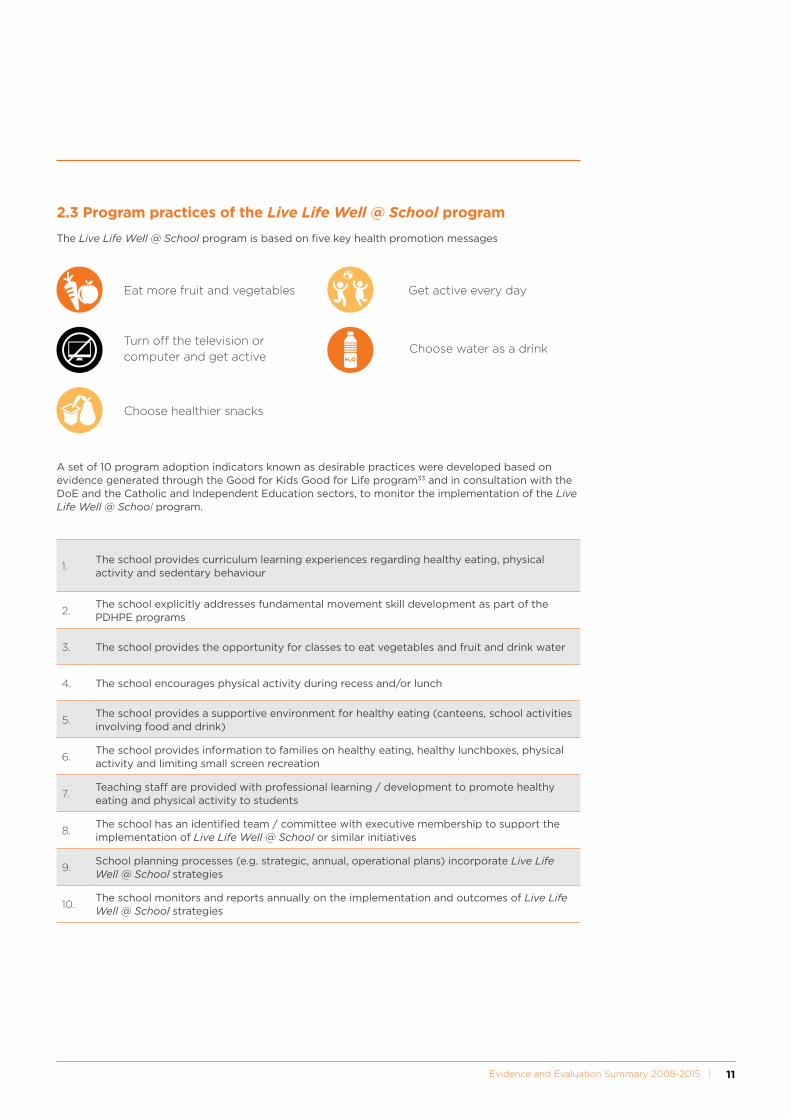
2.3 Program practices of the Live Life Well @ School program
The Live Life Well @ School program is based on five key health promotion messages
Eat more fruit and vegetables Get active every day
Turn off the television or computer and get active
Choose water as a drink
Choose healthier snacks
A set of 10 program adoption indicators known as desirable practices were developed based on evidence generated through the Good for Kids Good for Life program33 and in consultation with the DoE and the Catholic and Independent Education sectors, to monitor the implementation of the Live Life Well @ School program.
1.The school provides curriculum learning experiences regarding healthy eating, physical activity and sedentary behaviour
2.The school explicitly addresses fundamental movement skill development as part of the PDHPE programs
3. The school provides the opportunity for classes to eat vegetables and fruit and drink water
4. The school encourages physical activity during recess and/or lunch
5.The school provides a supportive environment for healthy eating (canteens, school activities involving food and drink)
6.The school provides information to families on healthy eating, healthy lunchboxes, physical activity and limiting small screen recreation
7.Teaching staff are provided with professional learning / development to promote healthy eating and physical activity to students
8.The school has an identified team / committee with executive membership to support the implementation of Live Life Well @ School or similar initiatives
9.School planning processes (e.g. strategic, annual, operational plans) incorporate Live Life Well @ School strategies
10.The school monitors and reports annually on the implementation and outcomes of Live Life Well @ School strategies
12 | Live Life Well @ School
3.1 Overview of the evaluation
As part of routine delivery of the Live Life Well @ School program, a process of information and data collection is embedded that facilitates the monitoring and evaluation of the program. The primary purpose of this monitoring and evaluation is to:
Assess the process of implementing the Live Life Well @ School program;
Assess the reach of the Live Life Well @ School program; and
Assess the impact of Live Life Well @ School program.
Inform quality improvements to the Live Life Well @ School program.
3.2 Implementation of the Live Life Well @ School program
The implementation of the Live Life Well @ School program included the development of the program at a state level and the establishment of a performance monitoring framework. Dedicated funding was provided to LHDs to implement the program and ensure the program met the needs of the local community. Performance targets for reach and adoption of the program were linked to the funding, with the LHDs being responsible for recruiting schools, providing ongoing support to facilitate program adoption and gathering data for the purpose of reporting against the program targets34.
3. Evaluation of the Live Life Well @ School program
3.2.1 Components of the Live Life Well @ School program
2008 to 2010 The Live Life Well @ School program consisted of the following components:
1. Three day face-to-face professional learning workshop. The workshops were delivered by the DoE and included a later ‘sharing’ workshop for teachers to discuss the outcomes of the program in each school.
2. Advice and support for schools. Following the face-to-face workshops the LHDs provided support to schools regarding implementation of Action Plans.
3. Resources for schools to support the program. Resources contained a wide variety of materials and ideas to engage the whole school community.
Evidence and Evaluation Summary 2008-2015 | 13
2011 to 2014 In 2011 the Live Life Well @ School program was revised. A number of issues were identified with the program, including school recruitment, workshop structure and content, and school funding support and were addressed at this time. Pilot testing demonstrated that the revisions were found to be acceptable to the teacher participants.
Delivery of the three day face-to-face workshops ceased at the end of 2014 due to achievement of high reach and a decision to transition from face-to-face training to on-line training to reduce costs.
The revised Live Life Well @ School program included the following key components:
1. Two day face-to-face workshops (replacing a three-day face-to-face workshop format).The workshops contributed to 10 hours of Quality Teacher Council Registered Professional Development, addressing a range of standards from the Australian Professional Standards for Teachers. The workshops were offered in targeted areas based on geographic location, and no previous involvement in Live Life Well @ School.
2. Funding to support teacher attendance at workshop. Schools received funding to cover teacher relief for up to two teachers to attend the two day workshop. A travel and accommodation allowance was also available to workshop participants whose school was more than 100km from the workshop venue.
3. Action plans linked to funding grants. Schools were able to apply for grants of up to $2,000 on submission of a 12 month Live Life Well @ School Action Plan signed off by the principal after attending the two day face-to-face workshop. The Action Plan was required to include details of the school’s intended actions, responsibilities and use of funding.
4. Modules. In addition to the two day face-to-face workshop, participating teachers were equipped with the tools to in-service staff at their school about the program and engage them in the action planning process and ongoing support. Three modules were deemed mandatory and had to be completed in order to receive Action Plan funding. These included:
i. Principals Module, PowerPoint presentation that introduced the program, the role of the Principal and keys to successful implementation;
ii. Live Life Well @ School Module – PowerPoint presentation providing an overview of Live Life Well @ School program and putting it into practice; and
iii. Fundamental Movement Schools Module – PowerPoint presentation and workshop session notes on observing and assessing fundamental movement skills.
5. Ongoing support strategies. The DoE and LHDs provided ongoing support, including dedicated web pages, communication and promotions strategy, additional resources, regional networks local promotional strategies, and refresher workshops.
14 | Live Life Well @ School
2014 to date In 2014, one day conferences were introduced as an additional component of the Live Life Well @ School program to build the confidence and capacity of teachers to implement quality physical and nutrition education, school sport and whole of school strategies.
The conferences, a joint initiative between the Australian Council of Health, Physical Education and Recreation (ACHPER), the NSW Office of Preventive Health and the Department of Education School Sport Unit are offered to schools in an effort to re-engage schools that previously attended Live Life Well @ School face-to-face workshops and schools that had not previously been involved in the program, as well as strengthen less well achieved practices in schools.
Attendance at the workshop contributes to five hours of Quality Teacher Council Registered Professional Development, addressing a range of standards from the Australian Professional Standards for Teachers.
Key components of the conference include:
1. Key note presentations and workshop sessions. Teachers are provided with strategies and activities to teach fundamental movement skills, nutrition and encourage physical activity and healthy eating in the school context.
2. Funding to support teacher attendance at conferences. Schools receive funding to cover teacher relief for up to one teacher to attend the conference. A travel and accommodation allowance is also available to workshop participants living more than 100km from the workshop venue.
Evidence and Evaluation Summary 2008-2015 | 15
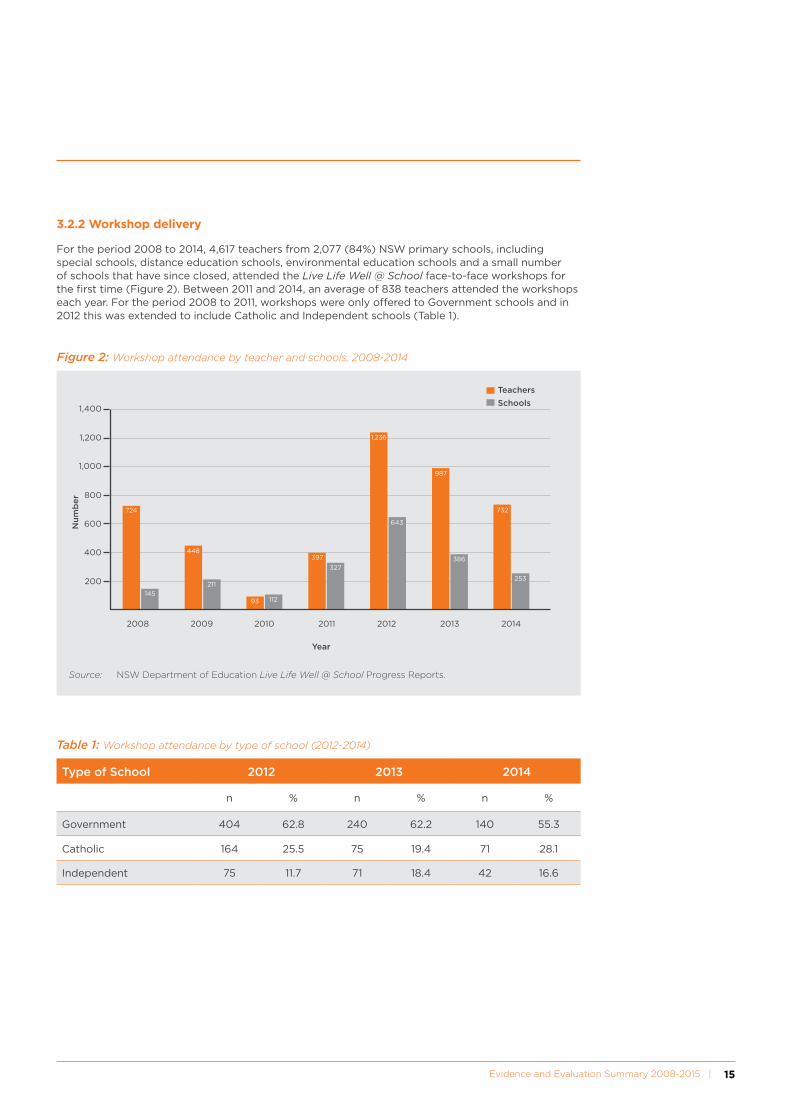
3.2.2 Workshop delivery
For the period 2008 to 2014, 4,617 teachers from 2,077 (84%) NSW primary schools, including special schools, distance education schools, environmental education schools and a small number of schools that have since closed, attended the Live Life Well @ School face-to-face workshops for the first time (Figure 2). Between 2011 and 2014, an average of 838 teachers attended the workshops each year. For the period 2008 to 2011, workshops were only offered to Government schools and in 2012 this was extended to include Catholic and Independent schools (Table 1).
1,400
724
397
643
987
732
253
386
1,236
327
448
93 112
211
145
1,200
1,000
800
600
400
200
2008 2009 2010 2011 2012 2013 2014
Nu
mb
er
Year
Teachers
Schools
Figure 2: Workshop attendance by teacher and schools, 2008-2014
Source: NSW Department of Education Live Life Well @ School Progress Reports.
Table 1: Workshop attendance by type of school (2012-2014)
Type of School 2012 2013 2014
n % n % n %
Government 404 62.8 240 62.2 140 55.3
Catholic 164 25.5 75 19.4 71 28.1
Independent 75 11.7 71 18.4 42 16.6
16 | Live Life Well @ School
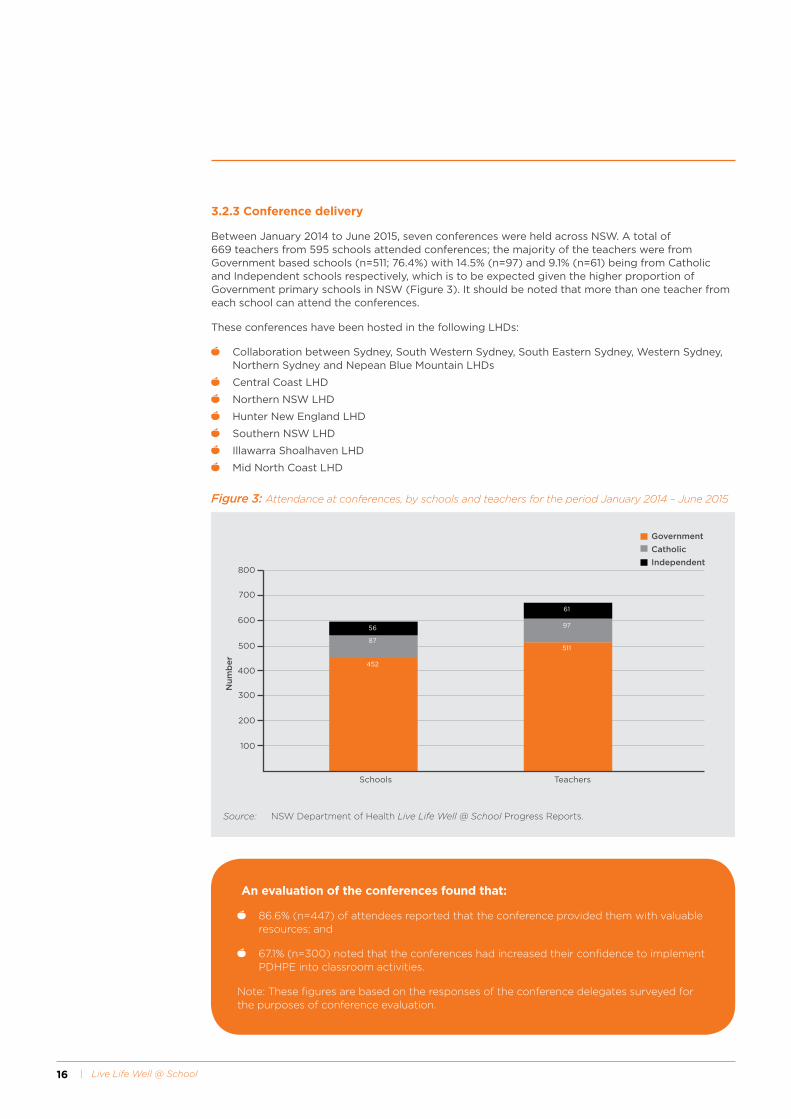
3.2.3 Conference delivery
Between January 2014 to June 2015, seven conferences were held across NSW. A total of 669 teachers from 595 schools attended conferences; the majority of the teachers were from Government based schools (n=511; 76.4%) with 14.5% (n=97) and 9.1% (n=61) being from Catholic and Independent schools respectively, which is to be expected given the higher proportion of Government primary schools in NSW (Figure 3). It should be noted that more than one teacher from each school can attend the conferences.
These conferences have been hosted in the following LHDs:
Collaboration between Sydney, South Western Sydney, South Eastern Sydney, Western Sydney, Northern Sydney and Nepean Blue Mountain LHDs
Central Coast LHD
Northern NSW LHD
Hunter New England LHD
Southern NSW LHD
Illawarra Shoalhaven LHD
Mid North Coast LHD
800
700
452
87
56
511
97
61
600
500
400
300
200
100
Schools Teachers
Nu
mb
er
Government
Catholic
Independent
Figure 3: Attendance at conferences, by schools and teachers for the period January 2014 – June 2015
Source: NSW Department of Health Live Life Well @ School Progress Reports.
An evaluation of the conferences found that:
86.6% (n=447) of attendees reported that the conference provided them with valuable resources; and
67.1% (n=300) noted that the conferences had increased their confidence to implement PDHPE into classroom activities.
Note: These figures are based on the responses of the conference delegates surveyed for the purposes of conference evaluation.
Evidence and Evaluation Summary 2008-2015 | 17
33.930.2
47.1
76.6
25.221.6
50.0
80.6
10.513.1
45.0
76.8
31.828.1
47.3
77.2
20.0
30.0
40.0
50.0
60.0
70.0
80.0
90.0
10.0
Government Catholic Independent Total for NSW
pe
rce
nt
School sector
2012
2013
2014
2015
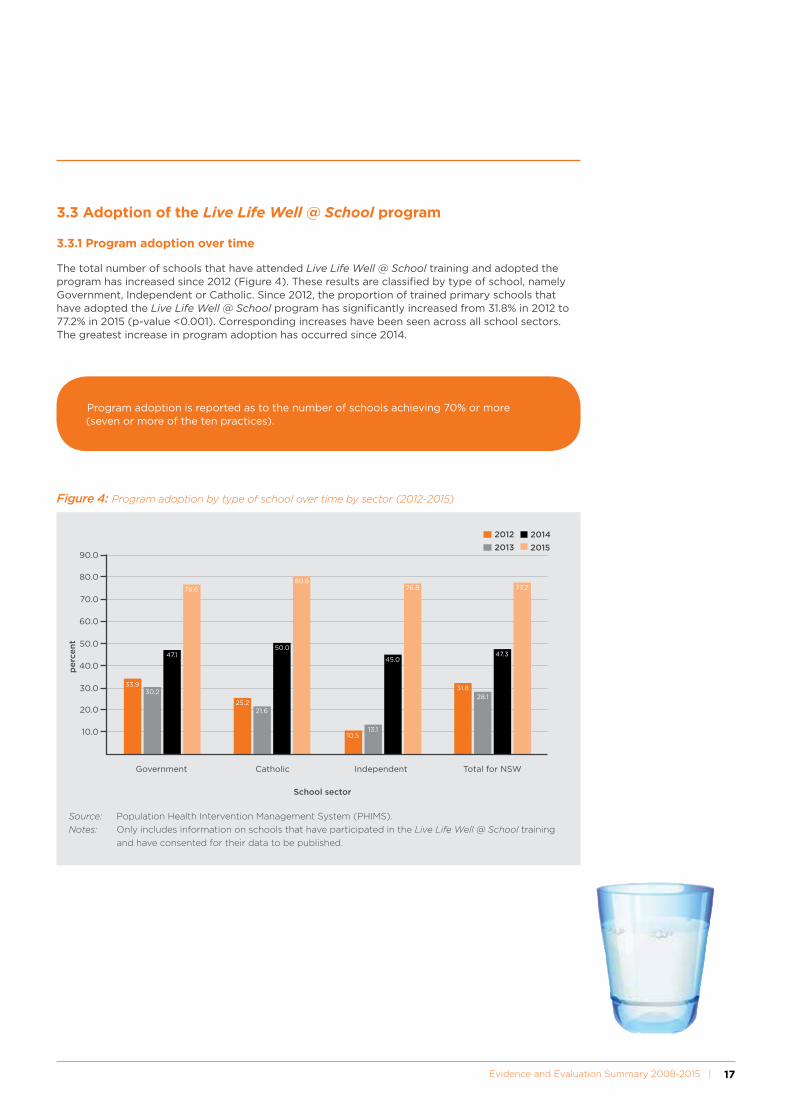
Figure 4: Program adoption by type of school over time by sector (2012-2015)
Source: Population Health Intervention Management System (PHIMS).
Notes: Only includes information on schools that have participated in the Live Life Well @ School training
and have consented for their data to be published.
3.3 Adoption of the Live Life Well @ School program
3.3.1 Program adoption over time
The total number of schools that have attended Live Life Well @ School training and adopted the program has increased since 2012 (Figure 4). These results are classified by type of school, namely Government, Independent or Catholic. Since 2012, the proportion of trained primary schools that have adopted the Live Life Well @ School program has significantly increased from 31.8% in 2012 to 77.2% in 2015 (p-value <0.001). Corresponding increases have been seen across all school sectors. The greatest increase in program adoption has occurred since 2014.
Program adoption is reported as to the number of schools achieving 70% or more (seven or more of the ten practices).
18 | Live Life Well @ School
3.3.2 Program adoption by priority population groups
The adoption of the Live Life Well @ School program by priority population groups is reported according to schools that:
Have 10% or more of enrolled students from Aboriginal or Torres Strait Islander backgrounds;
Are located in disadvantaged communities according to their Socio-Economic Indexes for Areas (SEIFA) quintiles, namely quintiles 1 and 2); and/or
Are classified as being located in remote areas of NSW according to their postcode.
There has been a significant increase in the number and proportion of schools that have participated in the Live Life Well @ School training and have consented for their data to be published with priority population groups that have achieved 70% or more of the Live Life Well @ School program practices.
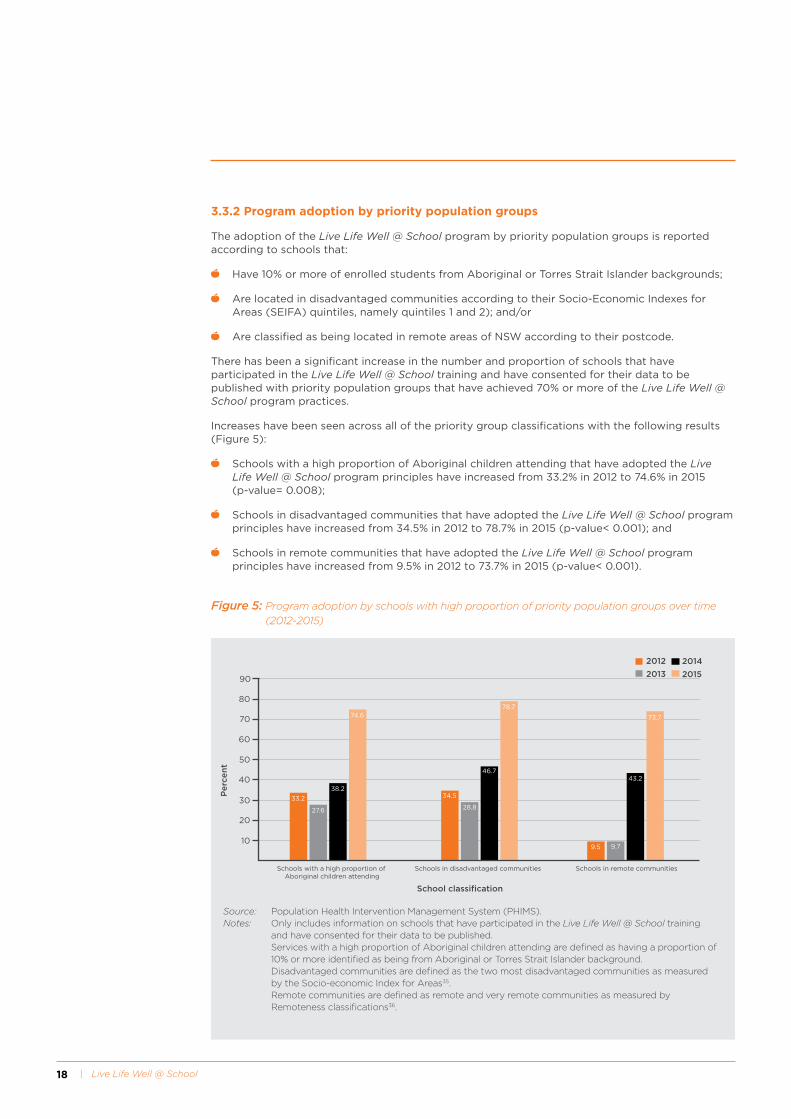
Increases have been seen across all of the priority group classifications with the following results (Figure 5):
Schools with a high proportion of Aboriginal children attending that have adopted the Live Life Well @ School program principles have increased from 33.2% in 2012 to 74.6% in 2015 (p-value= 0.008);
Schools in disadvantaged communities that have adopted the Live Life Well @ School program principles have increased from 34.5% in 2012 to 78.7% in 2015 (p-value< 0.001); and
Schools in remote communities that have adopted the Live Life Well @ School program principles have increased from 9.5% in 2012 to 73.7% in 2015 (p-value< 0.001).
33.2
27.6
38.2
74.6
34.5
28.8
46.7
78.7
9.5 9.7
43.2
73.7
20
30
40
50
60
70
80
90
10
Schools with a high proportion of Aboriginal children attending
Schools in disadvantaged communities Schools in remote communities
Pe
rce
nt
School classification
2012
2013
2014
2015
Figure 5: Program adoption by schools with high proportion of priority population groups over time (2012-2015)
Source: Population Health Intervention Management System (PHIMS).Notes: Only includes information on schools that have participated in the Live Life Well @ School training
and have consented for their data to be published. Services with a high proportion of Aboriginal children attending are defined as having a proportion of
10% or more identified as being from Aboriginal or Torres Strait Islander background. Disadvantaged communities are defined as the two most disadvantaged communities as measured
by the Socio-economic Index for Areas35. Remote communities are defined as remote and very remote communities as measured by
Remoteness classifications36.
Evidence and Evaluation Summary 2008-2015 | 19
3.4 Impact of the Live Life Well @ School program
3.4.1 Practice achievements over time
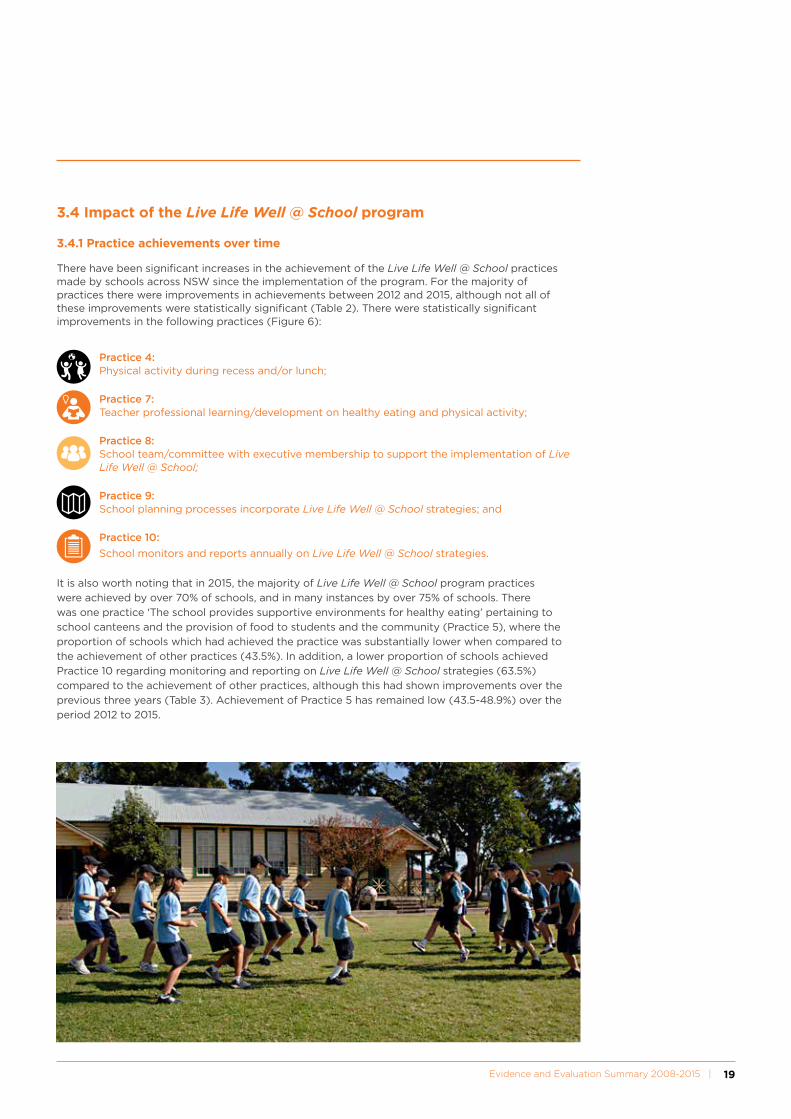
There have been significant increases in the achievement of the Live Life Well @ School practices made by schools across NSW since the implementation of the program. For the majority of practices there were improvements in achievements between 2012 and 2015, although not all of these improvements were statistically significant (Table 2). There were statistically significant improvements in the following practices (Figure 6):
Practice 4: Physical activity during recess and/or lunch;
Practice 7: Teacher professional learning/development on healthy eating and physical activity;
Practice 8: School team/committee with executive membership to support the implementation of Live Life Well @ School;
Practice 9: School planning processes incorporate Live Life Well @ School strategies; and
Practice 10:
School monitors and reports annually on Live Life Well @ School strategies.
It is also worth noting that in 2015, the majority of Live Life Well @ School program practices were achieved by over 70% of schools, and in many instances by over 75% of schools. There was one practice ‘The school provides supportive environments for healthy eating’ pertaining to school canteens and the provision of food to students and the community (Practice 5), where the proportion of schools which had achieved the practice was substantially lower when compared to the achievement of other practices (43.5%). In addition, a lower proportion of schools achieved Practice 10 regarding monitoring and reporting on Live Life Well @ School strategies (63.5%) compared to the achievement of other practices, although this had shown improvements over the previous three years (Table 3). Achievement of Practice 5 has remained low (43.5-48.9%) over the period 2012 to 2015.
20 | Live Life Well @ School
2012(N=224)
%
2013 (N=829)
%
2014(N=1099)
%
2015(N=1707)
%P-value#
Practice 1: Curriculum learning experiences regarding healthy eating, physical activity
84.4 80.5 76.6 79.8 NS
Practice 2: Fundamental movement skill development addressed as part of PDHPE
79.9 78.4 80.5 82.2 NS
Practice 3: Opportunity for classes to eat vegetables and fruit and drink water
84.4 84.2 83.8 84.4 NS
Practice 4: Physical activity during recess and/or lunch
58.0 60.4 77.7 87.3 <0.001
Practice 5: Supportive environment for healthy eating
48.2 48.9 43.7 43.5 NS
Practice 6: Provides information to families
71.4 68.4 72.2 73.3 NS
Practice 7: Teacher professional learning/ development healthy eating and physical activity
47.8 47.9 64.1 77.7 <0.001
Practice 8: School team/committee with executive membership to support the implementation of LLW@S strategies
58.9 59.2 70.7 78.0 <0.001
Practice 9: School planning processes incorporate LLW@S strategies
52.2 51.4 59.6 72.9 <0.001
Practice 10: School monitors and reports annually on LLW@S strategies
45.5 40.5 51.4 63.5 <0.001
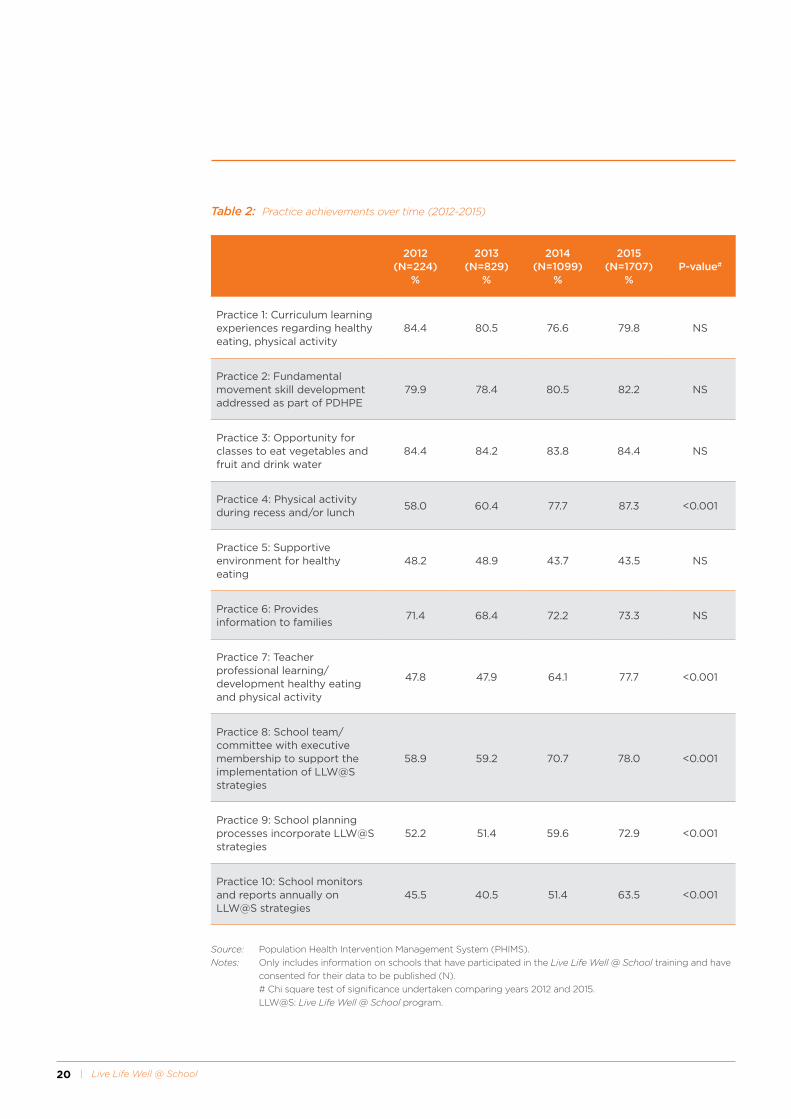
Table 2: Practice achievements over time (2012-2015)
Source: Population Health Intervention Management System (PHIMS).
Notes: Only includes information on schools that have participated in the Live Life Well @ School training and have
consented for their data to be published (N).
# Chi square test of significance undertaken comparing years 2012 and 2015.
LLW@S: Live Life Well @ School program.
Evidence and Evaluation Summary 2008-2015 | 21
10
20
30
40
50
60
70
80
90
100
2012 2013 2014 2015
Pe
rce
nt
Year
P 4 Physical activity during breaks
P 8 Executive support
P 10 Monitors and reports
P 7 Professional learning
P 9 Planning processes
58.960.4
77.7
64.1
59.6
51.4
70.7
87.3
78.0
77.7
72.9
63.9
51.4
47.9
40.5
59.258.0
52.2
47.8
45.5
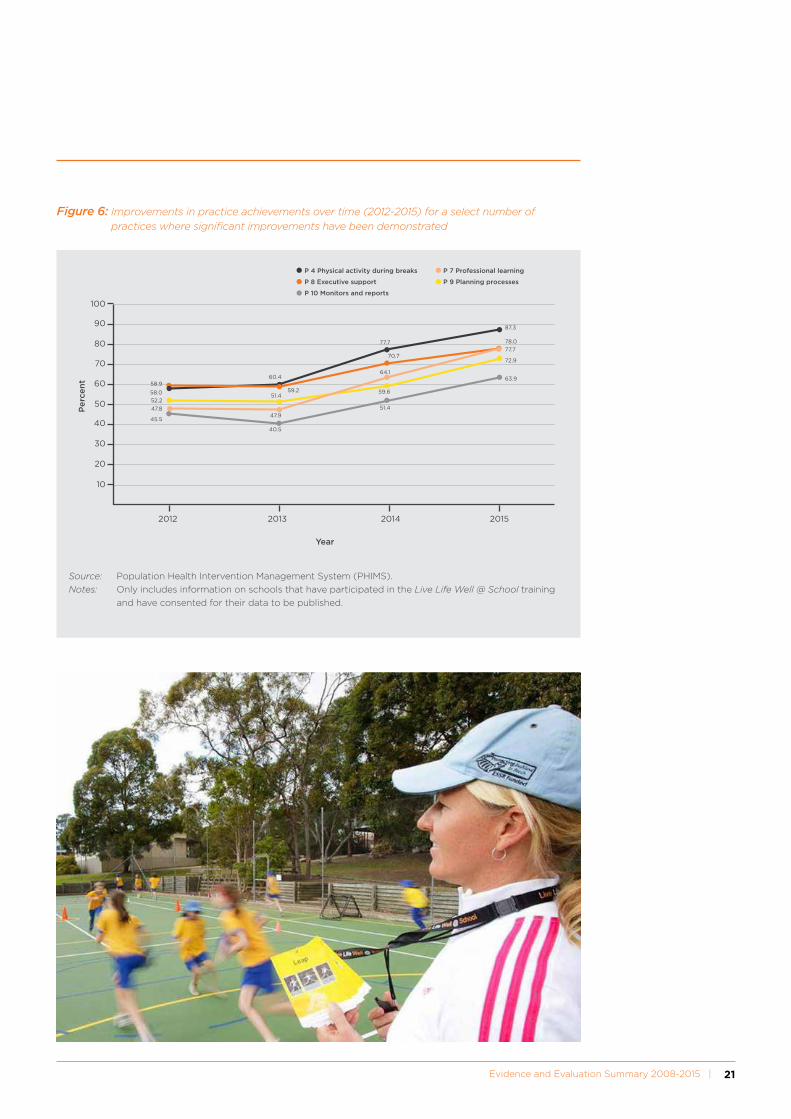
Figure 6: Improvements in practice achievements over time (2012-2015) for a select number of practices where significant improvements have been demonstrated
Source: Population Health Intervention Management System (PHIMS).
Notes: Only includes information on schools that have participated in the Live Life Well @ School training
and have consented for their data to be published.
22 | Live Life Well @ School
3.4.2 Practice achievements by priority population groups
The Live Life Well @ School program practice achievements by priority population groups are also reported according to schools that:
Have 10% or more of enrolled students from Aboriginal or Torres Strait Islander backgrounds;
Are located in disadvantaged communities according to their SEIFA quintiles, namely quintiles 1 and 2; and
Are classified as being located in remote areas of NSW according to their postcode.
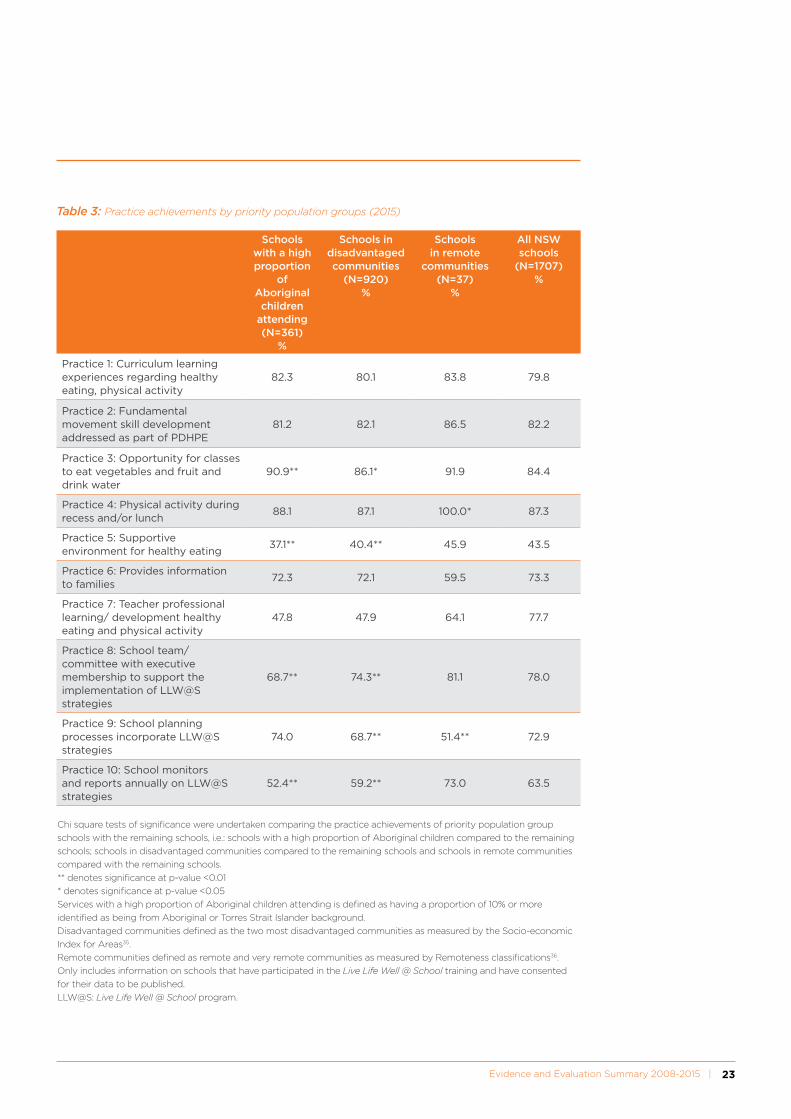
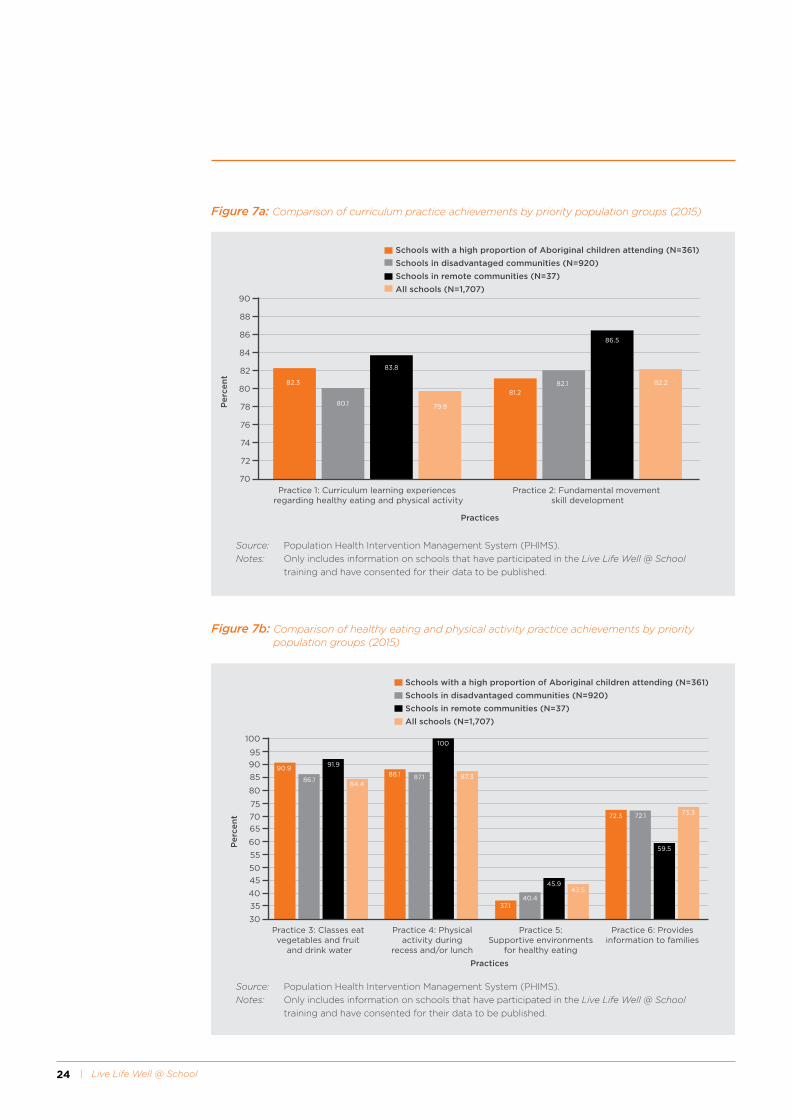
There were differences between schools featuring priority population groups (Table 3 and Figures 7a, 7b, 7c). Schools with a high proportion of Aboriginal children attending and schools in disadvantaged areas achieved a greater proportion of some practices than remotely located schools as detailed below:
Practice 2 (fundamental movement skills): Remotely located schools (86.5%) had a higher proportion of achievement than schools with a high proportion of attendance by Aboriginal children (81.2%).
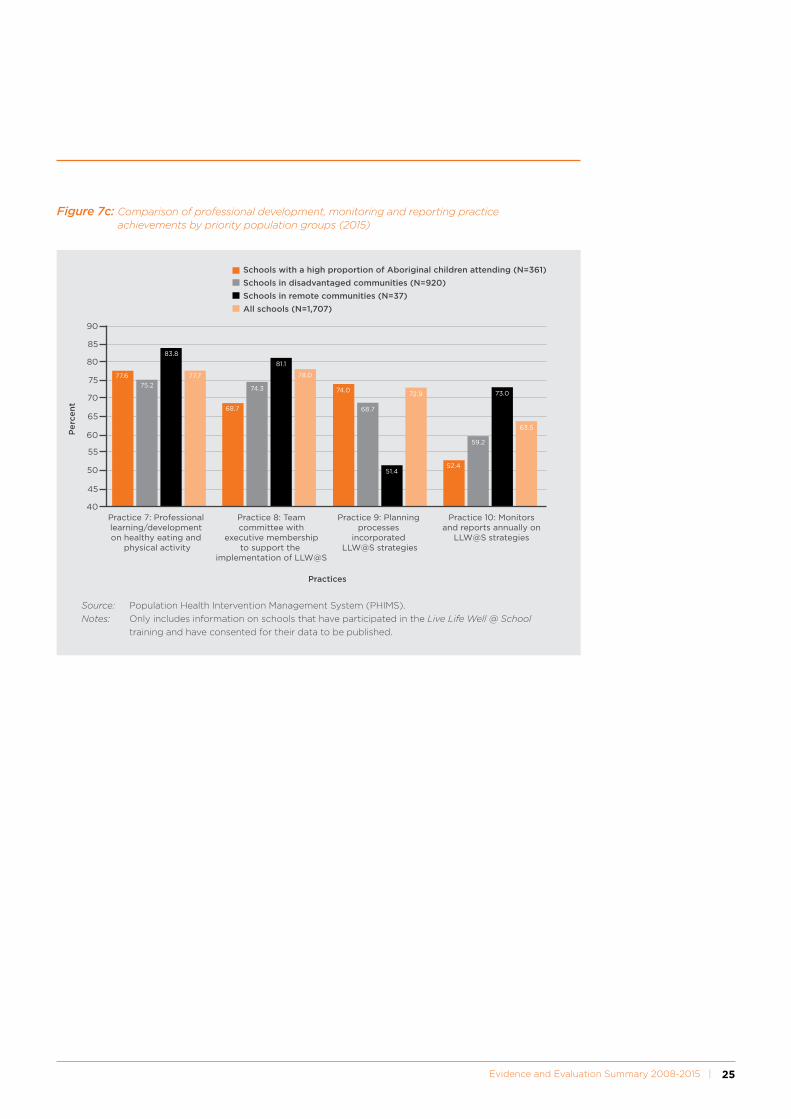
Practices 4, 5, 7, 8 and 10: Remotely located schools had a higher proportion of achievement than schools with a high proportion of attendance by Aboriginal children (see Table 3).
Practice 3 (classes being given the opportunity to eat vegetables and fruit and drink water): Both remotely located schools (91.9%) and schools with a high proportion of attendance by Aboriginal children (90.9%) had a higher proportion of achievement than schools in disadvantaged communities (86.1%).
Practice 6 (provision of information to families) and Practice 9, (planning processes incorporating Live Life Well @ School strategies): Schools with a high proportion of attendance by Aboriginal children and schools in disadvantaged communities had a higher proportion of achievement than remotely located schools.
Evidence and Evaluation Summary 2008-2015 | 23
Schools with a high proportion
of Aboriginal children
attending (N=361)
%
Schools in disadvantaged communities
(N=920)%
Schools in remote
communities (N=37)
%
All NSW schools
(N=1707)%
Practice 1: Curriculum learning experiences regarding healthy eating, physical activity
82.3 80.1 83.8 79.8
Practice 2: Fundamental movement skill development addressed as part of PDHPE
81.2 82.1 86.5 82.2
Practice 3: Opportunity for classes to eat vegetables and fruit and drink water
90.9** 86.1* 91.9 84.4
Practice 4: Physical activity during recess and/or lunch
88.1 87.1 100.0* 87.3
Practice 5: Supportive environment for healthy eating
37.1** 40.4** 45.9 43.5
Practice 6: Provides information to families
72.3 72.1 59.5 73.3
Practice 7: Teacher professional learning/ development healthy eating and physical activity
47.8 47.9 64.1 77.7
Practice 8: School team/committee with executive membership to support the implementation of LLW@S strategies
68.7** 74.3** 81.1 78.0
Practice 9: School planning processes incorporate LLW@S strategies
74.0 68.7** 51.4** 72.9
Practice 10: School monitors and reports annually on LLW@S strategies
52.4** 59.2** 73.0 63.5
Table 3: Practice achievements by priority population groups (2015)
Chi square tests of significance were undertaken comparing the practice achievements of priority population group
schools with the remaining schools, i.e.: schools with a high proportion of Aboriginal children compared to the remaining
schools; schools in disadvantaged communities compared to the remaining schools and schools in remote communities
compared with the remaining schools.
** denotes significance at p-value <0.01
* denotes significance at p-value <0.05
Services with a high proportion of Aboriginal children attending is defined as having a proportion of 10% or more
identified as being from Aboriginal or Torres Strait Islander background.
Disadvantaged communities defined as the two most disadvantaged communities as measured by the Socio-economic
Index for Areas35.
Remote communities defined as remote and very remote communities as measured by Remoteness classifications36.
Only includes information on schools that have participated in the Live Life Well @ School training and have consented
for their data to be published.
LLW@S: Live Life Well @ School program.
24 | Live Life Well @ School
82.3
80.1
83.8
79.8
81.282.1
86.5
82.2
74
76
78
80
82
84
86
88
90
72
70Practice 1: Curriculum learning experiences
regarding healthy eating and physical activityPractice 2: Fundamental movement
skill development
Pe
rce
nt
Practices
Schools with a high proportion of Aboriginal children attending (N=361)
Schools in disadvantaged communities (N=920)
Schools in remote communities (N=37)
All schools (N=1,707)
90.9
86.1
91.9
84.4
88.1 87.1
100
87.3
37.140.4
45.943.5
72.3 72.1
59.5
73.3
65
60
55
50
45
40
35
30
75
70
85
80
90
95
100
Practice 3: Classes eat vegetables and fruit
and drink water
Practice 4: Physical activity during
recess and/or lunch
Practice 5: Supportive environments
for healthy eating
Practice 6: Provides information to families
Pe
rce
nt
Practices
Schools with a high proportion of Aboriginal children attending (N=361)
Schools in disadvantaged communities (N=920)
Schools in remote communities (N=37)
All schools (N=1,707)
Figure 7a: Comparison of curriculum practice achievements by priority population groups (2015)
Figure 7b: Comparison of healthy eating and physical activity practice achievements by priority population groups (2015)
Source: Population Health Intervention Management System (PHIMS).
Notes: Only includes information on schools that have participated in the Live Life Well @ School training and have consented for their data to be published.
Source: Population Health Intervention Management System (PHIMS).
Notes: Only includes information on schools that have participated in the Live Life Well @ School training and have consented for their data to be published.
Evidence and Evaluation Summary 2008-2015 | 25
77.6
75.2
83.8
77.7
68.7
74.3
81.1
78.0
74.0
68.7
51.4
72.9
52.4
59.2
73.0
63.5
90
85
80
75
70
65
60
55
50
45
40Practice 7: Professional learning/development on healthy eating and
physical activity
Practice 8: Teamcommittee with
executive membershipto support the
implementation of LLW@S
Practice 9: Planning processes
incorporated LLW@S strategies
Practice 10: Monitorsand reports annually on
LLW@S strategies
Pe
rce
nt
Practices
Schools with a high proportion of Aboriginal children attending (N=361)
Schools in disadvantaged communities (N=920)
Schools in remote communities (N=37)
All schools (N=1,707)
Figure 7c: Comparison of professional development, monitoring and reporting practice achievements by priority population groups (2015)
Source: Population Health Intervention Management System (PHIMS).
Notes: Only includes information on schools that have participated in the Live Life Well @ School training and have consented for their data to be published.
26 | Live Life Well @ School
3.5 Data sources and limitations
It should be noted that monitoring the implementation of the Live Life Well @ School program reflects the “real world”. Routine monitoring is used as the primary method to determine the implementation, reach and impact of the program. This is considered appropriate given that the Live Life Well @ School program is a mature program based on evidence of best practice. However, there are some limitations inherent within this approach, which are described below.
3.5.1 Monitoring
Monitoring of the implementation of the Live Life Well @ School program is supported by routine data collection process undertaken by both the LHDs and the DoE and includes the collection of information in relation to:
The number and classification of schools;
The number of schools trained in the Live Life Well @ School program;
The number of teachers trained in the Live Life Well @ School program; and
The number of practices achieved (and not achieved) by schools.
Information on training is obtained from progress reports supplied by the DoE as a component of their delivery of the program. Information was also collected in 2012 via a Computer Assisted Telephone Interview (CATI) and then subsequently (for 2012, 2013, 2014 and 2015) collected by health promotion officers and entered into the Population Health Intervention Management System (PHIMS). PHIMS captures data and generates state-wide reports on schools reported by LHDs.
The program adoption and practice achievement data that has been used for this report only includes data obtained from PHIMS to minimise the limitation of comparing data from different sources.
It is important to note that data for this summary only includes those schools that have participated in Live Life Well @ School training and have consented for their data to be included in the evaluation. This is a limitation as the evaluation is unable to determine the proportion of schools across NSW that have achieved the program’s practices, irrespective of whether they have participated in the Live Life Well @ School program training.
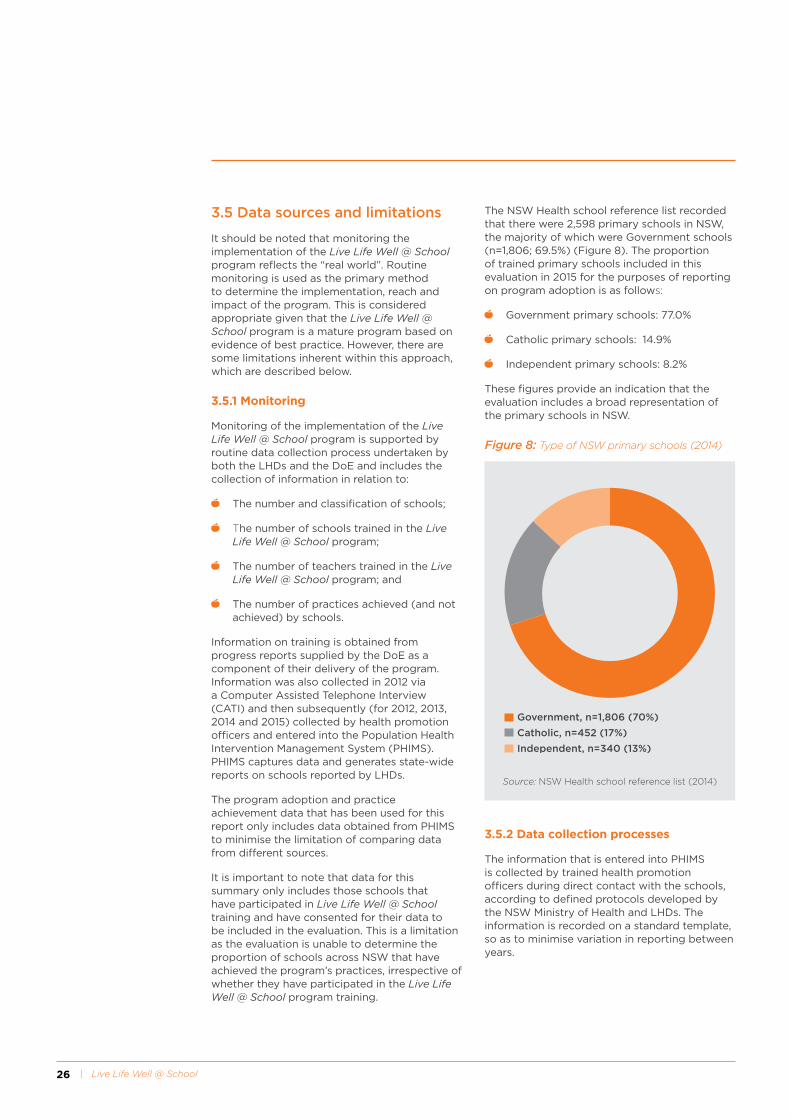
The NSW Health school reference list recorded that there were 2,598 primary schools in NSW, the majority of which were Government schools (n=1,806; 69.5%) (Figure 8). The proportion of trained primary schools included in this evaluation in 2015 for the purposes of reporting on program adoption is as follows:
Government primary schools: 77.0%
Catholic primary schools: 14.9%
Independent primary schools: 8.2%
These figures provide an indication that the evaluation includes a broad representation of the primary schools in NSW.
Source: NSW Health school reference list (2014)
Figure 8: Type of NSW primary schools (2014)
90.9
86.1
91.9
84.4
88.1 87.1
100
87.3
37.140.4
45.943.5
72.3 72.1
59.5
73.3
65
60
55
50
45
40
35
30
75
70
85
80
90
95
100
Practice 3: ...classes toeatvegetable and
fruit and drink water...
Practice 4: ...physicalactivity during recess
and/or lunch...
Practice 5: ...supportiveenvironment forhealthy eating...
Practice 6: ...providesinformation to
families...
Pe
rce
nt
Practices
Government, n=1,806 (70%)
Catholic, n=452 (17%)
Independent, n=340 (13%)
3.5.2 Data collection processes
The information that is entered into PHIMS is collected by trained health promotion officers during direct contact with the schools, according to defined protocols developed by the NSW Ministry of Health and LHDs. The information is recorded on a standard template, so as to minimise variation in reporting between years.
Evidence and Evaluation Summary 2008-2015 | 27
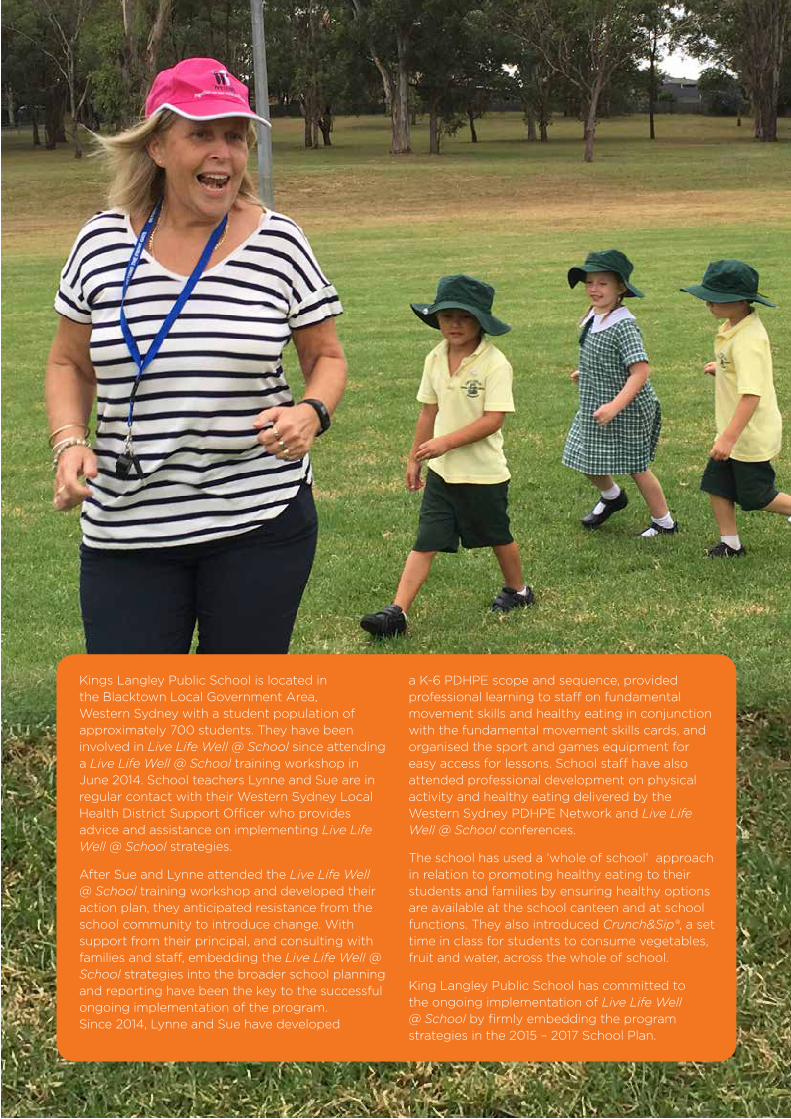
Kings Langley Public School is located in the Blacktown Local Government Area, Western Sydney with a student population of approximately 700 students. They have been involved in Live Life Well @ School since attending a Live Life Well @ School training workshop in June 2014. School teachers Lynne and Sue are in regular contact with their Western Sydney Local Health District Support Officer who provides advice and assistance on implementing Live Life Well @ School strategies.
After Sue and Lynne attended the Live Life Well @ School training workshop and developed their action plan, they anticipated resistance from the school community to introduce change. With support from their principal, and consulting with families and staff, embedding the Live Life Well @ School strategies into the broader school planning and reporting have been the key to the successful ongoing implementation of the program. Since 2014, Lynne and Sue have developed
a K-6 PDHPE scope and sequence, provided professional learning to staff on fundamental movement skills and healthy eating in conjunction with the fundamental movement skills cards, and organised the sport and games equipment for easy access for lessons. School staff have also attended professional development on physical activity and healthy eating delivered by the Western Sydney PDHPE Network and Live Life Well @ School conferences.
The school has used a ‘whole of school’ approach in relation to promoting healthy eating to their students and families by ensuring healthy options are available at the school canteen and at school functions. They also introduced Crunch&Sip®, a set time in class for students to consume vegetables, fruit and water, across the whole of school.
King Langley Public School has committed to the ongoing implementation of Live Life Well @ School by firmly embedding the program strategies in the 2015 – 2017 School Plan.
28 | Live Life Well @ School
Evidence and Evaluation Summary 2008-2015 | 29
4. Future Directions
Live Life Well @ School is a key NSW state-wide program offered to all primary schools to encourage
and support students to be more active, more often, as well as promoting healthy eating habits. The
program supports schools to implement ‘whole of school’ initiatives, including teaching nutrition and
physical activity, nutrition and physical activity policies and strong community links. Future directions
for the Live Life Well @ School program include:
1. Ongoing monitoring of program practices;
2. Maintaining and enhancing program support across sectors;
3. Reviewing and enhancing program practices to reflect strengthened areas of the program;
4. Refreshing program resources;
5. Ongoing delivery of the BOSTES approved one day conferences with a focus around less well
achieved program practices;
6. Deploying and promoting BOSTES approved online learning that builds teachers’ capacity to
implement the Live Life Well @ School program; and
7. Engaging non-participating schools in the program.
30 | Live Life Well @ School
5. References1. World Health Organisation. Population based
approaches to childhood obesity prevention. http://wwwwhoint/dietphysicalactivity/childhood/en/ 2012.
2. Australian Bureau of Statistics. Australian Health Survey: Updated results 2011-2012. 2012.
3. O’Dea JA, Chiang H, Peralta LR. Socioeconomic patterns of overweight, obesity but not thinness persist from childhood to adolescence in a 6 -year longitudinal cohort of Australian schoolchildren from 2007 to 2012. BMC Public Health. 2014;14(1).
4. Jansen PW, Mensah FK, Nicholson JM, Wake M. Family and neighbourhood socioeconomic inequalities in childhood trajectories of BMI and overweight: longitudinal study of Australian children. PloS one. 2013;8(7):e69676.
5. NSW Ministry of Health. Overweight and obesity in children aged 5-16 years, NSW 2007-2015. Health Statistics NSW. 2016; http://www.healthstats.nsw.gov.au/Indicator/beh_bmikid_cat. (Accessed 16 June 2016).
6. Wake M, Clifford SA, Patton GC, Waters E, Williams J, Canterford L, et al. Morbidity patterns among the underweight, overweight and obese between 2 and 18 years: population-based cross-sectional analyses. International Journal of Obesity. 2013;37(1):86-93.
7. Sanders RH, Han A, Baker JS, Cobley S. Childhood obesity and its physical and psychological co-morbidities: a systematic review of Australian children and adolescents. European Journal of Pediatrics. 2015;174(6):715-46.
8. Karnik S, Kanekar A. Childhood obesity: a global public health crisis. International Journal of Preventive Medicine. 2012;3(1):1.
9. Office of the Surgeon General. The Surgeon General’s Vision for a Healthy and Fit Nation. . Department of Health and Human Services. 2010; Rockville, MD. U.S.
10. Hardy LL, Mihrshahi S et al. NSW Schools Physical Activity and Nutrition Survey (SPANS) 2015: Full Report 2016.
11. Centres for Disease Control and Prevention. Obesity Prevention and Healthy Schools 2015; http://www.cdc.gov/healthyschools/obesity/facts.htm. (Accessed 26 November 2015).
12. Katz D, O’Connell M, Njike VY, Yeh M, Nawaz H. Strategies for the prevention and control of obesity in the school setting: systematic review and meta-analysis. International Journal of Obesity. 2008;32(12):1780-9.
13. De Bourdeaudhuij I, Van Cauwenberghe E, Spittaels H, Oppert JM, Rostami C, Brug J, et al. School-based interventions promoting both physical activity and healthy eating in Europe: a systematic review within the HOPE project. Obesity Reviews. 2011;12(3):205-16.
14. Lavelle HV, Mackay DF, Pell JP. Systematic review and meta-analysis of school-based interventions to reduce body mass index. Journal of Public Health. 2012;34(3):360-9.
15. Sobol-Goldberg S, Rabinowitz J, Gross R. School-based obesity prevention programs: a meta-analysis of randomized controlled trials. Obesity. 2013;21(12):2422-8.
16. Williams AJ, Henley WE, Williams CA, Hurst AJ, Logan S, Wyatt KM. Systematic review and meta-analysis of the association between childhood overweight and obesity and primary school diet and physical activity policies. International Journal Behavioral Nutrition and Physical Activity. 2013;10(1):101.
17. Gonzalez-Suarez C, Worley A, Grimmer-Somers K, Dones V. School-based interventions on childhood obesity: a meta-analysis. American Journal of Preventive Medicine. 2009;37(5):418-27.
18. Waters E, de Silva-Sanigorski A, Hall BJ, Brown T, Campbell KJ, Gao Y, et al. Interventions for preventing obesity in children. Cochrane Database of Systematic Reviews. 2011(12):CD001871.
19. Nathan N, Wolfenden L, Butler M, Bell AC, Wyse R, Campbell E, et al. Vegetable and fruit breaks in Australian primary schools: prevalence, attitudes, barriers and implementation strategies. Health Education Research. 2011;26(4):722-31.
Evidence and Evaluation Summary 2008-2015 | 31
20. Nathan N, Wolfenden L, Williams C, Yoong S,
Lecathelinais C, Bell A, et al. Adoption of obesity prevention policies and practices by Australian primary schools: 2006 to 2013. Health education research. 2015;30(2):262-71.
21. NSW Department of Education and Communities. Get Skilled: Get Active - professional learning. NSW Government. 1999-2011; http://www.curriculumsupport.education.nsw.gov.au/primary/pdhpe/gamessport/fmsindex.htm.
22. Healthy Kids Association. Crunch & Sip NSW. 2015; https://healthy-kids.com.au/teachers/crunch-sip/.
23. Department of Education. Nutrition in Schools Policy (PD/2011/0420/V01). NSW Government. 2011; https://www.det.nsw.edu.au/policies/student_serv/student_health/nutrition/PD20110420.shtml.
24. Wright J, Konza D, Hearne D, Okely T. The Gold Medal Fitness Program: a model for teacher change. Physical Education and Sport Pedagogy. 2008;13(1):49-64.
25. Department of Health. Australians Physical Activity and Sedentary Behaviour Guidelines. Australian Government. 2014; http://www.health.gov.au/internet/main/publishing.nsf/content/health-pubhlth-strateg-phys-act-guidelines.
26. National Health and Medical Research Council and Department of Health and Ageing. Australian Guide to Healthy Eating. Australian Government. 2015; https://www.eatforhealth.gov.au/guidelines/australian-guide-healthy-eating.
27. Department of Education. Curriculum planning and programming, assessing and reporting to parents K-12 (PD/2005/0290/V09). NSW Government. 2006; https://www.det.nsw.edu.au/policies/curriculum/schools/curric_plan/PD20050290.shtml.
28. Langford R, Bonell CP, Jones HE, Pouliou T, Murphy SM, Waters E, et al. The WHO Health Promoting School framework for improving the health and well-being of students and their academic achievement. Cochrane Database of Systematic Reviews. 2014;4:CD008958.
29. NSW Ministry of Health & NSW Department of Education and Communities & the Heart Foundation. Healthy Kids: Eat Well, Get Active. 2015; http://www.healthykids.nsw.gov.au/.
30. NSW Department of Health & NSW Department of Education. Towards a health promoting school. NSW Government. 1996.
31. Department of Education. Sport and Physical Activity Policy. 2015; https://www.det.nsw.edu.au/policies/student_serv/student_welfare/safe_sport/PD20020012.shtml?query=Physical+Activity.
32. Department of Education. Local Decision, Local Decisions 2012; http://www.dec.nsw.gov.au/about-the-department/our-reforms/local-schools-local-decisions.
33. Wiggers J WL, Campbell E, Gillham K, Bell C, Sutherland R, Hardy LL, King L, Grunseit A, Milat AJ, Orr N. Good for Kids, Good for Life,2006-2010: Evaluation Report. Sydney. 2013; NSW Ministry of Health http://www.health.nsw.gov.au/research/Publications/good-for-kids.pdf. (Accessed 4 March 2016).
34. Farrell L, Lloyd B, Matthews R, Bravo A, Wiggers J, Rissel C. Applying a performance monitoring framework to increase reach and adoption of children’s healthy eating and physical activity programs. Public Health Research & Practice. 2014;25(1):e251148.
35. Australian Bureau of Statistics. Information paper: An introduction to Socio-Economic Indexes for Areas (SEIFA). Canberra: Australian Bureau of Statistics. 2006; Latest issue released at 11:30am (Canberra time) 26/03/2008.
36. Australian Institute of Health and Welfare. Rural, Regional and Remote Health: A guide to remoteness classifications. Canberra: Australian Institute of Health and Welfare. 2004.