Embed Size (px)
Citation preview

Everything
College Admissions
Jed ApplerouthNationally Certified Counselor
PhD Educational Psychology

2applerouth
Application numbers continue to rise
• 1/3 of freshmen applied to 7+ institutions. • Yield rates are falling at most colleges. • The average yield rate for all institutions in 2014 was
36%, down from 49% in 2002.
Chronicle of higher education Annual Survey, 2015

3applerouth
Enrollment Management will play a
larger role than ever before
• Enrollment management comes to center stage in the admissions process as institutional needs trump loftier ideals
• Greater attention to demonstrated interest, yield, discount rate, strategic pricing
• Above all else, make the budgets work

4applerouth
Yield Matters
College Yield Rate
Harvard 81%
Stanford 78%
MIT 72%
Notre Dame 53%
Vandy 42%
Wash U. 35%
GA Tech 33%
American 26%
Northeastern 18%
Drexel 8%
# of Admission Offers Given
# of Admission Offers Accepted
Yield rates are dropping, making it more challenging to build a desired class and manage institutional needs. Giving too many or too few offers can have real consequences for colleges (e.g.,housing, budgets)

5applerouth
Big Data comes to college
• The age of the algorithm and
predictive analysis
• Integrating lessons from retailers
such as Amazon and Walmart:
finding the underlying patterns of
consumer behavior.
• Improved predictions for GPA,
likelihood of transfer or graduation
• IBM’s Watson may eventually
conduct admissions decisions

6applerouth
Forecast Plus
tool for student
recruitmentCreated by Ruffalo Levitz: Enrollment Management Consultant
https://www.ruffalonl.com/enrollment-management/enrollment-marketing-services-to-target-and-recruit-
students/recruitment-technologies/forecast-plus-student-recruitment-predictive-modeling

7applerouth
Colleges attend more to student’s online behavior
“There are so many silent electronic footprints
they’re leaving nowadays….[we track] whether
individual applicants
•clicked to open email communications
•logged into the system to check the status of an
application
•called the school and how long the call lasted ”
- Sundar Kumarasamy, VP enrollment management and marketing, U. Dayton

8applerouth
Sample model: small liberal arts school in MA
Variable Model Effect Predictor GroupBeing From Within 100 Miles of Campus +
Best PredictorsCampus Visit Flag +
Public High School -
Student Athlete Flag +
Being From Lower Income Zip Code -
Moderate PredictorsPrivate High School +
Low Rated High School -
Being From Massachusetts +
Being From a City +
College Fair Attendee +Minor PredictorsComing From a Strong High
School Feeder +

9applerouth
The money crunch: a dual crisis of
affordability and degree completion
The cost of college and perceptions of value play an even bigger role in college selection

10applerouth
State funding continues its long decline
23% Decline in 6 years. 30+ years of decreased state funding for higher ed.
https://secure-media.collegeboard.org/digitalServices/misc/trends/2014-trends-college-pricing-report-final.pdf
Public Colleges and Universities, Dollars received per Full Time Equivalent (In 2013 Dollars)

11applerouth
And colleges are passing on their
higher costs to students
$4,964
$4,078
$3,276
$7,530
$9,842
$11,610

12applerouth
Costs continue a decades long trend of increasing
https://secure-media.collegeboard.org/digitalServices/misc/trends/2014-trends-college-pricing-report-final.pdf
325%
246%

13applerouth
Current pricing by institution type
https://secure-media.collegeboard.org/digitalServices/misc/trends/2014-trends-college-pricing-report-final.pdf
14applerouth
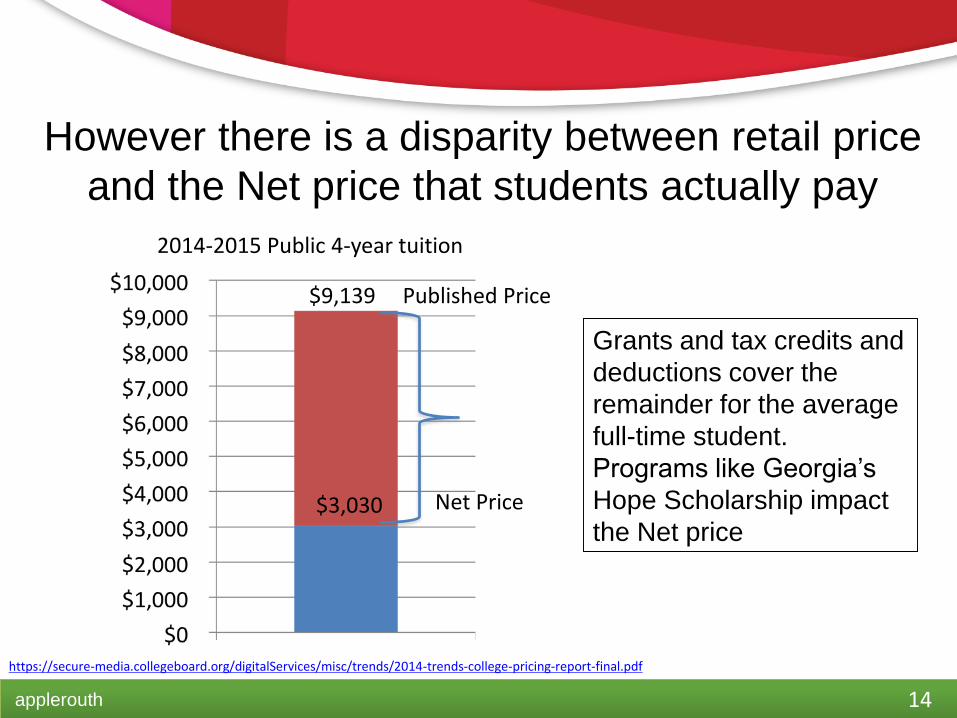
However there is a disparity between retail price
and the Net price that students actually pay
Grants and tax credits and
deductions cover the
remainder for the average
full-time student.
Programs like Georgia’s
Hope Scholarship impact
the Net price
2014-2015 Public 4-year tuition
$3,030
$9,139
Net Price
Published Price
https://secure-media.collegeboard.org/digitalServices/misc/trends/2014-trends-college-pricing-report-final.pdf

15applerouth
It often takes longer than 4 years to graduate,
further increasing the cost
Switching majors or schools and insufficient class offerings (UC system!) can delay graduation. Financial aid may expire after year 4.

16applerouth
Some colleges using merit money to
lure more affluent students
Affluent student
Even a small award can yield a
higher total return for the college
Give $15k to get $50k

17applerouth
To finance their education, students are
borrowing much more than ever before
Students now leave college owing an average of $37,172; Total US student debt approaches $1.3 Trillion!
$37k
$28k
$20k$16k
$9.7k

18applerouth
Discounting is Up!
• Roughly 1/3 of private institutions didn’t meet their goals
for applications, net revenue, total headcount, and yield.
• 76 percent of admissions directors (especially those at
private schools) think their institution is losing applicants
because of concerns about student debt.
• In order to fill their classes, private colleges increasingly
are discounting their tuition. The average discount for
first-year students at private colleges is now 46%.
• 75% schools are using merit aid, which can sometimes
squeeze out need-based aid.Chronicle of Higher Education Annual Survey, 2015

19applerouth
Skillful use of Merit Money can
transform institutions• Hope Scholarship has turned UGA from a back-
up to a reach school. Using money to lure
talented students is now a widespread strategy
• Alabama system: 3.5 GPA + ACT thresholds
equals discounts all the way to free tuition.
• Mississippi: 3.0 GPA + 26 ACT = In State Tuition.
• More colleges will use their resources to recruit
scholars who will enhance the student body.

20applerouth
Expect increasing competition at
state flagship universities
Number of state
residents
% students applying to 4-yr college
Average cost of college
State incentives to keep top applicants
State and Federal funding
Adequate affordable
options

21applerouth
Flagship state universities will further
diversify, potentially squeezing out locals
90% of public admissions directors are looking out of state or overseas to find more full pay students.
Some state legislatures are beginning to push back against this practice, 20% of admissions directors reported political or public scrutiny for their efforts.
Chronicle of Higher Education Annual Survey, 2015

22applerouth
Private colleges and universities will use
several strategies to balance the books
1) Achieve efficiencies in funding and student selection2) Use computerized data analysis to increase yield by
reducing the number of admission offers 3) “Engineer" financial incentives to maximize the impact
of dollars in affecting yield decisions
What’s the minimum scholarship we can award to this student in order to get her to come here?
Consultants, will you help us reduce our "discount rates“ ?

23applerouth
Early admissions will play an even
larger role for many colleges
Full pay kids!
Maximize Yield!

24applerouth
The Early Advantage
Accepted Early
AcceptedRegular
Net Gain of Early
Brown ED 19% 8% 238%Columbia ED 20% 6% 321%Cornell ED 37% 14% 258%Dartmouth ED 26% 8% 322%Harvard SCEA 21% 6% 350%Penn ED *25% 9% 278%Princeton SCEA 19% 5% 380%Yale SCEA 16% 5% 320%
25applerouth
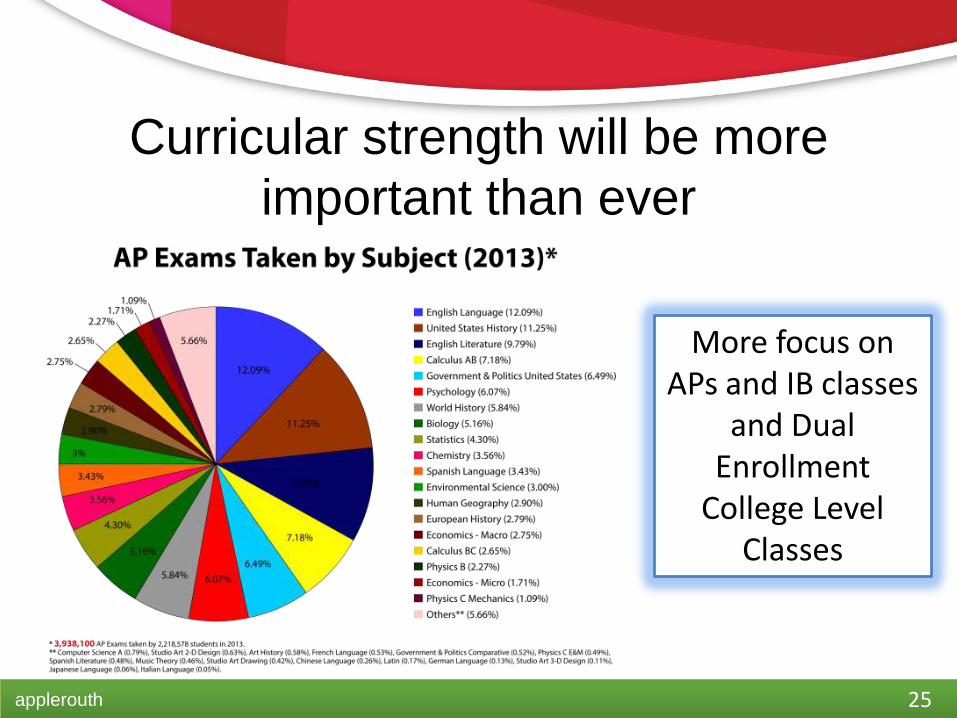
Curricular strength will be more
important than ever
More focus on APs and IB classes
and Dual Enrollment
College Level Classes
26applerouth
New Application for 2016
90+ members of the Coalition. Coalition Application exclusively used by the following schools:

27applerouth
US still puts a premium on testing: NACAC
Survey: Factors influencing admissions decisions
Importance Considerable Moderate Limited None
Grades in college prep 86.5% 11.5% 1.6% 0.3%
Strength of curriculum 70.7 22.0 5.9 1.3
Admission test scores 57.8 32.0 9.2 1.0
Grades in all courses 45.6 43.9 9.8 0.7
Essay or writing sample 26.4 37.5 19.9 16.3
Demonstrated interest 20.7 27.0 27.6 24.7
Teacher recommendation 17.4 47.7 23.7 11.2
Counselor rec. 17.1 50.0 22.0 10.9
Class rank 16.3 42.2 31.7 9.8
Extracurricular activities 8.9 43.9 34.3 12.9
Subject test scores (AP, IB) 7.0 27.2 33.6 32.2
Interview 6.6 26.3 31.9 35.2
SAT II scores 5.0 11.0 28.0 56.0

28applerouth
The admissions process
H.S. GPA in the context of Schedule Strength and Academic Strength of School
Teacher/Counselor Recommendations
SAT Subject Tests
Admissions Essays
Activities(Leadership, Depth)
SATACT
Academic Index: quantitative components
How will they read your application?
qualitative components: the packaging of the
application: Is there a cohesive story?
Demonstrated
Interest

29applerouth
How Most Colleges Evaluate Applicants
Step 1: Academic Indexing
• Applications are indexed through an algorithm that
typically includes:
– Course rigor
– Grades in core classes
– Test scores
– School strength
• Schools assign different weights to these factors, but
core GPA and course rigor often trump testing

30applerouth
How Most Colleges Evaluate
Applicants Continued…
Step 2*: Involvement/Leadership Evaluation
•Student résumé •Extra Curricular Activities•Leadership positions (depth) trumps variety (breadth)
*The factors in Steps 2 and 3 are considered only if the student’s academic index justifies a holistic read
31applerouth
How Most Colleges Evaluate
Applicants Continued…Step 3: Consider Other, Qualitative Factors
•Adversity
•Contributions to the community
•Diversity
•Awards and recognitions
•Personality and voice
•Student’s self-awareness or insights, as demonstrated through the essays or letters of recommendation

applerouth 32
ACADEMICSHOW WILL COLLEGES VIEW MY TRANSCRIPT?

33applerouth
Balance Course Rigor and GPA
Encourage students to take a challenging curriculum in the context of your school
To strike the right balance,
consider:
- Past performance
- In-school
commitments
- Other commitments
Getting Cs in advanced courses does not constitute performance. If you are pushing into AP and IB land, As and Bs demonstrate success. More selective colleges want to see more As.
34applerouth
Grade Trends are Essential
It is never too late to improve
your grades. It may be tough
to change your cumulative
GPA first semester senior year,
but an upward trend can help
with admissions

35applerouth
A 3.5 CGPA can tell different stories
Upward grade trends are your friends: And typically Core GPA has the most weight.
Freshman Year Sophomore Year Junior Year Senior Year
3.5
3.5
3.5
consistent
Approaching college level of difficulty
(Easier to forgive) (The Big Show)

36applerouth
Competition within Cohorts
You are compared to other students at your school (a high school profile will accompany your application); you are also frequently compared
within ethnicity and gender bands

37applerouth
College Admissions Essay
• The personal statement is
the single most important
essay most students will
write in high school
• Students often need specific
help with essay writing
instruction

38applerouth
Why the Essay Matters
• Offers the student a chance to come alive as a
human being and share something not found
anywhere else in the application
• A well-crafted essay can turn an application
reader into a vocal advocate in committee
For students on the margin, the essay can be a deciding factor in the admissions decision.

applerouth 39
ACTIVITIESSHOULD I JOIN EVERY CLUB IN SCHOOL?

40applerouth
How Do Activities Factor into Admissions?
• Admissions officers look for
continuity, depth, and
contribution
• Doing the activity consistently
over multiple years is key; do
not switch every year.
It’s good to have involvement beyond sports, if possible. Admissions officers are asking, “what will this student bring to campus?”

applerouth 41
DEMONSTRATED INTERESTWHY SHOULD I GO ON COLLEGE
VISITS?

42applerouth
Demonstrated Interest May Improve
Admissions Chances
• Demonstrated interest helps college manage yield.
• Demonstrated interest is a plus, but it’s not essential
for low SES students.
• DI doesn’t factor into the decision for the Ivies, or
other super-high yield schools, who are not remotely
worried about filling their classes.
Interact with college admissions officers, even if you cannot visit their schools.

43applerouth
College Visits Demonstrate Interest and More
• May help you clarify your interest level and help
you narrow your list
• Can inform your application (why Oberlin?)
• May provide a chance for an on-campus
interview

applerouth 44
Leveraging DiversityWhat does “diverse” mean to colleges?

45applerouth
Colleges Want Diverse, Balanced Classes
• The Admissions Office has directives from the Board
of Directors to craft a class with:
– Gender balance
– Racial balance
– Geographic balance (a flag in every state!)
• You are generally competing within your own pool,
which may help or hurt you. It’s easier to get into
Boston College if you’re from Nebraska than if you’re
from Boston.

46applerouth
Admissions offices are mindful of US News
Rankings and the metrics by which they are
judged
• Incoming GPA and testing of Freshman class
• Selectivity
• 4 Year and 6 Year Graduation Rates
Transfer Students are essentially invisible to the rankings. Colleges will accept students with lower test scores and high
school grades if they have a proven track record of college success. Same goes for graduate school.

47applerouth
Types of Applications
Early Applications:
• Early Action
– Restricted, e.g., Single Choice Early Action
– Unrestricted
• Early Decision (A Binding Commitment)
• Priority Deadlines (Better odds early)
• Rolling Decision (A Yes in October could
become a No by December as the class fills)
Regular Decision: Regular Deadlines Apply

48applerouth
Sample Financial Aid Award
Estimated Tuition and Fees $46,000
Estimated Room & Board $13,000
Miscellaneous Costs (e.g.,Books, travel) $4,000
Cost of Attendance: $63,000
Estimated Family Contribution $14,000
Deans Scholarship $15,000
College Grant $15,000
Subsidized Direct (Stafford, *3.76%) $3,500
Federal Work Study (varies) $3,500
Unsubsidized Direct (Stafford, *3.76%) $2,000
Parent PLUS Direct Loan (*6.31%) $10,000
$49,000
EFC
-
COA
=
DemonstratedNeed
Greatly Reduces Family
borrowing

49applerouth
Academic Common Market
• Leverage In-State-Tuition in Member States if a
major or program is unavailable in your state

50applerouth
Building a College List
• College Fairs (NACAC), visits from college Reps and
virtual tours online
• College Visits, particularly local ones, help you identify
categories of schools that may interest you (e.g., big
state school, football school, small liberal arts school,
city, burbs)
• Think about fit and financial fit
• Get all the non-negotiables on the table early so there
are no surprises
• Using guide books (Like the Fiske guide) to build overlap
schools

applerouth 51
TESTING

52applerouth
The ACT is dominant
SAT ACT Gap
2005 1,475,623 1,186,251 289,372
2006 1,465,744 1,206,455 259,289
2007 1,494,531 1,300,599 193,932
2008 1,518,859 1,421,941 96,918
2009 1,530,128 1,480,469 49,659
2010 1,597,329 1,568,835 28,494
2011 1,647,123 1,623,112 24,011
2012 1,664,479 1,666,209 -1,730
2013 1,660,047 1,799,243 -139,196
2014 1,670,000 1,845,787 -175,787
2015 1,698,521 1,924,436 -225,915
2016 1,698,521* 2,090,342 -391,821 1,100,000
1,200,000
1,300,000
1,400,000
1,500,000
1,600,000
1,700,000
1,800,000
1,900,000
2,000,000
2,100,000
2005 2007 2009 2011 2013 2015
SAT
ACT

53applerouth
The Redesigned SAT appears to be a
more rigorous test than the current ACT
The Redesigned SAT raises the bar for students, emphasizes rigorous standards and critical thinking and puts a greater emphasis on reading skills in every section.
ReadingCritical
Thinking

54applerouth
But the ACT is beefing up its content
to counter the surging SAT
ACT has been revealing harder math and science in recent tests and in its ACT guide released in late May
Math Science

55applerouth
The SAT made most of the moves
towards the ACT
SAT moves towards ACT
• Eliminates guessing penalty and E)
answer choice
• Drops advanced vocabulary
• Uses exclusively long form passages for
Writing and Reading from various contexts
• Focuses on rhetorical skills over grammar
• Adds science-type charts, tables, graphs
• Adds higher level math (e.g., trig) and puts
more math in context
• Moves from 10 to 4 sections and drops
experimental section
• Makes the essay optional at the end of the
test
ACT moves towards SAT
• Adds comparison reading
passages
• Adds more critical thinking,
analysis and time to optional
essay
Overlap of roughly 90%. Scores should correlate more highly than ever.

56applerouth
The recipe behind the Redesigned SAT
The Redesigned SAT is more like the ACT, more aligned with the Common Core, and more rigorous than ever.

57applerouth
The amount of time allocated per question is a profound
difference. The ACT is a speed test; the SAT less so
Seconds Per Question
Section ACT SAT
Writing 36.0 47.7 33 %
Reading 52.5 75.0 43 %
Math 60.0 84.2 40 %
Science 52.5Extended time SAT over ACT!
Many of our students prefer the SAT, merely on the merits of its more forgiving timing.

58applerouth
Expect an extremely hard passage on each SAT test, less so for the ACT
Students need to be prepared for the spikes in difficulty on the SAT. ACT is more consistent in its passage difficulty
Science (Comparison) Science Humanities Narrative Fiction Humanitie
s
Prose FictionSocial Science(Comparison)
Natural ScienceHumanities
Tough!

59applerouth
A tale of two visions of math
Math is the area of greatest divergence. SAT is limiting its focus, emphasizing Common Core skills, while the ACT is
expanding its reach into ever harder content
60applerouth
SAT math emphasizes conceptual understanding
• Interpreting trumps solving.
• Understanding how to build and manipulate functions
and equations.
• It’s more of an applied math test, gauging fluency and
understanding, rather than systematic solving.
• No more immediate roadmap to an answer, students
must be more discriminating and find a path to an
answer.
• Overlapping content with fewer items assessing a
solitary concept.

61applerouth
ACT Math
• Is more straightforward
• Is more heuristic based: see this type of
problem, follow this rule to solve it
• Puts a greater focus on geometry
• Tends to test math concepts in isolation
• Allows a student to always use a calculator
• Pulls from a broader range of topics

62applerouth
Comparing SAT and ACT content*
Test Algebra Geometry Arithmetic/Data Analysis
Trigonometry
ACT 46% 23% 24% 7%
SAT 62% 6% 30% 2%
SAT has more algebra and much less geometry. Trigonometry is mostly an afterthought. Algebra dominates the SAT.
*Using SAT categories, slightly different from how the ACT categorizes math items

63applerouth
May 23, ACT released its new Official Guide
with the hardest ACT math we’ve seen.
• Vectors
• Advanced probability
• Advanced sequences
• Permutations using !
• Line of best fit (way more advanced than those on the SAT)
This is a clear and direct move away from the Algebra-heavy SAT revamp towards a broader scope of advanced math skills.

64applerouth
Science

65applerouth
The ACT has a rigorous science section, while the
SAT has some science items sprinkled throughout
Science fluency examines
one’s ability to read tables,
charts, and graphs and science
texts. Students must see
trends, correlations, extrapolate
and interpolate data.
The ACT Science section is a far greater challenge than the “science” tested thus far on the SAT

66applerouth
ACT Science: many multi-part problems
Students must quickly move between
different parts of the passage, the charts, tables and graphs,
making connections

67applerouth
ACT science, like math, is growing
increasingly difficult• Moving from 7 to 6 passages per test allows for a
deeper testing for those passages.
• Science is getting more tricky, with more complex
questions, and fewer simple items.
• Students more frequently asked to distinguish
between scientific concepts such as independent and
dependent variables.
• On recent ACT tests, the science section is assessing
more direct physics knowledge, e.g., potential vs
kinetic energy, mass vs weight.

68applerouth
The optional essays on the SAT and ACT
• They are testing critical
thinking and analytical skills
• They require more skilled
reading and planning
• It will be effectively impossible
to memorize canned essay
templates and employ them
on these new tests.

69applerouth
The SAT Essay: A document based question
The College Board has modified free
response exercises from AP Language and AP Literature exams to create
this new SAT essay
70applerouth
Citing cost and validity issues, not all schools
require the SAT or ACT essays
These new essays should be much more predictive of performance in 1st year English and 1st year GPA

71applerouth
How about those Redesigned
SAT Scores?

72applerouth
Comparing scores from the old SAT to
the Redesigned SAT can be confusing
Throw out what you know! These two tests are on completely different curves!
1040970
Redesigned SATOld SAT

73applerouth
The Redesigned SAT seems inflated,
but it’s merely on its own curve.
Old SAT Redesigned SAT
670 760
730 820
820 900
920 1000
1000 1080
1100 1170
1200 1270
1230 1300
1400 1450
1470 1510
The mean score on the Old SAT is roughly 1000, compared to a mean score of 1080 on the Redesigned SAT.
https://collegereadiness.collegeboard.org/educators/higher-ed/scoring-changes/concordance
74applerouth
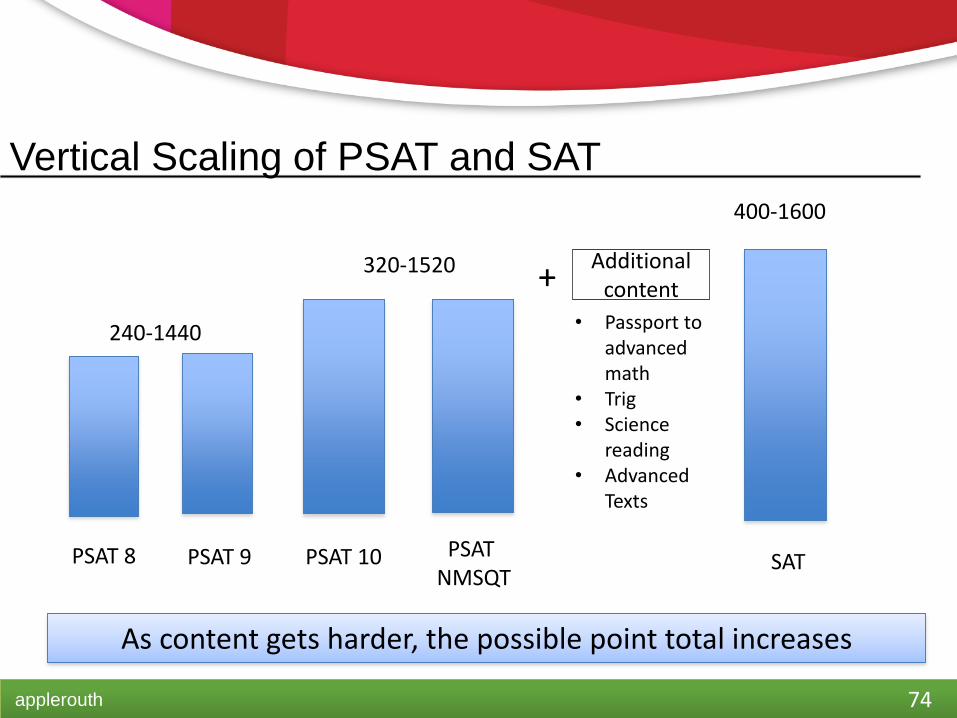
Vertical Scaling of PSAT and SAT
As content gets harder, the possible point total increases
PSAT 8 PSAT 9 PSAT 10 PSAT NMSQT
SAT
240-1440
320-1520
400-1600
Additional content
• Passport to advanced math
• Trig• Science
reading• Advanced
Texts
+

75applerouth
There are no historically easy or hard
test dates for the SAT or ACT!
Historic SAT Data 2006-2012
Reading Math Total Students
October 592 595 1187 1359
November 585 603 1188 522
December 582 593 1175 621
January 588 593 1181 1263
March 585 598 1183 1351
May 580 584 1164 1000
June 584 594 1178 1285
Averages 586 594 1179 7401
Patterns of easy or hard sections or tests vary
from year to year. There is
no pattern

76applerouth
Score Choice and SuperScoring
• For the vast majority of colleges, students can select
which scores to submit and which to withhold (e.g., send
March and June, withhold May). Some 100 colleges
(typically highly selective institutions) require students to
send all scores
Test Date Verbal Math Composite
March 630 670 1300
May 610 630 1240
June 660 650 1310
Send a score if it strengthens the application, top section or top composite

77applerouth
Superscoring
A majority of colleges will superscore the SAT and many
will superscore the ACT, combining the top section
scores to form a new composite score, the only score to
be used in the admissions process.
March and June contribute to the superscore, May does not. Withhold May unless a school requires all tests
Test Date Verbal Math Composite
March 630 670 1300
May 610 630 1240
June 660 650 1310
Superscore 660 670 1330
78applerouth
Elements to Successful Prep
• Mock tests: testing effects
• Distributed practice
• Starting early
• Time on Task
• Finishing strong
• Having a goal (use Collegeboard.org to
calibrate)

79applerouth
Find score ranges online
Use the College Board.com site to see how your scores compare to other applicants
Remember that the bottom quartile is predominately hooked applicants (i.e., athletes, development…), not straight academic admits. The median score for unhooked applicants is closer to the right side of the middle 50% range.
Middle 50%
Bottom 25% Top 25%
Your competitive set
aRight
side of the range
is safer
UGA

80applerouth
Naviance & Cappex
Scattergrams:
What do schools want?
UGA
Vandy Princeton
GA Tech
Alabama

81applerouth
Which Test Should I Try First?
• Both, ideally, to establish dual baselines
– 1. Start with your STRENGTH. If none,
– 2. Prep to your PREFERENCE.
– 3. If prep is not yielding results, switch to the other test. If you have to switch, 90% of the content transfers

82applerouth
Our Services
• SAT & ACT prep (online, private, group)
• SAT Subject and AP prep
• HS subject assistance
• Study Skills
Helping prepare students for higher scores and grades since 2001