Embed Size (px)
Citation preview

Everyone Counts: Planning for Patients 2014/15 - 2018/19: Technical Definitions for Clinical Commissioning Groups and Area Teams

Everyone Counts: Planning for Patients 2014/15 - 2018/19: Technical Definitions for Clinical
Commissioning Groups and Area Teams
2
Everyone Counts: Planning for Patients 2014/15 - 2018/19: Technical Definitions for Clinical Commissioning Groups and Area Teams
First published: 23 December 2013
Second publication: 14 January 2014
Prepared by: Analytical Service (Operations)
Contact: [email protected]
Everyone Counts: Planning for Patients 2014/15 - 2018/19: Technical Definitions for Clinical
Commissioning Groups and Area Teams
3
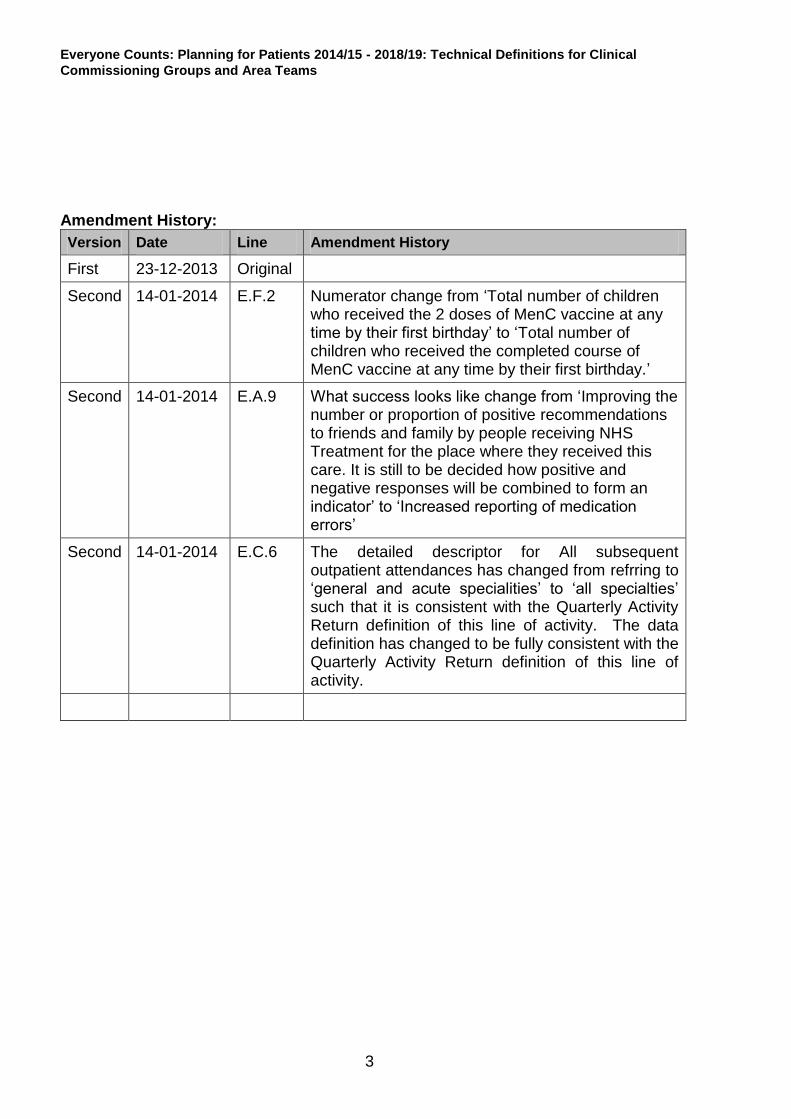
Amendment History:
Version Date Line Amendment History
First 23-12-2013 Original
Second 14-01-2014 E.F.2 Numerator change from ‘Total number of children who received the 2 doses of MenC vaccine at any time by their first birthday’ to ‘Total number of children who received the completed course of MenC vaccine at any time by their first birthday.’
Second 14-01-2014 E.A.9 What success looks like change from ‘Improving the number or proportion of positive recommendations to friends and family by people receiving NHS Treatment for the place where they received this care. It is still to be decided how positive and negative responses will be combined to form an indicator’ to ‘Increased reporting of medication errors’
Second 14-01-2014 E.C.6 The detailed descriptor for All subsequent outpatient attendances has changed from refrring to ‘general and acute specialities’ to ‘all specialties’ such that it is consistent with the Quarterly Activity Return definition of this line of activity. The data definition has changed to be fully consistent with the Quarterly Activity Return definition of this line of activity.

Everyone Counts: Planning for Patients 2014/15 - 2018/19: Technical Definitions for Clinical
Commissioning Groups and Area Teams
4
Contents
Executive summary ........................................................................................................ 7
The planning process 2014/15 to 2018/19 ..................................................................... 7 Unify2 templates ............................................................................................................ 7
Everyone Counts - Annex A Measures .......................................................................... 8 E.A.1: Potential years of life lost (PYLL) from causes considered amenable to healthcare ...................................................................................................................... 8 E.A.2: Health-related quality of life for people with long-term conditions ........................ 9
E.A.3: IAPT Roll-Out .................................................................................................... 10 E.A.4: Composite measure on emergency admissions ................................................ 12 E.A.5: Patient experience of hospital care ................................................................... 13 E.A.6: Friends and family test ...................................................................................... 14 E.A.7.i-ii Composite indicator comprised of i) GP Services ii) GP Out of Hours ........... 16
E.A.8: Hospital deaths attributable to problems in care ................................................ 16
E.A.9: Improving the reporting of medication-related safety incidents .......................... 17 Everyone Counts - Annex A Supporting Measures ...................................................... 19 E.A.S.1: Estimated diagnosis rate for people with dementia ........................................ 19 E.A.S.2: IAPT Recovery Rate ...................................................................................... 21
E.A.S.3: Proportion of older people (65 and over) who were still at home 91 days after discharge from hospital into reablement/rehabilitation services ................................... 23 E.A.S.4: Healthcare acquired infection (HCAI) measure (MRSA) ................................ 24
E.A.S.5: Healthcare acquired infection (HCAI) measure (clostridium difficile infections) ..................................................................................................................................... 24
Everyone Counts - Annex B Measures ........................................................................ 25 E.B.1-3: Referral to Treatment pathways ..................................................................... 25
E.B.4: Diagnostic test waiting times ............................................................................. 27
E.B.5: A&E waiting time - total time in the A&E department ......................................... 29 E.B.6-7: Cancer 2 week waits ...................................................................................... 31 E.B.8-11: Cancer day 31 waits ..................................................................................... 33 E.B.12-14: Cancer 62 day waits ................................................................................... 36
E.B.15.i: Ambulance clinical quality – Category A (Red 1) 8 minute response time 38 E.B.15.ii: Ambulance clinical quality – Category A (Red 2) 8 minute response time .... 40 E.B.16: Ambulance clinical quality - Category A 19 minute transportation time ........... 42 Everyone Counts - Annex B Supporting Measures ...................................................... 44
E.B.S.1: Mixed Sex Accommodation (MSA) Breaches ................................................ 44 E.B.S.2: Cancelled Operations ..................................................................................... 47 E.B.S.3: Mental Health Measure – Care Programme Approach (CPA) ........................ 49 E.B.S.4: Number of 52 week Referral to Treatment Pathways..................................... 51 E.B.S.5: Trolley waits in A&E ....................................................................................... 53
E.B.S.6: Urgent operations cancelled for a second time .............................................. 55 E.B.S.7: Ambulance handover time ............................................................................. 57
Everyone Counts – Annex C Measures ....................................................................... 59 E.C.1-3: Elective finished first consultant episodes (FFCEs) ....................................... 59 E.C.4: Non-elective FFCEs (First Finished Consultant Episode) ................................. 61 E.C.5: All first outpatient attendances .......................................................................... 63 E.C.6: All Subsequent Outpatient Attendances (consultant led) .................................. 65
E.C.7-8: A&E Attendances ........................................................................................... 67

Everyone Counts: Planning for Patients 2014/15 - 2018/19: Technical Definitions for Clinical
Commissioning Groups and Area Teams
5
E.C.9: GP Written Referrals ......................................................................................... 69 E.C.10: Other Referrals for first Outpatient Appointment ............................................. 71
E.C.11 : Total Referrals ................................................................................................ 73 E.C.12: First Outpatient Attendances following GP Referrals ...................................... 74 Everyone Counts – Annex D Measures ....................................................................... 76
E.D.1: Satisfaction with the Quality of Consultation at the GP Practice ....................... 76 E.D.2: Satisfaction with the Overall Care Received at the Surgery .............................. 79 E.D.3: Satisfaction with Accessing Primary Care ......................................................... 81 E.D.4: Proportion of New Cancer Cases Referred using the 2 Week Wait Pathway. ... 83 E.D.5: Flu Vaccinations –At Risk Coverage ................................................................. 84
E.D.6: Identifying the Prevalence of Depression compared to an Estimated Model ..... 85 E.D.7: Percentage of Patients Seen – 24 Month Measure ........................................... 87 E.D.8: Number of Course Treatments per 100,000 Population .................................... 88 E.D.9: GPPS – Percentage Positive Experience .......................................................... 89 E.D.10: Total Number of Sight Tests per 100,000 Population ...................................... 90
E.D.11: Percentage of Tints per Voucher ..................................................................... 91 E.D.12 : Percentage of Repairs per Voucher and Percentage of Replacements per Voucher ........................................................................................................................ 92
E.D.13: Percentage of Prisms per Voucher.................................................................. 93
Everyone Counts – Annex E Measures ....................................................................... 94 E.E.1: Percentage of all NHS England Patients receiving Treatment within 18 Weeks of Referral ........................................................................................................................ 94 E.E.2: Percentage of NHS England Patients waiting 6 Weeks or more for Diagnostic Tests ............................................................................................................................ 95 Everyone Counts – Annex F Measures ........................................................................ 96
E.F.1: Population Vaccination Coverage – Dtap / IPV / Hib (1 year old). ..................... 96
E.F.2: Population Vaccination Coverage – MenC (1 year old). .................................... 97
E.F.3: Population Vaccination Coverage – PCV (1 year old) ....................................... 98 E.F.4: Population Vaccination Coverage – Dtap / IPV / Hib (2 years old) .................... 99
E.F.5: Population Vaccination Coverage – PCV Booster (2 years old) ...................... 100 E.F.6: Population Vaccination Coverage – Hib / MenC Booster (2 years old) ............ 101 E.F.7: Population Vaccination Coverage – MMR for One Dose (2 years old) ............ 102 E.F.8: Population Vaccination Coverage – MMR for One Dose (5 years old) ............ 103
E.F.9: Population Vaccination Coverage – MMR for Two Doses (5 years old) .......... 104 E.F.10: Population vaccination coverage - Hib / MenC booster (5 years old) ............ 105 E.F.11: Population Vaccination Coverage - Hepatitis B (1 year old) .......................... 106 E.F.12: Population Vaccination Coverage - Hepatitis B (2 years old) ........................ 107 E.F.13: Population Vaccination Coverage - HPV ....................................................... 108
E.F.14: Population Vaccination Coverage - PPV ....................................................... 109 E.F.15: Population Vaccination Coverage - Flu (aged 65+) ....................................... 110
E.F.16: Population Vaccination Coverage - Flu (at risk individuals) ........................... 111 E.F.17: Percentage of Pregnant Women eligible for Infectious Disease Screening who are tested for HIV, leading to a Conclusive Result ..................................................... 112 E.F.18: Percentage of Women Booked for Antenatal Care, as reported by Maternity Services, who have a Screening Test for Syphilis, Hepatitis B and Susceptibility to Rubella leading to a Conclusive Result ...................................................................... 114 E.F.19: Percentage of Pregnant Women eligible for Antenatal Sickle Cell and Thalassaemia Screening for whom a Conclusive Screening Result is available at the Day of Report ............................................................................................................. 116
Everyone Counts: Planning for Patients 2014/15 - 2018/19: Technical Definitions for Clinical
Commissioning Groups and Area Teams
6
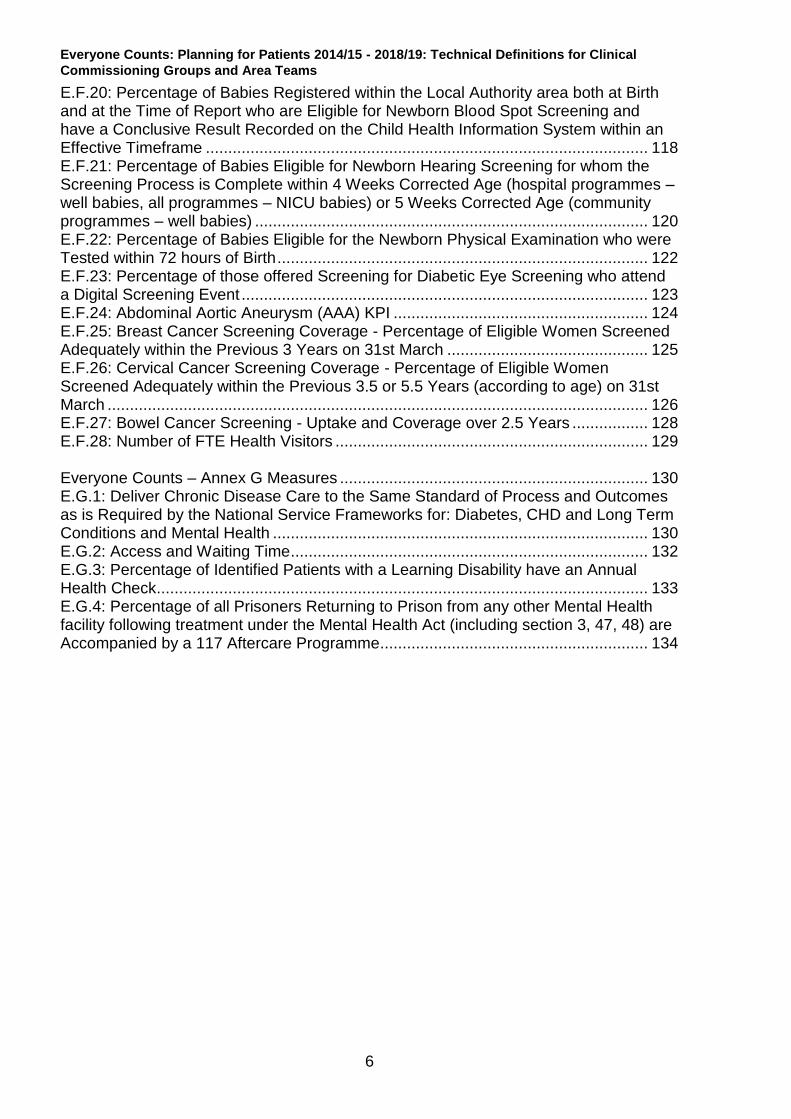
E.F.20: Percentage of Babies Registered within the Local Authority area both at Birth and at the Time of Report who are Eligible for Newborn Blood Spot Screening and have a Conclusive Result Recorded on the Child Health Information System within an Effective Timeframe ................................................................................................... 118 E.F.21: Percentage of Babies Eligible for Newborn Hearing Screening for whom the Screening Process is Complete within 4 Weeks Corrected Age (hospital programmes – well babies, all programmes – NICU babies) or 5 Weeks Corrected Age (community programmes – well babies) ........................................................................................ 120 E.F.22: Percentage of Babies Eligible for the Newborn Physical Examination who were Tested within 72 hours of Birth ................................................................................... 122 E.F.23: Percentage of those offered Screening for Diabetic Eye Screening who attend a Digital Screening Event ........................................................................................... 123 E.F.24: Abdominal Aortic Aneurysm (AAA) KPI ......................................................... 124 E.F.25: Breast Cancer Screening Coverage - Percentage of Eligible Women Screened Adequately within the Previous 3 Years on 31st March ............................................. 125 E.F.26: Cervical Cancer Screening Coverage - Percentage of Eligible Women Screened Adequately within the Previous 3.5 or 5.5 Years (according to age) on 31st March ......................................................................................................................... 126 E.F.27: Bowel Cancer Screening - Uptake and Coverage over 2.5 Years ................. 128
E.F.28: Number of FTE Health Visitors ...................................................................... 129
Everyone Counts – Annex G Measures ..................................................................... 130 E.G.1: Deliver Chronic Disease Care to the Same Standard of Process and Outcomes as is Required by the National Service Frameworks for: Diabetes, CHD and Long Term Conditions and Mental Health .................................................................................... 130
E.G.2: Access and Waiting Time ................................................................................ 132 E.G.3: Percentage of Identified Patients with a Learning Disability have an Annual Health Check .............................................................................................................. 133
E.G.4: Percentage of all Prisoners Returning to Prison from any other Mental Health facility following treatment under the Mental Health Act (including section 3, 47, 48) are Accompanied by a 117 Aftercare Programme ............................................................ 134

Everyone Counts: Planning for Patients 2014/15 - 2018/19: Technical Definitions for Clinical
Commissioning Groups and Area Teams
7
Executive summary
The purpose of this Technical Definitions document is to describe the indicators in
‘Everyone Counts: Planning for Patients 2014/15 – 2018/19’, and to set out for each
measure definitions, monitoring, accountability and planning requirements.
Where this information if available through other online sources, this document will
direct towards these.
For the rationale to the NHS Outcomes Framework Indicators: please see the NHS
Outcomes Framework 2014 to 2015
The planning process 2014/15 to 2018/19
For information on how the measures detailed in this document and planning
requirements for each sit in the planning process see ‘Everyone Counts: Planning for
Patients 2014/15 – 2018/19’.
The document ‘Setting 5-year ambitions for improving outcomes A how-to guide for
commissioners’ sets out summary information on the indicators being used to measure
each of the ambitions and should be used alongside this document when returning
plans.
Separate guidance will be issued on the measures in the Better Care Fund which are
given in Annex I to ‘Everyone Counts: Planning for Patients 2014/15 – 2018/19’.
Information on activity returned in plans via Unify2 will be used to reconcile with
equivalent information collected in the financial plans.
The planning timetable is given in ‘Everyone Counts: Planning for Patients 2014/15 –
2018/19’.
Unify2 templates
The Unify2 templates which form part of NHS England’s planning process are:
ProvCom template this should be completed by Providers, CCGs and Area Teams
CCG Com template this should be completed by CCGs
DC AT Com template this should be completed by Area Teams engaged in Direct
Commissioning

Everyone Counts: Planning for Patients 2014/15 - 2018/19: Technical Definitions for Clinical
Commissioning Groups and Area Teams
8
Everyone Counts - Annex A Measures
E.A.1: Potential years of life lost (PYLL) from causes considered amenable to healthcare
DEFINITIONS
For specification of this measure please see ‘Setting 5-year ambitions for improving outcomes: A how-to guide for commissioners’ annex on indicators, outcome ambition 1, and the Levels of Ambition Atlas available through the NHS England strategic and operational planning webpage
PLANNING REQUIREMENTS
Are plans required and if so, at what frequency?
CCG – Yes, annual for each year from 2014/15 till 2018/19 via CCG Com template Area Team – No
FURTHER INFORMATION
For information about how this measure will be used in the Quality Premium, see the Quality Premium guidance. For information on how this measure forms part of the 5 year plans see ‘Setting 5-year Ambitions for improving outcomes: A how-to guide for commissioners’. PYLL is a CCG indicator and further information is available at the HSCIC indicators portal
- Clinical Commissioning Group Indicators - Domain 1 – Preventing People from Dying Prematurely - 1.1 Potential Years Life Lost (PYLL) from causes considered amenable to
healthcare

Everyone Counts: Planning for Patients 2014/15 - 2018/19: Technical Definitions for Clinical
Commissioning Groups and Area Teams
9
E.A.2: Health-related quality of life for people with long-term conditions
DEFINITIONS
For specification of this measure please see ‘Setting 5-year ambitions for improving outcomes: A how-to guide for commissioners’ annex on indicators, outcome ambition 2, and the Levels of Ambition Atlas available through the NHS England strategic and operational planning webpage
PLANNING REQUIREMENTS
Are plans required and if so, at what frequency?
CCG – Yes, annual for each year from 2014/15 till 2018/19 via CCG Com template. Area Team – No.
FURTHER INFORMATION
For information on how this measure forms part of the 5 year plans see ‘Setting 5-year Ambitions for improving outcomes: A how-to guide for commissioners’.

Everyone Counts: Planning for Patients 2014/15 - 2018/19: Technical Definitions for Clinical
Commissioning Groups and Area Teams
10
E.A.3: IAPT Roll-Out
DEFINITIONS
Detailed Descriptor:
The primary purpose of this indicator is to measure improved access to psychological services (IAPT) for people with depression and/or anxiety disorders. This is done using two indicators (the other indicator being E.A.S.2). E.A.3 measures the proportion of people that enter treatment against the level of need in the general population (the level of prevalence addressed or ‘captured’ by referral routes).
Lines Within Indicator (Units):
The proportion of people that enter treatment against the level of need in the general population i.e. the proportion of people who have depression and/or anxiety disorders who receive psychological therapies. Numerator: The number of people who receive psychological therapies. Denominator: The number of people who have depression and/or anxiety disorders (local estimate based on Adult Psychiatric Morbidity Survey 2000).
Data Definition:
Relevant IAPT data items and the permissible values for each data item are defined in the IAPT Data Standard. Psychological therapy: NICE recommended treatment from a qualified psychological therapist (low or high intensity). Definition of a ‘case’: A patient suffering from depression and/or anxiety disorders, as determined by scores on the Patient Health Questionnaire (PHQ 9) for depression and/or the Patient Health Questionnaire (GAD7) for anxiety disorders, or other anxiety disorder specific measure as appropriate for the patient’s diagnosis. Completed treatment: This is a count of all those who have left treatment within the reporting quarter having attended at least two treatment contacts, for any reason including: planned completion; deceased; dropped out (unscheduled discontinuation); referred to another service or unknown. For the denominator of this indicator, the expectation is NOT that CCGs carry out a survey of their own, but that they extrapolate local prevalence from the national Psychiatric Morbidity Survey 2000 as part of their needs assessment.
MONITORING
Monitoring Frequency:
Quarterly
Monitoring Data Source:
IAPT Minimum Data Set, HSCIC

Everyone Counts: Planning for Patients 2014/15 - 2018/19: Technical Definitions for Clinical
Commissioning Groups and Area Teams
11
ACCOUNTABILITY
What success looks like, Direction, Milestones:
Ongoing improvement is anticipated. The mandate anticipates the completion of the full roll-out of the access to psychological therapies programme by 2014/15 (full roll-out is at least 15% of adults with relevant disorders having timely access to services) and NHS England will expect CCGs to commission services with that roll-out in mind and for the recovery rate to reach 50%.
Timeframe/Baseline:
Ongoing, to 2014/15
Rationale:
This indicator focuses on improved access to psychological therapies, in order to address the enduring unmet need. Around one in six adults in England suffer from a common mental health problem, such as depression or an anxiety disorder. Collecting this indicator will demonstrate the extent to which this need is being met.
PLANNING REQUIREMENTS
Are plans required and if so, at what frequency?
CCG – Yes, quarterly for 2014/15 and annual for 2015/16 via CCG Com template Area Team - No
FURTHER INFORMATION
The IAPT Data Handbook which explains the function of effective data collection and reporting in IAPT is available from http://www.iapt.nhs.uk/services/measuring-outcomes. Detailed guidance on use of the IAPT data set including the technical specification and the central return process can be found at http://www.hscic.gov.uk/iapt. For information about how this measure will be used in the Quality Premium, see the Quality Premium guidance.

Everyone Counts: Planning for Patients 2014/15 - 2018/19: Technical Definitions for Clinical
Commissioning Groups and Area Teams
12
E.A.4: Composite measure on emergency admissions
DEFINITIONS
For specification of this measure please see ‘Setting 5-year ambitions for improving outcomes: A how-to guide for commissioners’ annex on indicators, outcome ambition 3, and the Levels of Ambition Atlas available through the NHS England strategic and operational planning webpage This is a composite measure of:
Unplanned hospitalisation for chronic ambulatory care sensitive conditions,
Unplanned hospitalisation for asthma, diabetes and epilepsy in under 19s,
Emergency admissions for acute conditions that should not usually require hospital admission,
Emergency admissions for children with lower respiratory tract infections (LRTI).
MONITORING
Monitoring Frequency:
Quarterly, 4 month lag
ACCOUNTABILITY
What Success Looks Like, Direction, Milestones:
Reduce emergency admissions which can be influenced by effective collaboration across the health and care system.
Timeframe/Baseline:
Ongoing
PLANNING REQUIREMENTS
Are plans required and if so, at what frequency?
CCG – Yes, quarterly for 2014/15 and annual for 2014/15 to 2018/19. Area Team – No.
FURTHER INFORMATION
For information about how this measure will be used in the Quality Premium, see the Quality Premium guidance. For information on how this measure forms part of the 5 year plans see ‘Setting 5-year Ambitions for improving outcomes: A how-to guide for commissioners’. The definition used here is consistent with that given in the Better Care Fund (BCF), note the BCF is on a different health geography footprint to CCGs.

Everyone Counts: Planning for Patients 2014/15 - 2018/19: Technical Definitions for Clinical
Commissioning Groups and Area Teams
13
E.A.5: Patient experience of hospital care
DEFINITIONS
For specification of this measure please see ‘Setting 5-year ambitions for improving outcomes: A how-to guide for commissioners’ annex on indicators, outcome ambition 5, and the Levels of Ambition Atlas available through the NHS England strategic and operational planning webpage Note, the measure is amended from the NHS OF measure, full details are given in the how-to guide.
PLANNING REQUIREMENTS
Are plans required and if so, at what frequency?
CCG – Yes, annual from 2014/15 till 2018/19 via CCG Com template. Area Team – No.
FURTHER INFORMATION
For information on how this measure forms part of the 5 year plans see ‘Setting 5-year Ambitions for improving outcomes: A how-to guide for commissioners’.

Everyone Counts: Planning for Patients 2014/15 - 2018/19: Technical Definitions for Clinical
Commissioning Groups and Area Teams
14
E.A.6: Friends and family test
DEFINITIONS
Detailed Descriptor:
Local providers for Friends and Family Test purposes are providers that represented 10% or more of the CCG’s activity for Q1 and Q2 of 2013/14. Definitions of the patient improvement indicators within the CCG Outcomes Indicator Set, together with the technical definitions can be found at: http://www.england.nhs.uk/ccg-ois/.
ACCOUNTABILITY
What Success Looks Like, Direction, Milestones:
Improving the number or proportion of positive recommendations to friends and family by people receiving NHS Treatment for the place where they received this care. It is still to be decided how positive and negative responses will be combined to form an indicator.
Timeframe/Baseline:
Ongoing
Rationale:
CCGs should expect NHS providers to develop a systematic approach to improving patient experience (in line with the Keogh Review report), with significant patient involvement, for understanding how the views of patients and related data, including information from complaints and Patient Led Assessments of the Care Environment, are gathered, used, acted upon and publically reported. CCGs should develop similar, higher level systematic approaches, linked to Quality Surveillance Groups that support the identification of action required to improve patient experience along pathways. The NHS Friends and Family Test is part of this systematic approach to improving patient experience and is based on one simple question that ensures that local hospitals and the public get regular, up to date feedback on what patients think about their services. It provides a mechanism to identify poor performance and encourage staff to make improvements where services do not live up to the expectations of patients. This leads to a more positive experience of care for patients. Developing a plan in response to issues identified from the test results will help ensure a focused approach to addressing issues identified.
PLANNING REQUIREMENTS
Are plans required and if so, at what frequency?
CCG – Yes, self-certification for 2014/15 and 2015/16 against nationally set objective via CCG Com template. Area Team – No.

Everyone Counts: Planning for Patients 2014/15 - 2018/19: Technical Definitions for Clinical
Commissioning Groups and Area Teams
15
FURTHER INFORMATION
For information about how this measure will be used in the Quality Premium, see the Quality Premium guidance.
Everyone Counts: Planning for Patients 2014/15 - 2018/19: Technical Definitions for Clinical
Commissioning Groups and Area Teams
16
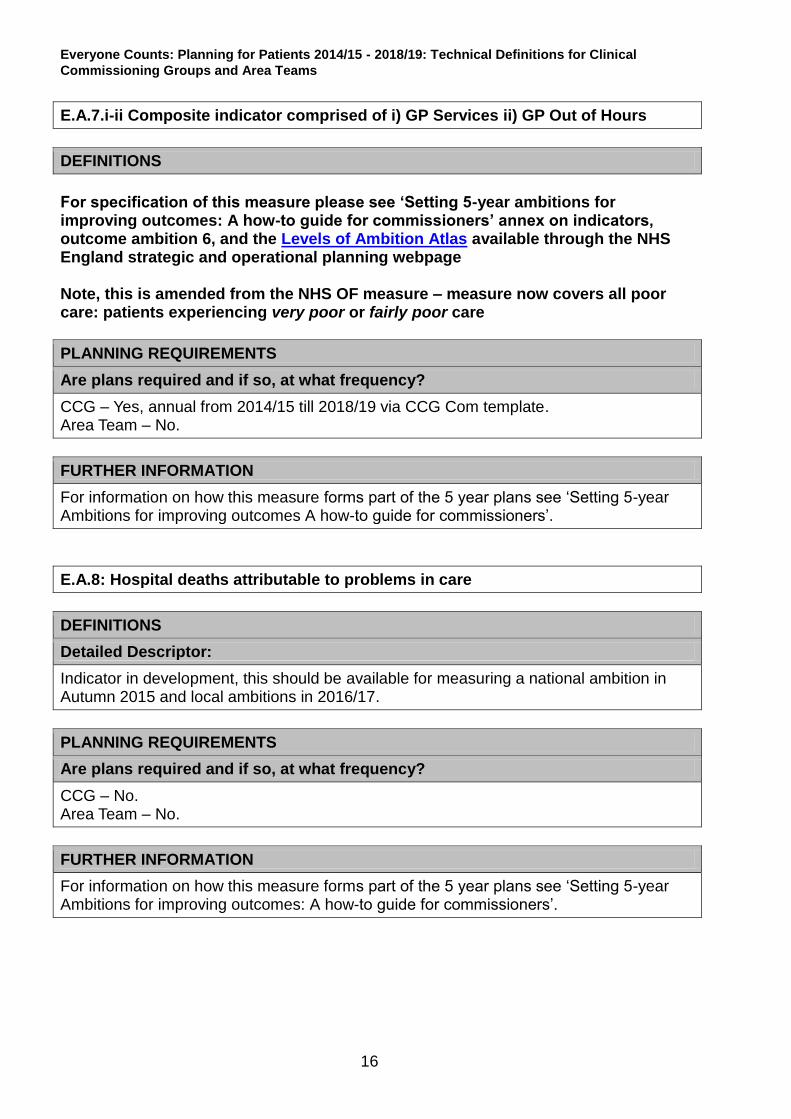
E.A.7.i-ii Composite indicator comprised of i) GP Services ii) GP Out of Hours
DEFINITIONS
For specification of this measure please see ‘Setting 5-year ambitions for improving outcomes: A how-to guide for commissioners’ annex on indicators, outcome ambition 6, and the Levels of Ambition Atlas available through the NHS England strategic and operational planning webpage Note, this is amended from the NHS OF measure – measure now covers all poor care: patients experiencing very poor or fairly poor care
PLANNING REQUIREMENTS
Are plans required and if so, at what frequency?
CCG – Yes, annual from 2014/15 till 2018/19 via CCG Com template. Area Team – No.
FURTHER INFORMATION
For information on how this measure forms part of the 5 year plans see ‘Setting 5-year Ambitions for improving outcomes A how-to guide for commissioners’.
E.A.8: Hospital deaths attributable to problems in care
DEFINITIONS
Detailed Descriptor:
Indicator in development, this should be available for measuring a national ambition in Autumn 2015 and local ambitions in 2016/17.
PLANNING REQUIREMENTS
Are plans required and if so, at what frequency?
CCG – No. Area Team – No.
FURTHER INFORMATION
For information on how this measure forms part of the 5 year plans see ‘Setting 5-year Ambitions for improving outcomes: A how-to guide for commissioners’.

Everyone Counts: Planning for Patients 2014/15 - 2018/19: Technical Definitions for Clinical
Commissioning Groups and Area Teams
17
E.A.9: Improving the reporting of medication-related safety incidents
DEFINITIONS
Detailed Descriptor:
A patient safety incident (PSI) is any unintended or unexpected incident(s) that could have, or did, lead to harm for one or more person(s) receiving NHS funded healthcare. Medication incidents are PSIs which actually caused harm or had the potential to cause harm involving an error in the process of prescribing, dispensing, preparing, administering, monitoring or providing medicines advice. Reporting is via the National Reporting and Learning System. Further details can be found at; http://www.nrls.npsa.nhs.uk/patient-safety-data/organisation-patient-safety-incident-reports/ Over 90 per cent of incidents reported to the NRLS are associated with no harm or low harm. A local provider, except for where the local improvement measure is in terms of improved reporting of medication-related safety incidents from primary care, is a provider that represented 10% of more of the CCG’s total activity for Q1 and Q2 of 2013/14.
ACCOUNTABILITY
What Success Looks Like, Direction, Milestones:
Increased reporting of medication errors
Timeframe/Baseline:
Ongoing
Rationale:
Research shows that organisations which regularly report more patient safety incidents usually have a stronger learning culture where patient safety is a high priority. By improving reporting in the short term, the NHS can build the foundations for driving improvement in the safety of care received by patients. At a system level, through high reporting, the whole of the NHS can learn from the experiences of individual organisations.
PLANNING REQUIREMENTS
Are plans required and if so, at what frequency?
CCG – Yes, self-certification for 2014/15 against nationally set objective via 2014/15 CCG Com template. Area Team – No.
FURTHER INFORMATION
For information about how this measure will be used in the Quality Premium, see the

Everyone Counts: Planning for Patients 2014/15 - 2018/19: Technical Definitions for Clinical
Commissioning Groups and Area Teams
18
Quality Premium guidance.

Everyone Counts: Planning for Patients 2014/15 - 2018/19: Technical Definitions for Clinical
Commissioning Groups and Area Teams
19
Everyone Counts - Annex A Supporting Measures
E.A.S.1: Estimated diagnosis rate for people with dementia
DEFINITIONS
Detailed Descriptor:
Diagnosis rate for people with dementia, expressed as a percentage of the estimated prevalence.
Lines Within Indicator (Units):
Numerator: Numbers of people diagnosed with dementia. Denominator: Prevalence of dementia
Data Definition:
Numerator: Numbers of people diagnosed – The number of people on the dementia register for England in the Quality and Outcomes Framework (QOF). This figure is published by the Health and Social Care Information Centre as the QOF DEM1 indicator. Denominator: Prevalence – Dementia prevalence rates published in Dementia UK report (2007), adjusted for general practice register patient numbers, and numbers of general practice patients in care homes (Adjusted National Dementia Prevalence, NHS England Dementia Prevalence Calculator v3, 2013). Indicator format: Percentage
MONITORING
Monitoring Frequency:
Annual Last publication in October based on previous financial year end.
Monitoring Data Source:
Quality and Outcomes Framework Health and Social Care Information Centre Dementia UK report 2007 Office for National Statistics Population Statistics

Everyone Counts: Planning for Patients 2014/15 - 2018/19: Technical Definitions for Clinical
Commissioning Groups and Area Teams
20
ACCOUNTABILITY
What success looks like, Direction, Milestones:
Improving the ability of people living with dementia to cope with symptoms, and access, treatment, care and support. The planning guidance states that an increase in the dementia diagnosis rate to 67 percent should be achieved by march 2015.
Timeframe/Baseline:
Ongoing
Rationale:
A timely diagnosis enables people living with dementia, and their carers/families to access treatment, care and support, and to plan in advance in order to cope with the impact of the disease. A timely diagnosis enables primary and secondary health and care services to anticipate needs, and with people living with dementia, plan and deliver personalised care plans and integrated services, thereby improving outcomes.
PLANNING REQUIREMENTS
Are plans required and if so, at what frequency?
CCG - Yes, annual plans for 2014/15 and 2015/16. Area Team – No.
FURTHER INFORMATION
This is similar to indicator 2.6.i in the NHS Outcomes Framework 2013/14. It was published by the Health and Social Care Information Centre in September 2012 as a provisional indicator.
Data and further information about this indicator are published in the NHS Outcomes Framework section of the HSCIC indicators portal To view the Dementia Prevalence Calculator (v3) go to www.primarycare.nhs.uk. To access tools and resources for using the Dementia Prevalence Calculator and improving dementia diagnosis and diagnosis pathways, go to www.dementiapartnerships.com/diagnosis.

Everyone Counts: Planning for Patients 2014/15 - 2018/19: Technical Definitions for Clinical
Commissioning Groups and Area Teams
21
E.A.S.2: IAPT Recovery Rate
DEFINITIONS
Detailed Descriptor::
The primary purpose of this indicator is to measure improved access to psychological services (IAPT) for people with depression and/or anxiety disorders. This is done using two indicators (the other indicator being E.A.3). E.A.S.2 measures the proportion of people who complete treatment who are moving to recovery.
Lines Within Indicator (Units):
The number of people who are moving to recovery . Numerator: The number of people who have completed treatment having attended at least two treatment contacts and are moving to recovery (those who at initial assessment achieved "caseness” and at final session did not). Denominator: (The number of people who have completed treatment within the reporting quarter, having attended at least two treatment contacts) minus (The number of people who have completed treatment not at clinical caseness at initial assessment).
Data Definition:
Relevant IAPT data items and the permissible values for each data item are defined in the IAPT Data Standard. Psychological therapy: NICE recommended treatment from a qualified psychological therapist (low or high intensity). Definition of a ‘case’: A patient suffering from depression and/or anxiety disorders, as determined by scores on the Patient Health Questionnaire (PHQ 9) for depression and/or the Patient Health Questionnaire (GAD7) for anxiety disorders, or other anxiety disorder specific measure as appropriate for the patient’s diagnosis. Completed treatment: This is a count of all those who have left treatment within the reporting quarter having attended at least two treatment contacts, for any reason including: planned completion; deceased; dropped out (unscheduled discontinuation); referred to another service or unknown.
MONITORING
Monitoring Frequency:
Quarterly
Monitoring Data Source:
IAPT Minimum Data Set, HSCIC

Everyone Counts: Planning for Patients 2014/15 - 2018/19: Technical Definitions for Clinical
Commissioning Groups and Area Teams
22
ACCOUNTABILITY
What success looks like, Direction, Milestones:
Progress will be measured by looking at the increase in the proportion of people with anxiety disorders and depression, who access evidence-based psychological therapies. Additionally, it is essential to measure the recovery rate of those who receive treatment. NHS England will expect for the recovery rate to reach 50%.
Timeframe/Baseline:
Ongoing, to 2014/15
Rationale:
This indicator focuses on improved access to psychological therapies, in order to address the enduring unmet need. Around one in six adults in England suffer from a common mental health problem, such as depression or an anxiety disorder. Collecting this indicator will demonstrate the extent to which this need is being met.
PLANNING REQUIREMENTS
Are plans required and if so, at what frequency?
CCG – Yes, annual for 2014/15 and 2015/16 via CCG Com template. Area Team – No.
FURTHER INFORMATION
The IAPT Data Handbook which explains the function of effective data collection and reporting in IAPT is available from http://www.iapt.nhs.uk/services/measuring-outcomes. Detailed guidance on use of the IAPT data set including the technical specification and the central return process can be found at http://www.hscic.gov.uk/iapt.

Everyone Counts: Planning for Patients 2014/15 - 2018/19: Technical Definitions for Clinical
Commissioning Groups and Area Teams
23
E.A.S.3: Proportion of older people (65 and over) who were still at home 91 days after discharge from hospital into reablement/rehabilitation services
DEFINITIONS
Please see: HSCIC indicators portal
- NHS Outcomes Framework - Domain 3 – Helping people to recover from episodes of ill health or
following injury - Improvement Areas - Helping older people recover their independence after illness or injury - 3.6.i Proportion of older people (65 and over) who were still at home 91
days after discharge from hospital into reablement/rehabilitation services
PLANNING REQUIREMENTS
Are plans required and if so, at what frequency?
CCG – No. Area Team – No.
FURTHER INFORMATION
This definition is consistent with that given in the Better Care Fund. For information on how this measure forms part of the 5 year plans see ‘Setting 5-year Ambitions for improving outcomes A how-to guide for commissioners’.

Everyone Counts: Planning for Patients 2014/15 - 2018/19: Technical Definitions for Clinical
Commissioning Groups and Area Teams
24
E.A.S.4: Healthcare acquired infection (HCAI) measure (MRSA)
DEFINITIONS
Please see: HSCIC indicators portal
- NHS Outcomes Framework - Domain 5 – Treating and Caring for People in a Safe Environment and
Protecting Them From Avoidable Harm - Improvement Areas - Reducing the incidence of avoidable harm - 5.2 i. Incidence of healthcare-associated infection - MRSA
PLANNING REQUIREMENTS
Are plans required and if so, at what frequency?
CCG – Yes, self-certification against nationally set objective of number of cases for 2014/15 and 2015/16 via CCG Com template. Area Team – No.
E.A.S.5: Healthcare acquired infection (HCAI) measure (clostridium difficile infections)
DEFINITIONS
Please see: HSCIC indicators portal
- NHS Outcomes Framework - Domain 5 – Treating and Caring for People in a Safe Environment and
Protecting Them From Avoidable Harm - Improvement Areas - Reducing the incidence of avoidable harm - 5.2 ii. Incidence of healthcare-associated infection –C.Difficile
PLANNING REQUIREMENTS
Are plans required and if so, at what frequency?
CCG – Yes, monthly for 2014/15 via CCG Com template. Area Team – No.
FURTHER INFORMATION
Further work is ongoing to define the C difficile objectives for 14/15 - NHS England are introducing a revised approach to setting C difficile objectives that requires continued improvement but recognises the great strides that have been made over recent years.

Everyone Counts: Planning for Patients 2014/15 - 2018/19: Technical Definitions for Clinical
Commissioning Groups and Area Teams
25
Everyone Counts - Annex B Measures
E.B.1-3: Referral to Treatment pathways
DEFINITIONS
Detailed Descriptor:
The percentage of Referral to Treatment (RTT) pathways within 18 weeks for completed admitted pathways, completed non-admitted pathways and incomplete pathways.
Lines Within Indicator (Units):
E.B.1: The percentage of admitted pathways within 18 weeks for admitted patients whose clocks stopped during the period on an adjusted basis. E.B.2: The percentage of non-admitted pathways within 18 weeks for non-admitted patients whose clocks stopped during the period. E.B.3: The percentage of incomplete pathways within 18 weeks for patients on incomplete pathways at the end of the period.
Data Definition:
A calculation of the percentage within 18 weeks for completed admitted RTT pathways, completed non-admitted RTT pathways and incomplete RTT pathways based on referral to treatment data provided by NHS and independent sector organisations and signed off by NHS commissioners. The definitions that apply for RTT waiting times are set out in the RTT Clock Rules. Suite found here: https://www.gov.uk/government/publications/right-to-start-consultant-led-treatment-within-18-weeks.
MONITORING
Monitoring Frequency:
Monthly
Monitoring Data Source:
Consultant-led RTT Waiting Times data collection (National Statistics)
ACCOUNTABILITY
What success looks like, Direction, Milestones:
Performance will be judged against the following waiting time standards:-
Admitted operational standard of 90% – the percentage of admitted pathways (on an adjusted basis) within 18 weeks should equal or exceed 90%
Non-admitted operational standard of 95% – the percentage of non-admitted pathways within 18 weeks should equal or exceed 95%
Incomplete operational standard of 92% – the percentage of incomplete pathways within 18 weeks should equal or exceed 92%
Timeframe/Baseline:

Everyone Counts: Planning for Patients 2014/15 - 2018/19: Technical Definitions for Clinical
Commissioning Groups and Area Teams
26
Ongoing
Rationale:
The operational standards of 90 per cent for admitted and 95 per cent for non-admitted completed waits as set out in the standing rules. In order to sustain the delivery of these standards, trusts also need to ensure that a minimum of 92 per cent of patients on an incomplete pathway should have been waiting no more than 18 weeks. These RTT waiting time standards leave an operational tolerance to allow for patients who wait longer than 18 weeks to start their treatment because of choice or clinical exception. These circumstances can be categorised as:
Patient choice - patients choose not to accept earliest offered reasonable appointments along their pathway or choose to delay treatments for personal or social reasons
Co-operation - patients who do not attend appointments that they have agreed along their pathways
Clinical exceptions - where it is not clinically appropriate to start a patient's treatment within 18 weeks
PLANNING REQUIREMENTS
Are plans required and if so, at what frequency?
CCG – No. Area Team – No.

Everyone Counts: Planning for Patients 2014/15 - 2018/19: Technical Definitions for Clinical
Commissioning Groups and Area Teams
27
E.B.4: Diagnostic test waiting times
DEFINITIONS
Detailed Descriptor:
The percentage of patients waiting 6 weeks or more for a diagnostic test.
Lines Within Indicator (Units):
The percentage of patients waiting 6 weeks or more for a diagnostic test (15 key diagnostic tests) at the end of the period.
Data Definition:
The number of patients waiting 6 weeks or more for a diagnostic test (15 key tests) based on monthly diagnostics data provided by NHS and independent sector organisations and signed off by NHS commissioners as a percentage of the total number of patients waiting at the end of the period. The definitions that apply for diagnostics are set out in the guidance here: http://www.england.nhs.uk/statistics/statistical-work-areas/diagnostics-waiting-times-and-activity/monthly-diagnostics-waiting-times-and-activity/.
MONITORING
Monitoring Frequency:
Monthly
Monitoring Data Source:
Monthly diagnostics data collection - DM01
ACCOUNTABILITY
What Success Looks Like, Direction, Milestones:
Performance will be judged against the following standard: Diagnostic operational standard of less than 1% – the percentage of patients waiting 6 weeks or more for a diagnostic test should be less than 1%.
Timeframe/Baseline:
Ongoing
Rationale:
Prompt access to diagnostic tests is a key supporting measure to the delivery of the NHS Constitution referral to treatment (RTT) maximum waiting time standards. Early diagnosis is also important for patients and central to improving outcomes, e.g. early diagnosis of cancer improves survival rates.

Everyone Counts: Planning for Patients 2014/15 - 2018/19: Technical Definitions for Clinical
Commissioning Groups and Area Teams
28
PLANNING REQUIREMENTS
Are plans required and if so, at what frequency?
CCG – No. Area Team – No.

Everyone Counts: Planning for Patients 2014/15 - 2018/19: Technical Definitions for Clinical
Commissioning Groups and Area Teams
29
E.B.5: A&E waiting time - total time in the A&E department
DEFINITIONS
Detailed Descriptor:
Percentage of patients who spent 4 hours or less in A&E.
Lines Within Indicator (Units):
1. Total number of A&E attendances. 2. Number of A&E attendances where the patient spent 4 hours or less in A&E from arrival to transfer, admission or discharge. 3. Percentage of A&E attendances where the patient spent 4 hours or less in A&E from arrival to transfer, admission or discharge.
Data Definition:
Full definitions can be found in weekly sitrep guidance notes at the following address http://www.england.nhs.uk/statistics/statistical-work-areas/ae-waiting-times-and-activity/ A&E, means a Type 1, Type 2 or Type 3 A&E department. Types of A&E/Minor Injury Unit (MIU) service are: Type 1 A&E department: A consultant led 24 hour service with full resuscitation facilities and designated accommodation for the reception of accident and emergency patients Type 2 A&E department: A consultant led single specialty accident and emergency service (e.g. ophthalmology, dental) with designated accommodation for the reception of patients Type 3 A&E department: Other type of A&E/minor injury units (MIUs)/Walk-in Centres, primarily designed for the receiving of accident and emergency patients. A type 3 department may be doctor led or nurse led. It may be co-located with a major A&E or sited in the community. A defining characteristic of a service qualifying as a type 3 department is that it treats at least minor injuries and illnesses (sprains for example) and can be routinely accessed without appointment. An appointment based service (for example an outpatient clinic) or one mainly or entirely accessed via telephone or other referral (for example most out of hours services), or a dedicated primary care service (such as GP practice or GP-led health centre) is not a type 3 A&E service even though it may treat a number of patients with minor illness or injury.
MONITORING
Monitoring Frequency:
Weekly
Monitoring Data Source:
Weekly sitrep data (WSitAE).

Everyone Counts: Planning for Patients 2014/15 - 2018/19: Technical Definitions for Clinical
Commissioning Groups and Area Teams
30
ACCOUNTABILITY
What success looks like, Direction, Milestones:
Standard is 95% of patients seen within 4 hours
Timeframe/Baseline:
Ongoing
Rationale:
Longer lengths of stay in the emergency department are associated with poorer health outcomes and patient experience as well as transport delays, treatment delays, ambulance diversion, patients leaving without being seen, and financial effects. It is critical that patients receive the care they need in a timely fashion, so that patients who require admission are placed in a bed as soon as possible, patients who need to be transferred to other healthcare providers receive transport with minimal delays, and patients who are fit to go home are discharged safely and rapidly. There is professional agreement that some patients need prolonged times in A&E. However, these exceptions are rare and unlikely to account for more than 5% of attendances. International literature suggests increases in adverse outcomes for patients who have been in A&E for more than 4-6 hours. Excessive total time in A&E is linked to poor outcomes and patient delays should be minimised (but care should not be hurried or rushed). Changes in the practice of emergency medicine in some departments also means that more is being done for patients in A&E, which may take longer but is for the benefit of the patient.
PLANNING REQUIREMENTS
Are plans required and if so, at what frequency?
CCG – No. Area Team – No.

Everyone Counts: Planning for Patients 2014/15 - 2018/19: Technical Definitions for Clinical
Commissioning Groups and Area Teams
31
E.B.6-7: Cancer 2 week waits
DEFINITIONS
Detailed Descriptor:
Two week wait (urgent referral) services (including cancer) Percentage of patients seen within two weeks of an urgent GP referral for suspected cancer (E.B.6) and percentage of patients seen within two weeks of an urgent referral for breast symptoms where cancer was not initially suspected (E.B.7).
Lines Within Indicator (Units):
E.B.6: All cancer two week wait Denominator: All patients urgently referred with suspected cancer by their GP (GMP or GDP) who were
first seen within a period.
Numerator: Patients urgently referred with suspected cancer by their GP (GMP or GDP) who were first seen within 14 calendar days within a period.
E.B.7: Two week wait for breast symptoms (where cancer was not initially suspected)
Denominator: All patients urgently referred for evaluation/investigation of “breast symptoms” by a primary or secondary care professional within a period, excluding those referred urgently for suspected breast cancer who were first seen within the period.
Numerator: Patients urgently referred for evaluation/investigation of “breast symptoms” by a primary or secondary care professional during a period (excluding those referred urgently for suspected breast cancer) who were first seen within 14 calendar days during the period.
All referrals to a breast clinical team, excluding those for suspected cancer, and those to family history clinics should be included within the dataset supplied for E.B.7
Data Definition:
Numerator and denominator details are defined above. All data are to be returned to the Cancer Waiting Times Database (CWT-Db) as per the definitions and mandates for the National Cancer Waiting Times Monitoring Dataset (NCWTMDS) specified to the NHS in Amd 23/2011. A copy of this documentation is available at: http://www.isb.nhs.uk/documents/isb-0147/amd-23-2011/index_html An interactive copy of the NCWTMDS definitions, including the changes specified in Amd 23/2011, is available in the NHS Data Dictionary at: http://www.datadictionary.nhs.uk/data_dictionary/messages/clinical_data_sets/data_sets/national_cancer_waiting_times_monitoring_data_set_fr.asp?shownav=1

Everyone Counts: Planning for Patients 2014/15 - 2018/19: Technical Definitions for Clinical
Commissioning Groups and Area Teams
32
MONITORING
Monitoring Frequency:
Monthly and Quarterly
Monitoring Data Source:
Data are sourced from the CWT-Db on a monthly and quarterly basis.
ACCOUNTABILITY
What success looks like, Direction, Milestones:
E.B.6: All cancer two week wait Performance is to be sustained at or above the published operational standard. E.B.7: Two week wait for breasts symptoms (where cancer was not initially suspected). Performance is to be sustained at or above the published operational standard. Details of current operational standards are given in the ‘Everyone Counts: Planning for Patients 2014/15 – 2018/19’ guidance.
Timeframe/Baseline:
Ongoing
Rationale:
These two week wait services are a vital component of the patient pathway, they ensure fast access to diagnostic tests, supporting the provision of an earlier diagnosis and therefore assist in improving survival rates for cancer. It remains important for patients with cancer or its symptoms, to be seen by the right person, with appropriate expertise, within two weeks to ensure that they receive the best possible survival probability and a lower level of anxiety than if they were waiting for a routine appointment. This indicator also relates to a patient’s right to be seen in two weeks as expressed in the NHS Constitution. Details of this are available at: http://www.nhs.uk/choiceintheNHS/Rightsandpledges/NHSConstitution/Documents/2013/handbook-to-the-nhs-constitution.pdf.
PLANNING REQUIREMENTS
Are plans required and if so, at what frequency?
CCG – No. Area Team – No.

Everyone Counts: Planning for Patients 2014/15 - 2018/19: Technical Definitions for Clinical
Commissioning Groups and Area Teams
33
E.B.8-11: Cancer day 31 waits
DEFINITIONS
Detailed Descriptor:
Cancer 31 day waits- Percentage of patients receiving first definitive treatment within one month (31-days) of a cancer diagnosis (measured from ‘date of decision to treat’) (E.B.8). Percentage of patients receiving subsequent treatment for cancer within 31-days, where that treatment is a Surgery (E.B.9), an Anti-Cancer Drug Regimen (E.B.10) or a Radiotherapy Treatment Course (E.B.11).
Lines Within Indicator (Units):
E.B.8: Percentage of patients receiving first definitive treatment within one month of a cancer diagnosis (measured from ‘date of decision to treat’)
Denominator: Total number of patients receiving first definitive treatment for cancer within a given period for all cancers (ICD-10 C00 to C97 and D05). Numerator: Number of patients receiving first definitive treatment for cancer within 31 days of receiving a diagnosis (decision to treat) within a given period for all cancers (ICD-10 C00 to C97 and D05). E.B.9: 31-day standard for subsequent cancer treatments-surgery Denominator: Total number of patients receiving subsequent surgery within a given period, including patients with recurrent cancer. Numerator: Number of patients receiving subsequent surgery within a maximum waiting time of 31-days during a given period, including patients with recurrent cancer. Scope: Those treatments classified as “Surgery” within the National Cancer Waiting Times Monitoring Dataset (NCWTMDS). E.B.10: 31-day standard for subsequent cancer treatments-anti cancer drug regimens Denominator: Total number of patients receiving a subsequent/adjuvant anti-cancer drug regimen within a given period, including patients with recurrent cancer. Numerator: Number of patients receiving a subsequent/adjuvant anti-cancer drug regimen within a maximum waiting time of 31-days during a given period, including patients with recurrent cancer. Scope: Using the definitions published in the NCWTMDS “Anti-Cancer Drug Regimens” might include: Cytotoxic Chemotherapy, Immunotherapy, Hormone Therapy and other and unspecified drug treatments.

Everyone Counts: Planning for Patients 2014/15 - 2018/19: Technical Definitions for Clinical
Commissioning Groups and Area Teams
34
E.B.11: 31-day standard for subsequent cancer treatments-radiotherapy Denominator: Total number of patients receiving subsequent/adjuvant radiotherapy treatment within a given period, including patients with recurrent cancer. Numerator: Number of patients receiving subsequent/adjuvant radiotherapy treatment within a maximum waiting time of 31-days during a given period, including patients with recurrent cancer. Scope: Using the definitions published in the NCWTMDS “Radiotherapy Treatments” might include: Teletherapy (beam radiation), Brachytherapy, Chemoradiotherapy and Proton Therapy.
Data Definition:
Numerator and denominator details are defined above. All data are to be returned to the Cancer Waiting Times Database (CWT-Db) as per the definitions and mandates for the National Cancer Waiting Times Monitoring Dataset (NCWTMDS) specified to the NHS in Amd 23/2011. A copy of this documentation is available at: http://www.isb.nhs.uk/documents/isb-0147/amd-23-2011/index_html. An interactive copy of the NCWTMDS definitions, including the changes specified in Amd 23/2011, is available in the NHS Data Dictionary at: http://www.datadictionary.nhs.uk/data_dictionary/messages/clinical_data_sets/data_sets/national_cancer_waiting_times_monitoring_data_set_fr.asp?shownav=1.
MONITORING
Monitoring Frequency:
Monthly and Quarterly
Monitoring Data Source:
Data are sourced from the CWT-Db on a monthly and quarterly basis.
ACCOUNTABILITY
What success looks like, Direction, Milestones:
Performance is to be sustained at or above the published operational standard. Details of current operational standards are given in the ‘Everyone Counts: Planning for Patients 2014/15 – 2018/19’ guidance.
Timeframe/Baseline:
Ongoing
Rationale:
Maintaining these standards will ensure that cancer patients receive all treatments within their package of care within clinically appropriate timeframes, thus providing a better patient-centred care and improve cancer outcomes.

Everyone Counts: Planning for Patients 2014/15 - 2018/19: Technical Definitions for Clinical
Commissioning Groups and Area Teams
35
PLANNING REQUIREMENTS
Are plans required and if so, at what frequency?
CCG – No. Area Team – No.

Everyone Counts: Planning for Patients 2014/15 - 2018/19: Technical Definitions for Clinical
Commissioning Groups and Area Teams
36
E.B.12-14: Cancer 62 day waits
DEFINITIONS
Detailed Descriptor:
E.B.12: Percentage of patients receiving first definitive treatment for cancer within two months (62 days) of an urgent GP referral for suspected cancer.
E.B.13: Percentage of patients receiving first definitive treatment for cancer within 62-
days of referral from an NHS Cancer Screening Service. E.B.14: Percentage of patients receiving first definitive treatment for cancer within 62-
days of a consultant decision to upgrade their priority status.
Lines Within Indicator (Units):
E.B.12: All cancer two month urgent referral to first treatment wait
Denominator: Total number of patients receiving first definitive treatment for cancer following an urgent GP (GDP or GMP) referral for suspected cancer within a given period, for all cancers (ICD-10 C00 to C97 and D05).
Numerator: Number of patients receiving first definitive treatment for cancer within 62-days following an urgent GP (GDP or GMP) referral for suspected cancer within a given period, for all cancers (ICD-10 C00 to C97 and D05).
E.B.13: 62-day wait for first treatment following referral from an NHS cancer screening service
Denominator: Total number of patients receiving first definitive treatment for cancer following referral
from an NHS Cancer Screening Service within a given period (covers any cancer ICD-10 C00 to C97 and D05).
Numerator: Number of patients receiving first definitive treatment for cancer within 62-days following referral from an NHS Cancer Screening Service during a given period (covers any cancer ICD-10 C00 to C97 and D05).
E.B.14: 62-Day wait for first treatment For cancer following a consultants decision to upgrade the patient’s priority
Denominator: Total number of patients receiving first definitive treatment for cancer following a
consultant decision to upgrade their priority status within a given period.
Numerator: Number of patients receiving first definitive treatment for cancer within 62-days of a consultant decision to upgrade their priority status.
Scope: Patients included in this indicator will not have been referred urgently for suspected cancer by their GP or referred with suspected cancer from an NHS Cancer Screening Service with suspected cancer (routine referrals from these services where cancer was not initially suspected may be upgraded).

Everyone Counts: Planning for Patients 2014/15 - 2018/19: Technical Definitions for Clinical
Commissioning Groups and Area Teams
37
Data Definition:
Numerator and denominator details are defined above. All data are to be returned to the Cancer Waiting Times Database (CWT-Db) as per the definitions and mandates for the National Cancer Waiting Times Monitoring Dataset (NCWTMDS) specified to the NHS in Amd 23/2011. A copy of this documentation is available at: http://www.isb.nhs.uk/documents/isb-0147/amd-23-2011/index_html. An interactive copy of the NCWTMDS definitions, including the changes specified in Amd 23/2011, is available in the NHS Data Dictionary at: http://www.datadictionary.nhs.uk/data_dictionary/messages/clinical_data_sets/data_sets/national_cancer_waiting_times_monitoring_data_set_fr.asp?shownav=1.
MONITORING
Monitoring Frequency:
Monthly and Quarterly
Monitoring Data Source:
Data are sourced from the CWT-Db on a monthly and quarterly basis.
ACCOUNTABILITY
What success looks like, Direction, Milestones:
E.B.12-13: Performance is to be sustained at or above the published operational standard Details of current operational standards are given in the ‘Everyone Counts: Planning for Patients 2014/15 – 2018/19’ guidance. E.B.14: There is no current operational standard for this component, therefore this will not be centrally assessed against a set threshold. These performance data will however be monitored and published as national statistics.
Timeframe/Baseline:
Ongoing
Rationale:
Maintaining these standards will ensure that a cancer patient will receive timely access to treatment and move along their pathway of care at a clinically appropriate pace, thus providing better patient-centred care and improve cancer outcomes.
PLANNING REQUIREMENTS
Are plans required and if so, at what frequency?
CCG – No. Area Team – No.

Everyone Counts: Planning for Patients 2014/15 - 2018/19: Technical Definitions for Clinical
Commissioning Groups and Area Teams
38
E.B.15.i: Ambulance clinical quality – Category A (Red 1) 8 minute response time
DEFINITIONS
Detailed Descriptor:
Improved health outcomes from ensuring a defibrillator and timely response to immediately life-threatening ambulance calls.
Lines Within Indicator (Units):
Numerator: The total number of Category A Red 1 incidents, which resulted in an emergency response arriving at the scene of the incident within 8 minutes. Denominator: The total number of Category A Red 1 incidents, which resulted in an emergency response arriving at the scene.
Data Definition:
Numerator: The total number of Category A Red 1 incidents, which resulted in an emergency response arriving at the scene of the incident within 8 minutes. A response within eight minutes means eight minutes zero seconds or less. Denominator: The total number of Category A Red 1 incidents, which resulted in an emergency response arriving at the scene. If there have been multiple calls to a single incident, only one incident should be recorded. Category A Red 1 incidents: presenting conditions that may be immediately life threatening and the most time critical and should receive an emergency response within 8 minutes irrespective of location in 75% of cases. For Category A Red 1 calls, “the clock starts” when the call is presented to the control room telephone switch. The "clock stops" when the first ambulance service-dispatched emergency responder arrives at the scene of the incident. A legitimate clock stop position can include the responder arriving at a pre-arrival rendezvous point when one has been determined as appropriate for the safety of ambulance staff in agreement with the control room.
MONITORING
Monitoring Frequency:
Monthly
Monitoring Data Source:
Ambulance Computer Aided Dispatch system Monthly data collected via Unify2
ACCOUNTABILITY
What success looks like, Direction, Milestones:
Faster response times improve health outcomes and experience for patients with immediately life-threatening conditions.

Everyone Counts: Planning for Patients 2014/15 - 2018/19: Technical Definitions for Clinical
Commissioning Groups and Area Teams
39
Category A Red 1 incidents: Presenting conditions that may be immediately life threatening and the most time critical and should receive an emergency response within 8 minutes irrespective of location in 75% of cases.
Timeframe/Baseline:
Ongoing
Rationale:
Faster response times improve health outcomes and experience for patients with immediately life-threatening conditions. Ambulance services should aim for continuous improvement on these indicators and monitor as long a time series as possible (24 continuous months is preferable). In addition to comparing current performance with performance in the immediately preceding periods, services may also find it helpful to compare current performance against a baseline of activity in the same period in the previous year. This will allow services to place current performance in context, and stimulate discussion on how to continuously improve. When comparing current performance with historical performance care should be taken to assess how much of the observed change in activity or performance is affected by changes in the coverage and quality of the data.
PLANNING REQUIREMENTS
Are plans required and if so, at what frequency?
CCG – No. Area Team – No.

Everyone Counts: Planning for Patients 2014/15 - 2018/19: Technical Definitions for Clinical
Commissioning Groups and Area Teams
40
E.B.15.ii: Ambulance clinical quality – Category A (Red 2) 8 minute response time
DEFINITIONS
Detailed Descriptor:
Improved health outcomes from ensuring a defibrillator and timely response to immediately life-threatening ambulance calls.
Lines Within Indicator (Units):
Numerator: The total number of Category A Red 2 incidents, which resulted in an emergency response arriving at the scene of the incident within 8 minutes. Denominator: The total number of Category A Red 2 incidents, which resulted in an emergency response arriving at the scene.
Data Definition:
Numerator: The total number of Category A Red 2 incidents, which resulted in an emergency response arriving at the scene of the incident within 8 minutes. A response within eight minutes means eight minutes zero seconds or less. Denominator: The total number of Category A Red 2 incidents, which resulted in an emergency response arriving at the scene. If there have been multiple calls to a single incident, only one incident should be recorded. Category A Red 2 incidents: Presenting conditions which may be life threatening but less time critical than Red 1 and should receive an emergency response within 8 minutes irrespective of location in 75% of cases. For Category A Red 2 calls, “the clock starts” from the earliest of the chief complaint information being obtained, a vehicle being assigned or 60 seconds after the time at which the call is presented to the control room telephone switch. The "clock stops" when the first ambulance service-dispatched emergency responder arrives at the scene of the incident. A legitimate clock stop position can include the responder arriving at a pre-arrival rendezvous point when one has been determined as appropriate for the safety of ambulance staff in agreement with the control room.
MONITORING
Monitoring Frequency:
Monthly
Monitoring Data Source:
Ambulance Computer Aided Dispatch system Monthly data collected via Unify2

Everyone Counts: Planning for Patients 2014/15 - 2018/19: Technical Definitions for Clinical
Commissioning Groups and Area Teams
41
ACCOUNTABILITY
What Success Looks Like, Direction, Milestones:
Faster response times improve health outcomes and experience for patients with immediately life-threatening conditions. Category A Red 2 incidents: presenting conditions that may be life threatening but less time critical than Red 1 and should receive an emergency response within 8 minutes irrespective of location in 75% of cases.
Timeframe/Baseline:
Ongoing
Rationale:
Faster response times improve health outcomes and experience for patients with immediately life-threatening conditions. Ambulance services should aim for continuous improvement on these indicators and monitor as long a time series as possible (24 continuous months is preferable). In addition to comparing current performance with performance in the immediately preceding periods, services may also find it helpful to compare current performance against a baseline of activity in the same period in the previous year. This will allow services to place current performance in context, and stimulate discussion on how to continuously improve. When comparing current performance with historical performance care should be taken to assess how much of the observed change in activity or performance is affected by changes in the coverage and quality of the data.
PLANNING REQUIREMENTS
Are plans required and if so, at what frequency?
CCG – No. Area Team – No.
Everyone Counts: Planning for Patients 2014/15 - 2018/19: Technical Definitions for Clinical
Commissioning Groups and Area Teams
42
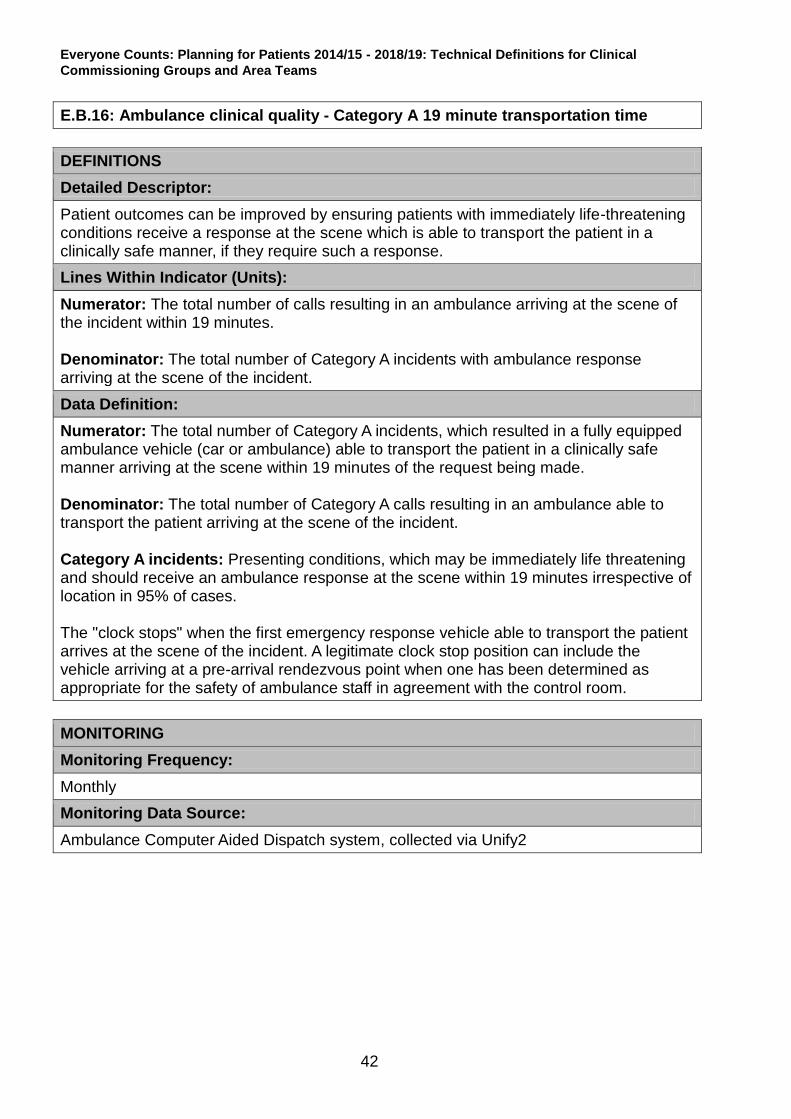
E.B.16: Ambulance clinical quality - Category A 19 minute transportation time
DEFINITIONS
Detailed Descriptor:
Patient outcomes can be improved by ensuring patients with immediately life-threatening conditions receive a response at the scene which is able to transport the patient in a clinically safe manner, if they require such a response.
Lines Within Indicator (Units):
Numerator: The total number of calls resulting in an ambulance arriving at the scene of the incident within 19 minutes. Denominator: The total number of Category A incidents with ambulance response arriving at the scene of the incident.
Data Definition:
Numerator: The total number of Category A incidents, which resulted in a fully equipped ambulance vehicle (car or ambulance) able to transport the patient in a clinically safe manner arriving at the scene within 19 minutes of the request being made. Denominator: The total number of Category A calls resulting in an ambulance able to transport the patient arriving at the scene of the incident. Category A incidents: Presenting conditions, which may be immediately life threatening and should receive an ambulance response at the scene within 19 minutes irrespective of location in 95% of cases. The "clock stops" when the first emergency response vehicle able to transport the patient arrives at the scene of the incident. A legitimate clock stop position can include the vehicle arriving at a pre-arrival rendezvous point when one has been determined as appropriate for the safety of ambulance staff in agreement with the control room.
MONITORING
Monitoring Frequency:
Monthly
Monitoring Data Source:
Ambulance Computer Aided Dispatch system, collected via Unify2

Everyone Counts: Planning for Patients 2014/15 - 2018/19: Technical Definitions for Clinical
Commissioning Groups and Area Teams
43
ACCOUNTABILITY
What success looks like, Direction, Milestones:
Faster response times improve health outcomes and experience for patients with immediately life-threatening conditions. Category A incidents: Presenting conditions, which may be immediately life threatening and should receive an ambulance response at the scene within 19 minutes irrespective of location in 95% of cases.
Timeframe/Baseline:
Ongoing
Rationale:
Patient outcomes can be improved by ensuring patients with immediately life-threatening conditions receive a response at the scene which is able to transport the patient in a clinically safe manner, if they require such a response. Ambulance services should aim for continuous improvement on these indicators and monitor as long a time series as possible (24 continuous months is preferable). In addition to comparing current performance with performance in the immediately preceding periods, services may also find it helpful to compare current performance against a baseline of activity in the same period in the previous year. This will allow services to place current performance in context, and stimulate discussion on how to continuously improve. When comparing current performance with historical performance care should be taken to assess how much of the observed change in activity or performance is affected by changes in the coverage and quality of the data.
PLANNING REQUIREMENTS
Are plans required and if so, at what frequency?
CCG – No. Area Team – No.

Everyone Counts: Planning for Patients 2014/15 - 2018/19: Technical Definitions for Clinical
Commissioning Groups and Area Teams
44
Everyone Counts - Annex B Supporting Measures
E.B.S.1: Mixed Sex Accommodation (MSA) Breaches
DEFINITIONS
Detailed Descriptor:
Patient Experience: Breaches of Same Sex Accommodation. All providers of NHS funded care are expected to eliminate mixed-sex accommodation, except where it is in the overall best interest of the patient, in accordance with the definitions set out in the Professional Letter CNO/2010/3. Since April 2011, all providers of NHS funded care have routinely reported breaches of sleeping accommodation, as set out in national guidance, and hence attract contract sanctions in respect of each patient affected.
Lines Within Indicator (Units):
This data set supports the collection of consistently defined data on breaches of DH guidance on Mixed-Sex Accommodation. (NB: The policy commitment relates to gender, not sex, but to ensure a better public understanding it is referred to as Mixed-Sex Accommodation (MSA)). The focus of the indicator and the associated central reporting, is on MSA breaches in respect of sleeping accommodation only - even though the NHS is required to monitor locally all justified mixing in sleeping accommodation, all mixed-sex sharing of bathroom/toilet facilities (including passing through accommodation or toilet/bathroom facilities used by the opposite gender). Locally, it will also monitor lack of provision of women-only day areas in mental health units. A breach of the policy occurs each time an admitted patient is placed in MSA, outside the terms of the policy. The collection of NHS organisations’ MSA breaches in relation to sleeping accommodation commenced from 1 December 2010, with routine reporting from January 2011. NHS organisations must submit aggregated data to the Unify2 data collection system, detailing the hospital site where the breach occurred and the patient’s commissioning organisation. For performance monitoring of MSA, it will be the MSA breach rate (MSA breaches per 1,000 FCEs [Finished Consultant Episode]), as well as the number of breaches, that will need to be monitored. MSA Breach Rate Indicator Definition: The number of breaches of mixed-sex accommodation (MSA) sleeping accommodation, per 1,000 FCEs. Formula: MSA Breach Rate = Numerator/Denominator x 1,000

Everyone Counts: Planning for Patients 2014/15 - 2018/19: Technical Definitions for Clinical
Commissioning Groups and Area Teams
45
Numerator: The number of MSA breaches for the reporting month in question. Data Source: MSA Unify2 data collection. Denominator: The number of FCEs that finished in the month, regardless of when they started. Data source: Inpatient HES (Hospital Episode Statistics).
Data Definition:
Providers are required to report all breaches of sleeping accommodation* - i.e. for each patient affected, via the Unify2 system. Detailed definition of what constitutes a breach of same sex guidance is provided in Professional Letter CNO/2010/3. * “Sleeping accommodation” includes areas where patients are admitted and cared for on beds or trolleys, even where they do not stay overnight. It therefore includes all admissions and assessment units (including clinical decision units), plus day surgery and endoscopy units. It does not include areas where patients have not been admitted, such as accident and emergency cubicles. An Information Standards Notice (ISN) has been published for the MSA data collection (Ref: ISB 1573). This can be found at: http://www.isb.nhs.uk/library/standard/226. New NHS Data Dictionary standards have been published for the MSA data collection. These can be found at: http://www.isb.nhs.uk/documents/isb-1573/amd-168-2010/cr1207.pdf.
MONITORING
Monitoring Frequency:
Monitoring is based on a monthly data collection. Monthly publications take place on the third Thursday of every month.
Monitoring Data Source:
Unify2 Performance monitoring arrangements.
ACCOUNTABILITY
What success looks like, Direction, Milestones:
All providers of NHS funded care are expected to eliminate mixed-sex accommodation, except where it is in the overall best interest of the patient. Ability to deliver this requirement is the key indicator of success.
Timeframe/Baseline:
Ongoing
Rationale:
Patients have told us that mixed sex accommodation is distressing to patients at a time when they feel at their most vulnerable. The above focus means that organisations will be held to account for managing beds and facilities to eliminate MSA. It also better facilitates commissioners’ application of

Everyone Counts: Planning for Patients 2014/15 - 2018/19: Technical Definitions for Clinical
Commissioning Groups and Area Teams
46
sanctions to NHS organisations that breach the guidance. Publication of the associated breach data means that patients and the public will be better informed about an organisation’s progress in eliminating mixed sex accommodation.
PLANNING REQUIREMENTS
Are plans required and if so, at what frequency?
CCG – No. Area Team – No.

Everyone Counts: Planning for Patients 2014/15 - 2018/19: Technical Definitions for Clinical
Commissioning Groups and Area Teams
47
E.B.S.2: Cancelled Operations
DEFINITIONS
Detailed Descriptor:
All patients who have operations cancelled, on or after the day of admission (including the day of surgery), for non-clinical reasons to be offered another binding date within 28 days, or the patient’s treatment to be funded at the time and hospital of the patient’s choice.
Lines Within Indicator (Units):
Numerator: The number of breaches of the cancelled operations standard in the quarter. A breach should be counted at the point it occurs i.e. if after 28 days of a last minute cancellation the patient has not been treated then the breach should be recorded. The last minute cancellation associated with this breach may have occurred in the same quarter or in a previous quarter. Please note that the 28 day period does not stop at the end of a quarter but is continuous. Denominator: The number of last minute cancellations by the hospital for non clinical reasons in the quarter. Last minute means on the day the patient was due to arrive, after the patient has arrived in hospital or on the day of the operation or surgery.
Data Definition:
Guidance and definitions are available here: http://www.england.nhs.uk/statistics/statistical-work-areas/cancelled-elective-operations/.
MONITORING
Monitoring Frequency:
Quarterly
Monitoring Data Source:
QMCO Quarterly Monitoring Cancelled Operations Unify2 Performance monitoring arrangements.
ACCOUNTABILITY
What success looks like, Direction, Milestones:
Reduction in the number of cancelled operations.
Timeframe/Baseline:
Ongoing
Rationale:
It is not in the patient’s interest to have their operation cancelled.

Everyone Counts: Planning for Patients 2014/15 - 2018/19: Technical Definitions for Clinical
Commissioning Groups and Area Teams
48
PLANNING REQUIREMENTS
Are plans required and if so, at what frequency?
CCG – No. Area Team – No.

Everyone Counts: Planning for Patients 2014/15 - 2018/19: Technical Definitions for Clinical
Commissioning Groups and Area Teams
49
E.B.S.3: Mental Health Measure – Care Programme Approach (CPA)
DEFINITIONS
Detailed Descriptor:
Care Programme Approach (CPA) 7 day follow up. The proportion of those patients on Care Programme Approach (CPA) discharged from inpatient care who are followed up within 7 days.
Lines Within Indicator (Units):
The indicator is the numerator divided by the denominator, expressed as a percentage. Numerator: The number of people under adult mental illness specialties on CPA who were followed up (either by face to face contact or by phone discussion) within 7 days of discharge from psychiatric in-patient care. Denominator: The total number of people under adult mental illness specialties on CPA who were discharged from psychiatric in-patient care. All patients discharged from a psychiatric in-patient ward are regarded as being on CPA.
Data Definition:
All patients discharged to their place of residence, care home, residential accommodation, or to non psychiatric care must be followed up within 7 days of discharge. All avenues need to be exploited to ensure patients are followed up within 7 days of discharge. Where a patient has been transferred to prison, contact should be made via the prison in-reach team. Exemption:
Patients who die within 7 days of discharge may be excluded,
Where legal precedence has forced the removal of a patient from the country,
Patients transferred to NHS psychiatric inpatient ward,
CAMHS (child and adolescent mental health services) are not included. The 7 day period should be measured in days not hours and should start on the day after the discharge.
MONITORING
Monitoring Frequency:
Quarterly
Monitoring Data Source:
Unify2

Everyone Counts: Planning for Patients 2014/15 - 2018/19: Technical Definitions for Clinical
Commissioning Groups and Area Teams
50
ACCOUNTABILITY
What success looks like, Direction, Milestones:
Achieving at least 95% rate of patients followed up after discharge each quarter
Timeframe/Baseline:
Ongoing
Rationale:
Reduction in the overall rate of death by suicide will be supported by arrangement for securing provision by commissioners of appropriate care for all those with mental ill health. To reduce risk and social exclusion and improve care pathways to Patients on CPA discharged from a spell of in-patient care.
PLANNING REQUIREMENTS
Are plans required and if so, at what frequency?
CCG – No. Area Team - No
Everyone Counts: Planning for Patients 2014/15 - 2018/19: Technical Definitions for Clinical
Commissioning Groups and Area Teams
51
DEFINITIONS
Detailed Descriptor:
The number of Referral to Treatment (RTT) pathways greater than 52 weeks for completed admitted pathways (un-adjusted), completed non-admitted pathways and incomplete pathways.
Lines Within Indicator (Units):
1 - The number of admitted pathways greater than 52 weeks for admitted patients whose clocks stopped during the period on an un-adjusted basis. 2 - The number of non-admitted pathways greater than 52 weeks for non-admitted patients whose clocks stopped during the period . 3 - The number of incomplete pathways greater than 52 weeks for patients on incomplete pathways at the end of the period. Note: Contractual fines will apply to line 3 (incomplete pathways), but all three lines will be monitored.
Data Definition:
The definitions that apply for RTT waiting times are set out in the RTT Clock Rules Suite found here: http://www.england.nhs.uk/statistics/statistical-work-areas/rtt-waiting-times/rtt-guidance/.
MONITORING
Monitoring Frequency:
Monthly
Monitoring Data Source:
Consultant-led Referral to Treatment Waiting Times data collection (National Statistics)
ACCOUNTABILITY
What success looks like, Direction, Milestones:
Zero RTT pathways greater than 52 weeks
Timeframe/Baseline:
Ongoing.
Rationale:
The operational standards of 90 per cent for admitted and 95 per cent for non-admitted completed waits as set out in the standing rules. In order to sustain the delivery of these standards, trusts also need to ensure that a minimum of 92 per cent of patients on an incomplete pathway should have been waiting no more than 18 weeks. These RTT waiting time standards leave an operational tolerance to allow for patients who wait longer than 18 weeks to start their treatment because of choice or clinical exception. These circumstances can be categorised as:
E.B.S.4: Number of 52 week Referral to Treatment Pathways
Everyone Counts: Planning for Patients 2014/15 - 2018/19: Technical Definitions for Clinical
Commissioning Groups and Area Teams
52
Patient choice - patients choose not to accept earliest offered reasonable appointments along their pathway or choose to delay treatments for personal or social reasons,
Co-operation - patients who do not attend appointments that they have agreed along their pathways,
Clinical exceptions - where it is not clinically appropriate to start a patient's treatment within 18 weeks.
Each patient has a right to access non-urgent consultant-led treatment within the maximum waiting time of 18 weeks, or for the NHS to take all reasonable steps to offer a range of alternative providers if this is not possible. However, there remains a small number of patients who are waiting too long. It is unfair to provide patients with a right and then not deliver against it. As such, we wish to identify an absolute minimum for all patients. From 2013/14 the following additional safeguard will be in place:
Zero tolerance of any referral to treatment waits of more than 52 weeks, with intervention, including contractual fines when this occurs.
PLANNING REQUIREMENTS
Are plans required and if so, at what frequency?
CCG – No. Area Team – No.

Everyone Counts: Planning for Patients 2014/15 - 2018/19: Technical Definitions for Clinical
Commissioning Groups and Area Teams
53
DEFINITIONS
Detailed Descriptor:
Patients who have waited over 12 hours in A&E from decision to admit to admission.
Lines Within Indicator (Units):
Total number of patients who have waited over 12 hours in A&E from decision to admit to admission.
Data Definition:
The waiting time for an emergency admission via A&E is measured from the time when the decision is made to admit, or when treatment in A&E is completed (whichever is later) to the time when the patient is admitted. i) Time of decision to admit is defined as the time when a clinician decides and records a decision to admit the patient or the time when treatment that must be carried out in A&E before admission is complete – whichever is the later. ii) An emergency admission via A&E is defined as an admission under code 21. Time of admission is defined as the time when such a patient leaves the department to go to:
An operating theatre,
A bed in a ward (see definition of ward below),
An X-ray or diagnostic test or other treatment directly en route to a bed in a ward (as defined below) or operating theatre. However, leaving A&E for a diagnostic test or other treatment does not count as time of admission if the patient then returns to A&E to continue waiting for a bed.
Note that in the NHS Data Dictionary, patients waiting following a decision to admit are known as 'Lodged Patients', and they remain in the A&E department from the decision to admit to their Lodging End Time. The lodging end time is defined as follows: ‘The time that the responsibility for nursing care is transferred from an accident and emergency department to a ward thus ending the period as a lodged patient. This will be the same as A&E departure time if the patient was lodged as a result of an accident and emergency attendance.’ ‘The transfer of responsibility may occur when the patient is received into a bed in an appropriate ward, an operating theatre or another setting for immediate treatment (e.g. an X-ray Department) before being received into a bed in an appropriate ward. A bed in an A&E observation and assessment ward may be a transfer of responsibility but a trolley, bed or chair in a corridor would not.’
MONITORING
E.B.S.5: Trolley waits in A&E

Everyone Counts: Planning for Patients 2014/15 - 2018/19: Technical Definitions for Clinical
Commissioning Groups and Area Teams
54
Monitoring Frequency:
Weekly
Monitoring Data Source:
WSitAE http://www.england.nhs.uk/statistics/statistical-work-areas/ae-waiting-times-and-activity/
ACCOUNTABILITY
What success looks like, Direction, Milestones:
There should be no instances of 12 hour trolley waits.
Timeframe/Baseline:
Ongoing
Rationale:
It is not acceptable for patients to be waiting on trolleys for admission for this length of time.
PLANNING REQUIREMENTS
Are plans required and if so, at what frequency?
CCG – No.. Area Team – No.

Everyone Counts: Planning for Patients 2014/15 - 2018/19: Technical Definitions for Clinical
Commissioning Groups and Area Teams
55
DEFINITIONS
Detailed Descriptor:
Number of urgent operations that are cancelled by the trust for non-clinical reasons, which have already been previously cancelled once for non-clinical reasons.
Lines Within Indicator (Units):
Number of urgent operations that are cancelled by the trust for non-clinical reasons, which have already been previously cancelled once for non-clinical reasons.
Data Definition:
Count of all urgent operations that are cancelled by the trust for non-clinical reasons, which have already been previously cancelled once for non-clinical reasons. This should exclude patient cancellations. Include all urgent operations that are cancelled for a second time, including emergency patients (i.e. non-elective) who have their operations cancelled. In principle, the majority of urgent cancellations will be urgent elective patients but it is possible that an emergency patient has their operation cancelled (e.g. patient presents at A&E with complex fracture which needs operating on. Patient’s operation is arranged and subsequently cancelled). Definition of “urgent operation” The definition of 'urgent operation' is one that should be agreed locally in the light of clinical and patient need. However, it is recommended that the guidance as suggested by the National Confidential Enquiry into Perioperative Deaths (NCEPOD) should be followed. Broadly these are: I. Immediate - Immediate (A) life saving or (B) limb or organ saving intervention.
Operation target time within minutes of decision to operate.
II. Urgent – acute onset or deterioration of conditions that threaten life, limb or organ survival. Operation target time within hours of decision to operate.
III. Expedited – stable patient requiring early intervention for a condition that is not an immediate threat to life, limb or organ survival. Operation target time within days of decision to operate.
IV. Elective – Surgical procedure planned or booked in advance of routine admission
to hospital Broadly, (i), (ii) and (iii) should be regarded as 'urgent' for the purpose of meeting this requirement.
E.B.S.6: Urgent operations cancelled for a second time

Everyone Counts: Planning for Patients 2014/15 - 2018/19: Technical Definitions for Clinical
Commissioning Groups and Area Teams
56
MONITORING
Monitoring Frequency:
For local determination
Monitoring Data Source:
Local data but currently winter daily sitreps collect data on urgent operations cancelled for a second time. http://www.england.nhs.uk/statistics/statistical-work-areas/winter-daily-sitreps/
ACCOUNTABILITY
What success looks like, Direction, Milestones:
No patient should have an urgent operation cancelled for a second time.
Timeframe/Baseline:
Ongoing
Rationale:
Improved patient experience and patient outcomes
PLANNING REQUIREMENTS
Are plans required and if so, at what frequency?
CCG – No. Area Team – No.

Everyone Counts: Planning for Patients 2014/15 - 2018/19: Technical Definitions for Clinical
Commissioning Groups and Area Teams
57
DEFINITIONS
Detailed Descriptor:
Ambulance handover delays.
Lines Within Indicator (Units):
1. Ambulance handover delays of over 30 minutes. 2. Ambulance handover delays of over 1 hour.
Data Definition:
The number of handover delays of longer than 30 minutes, and of those the number over one hour. Clock start - arrival to handover performance (acute trusts) : When an ambulance wheels stop in the patient offloading bay (handbrake applied and ‘Red at Hospital’ button is pressed on the MDT). Clock stop - Patient Handover / Trolley Clear performance (acute trusts): The time at which clinical handover has been fully completed and the patient has been physically transferred onto hospital apparatus. Ambulance apparatus must have been returned, enabling the ambulance crew to leave the department. Count all accident, emergency and urgent patients if destined for A&E (either Type 1, 2 or 3). This includes GP urgent patients brought by ambulance to A&E. Do NOT count non-emergency patients. Patients being transported between locations/trusts/hospitals (e.g. for outpatient clinics, tertiary care) should not be counted. Ambulance trusts should not count the time required for crews to complete record forms, clean vehicles, re-stock vehicles or have a break.
MONITORING
Monitoring Frequency:
For local determination
Monitoring Data Source:
Local data but currently winter daily sitreps collect data on 30 minute handovers at acute trusts http://www.england.nhs.uk/statistics/statistical-work-areas/winter-daily-sitreps/
ACCOUNTABILITY
E.B.S.7: Ambulance handover time

Everyone Counts: Planning for Patients 2014/15 - 2018/19: Technical Definitions for Clinical
Commissioning Groups and Area Teams
58
What success looks like, Direction, Milestones:
Reductions expected in the numbers of handover delays.
Timeframe/Baseline:
Ongoing
Rationale:
Delaying ambulances outside A&E as a result of a temporary mismatch between A&E/hospital capacity and numbers of elective/emergency patients arriving is not acceptable. Implementation of the full hospital escalation plan should ensure that A&Es have significant capacity to avoid most instances of ambulance queuing. Patients waiting in the back of ambulances is not acceptable, and there are risks to patients in the community who are not able to receive a 999 response whilst ambulances are waiting at A&E.
PLANNING REQUIREMENTS
Are plans required and if so, at what frequency?
CCG – No. Area Team – No.

Everyone Counts: Planning for Patients 2014/15 - 2018/19: Technical Definitions for Clinical
Commissioning Groups and Area Teams
59
Everyone Counts – Annex C Measures
E.C.1-3: Elective finished first consultant episodes (FFCEs)
DEFINITIONS
Detailed Descriptor:
Number of general & acute (G&A) elective admissions FFCEs.
Lines Within Indicator (Units):
E.C.1: Line 1: number of G&A elective ordinary admission FFCEs in the period. E.C.2: Line 2: number of G&A daycase FFCEs in the period. E.C.3: Line 3: total number of G&A elective FFCEs in the period. Note: Line 1 + Line 2 = Line 3
Data Definition:
Number of finished first consultant episodes (FFCEs) for the G&A specialties (see below) relating to hospital provider spells for which: • patient classification = ordinary admission (1) Daycase admission (2); • admission method = elective admission (admission method 11, 12, 13); Exclude “well babies”. These are defined as having admission method = other and neonatal level of care = normal care. • episode number = 1 General & Acute specialties; include:100-192, 300-460, 502, 800-831, 900, 901 exclude: 501, 700-715. Monthly Activity Return guidance is available here: http://www.england.nhs.uk/statistics/statistical-work-areas/hospital-activity/monthly-hospital-activity/
MONITORING
Monitoring Frequency:
Monthly
Monitoring Data Source:
Monthly Activity Return

Everyone Counts: Planning for Patients 2014/15 - 2018/19: Technical Definitions for Clinical
Commissioning Groups and Area Teams
60
ACCOUNTABILITY
What success looks like, Direction, Milestones:
That elective activity will reflect future demand and the move of activity into other primary care and community settings where appropriate.
Timeframe/Baseline:
2012/13 annual forecast outturn
Rationale:
Commissioners need to show that their plans for referrals and activity are realistic, and will sustain compliance with the NHS constitution’s right to access services within maximum waiting times.
PLANNING REQUIREMENTS
Are plans required and if so, at what frequency?
CCG – Yes, monthly for 2014/15 and 2015/16 and annual from 2016/17 to 2018/19, via ProvCom template. Area Team – Yes, monthly for 2014/15 and 2015/16 and annual from 2016/17 to 2018/19, via ProvCom template. Please note: Data entered regarding Area Team activity should be based on the activity that is commissioned by an Area Team irrespective of the location of the provider . For those Area Teams with responsibility for Specilaised Commssioning, this will include activity in line with the contractual arrangements i.e all activity based on a provider footprint not a registration basis.
FURTHER INFORMATION
This information will be used to reconcile with data collected in the finance planning template.

Everyone Counts: Planning for Patients 2014/15 - 2018/19: Technical Definitions for Clinical
Commissioning Groups and Area Teams
61
E.C.4: Non-elective FFCEs (First Finished Consultant Episode)
DEFINITIONS
Detailed Descriptor:
Total number of non-elective FFCEs in general & acute (G&A) specialties in a month.
Lines Within Indicator (Units):
Number of G&A non-elective FFCEs in the period.
Data Definition:
Non-Elective FFCEs data are derived from the Monthly Activity Return, which is collected from the NHS. It is collected from providers (both NHS and IS) who provide the data broken down by Commissioner. Number of first finished consultant episodes (FFCEs) for the G&A specialties (see below) relating to hospital provider spells for which: patient classification = ordinary admission; admission method = emergency admission, maternity admission, other admission (codes 21-83); episode number = 1. Exclude "well babies". These are defined as having admission method = other and neonatal level of care = normal care. General & Acute specialties; include: 100-192, 300-460, 502, 800-831, 900 and 901 exclude: 501, 700-715. Monthly Activity Return guidance is available here: http://www.england.nhs.uk/statistics/statistical-work-areas/hospital-activity/monthly-hospital-activity/
MONITORING
Monitoring Frequency:
Monthly
Monitoring Data Source:
Monthly Activity Returns
ACCOUNTABILITY
What success looks like, Direction, Milestones:
There should be a reduction in the growth of the number of non-elective FFCEs.
Timeframe/Baseline:
Ongoing
Everyone Counts: Planning for Patients 2014/15 - 2018/19: Technical Definitions for Clinical
Commissioning Groups and Area Teams
62
Rationale:
Where clinically appropriate, it is better for patients to be treated or continue their treatment at home or in their community rather than in hospital. The local NHS should be looking to treat patients in the most clinically appropriate way.
PLANNING REQUIREMENTS
Are plans required and if so, at what frequency?
CCG – Yes, monthly for 2014/15 and 2015/16 and annual from 2016/17 to 2018/19 via ProvCom template. Area Team – Yes, monthly for 2014/15 and 2015/16 and annual from 2016/17 to 2018/19, via ProvCom template. Please note: Data entered regarding Area Team activity should be based on the activity that is commissioned by an Area Team irrespective of the location of the provider . For those Area Teams with responsibility for Specilaised Commssioning, this will include activity in line with the contractual arrangements i.e all activity based on a provider footprint not a registration basis.
FURTHER INFORMATION
This information will be used to reconcile with data collected in the finance planning template.

Everyone Counts: Planning for Patients 2014/15 - 2018/19: Technical Definitions for Clinical
Commissioning Groups and Area Teams
63
E.C.5: All first outpatient attendances
DEFINITIONS
Detailed Descriptor:
All first outpatient attendances (consultant-led) in general and acute specialties.
Lines Within Indicator (Units):
Number of attendances in the period.
Data Definition:
A count of all outpatient attendances taking place within the period, whether taking place within a consultant clinic session or outside a session. The patient must have been seen by a consultant, or a clinician acting for the consultant, for examination or treatment.
Specifically, the number of consultant outpatient attendances in general & acute specialties for which: • first attendance = yes;
• attended or did not attend = attended (and was seen);
• First Attendance of the Out-Patient Attendance Consultant Care Contact = National Code 1 'First attendance face to face' or 3 'First telephone or telemedicine consultation'.
This includes first outpatient attendance for all consultant outpatient episodes for all sources of referral.
Activity delivered in a primary care setting lines should also be included.
General & Acute specialties: include: 100-192, 300-460, 502, 800-831, 900, 901 but exclude: 501,700-715.
Monthly Activity Return guidance is available here: http://www.england.nhs.uk/statistics/statistical-work-areas/hospital-activity/monthly-hospital-activity/
MONITORING
Monitoring Frequency:
Monthly.
Monitoring Data Source:
Monthly Activity Return (MAR).
ACCOUNTABILITY
What success looks like, Direction, Milestones:
Sustain compliance with the NHS constitution’s right to access services within maximum waiting times
Timeframe/Baseline:

Everyone Counts: Planning for Patients 2014/15 - 2018/19: Technical Definitions for Clinical
Commissioning Groups and Area Teams
64
Ongoing
Rationale:
Commissioners need to show that their plans for referrals and activity are realistic, and will sustain compliance with the NHS constitution’s right to access services within maximum waiting times.
PLANNING REQUIREMENTS
Are plans required and if so, at what frequency?
CCG – Yes, monthly for 2014/15 and 2015/16 and annual from 2016/17 to 2018/19 via ProvCom template. Area Team – Yes, monthly for 2014/15 and 2015/16 and annual from 2016/17 to 2018/19 via ProvCom template.
Please note: Data entered regarding Area Team activity should be based on the activity that is commissioned by an Area Team irrespective of the location of the provider . For those Area Teams with responsibility for Specilaised Commssioning, this will include activity in line with the contractual arrangements i.e all activity based on a provider footprint not a registration basis.
FURTHER INFORMATION
This information will be used to reconcile with data collected in the finance planning template.

Everyone Counts: Planning for Patients 2014/15 - 2018/19: Technical Definitions for Clinical
Commissioning Groups and Area Teams
65
E.C.6: All Subsequent Outpatient Attendances (consultant led)
DEFINITIONS
Detailed Descriptor:
The total number of Consultant-led subsequent attendance appointments, in all specialties.
Lines Within Indicator (Units):
Number of subsequent attendances in the period.
Data Definition:
The total number of follow-up attendance appointments, where the Out-Patient Attendance Consultant took place within the period. First Attendance of the Out-Patient Attendance Consultant Care Contact is National Code 2 'Follow-up attendance face to face' or 4 'Follow-up telephone or telemedicine consultation'. Data should be reported for the sum of all consultant specialties, see QAR guidance for the complete list http://www.england.nhs.uk/statistics/statistical-work-areas/hospital-activity/quarterly-hospital-activity/ This includes subsequent outpatient attendance for all consultant outpatient episodes for all sources of referral.
MONITORING
Monitoring Frequency:
Quarterly
Monitoring Data Source:
Quarterly Activity Return (QAR).
ACCOUNTABILITY
What success looks like, Direction, Milestones:
Timeframe/Baseline:
Rationale:
Commissioners need to show that their plans for referrals and activity are realistic, and will sustain compliance with the NHS constitution’s right to access services within maximum waiting times.
PLANNING REQUIREMENTS
Are plans required and if so, at what frequency?

Everyone Counts: Planning for Patients 2014/15 - 2018/19: Technical Definitions for Clinical
Commissioning Groups and Area Teams
66
CCG – Yes, quarterly for 2014/15 and 2015/16 and annual from 2016/17 to 2018/19, via ProvCom template. Area Team – Yes, quarterly for 2014/15 and 2015/16 and annual from 2016/17 to 2018/19, via ProvCom template. Please note: Data entered regarding Area Team activity should be based on the activity that is commissioned by an Area Team irrespective of the location of the provider . For those Area Teams with responsibility for Specilaised Commssioning, this will include activity in line with the contractual arrangements i.e all activity based on a provider footprint not a registration basis.
FURTHER INFORMATION
This information will be used to reconcile with data collected in the finance planning template.

Everyone Counts: Planning for Patients 2014/15 - 2018/19: Technical Definitions for Clinical
Commissioning Groups and Area Teams
67
E.C.7-8: A&E Attendances
DEFINITIONS
Detailed Descriptor:
Number of attendances at A&E departments.
Lines Within Indicator (Units):
E.C.7: Line 1: Number of attendances at Type 1 A&E Departments. E.C.8: Line 2: Total Number of attendances at all A&E Departments. Note: Line 1 is subset of Line 2
Data Definition:
A&E Attendance figures are sourced from weekly SitRep data provided to a central Unify2 collection by Trusts – this is a weekly total taken from a reporting period of 00.01 Monday to 24.00 Sunday. ‘Total A&E attendances’ is defined as the total of type 1, type 2 and type 3 attendances. This is automatically calculated on the SitRep submission form. Data from the forms are collated from Trusts into monthly and quarterly totals on Unify2 and then aggregated into area and national totals by the NHS England.
MONITORING
Monitoring Frequency:
Quarterly aggregated from Weekly
Monitoring Data Source:
Weekly Sitrep data
ACCOUNTABILITY
What success looks like, Direction, Milestones:
There should be a reduction in the growth of the number of A&E attendances.
Timeframe/Baseline:
Ongoing
Rationale:
Patients requiring urgent and emergency care get the right care by the right person at the right place and time. There are instances where people presenting to accident and emergency departments because they either do not know how, or are unable, to access the care they feel they need when they want it. The introduction of NHS 111 will assist patients in finding the most appropriate and convenient service for their needs so they receive the best care first time. A reduction in the growth of the number of A&E attendances may indicate a more appropriate use of expensive emergency care, and improve use of other services where appropriate.

Everyone Counts: Planning for Patients 2014/15 - 2018/19: Technical Definitions for Clinical
Commissioning Groups and Area Teams
68
PLANNING REQUIREMENTS
Are plans required and if so, at what frequency?
CCG – Yes (only for E.C.8: Line 2: Total Number of attendances at all A&E Departments), annual for 2014/15 to 2018/19 via CCG Com. Area Team – No.
FURTHER INFORMATION
This information will be used to reconcile with data collected in the finance planning template.

Everyone Counts: Planning for Patients 2014/15 - 2018/19: Technical Definitions for Clinical
Commissioning Groups and Area Teams
69
E.C.9: GP Written Referrals
DEFINITIONS
Detailed Descriptor:
GP written referrals from GPs for a first outpatient appointment in G&A specialities.
Lines Within Indicator (Units):
Number of GP written referrals in the period.
Data Definition:
The total number of GP written Referral Requests for a first Consultant Outpatient Episode in the period. An electronic message should be counted as written, as should a verbal request which is subsequently confirmed by a written request. It is the total number of GP written referrals where:
Referral Request Type = National Code 01 'GP referral request' Written Referral Request Indicator = classification 'Yes'
General & Acute specialties; Include: 100-192, 300-460, 502, 800-831, 900, 901 Exclude: 501, 700-715. Monthly Activity Return guidance is available here: http://www.england.nhs.uk/statistics/statistical-work-areas/hospital-activity/monthly-hospital-activity/.
MONITORING
Monitoring Frequency:
Monthly.
Monitoring Data Source:
Monthly Activity Return (MAR).
ACCOUNTABILITY
What success looks like, Direction, Milestones:
Timeframe/Baseline:
Rationale:
Commissioners need to show that their plans for referrals and activity are realistic, and will sustain compliance with the NHS Constitution’s right to access services within maximum waiting times.

Everyone Counts: Planning for Patients 2014/15 - 2018/19: Technical Definitions for Clinical
Commissioning Groups and Area Teams
70
PLANNING REQUIREMENTS
Are plans required and if so, at what frequency?
CCG – Yes, monthly for 2014/15 and 2015/16 and annual from 2016/17 to 2018/19 via ProvCom template. Area Team – Yes, monthly for 2014/15 and 2015/16 and annual from 2016/17 to 2018/19 via ProvCom template. Please note: Data entered regarding Area Team activity should be based on the activity that is commissioned by an Area Team irrespective of the location of the provider . For those Area Teams with responsibility for Specilaised Commssioning, this will include activity in line with the contractual arrangements i.e all activity based on a provider footprint not a registration basis.

Everyone Counts: Planning for Patients 2014/15 - 2018/19: Technical Definitions for Clinical
Commissioning Groups and Area Teams
71
E.C.10: Other Referrals for first Outpatient Appointment
DEFINITIONS
Detailed Descriptor:
Other referrals for a first outpatient appointment in general & acute specialities
Lines Within Indicator (Units):
Number of referrals in the period.
Data Definition:
The total number of other (non-GP) referral requests (written or verbal or electronic) for a first consultant outpatient episode in the period. The total number of other Referral Requests (written or verbal) for a first Consultant Out-Patient Episode in the period. All referral requests to a Consultant whether directed to a specific consultant or not, should be recorded, regardless of whether they result in an outpatient attendance. The referral request received date of the referral request should be used to identify referrals to be included in the return. It is the total number of referrals requests excluding:
A. GP written referrals; these are where the referral request type of the referral request is National Code 01 'GP referral request' and the written referral request indicator of the referral request is classification 'Yes'. B. Self-referrals; these are where the referral request type of the referral request is National Code 04 'Patient self-referral request'. C. Initiated by the consultant responsible for the Consultant Out-Patient Episode referrals; these are where the source of referral for out-patients of the referral request is National Code 01 'following an emergency admission' or 02 'following a domiciliary visit' or 10 'following an Accident And Emergency Attendance' or 11 'other'. D. Referrals initiated by attendance at drop-in clinic without prior appointment; these are where the out-patient clinic referring indicator of the referral request is classification 'Attended referring Out-Patient Clinic without prior appointment'.
General & acute specialties; Include: 100-192, 300-460, 502, 800-831, 900, 901 Exclude: 501, 700-715. Monthly Activity Return guidance is available here: http://www.england.nhs.uk/statistics/statistical-work-areas/hospital-activity/monthly-hospital-activity/.
MONITORING
Monitoring Frequency:
Monthly.
Monitoring Data Source:

Everyone Counts: Planning for Patients 2014/15 - 2018/19: Technical Definitions for Clinical
Commissioning Groups and Area Teams
72
Monthly Activity Return (MAR).
ACCOUNTABILITY
What success looks like, Direction, Milestones:
Timeframe/Baseline:
Rationale:
Commissioners need to show that their plans for referrals and activity are realistic, and will sustain compliance with the NHS Constitution’s right to access services within maxium waiting times.
PLANNING REQUIREMENTS
Are plans required and if so, at what frequency?
CCG – Yes, monthly for 2014/15 and 2015/16 and annual from 2016/17 to 2018/19 via ProvCom template. Area Team – Yes, monthly for 2014/15 and 2015/16 and annual from 2016/17 to 2018/19 via ProvCom template. Please note: Data entered regarding Area Team activity should be based on the activity that is commissioned by an Area Team irrespective of the location of the provider . For those Area Teams with responsibility for Specilaised Commssioning, this will include activity in line with the contractual arrangements i.e all activity based on a provider footprint not a registration basis.

Everyone Counts: Planning for Patients 2014/15 - 2018/19: Technical Definitions for Clinical
Commissioning Groups and Area Teams
73
E.C.11 : Total Referrals
DEFINITIONS
Detailed Descriptor:
Sum of indicators E.C.9 and E.C.10
See E.C.9 and E.C.10 for definition, monitoring and accountability.
PLANNING REQUIREMENTS
Are plans required and if so, at what frequency?
CCG – Yes (via E.C.9 and E.C.10), monthly for 2014/15 and 2015/16 and annual from 2016/17 to 2018/19 via ProvCom template. Area Team – Yes (via E.C.9 and E.C.10), monthly for 2014/15 and 2015/16 and annual from 2016/17 to 2018/19 via ProvCom template. Please note: Data entered regarding Area Team activity should be based on the activity that is commissioned by an Area Team irrespective of the location of the provider . For those Area Teams with responsibility for Specilaised Commssioning, this will include activity in line with the contractual arrangements i.e all activity based on a provider footprint not a registration basis.

Everyone Counts: Planning for Patients 2014/15 - 2018/19: Technical Definitions for Clinical
Commissioning Groups and Area Teams
74
E.C.12: First Outpatient Attendances following GP Referrals
DEFINITIONS
Detailed Descriptor:
First outpatient attendances (consultant-led) following GP referral in general and acute specialties.
Lines Within Indicator (Units):
Number of attendances in the period.
Data Definition:
A count of all first outpatient attendances taking place within the period, whether taking place within a consultant clinic session or outside a session. The patient must have been seen by a consultant, or a clinician acting for the consultant, for examination or treatment. Specifically, the number of consultant outpatient attendances in general & acute specialties for which: • Referral Request Type = National Code 01 'GP referral request'; • Written Referral Request Indicator = classification 'Yes'; • First Attendance of the Out-Patient Attendance Consultant Care Contact = National Code 1 'First attendance face to face' or 3 'First telephone or telemedicine consultation'. General & Acute specialties: include: 100-192, 300-460, 502, 800-831, 900, 901 but exclude: 501, 700-715. Monthly Activity Return guidance is available here: http://www.england.nhs.uk/statistics/statistical-work-areas/hospital-activity/monthly-hospital-activity/.
MONITORING
Monitoring Frequency:
Monthly
Monitoring Data Source:
Monthly Activity Return (MAR)
ACCOUNTABILITY
What success looks like, Direction, Milestones:
Timeframe/Baseline:
Rationale:

Everyone Counts: Planning for Patients 2014/15 - 2018/19: Technical Definitions for Clinical
Commissioning Groups and Area Teams
75
Commissioners need to show that their plans for referrals and activity are realistic, and will sustain compliance with the NHS Constitution’s right to access services within maximum waiting times.
PLANNING REQUIREMENTS
Are plans required and if so, at what frequency?
CCG – Yes, monthly for 2014/15 and 2015/16 and annual from 2016/17 to 2018/19 via ProvCom template. Area Team – Yes, monthly for 2014/15 and 2015/16 and annual from 2016/17 to 2018/19 via ProvCom template.
Please note: Data entered regarding Area Team activity should be based on the activity that is commissioned by an Area Team irrespective of the location of the provider . For those Area Teams with responsibility for Specilaised Commssioning, this will include activity in line with the contractual arrangements i.e all activity based on a provider footprint not a registration basis.

Everyone Counts: Planning for Patients 2014/15 - 2018/19: Technical Definitions for Clinical
Commissioning Groups and Area Teams
76
Everyone Counts – Annex D Measures
E.D.1: Satisfaction with the Quality of Consultation at the GP Practice
DEFINITIONS
Detailed Descriptor:
Satisfaction with the quality of consultation at the GP practice.
Lines Within Indicator (Units):
Data Definition:
The aggregated percentage of patients who gave positive answers to seven selected
questions in the GP survey about the quality of appointments at the GP practice.
Value: A score based on the sum of the percentage values of sub-indicators a, b, c, d, e,
f and g (Score out of 700).
Sub-indicator (a): The combined percentage of patients who answered positively to the
questions ‘Last time you saw or spoke to a GP from your GP surgery, how good was that
GP at giving you enough time?’ and ‘Last time you saw or spoke to a nurse from your GP
surgery, how good was that nurse at giving you enough time?’.
Numerator (a): The combined number of patients who answered ‘very good’ or ‘good’ to
the questions ‘Last time you saw or spoke to a GP from your GP surgery, how good was
that GP at giving you enough time?’ and ‘Last time you saw or spoke to a nurse from your
GP surgery, how good was that nurse at giving you enough time?’.
Denominator (a): The combined number of patients responding to the questions ‘how
good was that GP at giving you enough time?’ and ‘how good was that nurse at giving
you enough time?’, excluding those who answered ‘Doesn’t apply’.
Value (a): The numerator divided by denominator, expressed as a percentage.
Sub-indicator (b): The combined percentage of patients who answered positively to the
questions ‘Last time you saw or spoke to a GP from your GP surgery, how good was that
GP at listening to you?’ and ‘Last time you saw or spoke to a nurse from your GP surgery,
how good was that nurse at Listening to you?’.
Numerator (b): The combined number of patients who answered ‘very good’ or ‘good’ to
the questions ‘Last time you saw or spoke to a GP from your GP surgery, how good was
that GP at Listening to you?’ and ‘Last time you saw or spoke to a nurse from your GP
surgery, how good was that nurse at Listening to you?’.
Denominator (b): The combined number of patients responding to the questions ‘how
good was that GP at Listening to you?’ and ‘how good was that nurse at Listening to
you?’, excluding those who answered ‘Doesn’t apply’.
Value (b): The numerator divided by denominator, expressed as a percentage.

Everyone Counts: Planning for Patients 2014/15 - 2018/19: Technical Definitions for Clinical
Commissioning Groups and Area Teams
77
Sub-indicator (c): The combined percentage of patients who answered positively to the
questions ‘Last time you saw or spoke to a GP from your GP surgery, how good was that
GP at Explaining tests and treatment?’ and ‘Last time you saw or spoke to a nurse from
your GP surgery, how good was that nurse at Explaining tests and treatments?’.
Numerator (c): The combined number of patients who answered ‘very good’ or ‘good’ to
the questions ‘Last time you saw or spoke to a GP from your GP surgery, how good was
that GP at Explaining tests and treatments?’ and ‘Last time you saw or spoke to a nurse
from your GP surgery, how good was that nurse at Explaining tests and treatments?’.
Denominator (c): The combined number of patients responding to the questions ‘how
good was that GP at Explaining tests and treatments?’ and ‘how good was that nurse at
Explaining tests and treatments?’, excluding those who answered ‘Doesn’t apply’.
Value (c): The numerator divided by denominator, expressed as a percentage.
Sub-indicator (d): The combined percentage of patients who answered positively to the
questions ‘Last time you saw or spoke to a GP from your GP surgery, how good was that
GP at Involving you in decisions about your care?’ and ‘Last time you saw or spoke to a
nurse from your GP surgery, how good was that nurse at Involving you in decisions about
your care?’.
Numerator (d): The combined number of patients who answered ‘very good’ or ‘good’ to
the questions ‘Last time you saw or spoke to a GP from your GP surgery, how good was
that GP at Involving you in decisions about your care?’ and ‘Last time you saw or spoke
to a nurse from your GP surgery, how good was that nurse at Involving you in decisions
about your care?’.
Denominator (d): The combined number of patients responding to the questions ‘how
good was that GP at Involving you in decisions about your care?’ and ‘how good was that
nurse at Involving you in decisions about your care?’.
Value (d): The numerator divided by denominator, expressed as a percentage.
Sub-indicator (e): The combined percentage of patients who answered positively to the
questions ‘Last time you saw or spoke to a GP from your GP surgery, how good was that
GP at Treating you with care and concern?’ and ‘Last time you saw or spoke to a nurse
from your GP surgery, how good was that nurse at Treating you with care and concern?’.
Numerator (e): The combined number of patients who answered ‘very good’ or ‘good’ to
the questions ‘Last time you saw or spoke to a GP from your GP surgery, how good was
that GP at Treating you with care and concern?’ and ‘Last time you saw or spoke to a
nurse from your GP surgery, how good was that nurse at Treating you with care and
concern?’ .
Denominator (e): The combined number of patients responding to the questions ‘how
good was that GP at Treating you with care and concern?’ and ‘how good was that nurse
at Treating you with care and concern?’ Excluding those who answered ‘Doesn’t apply’.
Value (e): The numerator divided by denominator, expressed as a percentage.

Everyone Counts: Planning for Patients 2014/15 - 2018/19: Technical Definitions for Clinical
Commissioning Groups and Area Teams
78
Sub-indicator (f): The combined percentage of patients who answered positively to the
questions ‘Did you have confidence and trust in the GP you saw or spoke to?’ and ‘Did
you have confidence and trust in the nurse you saw or spoke to?’.
Numerator (f): The combined number of patients who answered ‘Yes, definitely’ or ‘Yes,
to some extent’ to the questions ‘Did you have confidence and trust in the GP you saw or
spoke to?’ and ‘Did you have confidence and trust in the nurse you saw or spoke to?’ .
Denominator (f): The combined number of patients responding to the question ‘Did you
have confidence and trust in the GP you saw or spoke to?’ and ‘Did you have confidence
and trust in the nurse you saw or spoke to?’ excluding those who answered ‘Don’t know /
can’t say’.
Value (f): The numerator divided by the denominator, expressed as a percentage.
Sub-indicator (g): The percentage of patients who answered positively to the question
‘How confident are you that you can manage your own health?’.
Numerator (g): The number of patients who answered ‘Very confident’, or ‘Fairly
confident’ to the question ‘How confident are you that you can manage your own health?’.
Denominator (g): The number of patients responding to the question ‘How confident are
you that you can manage your own health?’.
Value (g): The numerator divided by the denominator, expressed as a percentage.
MONITORING
Monitoring Frequency:
Bi-Annually
Monitoring Data Source:
GP Patient Survey results GPOS aggregated measure from http://www.gp-patient.co.uk
ACCOUNTABILITY
What success looks like, Direction, Milestones:
Annual improvement
Timeframe/Baseline:
Rationale:
Please see the Introduction to an Approach to quality improvement in Primary Care: Appendix 1 - Technical Guidance GPOS. Located on the Primary Care Web Tool at www.primarycare.nhs.uk.
PLANNING REQUIREMENTS
Are plans required and if so, at what frequency?
CCG – No. Area Team - Yes, annual for 2014/15 to 2018/19 via AT DC Template.

Everyone Counts: Planning for Patients 2014/15 - 2018/19: Technical Definitions for Clinical
Commissioning Groups and Area Teams
79
E.D.2: Satisfaction with the Overall Care Received at the Surgery
DEFINITIONS
Detailed Descriptor:
Patient satisfaction Satisfaction with the overall care received at the surgery.
Lines Within Indicator (Units):
Data Definition:
The aggregated percentage of patients gave positive answers to selected questions in
the GP survey about their satisfaction with overall care received.
Value: A score based on the sum of the percentage values of sub-indicators a, b (Score
out of 200).
Sub-indicator (a): The percentage of patients who gave a positive answer to ‘Overall,
how would you describe your experience of your GP surgery?’.
Numerator (a): The number of patients who answered ‘very good’ or ‘fairly good’ to the
question, ‘Overall, how would you describe your experience of your GP surgery?’.
Denominator (a): The number of patients responding to the question ‘Overall, how would
you describe your experience of your GP surgery?’.
Value (a): The numerator divided by the denominator, expressed as a percentage.
Sub-indicator (b): The percentage of patients who gave a positive answer to ‘Would you
recommend your GP surgery to someone who has just moved to your local area?’.
Numerator (b): The number of respondents who answered ‘yes, would definitely
recommend’ or ‘Yes, would probably recommend’ to the question, ‘Would you
recommend your GP surgery to someone who has just moved to your local area?’.
Denominator (b): The number of patients responding to the question ‘Would you
recommend your GP surgery to someone who has just moved to your local area?’.
Excluding those who answered ‘Don’t know’.
Value (b): The numerator divided by the denominator, expressed as a percentage.
MONITORING
Monitoring Frequency:
Bi-Annually
Monitoring Data Source:
GP Patient Survey results GPOS aggregated measure from http://www.gp-patient.co.uk

Everyone Counts: Planning for Patients 2014/15 - 2018/19: Technical Definitions for Clinical
Commissioning Groups and Area Teams
80
ACCOUNTABILITY
What success looks like, Direction, Milestones:
Annual improvement
Timeframe/Baseline:
Rationale:
Please see the Introduction to an Approach to quality improvement in Primary Care: Appendix 1 - Technical Guidance GPOS. Located on the Primary Care Web Tool at www.primarycare.nhs.uk.
PLANNING REQUIREMENTS
Are plans required and if so, at what frequency?
CCG – No. Area Team - Yes, annual for 2014/15 to 2018/19 via AT DC Template.

Everyone Counts: Planning for Patients 2014/15 - 2018/19: Technical Definitions for Clinical
Commissioning Groups and Area Teams
81
E.D.3: Satisfaction with Accessing Primary Care
DEFINITIONS
Detailed Descriptor:
Patient satisfaction: Satisfaction with accessing primary care.
Lines Within Indicator (Units):
Data Definition:
The aggregated percentage of patients gave positive answers to three selected questions
in the GP survey about their satisfaction with getting appointments, opening hours and
getting through on the telephone.
Value: A score based on the sum of the percentage values of sub-indicators a, b and c
(score out of 300).
Sub-indicator (a): The percentage of patients who gave a positive response to being
able to get an appointment to see or speak to a GP or Nurse from their GP surgery when
they last wanted to see or speak to them.
Numerator (a): The number of patients answering ‘Yes’ or ‘Yes, but I had to call back
closer to or on the day I wanted the appointment’ to the question ’Were you able to get an
appointment to see or speak to someone?’.
Denominator (a): The number of patients answering ‘On the same day’, ‘On the next
working day’, ‘A few days later’, ‘A week or more later’ or ‘I didn’t have a specific day in
mind’ when responding to the question ’And when did you want to see or speak to them?’
Excluding those who responded ‘can’t remember’.
Value (a): The numerator divided by the denominator, expressed as a percentage.
Sub-indicator (b): The percentage of patients who were ‘Very satisfied’ or ‘Fairly
satisfied’ with their GP practice opening hours.
Numerator (b): The number of patients who answered ‘Very satisfied’ or ‘Fairly satisfied’
to the question ‘How satisfied are you with the hours that your GP surgery is open?’.
Denominator (b): The number of patients responding to the question ‘How satisfied are
you with the hours that your GP surgery is open?’, Excluding those who responded "I'm
not sure when my GP surgery is open".
Value (b): The numerator divided by the denominator, expressed as a percentage.
Sub-indicator (c): The percentage of patients who gave a positive answer to ‘Generally,
how easy is it to get through to someone at your GP surgery on the phone?’.
Numerator (c): The number of patients who answered ‘Very easy’ or ‘Fairly easy’ to the
question ‘Generally, how easy is it to get through to someone at your GP surgery on the
phone?’.

Everyone Counts: Planning for Patients 2014/15 - 2018/19: Technical Definitions for Clinical
Commissioning Groups and Area Teams
82
Denominator (c): The number of patients responding to the question ‘Generally, how easy
is it to get through to someone at your GP surgery on the phone?’, excluding those who
responded ’Haven’t tried’.
Value (c): The numerator divided by the denominator, expressed as a percentage.
MONITORING
Monitoring Frequency:
Bi-Annually
Monitoring Data Source:
GP Patient Survey results GPOS aggregated measure from http://www.gp-patient.co.uk
ACCOUNTABILITY
What success looks like, Direction, Milestones:
Annual improvement
Timeframe/Baseline:
Rationale:
Please see the Introduction to an Approach to quality improvement in Primary Care: Appendix 1 - Technical Guidance GPOS. Located on the Primary Care Web Tool at www.primarycare.nhs.uk.
PLANNING REQUIREMENTS
Are plans required and if so, at what frequency?
CCG – No. Area Team - Yes, annual for 2014/15 to 2018/19 via AT DC Template.

Everyone Counts: Planning for Patients 2014/15 - 2018/19: Technical Definitions for Clinical
Commissioning Groups and Area Teams
83
E.D.4: Proportion of New Cancer Cases Referred using the 2 Week Wait Pathway.
DEFINITIONS
Detailed Descriptor:
Cancer Detection Rate: Proportion of new cancer cases referred using 2 week wait pathway.
Lines Within Indicator (Units):
Data Definition:
MONITORING
Monitoring Frequency:
Annual
Monitoring Data Source:
National Cancer Intelligence Networks Practice Profiles
ACCOUNTABILITY
What success looks like, Direction, Milestones:
Please see the Introduction to an Approach to quality improvement in Primary Care: Appendix 1 - Technical Guidance GPOS. Located on the Primary Care Web Tool at www.primarycare.nhs.uk.
Timeframe/Baseline:
Rationale:
Please see the Introduction to an Approach to quality improvement in Primary Care: Appendix 1 - Technical Guidance GPOS. Located on the Primary Care Web Tool at www.primarycare.nhs.uk.
PLANNING REQUIREMENTS
Are plans required and if so, at what frequency?
CCG - No. Area Team – No.

Everyone Counts: Planning for Patients 2014/15 - 2018/19: Technical Definitions for Clinical
Commissioning Groups and Area Teams
84
E.D.5: Flu Vaccinations –At Risk Coverage
DEFINITIONS
Detailed Descriptor:
Flu Vaccinations – At risk coverage.
Lines Within Indicator (Units):
Data Definition:
Numerator: Number of individuals aged 6 months to under 65 who are in a clinical risk group [as defined in the immunisation against infectious diseases ‘Green Book’ and detailed in a READ-code specification currently produced by PRIMIS+] who have received Flu vaccine within each reporting area. Denominator: Number of individuals aged 6 months to under 65 who are in a clinical risk group [as defined in the immunisation against infectious diseases ‘Green Book’ and detailed in a READ-code specification currently produced by PRIMIS+] within each reporting area.
MONITORING
Monitoring Frequency:
Annual
Monitoring Data Source:
Immform
ACCOUNTABILITY
What success looks like, Direction, Milestones:
Performance to be sustained at or above the operational standard of 51.3%.
Timeframe/Baseline:
2012-13
Rationale:
Please see the Public Health Outcomes Framework https://www.gov.uk/government/publications/healthy-lives-healthy-people-improving-outcomes-and-supporting-transparency.
PLANNING REQUIREMENTS
Are plans required and if so, at what frequency?
CCG – No. Area Team - Yes, annual for 2014/15 to 2018/19 via AT DC Template.

Everyone Counts: Planning for Patients 2014/15 - 2018/19: Technical Definitions for Clinical
Commissioning Groups and Area Teams
85
E.D.6: Identifying the Prevalence of Depression compared to an Estimated Model
DEFINITIONS
Detailed Descriptor:
Mental Health - Disease Identification: Identifying the prevalence of depression compared to estimated model.
Lines Within Indicator (Units):
Data Definition:
Ratio of reported vs expected prevalence for depression. Numerator: The number of patients recorded by GP practices as having depression, as
reported in QOF data.
Denominator: The expected number (prevalence) of patients by GP practice on the disease register. The expected prevalence of depression is calculated for NHS Comparators using “age / sex specific rates from the Doncaster model applied to GP practice list size data”. Value: The numerator divided by the denominator expressed as a decimal number.
MONITORING
Monitoring Frequency:
Annual
Monitoring Data Source:
NHS Comparators and QOF Disease Registers.
ACCOUNTABILITY
What success looks like, Direction, Milestones:
Please see the Introduction to an Approach to quality improvement in Primary Care: Appendix 1 - Technical Guidance GPOS. Located on the Primary Care Web Tool at www.primarycare.nhs.uk.
Timeframe/Baseline:
Rationale:
Please see the Introduction to an Approach to quality improvement in Primary Care: Appendix 1 - Technical Guidance GPOS. Located on the Primary Care Web Tool at www.primarycare.nhs.uk.

Everyone Counts: Planning for Patients 2014/15 - 2018/19: Technical Definitions for Clinical
Commissioning Groups and Area Teams
86
PLANNING REQUIREMENTS
Are plans required and if so, at what frequency?
CCG – No. Area Team - Yes, annual for 2014/15 to 2018/19 via AT DC Template.
Everyone Counts: Planning for Patients 2014/15 - 2018/19: Technical Definitions for Clinical
Commissioning Groups and Area Teams
87
E.D.7: Percentage of Patients Seen – 24 Month Measure
DEFINITIONS
Detailed Descriptor:
Dental Access: Percentage of patients seen within 24 months.
Lines Within Indicator (Units):
Data Definition:
Numerator: Total number of patients seen in previous 24 months. Denominator: The ONS mid year estimates of resident population which are the most closely aligned with the mid-point of the 24 month period leading up to the selected date. For example, percentages from 31 March 2006 to 31 December 2006 are calculated using the ONS mid-2005 population estimates.
See: http://www.hscic.gov.uk/catalogue/PUB11625.
MONITORING
Monitoring Frequency:
Monthly
Monitoring Data Source:
DH/DSD data
ACCOUNTABILITY
What success looks like, Direction, Milestones:
Exceeding the percentage of patients seen in 2012/13.
Timeframe/Baseline:
Rationale:
PLANNING REQUIREMENTS
Are plans required and if so, at what frequency?
CCG – No. Area Team - Yes, annual for 2014/15 to 2018/19 via AT DC Template.

Everyone Counts: Planning for Patients 2014/15 - 2018/19: Technical Definitions for Clinical
Commissioning Groups and Area Teams
88
E.D.8: Number of Course Treatments per 100,000 Population
DEFINITIONS
Detailed Descriptor::
Dental - Activity Number of course treatments per 100,000 population.
Lines Within Indicator (Units):
Data Definition:
Course of Treatment is defined as: A. An examination of a patient, an assessment of their oral health, and the planning of any treatment to be provided to that patient as a result of that examination and assessment; and
B. The provision of any planned treatment (including any treatment planned at a time other than the time of the initial examination) to that patient. Denominator: The ONS mid year estimates of resident population which are the most closely aligned with the mid-point of the 24 month period leading up to the selected date. For example, percentages from 31 March 2006 to 31 December 2006 are calculated using the ONS mid-2005 population estimates. See: http://www.hscic.gov.uk/catalogue/PUB11625
MONITORING
Monitoring Frequency:
Quarterly
Monitoring Data Source:
HSCIC NHS Dental Statistics for England http://www.hscic.gov.uk/catalogue/PUB11625
PLANNING REQUIREMENTS
Are plans required and if so, at what frequency?
CCG – No. Area Team - Yes, annual for 2014/15 to 2018/19 via AT DC Template.

Everyone Counts: Planning for Patients 2014/15 - 2018/19: Technical Definitions for Clinical
Commissioning Groups and Area Teams
89
E.D.9: GPPS – Percentage Positive Experience
DEFINITIONS
Detailed Descriptor:
Dental - Patient Experience Selected patient experience questions (Access / Satisfaction).
Lines Within Indicator (Units):
Data Definition:
Numerator: Positive responses to selected questions from GP Survey. Denominator: Total Responses to selected questions from GP Survey (excluding responses that are N/A or not known).
MONITORING
Monitoring Frequency:
Bi-Annually
Monitoring Data Source:
Patient Survey
PLANNING REQUIREMENTS
Are plans required and if so, at what frequency?
CCG – No. Area Team - Yes, annual for 2014/15 to 2018/19 via AT DC Template.
Everyone Counts: Planning for Patients 2014/15 - 2018/19: Technical Definitions for Clinical
Commissioning Groups and Area Teams
90
E.D.10: Total Number of Sight Tests per 100,000 Population
DEFINITIONS
Detailed Descriptor:
General Ophthalmic Services - Activity Total number of sight tests per 100,000 population.
Lines Within Indicator (Units):
Data Definition:
Numerator: Number Of Sight Tests. Denominator: ONS mid year population estimates. Please see https://catalogue.ic.nhs.uk/publications/primary-care/eye-care/gene-opht-serv-acti-stat-eng-2013/gos-eng-12-13-begin-guide.pdf
MONITORING
Monitoring Frequency:
Annually
Monitoring Data Source:
HSCIC – General Opthalmics
PLANNING REQUIREMENTS
Are plans required and if so, at what frequency?
CCG – No. Area Team - Yes, annual for 2014/15 to 2018/19 via AT DC Template.

Everyone Counts: Planning for Patients 2014/15 - 2018/19: Technical Definitions for Clinical
Commissioning Groups and Area Teams
91
E.D.11: Percentage of Tints per Voucher
DEFINITIONS
Detailed Descriptor:
General Opthalmic Services - Quality and Innovation Percentage of tints per voucher.
Lines Within Indicator (Units):
Data Definition:
Numerator – Total number of tints. Denominator – Total number of vouchers. Please see https://catalogue.ic.nhs.uk/publications/primary-care/eye-care/gene-opht-serv-acti-stat-eng-2013/gos-eng-12-13-begin-guide.pdf.
MONITORING
Monitoring Frequency:
Annually
Monitoring Data Source:
HSCIC – General Opthalmics
PLANNING REQUIREMENTS
Are plans required and if so, at what frequency?
CCG – No. Area Team - Yes, annual for 2014/15 to 2018/19 via AT DC Template.

Everyone Counts: Planning for Patients 2014/15 - 2018/19: Technical Definitions for Clinical
Commissioning Groups and Area Teams
92
E.D.12 : Percentage of Repairs per Voucher and Percentage of Replacements per Voucher
DEFINITIONS
Detailed Descriptor:
General Ophthalmic Services - Quality and Innovation Percentage of repairs per voucher and percentage of replacements per voucher.
Lines Within Indicator (Units):
Data Definition:
Indicator 1: Repairs per voucher. Numerator: Total number of repairs. Denominator: Total number of vouchers. Indicator 2: Replacements per voucher. Numerator: Total number of replacements. Denominator: Total numbers of vouchers. Please see https://catalogue.ic.nhs.uk/publications/primary-care/eye-care/gene-opht-serv-acti-stat-eng-2013/gos-eng-12-13-begin-guide.pdf .
MONITORING
Monitoring Frequency:
Annually
Monitoring Data Source:
HSCIC – General Opthalmics
PLANNING REQUIREMENTS
Are plans required and if so, at what frequency?
CCG – No. Area Team - Yes, annual for 2014/15 to 2018/19 via AT DC Template.

Everyone Counts: Planning for Patients 2014/15 - 2018/19: Technical Definitions for Clinical
Commissioning Groups and Area Teams
93
E.D.13: Percentage of Prisms per Voucher
DEFINITIONS
Detailed Descriptor:
General Ophthalmic Services - Quality and Innovation Percentage of prisms per voucher.
Lines Within Indicator (Units):
Data Definition:
Numerator: Total number of prisms. Denominator: Total number of vouchers. Please see https://catalogue.ic.nhs.uk/publications/primary-care/eye-care/gene-opht-serv-acti-stat-eng-2013/gos-eng-12-13-begin-guide.pdf.
MONITORING
Monitoring Frequency:
Annually
Monitoring Data Source:
HSCIC – General Opthalmics
PLANNING REQUIREMENTS
Are plans required and if so, at what frequency?
CCG – No. Area Team - Yes, annual for 2014/15 to 2018/19 via AT DC Template.

Everyone Counts: Planning for Patients 2014/15 - 2018/19: Technical Definitions for Clinical
Commissioning Groups and Area Teams
94
Everyone Counts – Annex E Measures
E.E.1: Percentage of all NHS England Patients receiving Treatment within 18 Weeks of Referral
DEFINITIONS
Detailed Descriptor::
Percentage of all NHS patients (X24 Coded) receiving treatment within 18 weeks of referral.
Lines Within Indicator (Units):
Data Definition:
Numerator: Total number of pathways (admitted, non admitted or incomplete) where the patient waited 18 weeks or less for treatment. Denominator: Total number of referred patients within defined period.
MONITORING
Monitoring Frequency:
Monthly
Monitoring Data Source:
http://www.england.nhs.uk/statistics/statistical-work-areas/rtt-waiting-times/
ACCOUNTABILITY
What success looks like, Direction, Milestones:
Performance to be sustained at or above the operational standards set out. These standards are:
90% for admitted pathways, 95% for non-admitted pathways 92% for incomplete pathways.
Timeframe/Baseline:
Rationale:
See Indicator E.B.1-3
PLANNING REQUIREMENTS
Are plans required and if so, at what frequency?
CCG - No. Area Team – No.

Everyone Counts: Planning for Patients 2014/15 - 2018/19: Technical Definitions for Clinical
Commissioning Groups and Area Teams
95
E.E.2: Percentage of NHS England Patients waiting 6 Weeks or more for Diagnostic Tests
DEFINITIONS
Detailed Descriptor:
Percentage of NHS England (X24 coded) patients waiting 6 weeks or more for diagnostic tests.
Lines Within Indicator (Units):
Data Definition:
Numerator: Number of patients (whose treatment is commissioned by NHS England) waiting for a diagnostic test. Denominator: The total number of patients waiting at the end of the period.
MONITORING
Monitoring Frequency:
Monthly
Monitoring Data Source:
http://www.england.nhs.uk/statistics/statistical-work-areas/diagnostics-waiting-times-and-activity/monthly-diagnostics-waiting-times-and-activity/
ACCOUNTABILITY
What success looks like, Direction, Milestones:
Performance should be in line with the operational standard, with no more than 1% of all patients waiting more than 6 weeks for diagnostic tests.
Timeframe/Baseline:
Rationale:
See Indicator E.B.4
PLANNING REQUIREMENTS
Are plans required and if so, at what frequency?
CCG - No. Area Team – No.

Everyone Counts: Planning for Patients 2014/15 - 2018/19: Technical Definitions for Clinical
Commissioning Groups and Area Teams
96
Everyone Counts – Annex F Measures
E.F.1: Population Vaccination Coverage – Dtap / IPV / Hib (1 year old).
DEFINITIONS
Detailed Descriptor::
Population vaccination coverage - Dtap / IPV / Hib (1 year old).
Lines Within Indicator (Units):
Data Definition:
Numerator: Total number of children who received the completed course of DTaP/IPV/Hib vaccine at any time before or on their first birthday. Denominator: Total number of resident children whose first birthday falls within the time period.
MONITORING
Monitoring Frequency:
Quarterly
Monitoring Data Source:
PHE-COVER Publications; in PHOF: COVER is published approximately in the last month of the quarter following the reported quarter (i.e. Q1 data would be published at the end of September). Annual data is published in late September.
ACCOUNTABILITY
What success looks like, Direction, Milestones:
Performance to be sustained at or above the operational standard of 94.7%.
Timeframe/Baseline:
2011-12
Rationale:
Please see the Public Health Outcomes Framework https://www.gov.uk/government/publications/healthy-lives-healthy-people-improving-outcomes-and-supporting-transparency.
PLANNING REQUIREMENTS
Are plans required and if so, at what frequency?
CCG – No. Area Team - Yes, self-certification for 2014/15 to 2018/19 against nationally set criteria via AT DC Template.
Everyone Counts: Planning for Patients 2014/15 - 2018/19: Technical Definitions for Clinical
Commissioning Groups and Area Teams
97
E.F.2: Population Vaccination Coverage – MenC (1 year old).
DEFINITIONS
Detailed Descriptor::
Population vaccination coverage – MenC (1 year old).
Lines Within Indicator (Units):
Data Definition:
Numerator: Total number of children who received the completed course of MenC vaccine at any time by their first birthday. Denominator: Total number of resident children whose first birthday falls within the time period.
MONITORING
Monitoring Frequency:
Quarterly
Monitoring Data Source:
PHE COVER Publications; in PHOF
ACCOUNTABILITY
What success looks like, Direction, Milestones:
Performance to be sustained at or above the operational standard of 93.9%.
Timeframe/Baseline:
2011-12
Rationale:
Please see the Public Health Outcomes Framework https://www.gov.uk/government/publications/healthy-lives-healthy-people-improving-outcomes-and-supporting-transparency.
PLANNING REQUIREMENTS
Are plans required and if so, at what frequency?
CCG – No. Area Team - Yes, self-certification for 2014/15 to 2018/19 against nationally set criteria via AT DC Template.

Everyone Counts: Planning for Patients 2014/15 - 2018/19: Technical Definitions for Clinical
Commissioning Groups and Area Teams
98
E.F.3: Population Vaccination Coverage – PCV (1 year old)
DEFINITIONS
Detailed Descriptor::
Population vaccination coverage - PCV (1 year old).
Lines Within Indicator (Units):
Data Definition:
Numerator: Total number of children who received 2 doses of PCV vaccine at any time by their first birthday. Denominator: Total number of resident children whose first birthday falls within the time period.
MONITORING
Monitoring Frequency:
Quarterly
Monitoring Data Source:
PHE COVER Publications; in PHOF
ACCOUNTABILITY
What success looks like, Direction, Milestones:
Performance to be sustained at or above the operational standard of 94.2%.
Timeframe/Baseline:
2011-12
Rationale:
Please see the Public Health Outcomes Framework https://www.gov.uk/government/publications/healthy-lives-healthy-people-improving-outcomes-and-supporting-transparency
PLANNING REQUIREMENTS
Are plans required and if so, at what frequency?
CCG – No. Area Team - Yes, self-certification for 2014/15 to 2018/19 against nationally set criteria via AT DC Template.

Everyone Counts: Planning for Patients 2014/15 - 2018/19: Technical Definitions for Clinical
Commissioning Groups and Area Teams
99
E.F.4: Population Vaccination Coverage – Dtap / IPV / Hib (2 years old)
DEFINITIONS
Detailed Descriptor:
Population vaccination coverage - Dtap / IPV / Hib (2 years old).
Lines Within Indicator (Units):
Data Definition:
Numerator: Total number of children who received 3 doses of DTaP/IPV/Hib vaccine at any time by their second birthday. Denominator: Total number of resident children whose second birthday falls within the time period.
MONITORING
Monitoring Frequency:
Quarterly
Monitoring Data Source:
PHE COVER Publications; in PHOF
ACCOUNTABILITY
What success looks like, Direction, Milestones:
Performance to be sustained at or above the operational standard of 96.1%.
Timeframe/Baseline:
2011-12
Rationale:
Please see the Public Health Outcomes Framework https://www.gov.uk/government/publications/healthy-lives-healthy-people-improving-outcomes-and-supporting-transparency.
PLANNING REQUIREMENTS
Are plans required and if so, at what frequency?
CCG – No. Area Team - Yes, self-certification for 2014/15 to 2018/19 against nationally set criteria via AT DC Template.

Everyone Counts: Planning for Patients 2014/15 - 2018/19: Technical Definitions for Clinical
Commissioning Groups and Area Teams
100
E.F.5: Population Vaccination Coverage – PCV Booster (2 years old)
DEFINITIONS
Detailed Descriptor:
Population vaccination coverage - PCV booster vaccination (2 years old).
Lines Within Indicator (Units):
Data Definition:
Numerator: Total number of children who received 1 dose of PCV booster vaccine on or after their first birthday and at any time up to their second birthday. Denominator: Total number of resident resident children whose second birthday falls within the time period.
MONITORING
Monitoring Frequency:
Quarterly
Monitoring Data Source:
PHE COVER Publications; in PHOF
ACCOUNTABILITY
What success looks like, Direction, Milestones:
Performance to be sustained at or above the operational standard of 91.5%.
Timeframe/Baseline:
2011-12
Rationale:
Please see the Public Health Outcomes Framework https://www.gov.uk/government/publications/healthy-lives-healthy-people-improving-outcomes-and-supporting-transparency.
PLANNING REQUIREMENTS
Are plans required and if so, at what frequency?
CCG – No. Area Team - Yes, self-certification for 2014/15 to 2018/19 against nationally set criteria via AT DC Template.

Everyone Counts: Planning for Patients 2014/15 - 2018/19: Technical Definitions for Clinical
Commissioning Groups and Area Teams
101
E.F.6: Population Vaccination Coverage – Hib / MenC Booster (2 years old)
DEFINITIONS
Detailed Descriptor:
Population vaccination coverage - Hib / MenC booster (2 years old).
Lines Within Indicator (Units):
Data Definition:
Numerator: Total number of children who received 1 dose of Hib/MenC booster vaccine on or after their first birthday and at any time up to their second birthday. Denominator: Number of resident children whose second birthday falls within the time period.
MONITORING
Monitoring Frequency:
Quarterly
Monitoring Data Source:
PHE COVER Publications; in PHOF
ACCOUNTABILITY
What success looks like, Direction, Milestones:
Performance to be sustained at or above the operational standard of 92.3%.
Timeframe/Baseline:
2011-12
Rationale:
Please see the Public Health Outcomes Framework https://www.gov.uk/government/publications/healthy-lives-healthy-people-improving-outcomes-and-supporting-transparency.
PLANNING REQUIREMENTS
Are plans required and if so, at what frequency?
CCG – No. Area Team - Yes, self-certification for 2014/15 to 2018/19 against nationally set criteria via AT DC Template.

Everyone Counts: Planning for Patients 2014/15 - 2018/19: Technical Definitions for Clinical
Commissioning Groups and Area Teams
102
E.F.7: Population Vaccination Coverage – MMR for One Dose (2 years old)
DEFINITIONS
Detailed Descriptor:
Population vaccination coverage - MMR for one dose (2 years old).
Lines Within Indicator (Units):
Data Definition:
Numerator: Total number of children who received one dose of MMR vaccine on or after their first birthday and at any time up to their second birthday. Denominator: Total number of resident children whose second birthday falls within the time period.
MONITORING
Monitoring Frequency:
Quarterly
Monitoring Data Source:
PHE COVER Publications; in PHOF
ACCOUNTABILITY
What success looks like, Direction, Milestones:
Performance to be sustained at or above the operational standard of 91.2%.
Timeframe/Baseline:
2011-12
Rationale:
Please see the Public Health Outcomes Framework https://www.gov.uk/government/publications/healthy-lives-healthy-people-improving-outcomes-and-supporting-transparency.
PLANNING REQUIREMENTS
Are plans required and if so, at what frequency?
CCG – No. Area Team - Yes, self-certification for 2014/15 to 2018/19 against nationally set criteria via AT DC Template..

Everyone Counts: Planning for Patients 2014/15 - 2018/19: Technical Definitions for Clinical
Commissioning Groups and Area Teams
103
E.F.8: Population Vaccination Coverage – MMR for One Dose (5 years old)
DEFINITIONS
Detailed Descriptor:
Population vaccination coverage - MMR for one dose (5 years old).
Lines Within Indicator (Units):
Data Definition:
Numerator: Total number of children who received one dose of MMR on or after their first birthday and at any time up to their fifth birthday. Denominator: Total number of resident children whose fifth birthday falls within the time period.
MONITORING
Monitoring Frequency:
Quarterly
Monitoring Data Source:
PHE COVER Publications; in PHOF
ACCOUNTABILITY
What success looks like, Direction, Milestones:
Performance to be sustained at or above the operational standard of 92.9%.
Timeframe/Baseline:
2011-12
Rationale:
Please see the Public Health Outcomes Framework https://www.gov.uk/government/publications/healthy-lives-healthy-people-improving-outcomes-and-supporting-transparency.
PLANNING REQUIREMENTS
Are plans required and if so, at what frequency?
CCG – No. Area Team - Yes, self-certification for 2014/15 to 2018/19 against nationally set criteria via AT DC Template.

Everyone Counts: Planning for Patients 2014/15 - 2018/19: Technical Definitions for Clinical
Commissioning Groups and Area Teams
104
E.F.9: Population Vaccination Coverage – MMR for Two Doses (5 years old)
DEFINITIONS
Detailed Descriptor:
Population vaccination coverage - MMR for two doses (5 years old).
Lines Within Indicator (Units):
Data Definition:
Numerator: Total number of children who received two doses of MMR on or after their first birthday and at any time up to their fifth birthday. Denominator: Total number of resident children whose fifth birthday falls within the time period.
MONITORING
Monitoring Frequency:
Quarterly
Monitoring Data Source:
PHE COVER Publications; in PHOF
ACCOUNTABILITY
What success looks like, Direction, Milestones:
Performance to be sustained at or above the operational standard of 86.0%.
Timeframe/Baseline:
2011-12
Rationale:
Please see the Public Health Outcomes Framework https://www.gov.uk/government/publications/healthy-lives-healthy-people-improving-outcomes-and-supporting-transparency.
PLANNING REQUIREMENTS
Are plans required and if so, at what frequency?
CCG – No. Area Team - Yes, self-certification for 2014/15 to 2018/19 against nationally set criteria via AT DC Template.
Everyone Counts: Planning for Patients 2014/15 - 2018/19: Technical Definitions for Clinical
Commissioning Groups and Area Teams
105
E.F.10: Population vaccination coverage - Hib / MenC booster (5 years old)
DEFINITIONS
Detailed Descriptor:
Population vaccination coverage - Hib / Men C booster (5 years).
Lines Within Indicator (Units):
Data Definition:
Numerator: Number of children at age five years who have received one booster dose of Hib/MenC vaccine. Denominator: Number of resident children whose fifth birthday falls within the time period.
MONITORING
Monitoring Frequency:
Quarterly
Monitoring Data Source:
PHE COVER Publications; in PHOF
ACCOUNTABILITY
What success looks like, Direction, Milestones:
Performance to be sustained at or above the operational standard of 88.6%.
Timeframe/Baseline:
2011-12
Rationale:
Please see the Public Health Outcomes Framework https://www.gov.uk/government/publications/healthy-lives-healthy-people-improving-outcomes-and-supporting-transparency.
PLANNING REQUIREMENTS
Are plans required and if so, at what frequency?
CCG – No. Area Team - Yes, self-certification for 2014/15 to 2018/19 against nationally set criteria via AT DC Template.

Everyone Counts: Planning for Patients 2014/15 - 2018/19: Technical Definitions for Clinical
Commissioning Groups and Area Teams
106
E.F.11: Population Vaccination Coverage - Hepatitis B (1 year old)
DEFINITIONS
Detailed Descriptor:
Population vaccination coverage - Hepatitis B (1 year old).
Lines Within Indicator (Units):
Data Definition:
Numerator: Total number of infants with maternal Hep B positive status who have received three doses of Hepatitis B vaccine before their first birthday. Denominator: Total number of children reaching their first birthday during the specified evaluation period with maternal Hep B positive status as defined in the Hepatitis B chapter of the immunisation against diseases "Green Book".
MONITORING
Monitoring Frequency:
Quarterly
Monitoring Data Source:
PHE COVER Publications; in PHOF
ACCOUNTABILITY
What success looks like, Direction, Milestones:
Performance to be sustained at the achievable level of 100.0%
Timeframe/Baseline:
Rationale:
Please see the Public Health Outcomes Framework https://www.gov.uk/government/publications/healthy-lives-healthy-people-improving-outcomes-and-supporting-transparency.
PLANNING REQUIREMENTS
Are plans required and if so, at what frequency?
CCG – No. Area Team - Yes, self-certification for 2014/15 to 2018/19 against nationally set criteria via AT DC Template.

Everyone Counts: Planning for Patients 2014/15 - 2018/19: Technical Definitions for Clinical
Commissioning Groups and Area Teams
107
E.F.12: Population Vaccination Coverage - Hepatitis B (2 years old)
DEFINITIONS
Detailed Descriptor:
Population vaccination coverage - Hepatitis B (2 years old).
Lines Within Indicator (Units):
Data Definition:
Numerator: Total number of infants with maternal Hep B positive status who have received four doses of Hepatitis B vaccine before their second birthday. Denominator: Total number of children reaching their second birthday during the specified evaluation period with maternal Hep B positive status as defined in the Hepatitis B chapter of the immunisation against infectious diseases green book.
MONITORING
Monitoring Frequency:
Quarterly
Monitoring Data Source:
PHE COVER Publications ; in PHOF
ACCOUNTABILITY
What success looks like, Direction, Milestones:
Performance to be sustained at the achievable level of 100.0%
Timeframe/Baseline:
Rationale:
Please see the Public Health Outcomes Framework https://www.gov.uk/government/publications/healthy-lives-healthy-people-improving-outcomes-and-supporting-transparency.
PLANNING REQUIREMENTS
Are plans required and if so, at what frequency?
CCG – No. Area Team - Yes, self-certification for 2014/15 to 2018/19 against nationally set criteria via AT DC Template.

Everyone Counts: Planning for Patients 2014/15 - 2018/19: Technical Definitions for Clinical
Commissioning Groups and Area Teams
108
E.F.13: Population Vaccination Coverage - HPV
DEFINITIONS
Detailed Descriptor:
Population vaccination coverage – HPV.
Lines Within Indicator (Units):
Data Definition:
Numerator: Number of females in Year 8 (aged 12 to 13 years) who have received all three doses of the HPV vaccine. Denominator: Number of females in Year 8 (aged 12 to 13 years).
MONITORING
Monitoring Frequency:
Annually
Monitoring Data Source:
https://www.gov.uk/government/publications/hpv-vaccine-uptake-1-september-2011-to-31-august-2012
ACCOUNTABILITY
What success looks like, Direction, Milestones:
Performance to be sustained at the operational standard of 86.8%
Timeframe/Baseline:
2011-12 academic year.
Rationale:
Please see the Public Health Outcomes Framework https://www.gov.uk/government/publications/healthy-lives-healthy-people-improving-outcomes-and-supporting-transparency.
PLANNING REQUIREMENTS
Are plans required and if so, at what frequency?
CCG – No. Area Team - Yes, self-certification for 2014/15 to 2018/19 against nationally set criteria via AT DC Template.

Everyone Counts: Planning for Patients 2014/15 - 2018/19: Technical Definitions for Clinical
Commissioning Groups and Area Teams
109
E.F.14: Population Vaccination Coverage - PPV
DEFINITIONS
Detailed Descriptor:
Population vaccination coverage – PPV.
Lines Within Indicator (Units):
Data Definition:
Numerator: Number of adults aged 65 years and over who have received one dose of PPV. Denominator: Number of resident adults aged 65 years and over.
MONITORING
Monitoring Frequency:
Annually
Monitoring Data Source:
http://immunisation.dh.gov.uk/ppv-uptake-report-2012/
ACCOUNTABILITY
What success looks like, Direction, Milestones:
Performance to be sustained at the operational standard of 68.3%.
Timeframe/Baseline:
2011-12
Rationale:
Please see the Public Health Outcomes Framework https://www.gov.uk/government/publications/healthy-lives-healthy-people-improving-outcomes-and-supporting-transparency.
PLANNING REQUIREMENTS
Are plans required and if so, at what frequency?
CCG – No. Area Team - Yes, self-certification for 2014/15 to 2018/19 against nationally set criteria via AT DC Template.

Everyone Counts: Planning for Patients 2014/15 - 2018/19: Technical Definitions for Clinical
Commissioning Groups and Area Teams
110
E.F.15: Population Vaccination Coverage - Flu (aged 65+)
DEFINITIONS
Detailed Descriptor:
Population vaccination coverage - Flu (aged 65+).
Lines Within Indicator (Units):
Data Definition:
Numerator: Number of adults aged 65 years and over vaccinated between 1st September and 31st January of the financial year. Denominator: Number of resident adults aged 65 years and over.
MONITORING
Monitoring Frequency:
Annually
Monitoring Data Source:
https://www.gov.uk/government/publications/seasonal-flu-vaccine-uptake-in-gp-patients-1-september-2012-to-31-january-2013
ACCOUNTABILITY
What success looks like, Direction, Milestones:
Performance to be sustained at or above the operational standard of 73.4%.
Timeframe/Baseline:
2012-13
Rationale:
Please see the Public Health Outcomes Framework https://www.gov.uk/government/publications/healthy-lives-healthy-people-improving-outcomes-and-supporting-transparency.
PLANNING REQUIREMENTS
Are plans required and if so, at what frequency?
CCG – No. Area Team - Yes, self-certification for 2014/15 to 2018/19 against nationally set criteria via AT DC Template.

Everyone Counts: Planning for Patients 2014/15 - 2018/19: Technical Definitions for Clinical
Commissioning Groups and Area Teams
111
E.F.16: Population Vaccination Coverage - Flu (at risk individuals)
DEFINITIONS
Detailed Descriptor:
Population vaccination coverage - Flu (at risk individuals).
Lines Within Indicator (Units):
Data Definition:
Numerator: Number of individuals aged between six months and 65 years who are in a clinical risk group (as defined in the immunisation against infectious diseases and detailed in the read-code specification produced by PRIMIS+) vaccinated between 1st September 2011 and 31st January 2012 of the financial year. Denominator: Number of individuals aged between six months and 65 years who are in a clinical risk group (as defined in the immunisation against infectious diseases and detailed in the read-code specification produced by PRIMIS+).
MONITORING
Monitoring Frequency:
Annually
Monitoring Data Source:
https://www.gov.uk/government/publications/seasonal-flu-vaccine-uptake-in-gp-patients-1-september-2012-to-31-january-2013
ACCOUNTABILITY
What success looks like, Direction, Milestones:
Performance to be sustained at or above the operational standard of 51.3%.
Timeframe/Baseline:
2012-13
Rationale:
Please see the Public Health Outcomes Framework https://www.gov.uk/government/publications/healthy-lives-healthy-people-improving-outcomes-and-supporting-transparency
PLANNING REQUIREMENTS
Are plans required and if so, at what frequency?
CCG – No. Area Team - Yes, self-certification for 2014/15 to 2018/19 against nationally set criteria via AT DC Template.
Everyone Counts: Planning for Patients 2014/15 - 2018/19: Technical Definitions for Clinical
Commissioning Groups and Area Teams
112
E.F.17: Percentage of Pregnant Women eligible for Infectious Disease Screening who are tested for HIV, leading to a Conclusive Result
DEFINITIONS
Detailed Descriptor:
HIV coverage: The percentage of pregnant women eligible for infectious disease screening who are tested for HIV, leading to a conclusive result.
Lines Within Indicator (Units):
Data Definition:
Numerator: Total number of eligible women for whom a conclusive screening result was available for HIV at the day of report, including women who were known to be HIV positive at booking and were therefore not retested and women who transfer in for care during the reporting period with documented evidence of a screening test result during the pregnancy (and therefore not retested). Denominator: Total number of pregnant women booked for antenatal care during the reporting period, or presenting in labour without previously having booked for antenatal care, excluding: women who miscarry, opt for termination or transfer out between booking and testing (i.e. prior to testing). ‘Booking’ is the point at which the woman first sees a midwife for an antenatal booking history, when details of the current pregnancy are documented in a maternity record (which may be an information system or a paper-based record). The maternity unit where a woman is booked to deliver is responsible for capturing and reporting these data.
MONITORING
Monitoring Frequency:
Quarterly
Monitoring Data Source:
UKNSC; in PHOF
ACCOUNTABILITY
What success looks like, Direction, Milestones:
Timeframe/Baseline:
Acceptable level ≥ 90.0%
Rationale:
Please see the NHS Screening KPI guidance at http://www.screening.nhs.uk/kpi/data-collection.

Everyone Counts: Planning for Patients 2014/15 - 2018/19: Technical Definitions for Clinical
Commissioning Groups and Area Teams
113
PLANNING REQUIREMENTS
Are plans required and if so, at what frequency?
CCG – No. Area Team - Yes, self-certification for 2014/15 to 2018/19 against nationally set criteria via AT DC Template.

Everyone Counts: Planning for Patients 2014/15 - 2018/19: Technical Definitions for Clinical
Commissioning Groups and Area Teams
114
E.F.18: Percentage of Women Booked for Antenatal Care, as reported by Maternity Services, who have a Screening Test for Syphilis, Hepatitis B and Susceptibility to Rubella leading to a Conclusive Result
DEFINITIONS
Detailed Descriptor:
Syphilis, hepatitis B and susceptibility to rubella uptake: The percentage of women booked for antenatal care, as reported by maternity services, who have a screening test for syphilis, hepatitis B and susceptibility to rubella leading to a conclusive result.
Lines Within Indicator (Units):
Data Definition:
Numerator: Number of women tested for each infection for whom a conclusive screening result was available for each of the screening tests on the day of the report, including women who were known to be hepatitis B positive at booking and therefore not retested and women who transfer in for care during the reporting period with documented evidence of a screening test result during the pregnancy (and therefore not retested). Denominator: Number of women booked for antenatal care during the reporting period. ‘Booking’ is the point at which the woman first sees a midwife for an antenatal booking history, when details of the current pregnancy are documented in a maternity record (which may be an information system or a paper-based record). The maternity unit where a woman is booked to deliver is responsible for capturing and reporting these data.
MONITORING
Monitoring Frequency:
Quarterly
Monitoring Data Source:
UKNSC; in PHOF
ACCOUNTABILITY
What success looks like, Direction, Milestones:
To be confirmed.
Timeframe/Baseline:
To be confirmed.
Rationale:
Please see the Public Health Outcomes Framework https://www.gov.uk/government/publications/healthy-lives-healthy-people-improving-outcomes-and-supporting-transparency.

Everyone Counts: Planning for Patients 2014/15 - 2018/19: Technical Definitions for Clinical
Commissioning Groups and Area Teams
115
PLANNING REQUIREMENTS
Are plans required and if so, at what frequency?
CCG – No. Area Team - No.

Everyone Counts: Planning for Patients 2014/15 - 2018/19: Technical Definitions for Clinical
Commissioning Groups and Area Teams
116
E.F.19: Percentage of Pregnant Women eligible for Antenatal Sickle Cell and Thalassaemia Screening for whom a Conclusive Screening Result is available at the Day of Report
DEFINITIONS
Detailed Descriptor:
The percentage of pregnant women eligible for antenatal sickle cell and thalassaemia screening for whom a conclusive screening result is available at the day of report.
Lines Within Indicator (Units):
Data Definition:
Numerator: The total number of eligible women for whom a conclusive screening result was available for sickle cell and thalassaemia at the day of report, including women for whom a previous result is known (and were therefore not retested) and women who transfer in for care during the reporting period with documented evidence of a screening test result during the pregnancy (and were therefore not retested). In areas with low prevalence of sickle cell disease, this may include women at low risk of sickle cell disease for whom haemoglobinopathy analysis (E.F. HPLC) has not been indicated by FOQ. Denominator: Total number of pregnant women booked for antenatal care during the reporting period, or presenting in labour without previously having booked for antenatal care, excluding: women who miscarry, opt for termination or transfer out between booking and testing, or known carriers who had direct access to pre-natal diagnosis.
MONITORING
Monitoring Frequency:
Quarterly
Monitoring Data Source:
UKNSC; in PHOF
ACCOUNTABILITY
What success looks like, Direction, Milestones:
Performance to be sustained at or above the achievable level of 99.0%.
Timeframe/Baseline:
Acceptable level ≥ 95.0%
Rationale:
Please see the NHS Screening KPI guidance at http://www.screening.nhs.uk/kpi/data-collection.

Everyone Counts: Planning for Patients 2014/15 - 2018/19: Technical Definitions for Clinical
Commissioning Groups and Area Teams
117
PLANNING REQUIREMENTS
Are plans required and if so, at what frequency?
CCG – No. Area Team - Yes, self-certification for 2014/15 to 2018/19 against nationally set criteria via AT DC Template.

Everyone Counts: Planning for Patients 2014/15 - 2018/19: Technical Definitions for Clinical
Commissioning Groups and Area Teams
118
E.F.20: Percentage of Babies Registered within the Local Authority area both at Birth and at the Time of Report who are Eligible for Newborn Blood Spot Screening and have a Conclusive Result Recorded on the Child Health Information System within an Effective Timeframe
DEFINITIONS
Detailed Descriptor:
The percentage of babies registered within the local authority area both at birth and at the time of report who are eligible for newborn blood spot screening and have a conclusive result recorded on the Child Health Information System within an effective timeframe.
Lines Within Indicator (Units):
Data Definition:
Numerator: Total number of eligible babies for whom a conclusive screening result for phenylketonuria (PKU) was available within an effective timeframe. Denominator: Eligible babies (denominator) is the total number of babies born within the reporting period, excluding any baby who died before the age of 8 days. For the purposes of this KPI, the cohort includes only babies for whom the previous PCT were responsible at birth and are still responsible for on the last day of the reporting period. The effective timeframe is that a conclusive result for PKU is recorded within the appropriate Child Health Information System by 17 days of age.
MONITORING
Monitoring Frequency:
Quarterly
Monitoring Data Source:
UKNSC; in PHOF
ACCOUNTABILITY
What success looks like, Direction, Milestones:
Performance to be sustained at or above the achievable level of 99.9%.
Timeframe/Baseline:
Acceptable level ≥ 95.0%
Rationale:
Please see the NHS Screening KPI guidance at http://www.screening.nhs.uk/kpi/data-collection.

Everyone Counts: Planning for Patients 2014/15 - 2018/19: Technical Definitions for Clinical
Commissioning Groups and Area Teams
119
PLANNING REQUIREMENTS
Are plans required and if so, at what frequency?
CCG – No. Area Team - Yes, self-certification for 2014/15 to 2018/19 against nationally set criteria via AT DC Template.

Everyone Counts: Planning for Patients 2014/15 - 2018/19: Technical Definitions for Clinical
Commissioning Groups and Area Teams
120
E.F.21: Percentage of Babies Eligible for Newborn Hearing Screening for whom the Screening Process is Complete within 4 Weeks Corrected Age (hospital programmes – well babies, all programmes – NICU babies) or 5 Weeks Corrected Age (community programmes – well babies)
DEFINITIONS
Detailed Descriptor:
The percentage of babies eligible for newborn hearing screening for whom the screening process is complete within 4 weeks corrected age (hospital programmes – well babies, all programmes – NICU babies) or 5 weeks corrected age (community programmes – well babies).
Lines Within Indicator (Units):
Data Definition:
Numerator: Total number of eligible babies for whom a decision about referral or discharge from the screening programme has been made within an effective timeframe. This includes:
Babies for whom a conclusive screening result was available by 4 weeks corrected age (for hospital screening programmes – well babies and all programmes – NICU babies); or
Babies for whom a conclusive screening result was available by 5 weeks corrected age (for community screening programmes – well babies); or
Babies referred to an audiology department because a newborn hearing screening encounter was inconclusive by the above timescales. The ‘screening outcomes’ relating to a complete screen within the national software solution for Hearing Screening are:
Clear response – no follow up required,
Clear response – targeted follow up required,
No clear response – bilateral referral,
No clear response – unilateral referral,
Incomplete – baby/equipment reason,
Incomplete – equipment malfunction,
Incomplete – equipment not available,
Incomplete – screening contraindicated,
Incomplete – baby unsettled. Denominator: Total number of babies born within the reporting period whose mother was registered with a GP practice within the area, or (if not registered with any practice) resident within the area, excluding any baby who died before an offer of screening could be made.

Everyone Counts: Planning for Patients 2014/15 - 2018/19: Technical Definitions for Clinical
Commissioning Groups and Area Teams
121
MONITORING
Monitoring Frequency:
Quarterly
Monitoring Data Source:
UKNSC; in PHOF
ACCOUNTABILITY
What success looks like, Direction, Milestones:
Performance to be sustained at or above the achievable level of 99.5%
Timeframe/Baseline:
Acceptable level ≥ 95.0%
Rationale:
Please see the NHS Screening KPI guidance at http://www.screening.nhs.uk/kpi/data-collection.
PLANNING REQUIREMENTS
Are plans required and if so, at what frequency?
CCG – No. Area Team - Yes, self-certification for 2014/15 to 2018/19 against nationally set criteria via AT DC Template.

Everyone Counts: Planning for Patients 2014/15 - 2018/19: Technical Definitions for Clinical
Commissioning Groups and Area Teams
122
E.F.22: Percentage of Babies Eligible for the Newborn Physical Examination who were Tested within 72 hours of Birth
DEFINITIONS
Detailed Descriptor:
The percentage of babies eligible for the newborn physical examination who were tested within 72 hours of birth.
Lines Within Indicator (Units):
Data Definition:
Numerator: Total number of eligible babies for whom a decision about referral (including a decision that no referral is necessary as a result of the newborn examination) for each of the conditions tested has been made within an effective timeframe.
Denominator: Total number of babies born within the reporting period whose mother was registered with a GP practice within the local authority area or (if not registered with any practice) resident within the local authority area, excluding any baby who died before an offer of screening could be made.
The ‘effective timeframe’ for the newborn physical examination is that a conclusive screening result should be available within 72 hours of birth.
ACCOUNTABILITY
What success looks like, Direction, Milestones:
Performance to be sustained at or above the achievable level of 99.5%
Timeframe/Baseline:
Acceptable level ≥ 95.0%
Rationale:
Please see the NHS Screening KPI guidance at http://www.screening.nhs.uk/kpi/data-collection.
PLANNING REQUIREMENTS
Are plans required and if so, at what frequency?
CCG – No. Area Team - Yes, self-certification for 2014/15 to 2018/19 against nationally set criteria via AT DC Template.

Everyone Counts: Planning for Patients 2014/15 - 2018/19: Technical Definitions for Clinical
Commissioning Groups and Area Teams
123
E.F.23: Percentage of those offered Screening for Diabetic Eye Screening who attend a Digital Screening Event
DEFINITIONS
Detailed Descriptor:
The percentage of those offered screening for diabetic eye screening who attend a digital screening event.
Lines Within Indicator (Units):
Data Definition:
Numerator: The number of subjects offered screening who attended a digital screening encounter during the reporting period. Denominator: The number of eligible people with diabetes offered a screening encounter which was due to take place within the reporting period.
MONITORING
Monitoring Frequency:
Monitoring Data Source:
UKNSC KPI DE1 http://www.screening.nhs.uk/getdata.php?id=15805
ACCOUNTABILITY
What success looks like, Direction, Milestones:
Performance to be sustained at or above the achievable level of 80.0%
Timeframe/Baseline:
Acceptable level ≥ 70.0%
Rationale:
Please see the NHS Screening KPI guidance at http://www.screening.nhs.uk/kpi/data-collection.
PLANNING REQUIREMENTS
Are plans required and if so, at what frequency?
CCG – No. Area Team - Yes, self-certification for 2014/15 to 2018/19 against nationally set criteria via AT DC Template.

Everyone Counts: Planning for Patients 2014/15 - 2018/19: Technical Definitions for Clinical
Commissioning Groups and Area Teams
124
E.F.24: Abdominal Aortic Aneurysm (AAA) KPI
DEFINITIONS
Detailed Descriptor:
Abdominal Aortic Aneurysm (AAA) KPIs
Lines Within Indicator (Units):
Data Definition:
Numerator: Number of eligible subjects offered a realisable opportunity to attend for initial screening during the reporting period, whether they actually attended or otherwise. Denominator: Number of eligible men in their 65th year to whom the screening programme propose that a screening encounter during the reporting period should be offered. When calculated annually, this indicator must report all eligible men in their 65th year, excluding any who die or move out of the area of responsibility for the Local Programme before screening can be offered.
MONITORING
Monitoring Frequency:
Indicator in Development
Monitoring Data Source:
Indicator in Development
ACCOUNTABILITY
What success looks like, Direction, Milestones:
Performance to be sustained at the achievable level of 100.0%
Timeframe/Baseline:
Acceptable level ≥ 90.0%
Rationale:
Please see the NHS Screening KPI guidance at http://www.screening.nhs.uk/kpi/data-collection.
PLANNING REQUIREMENTS
Are plans required and if so, at what frequency?
CCG – No. Area Team - No.

Everyone Counts: Planning for Patients 2014/15 - 2018/19: Technical Definitions for Clinical
Commissioning Groups and Area Teams
125
E.F.25: Breast Cancer Screening Coverage - Percentage of Eligible Women Screened Adequately within the Previous 3 Years on 31st March
DEFINITIONS
Detailed Descriptor:
Breast Cancer Screening Coverage: Percentage of eligible women screened adequately within the previous 3 years on 31st March.
Lines Within Indicator (Units):
Data Definition:
Numerator: Number of women aged 53–70 resident in the area (determined by postcode of residence) with a screening test result recorded in the previous three years. Denominator: Number of women aged 53–70 resident in the area (determined by postcode of residence) who are eligible for breast screening at a given point in time. Women ineligible for screening, and thus not included in the coverage figures, are those whose recall has been ceased for clinical reasons (for example, due to previous bilateral mastectomy).
MONITORING
Monitoring Frequency:
Published Annually. Data made available Monthly.
Monitoring Data Source:
PHOF
ACCOUNTABILITY
What success looks like, Direction, Milestones:
Performance to be sustained at or above the operational standard of 76.9%
Timeframe/Baseline:
Published in 2012
Rationale:
Please see the Public Health Outcomes Framework https://www.gov.uk/government/publications/healthy-lives-healthy-people-improving-outcomes-and-supporting-transparency.
PLANNING REQUIREMENTS
Are plans required and if so, at what frequency?
CCG – No. Area Team - Yes, self-certification for 2014/15 to 2018/19 against nationally set criteria via AT DC Template.
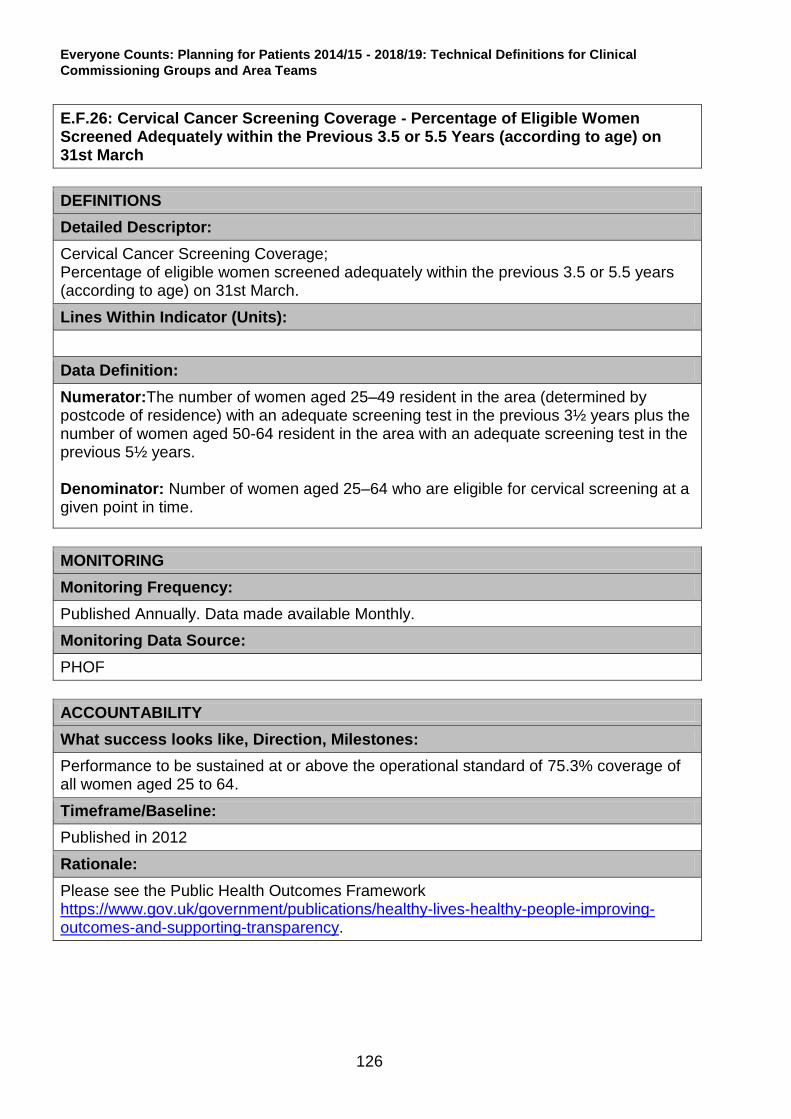
Everyone Counts: Planning for Patients 2014/15 - 2018/19: Technical Definitions for Clinical
Commissioning Groups and Area Teams
126
E.F.26: Cervical Cancer Screening Coverage - Percentage of Eligible Women Screened Adequately within the Previous 3.5 or 5.5 Years (according to age) on 31st March
DEFINITIONS
Detailed Descriptor:
Cervical Cancer Screening Coverage; Percentage of eligible women screened adequately within the previous 3.5 or 5.5 years (according to age) on 31st March.
Lines Within Indicator (Units):
Data Definition:
Numerator:The number of women aged 25–49 resident in the area (determined by postcode of residence) with an adequate screening test in the previous 3½ years plus the number of women aged 50-64 resident in the area with an adequate screening test in the previous 5½ years. Denominator: Number of women aged 25–64 who are eligible for cervical screening at a given point in time.
MONITORING
Monitoring Frequency:
Published Annually. Data made available Monthly.
Monitoring Data Source:
PHOF
ACCOUNTABILITY
What success looks like, Direction, Milestones:
Performance to be sustained at or above the operational standard of 75.3% coverage of all women aged 25 to 64.
Timeframe/Baseline:
Published in 2012
Rationale:
Please see the Public Health Outcomes Framework https://www.gov.uk/government/publications/healthy-lives-healthy-people-improving-outcomes-and-supporting-transparency.

Everyone Counts: Planning for Patients 2014/15 - 2018/19: Technical Definitions for Clinical
Commissioning Groups and Area Teams
127
PLANNING REQUIREMENTS
Are plans required and if so, at what frequency?
CCG – No. Area Team - Yes, self-certification for 2014/15 to 2018/19 against nationally set criteria via AT DC Template.

Everyone Counts: Planning for Patients 2014/15 - 2018/19: Technical Definitions for Clinical
Commissioning Groups and Area Teams
128
E.F.27: Bowel Cancer Screening - Uptake and Coverage over 2.5 Years
DEFINITIONS
Detailed Descriptor:
Bowel Cancer screening - uptake and coverage over 2.5 years.
Lines Within Indicator (Units):
Data Definition:
Numerator: Number of people invited with a definitive screening result. Denominator: Number of people aged 60-69 invited for bowel screening.
MONITORING
Monitoring Frequency:
Quarterly - Monthly updates are available through CSPNS but they are not published elsewhere.
Monitoring Data Source:
CSPNS
ACCOUNTABILITY
What success looks like, Direction, Milestones:
Performance to be sustained at or above the operational standard of 55.8%.
Timeframe/Baseline:
Start of programme to end – August 2013
Rationale:
PLANNING REQUIREMENTS
Are plans required and if so, at what frequency?
CCG – No. Area Team - Yes, self-certification for 2014/15 to 2018/19 against nationally set criteria via AT DC Template.

Everyone Counts: Planning for Patients 2014/15 - 2018/19: Technical Definitions for Clinical
Commissioning Groups and Area Teams
129
E.F.28: Number of FTE Health Visitors
DEFINITIONS
Detailed Descriptor:
Number of FTE health visitors.
Lines Within Indicator (Units):
Data Definition:
Number of FTE health visitors in post relative to agreed trajectory.
MONITORING
Monitoring Frequency:
MDS: Monthly actuals supplied by HSCIC compared to agreed trajectories (set in advance of year).
Monitoring Data Source:
HSCIC Workforce HV MDS
ACCOUNTABILITY
What success looks like, Direction, Milestones:
1. Agree 2014/15 monthly trajectories to deliver Area Team contribution to total additional 4200 in partnership with LETB based on supply, historic attrition and service turnover. For agreement and sign off by 1st April 2014 by NHS England area teams, regions, central support team, HEE (incl. LETBs)and DH.
2. Ensure delivery of additional workforce capacity in line with monthly trajectories measured using HSCIC MDS.
Timeframe/Baseline:
2014-15 trajectories to be agreed between NHS England area teams, regions, central support team, HEE, LETBs DH by March 2014. These will demonstrate system-wide commitment to delivering agreed Area Team contributions to make up the additional 4200 FTE required by 31st March 2015.
Rationale:
7A agreement between NHS England and SoS requires: Delivery of an additional 4200 health visitors by 2015.
PLANNING REQUIREMENTS
Are plans required and if so, at what frequency?
CCG – No. Area Team - Yes, annual for 2014/15 to 2018/19 via AT DC Template.

Everyone Counts: Planning for Patients 2014/15 - 2018/19: Technical Definitions for Clinical
Commissioning Groups and Area Teams
130
Everyone Counts – Annex G Measures
E.G.1: Deliver Chronic Disease Care to the Same Standard of Process and Outcomes as is Required by the National Service Frameworks for: Diabetes, CHD and Long Term Conditions and Mental Health
DEFINITIONS
Detailed Descriptor:
NHS England Health commissioned services in prison (including commissioned social care services) deliver chronic disease care to the same standard of process and outcomes as is required by the National Service Frameworks for: Diabetes, CHD and Long Term Conditions and Mental Health (Green Indicator).
Lines Within Indicator (Units):
Data Definition:
MONITORING
Monitoring Frequency:
Annually
Monitoring Data Source:
PHPQI
ACCOUNTABILITY
What success looks like, Direction, Milestones:
100% of prisons self-reporting Green Indicator.
Timeframe/Baseline:
Rationale:
Patients achieve health care benefits that meet their individual needs through health care decisions and services based on what assessed research evidence has shown provides effective clinical outcomes. NICE technology assessments and the National Service Frameworks provide a good practice base from which deliver equivalence of service for all NHS users, including prisoners. The Quality Outcomes Framework (QOF) is a series of standard performance measurement indicators used by GPs and as such, reporting to support its use is available in SystmOne GP. The same reporting is also available in SystmOne Prison, the point to note being that the indicators and measurements remain exactly the same as for a GP practice - there has been no tailoring to reflect a potential change of circumstances applicable to a different care setting.

Everyone Counts: Planning for Patients 2014/15 - 2018/19: Technical Definitions for Clinical
Commissioning Groups and Area Teams
131
Guidance on preparing QOF reports is available from within SystmOne via F1, the standard access route for help on the system. A pdf file providing a brief user guide and answering common queries is available via this route. This indicator seeks to assure commissioners of primary care services that services delivered within prisons are at an equivalent standard to those delivered in the wider community.
PLANNING REQUIREMENTS
Are plans required and if so, at what frequency?
CCG – No. Area Team - Yes, self-certification for 2014/15 to 2018/19 against nationally set criteria via AT DC Template.

Everyone Counts: Planning for Patients 2014/15 - 2018/19: Technical Definitions for Clinical
Commissioning Groups and Area Teams
132
E.G.2: Access and Waiting Time
DEFINITIONS
Detailed Descriptor:
Access and waiting times for outpatient first appointment following written referrals of prisoners are equivalent to those experienced by the local population and fall within any specified targets for the NHS or locally agreed improved targets where relevant (Green Indicator).
Lines Within Indicator (Units):
Data Definition:
MONITORING
Monitoring Frequency:
Annually
Monitoring Data Source:
PHPQI
ACCOUNTABILITY
What success looks like, Direction, Milestones:
100% of prisons self-reporting Green Indicator.
Timeframe/Baseline:
Rationale:
Standards for better health core standard 18 states that ‘healthcare organisations enable all members of the population to access services equally and offer choice in access to services and treatment equitably’. Prisoners are members of the population and as such are entitled to the same level of service access to the general population. Difficulties do arise due to the significant movements of prisoners - such movement should not have a detrimental effect upon their access to services and subsequent waiting times.
PLANNING REQUIREMENTS
Are plans required and if so, at what frequency?
CCG – No. Area Team - Yes, self-certification for 2014/15 to 2018/19 against nationally set criteria via AT DC Template.

Everyone Counts: Planning for Patients 2014/15 - 2018/19: Technical Definitions for Clinical
Commissioning Groups and Area Teams
133
E.G.3: Percentage of Identified Patients with a Learning Disability have an Annual Health Check
DEFINITIONS
Detailed Descriptor:
Percentage of Identified Patients with a Learning Disability have an Annual Health Check.
Lines Within Indicator (Units):
Data Definition:
MONITORING
Monitoring Frequency:
Annually
Monitoring Data Source:
PHPQI
ACCOUNTABILITY
What success looks like, Direction, Milestones:
100%
Timeframe/Baseline:
Rationale:
Following Valuing People in 2001 and the Disability Discrimination Act 2005, both the prison service and NHS have an obligation to ensure equitable and accessible services for people with a learning disability. At any one time, approximately 24,600 prisoners have a learning difficulty that could affect their ability to function within the prison environment. Of these around 5,700 have an IQ less than 70 and may be eligible for Learning Disability services. People with learning disabilities have greater health needs and shorter life expectancy than the general population and have difficulty accessing health care services, which is often exacerbated by attendant communication difficulties.
PLANNING REQUIREMENTS
Are plans required and if so, at what frequency?
CCG – No. Area Team - Yes, annual for 2014/15 to 2018/19 via AT DC Template

Everyone Counts: Planning for Patients 2014/15 - 2018/19: Technical Definitions for Clinical
Commissioning Groups and Area Teams
134
E.G.4: Percentage of all Prisoners Returning to Prison from any other Mental Health facility following treatment under the Mental Health Act (including section 3, 47, 48) are Accompanied by a 117 Aftercare Programme
DEFINITIONS
Detailed Descriptor:
All prisoners returning to prison from any other Mental Health facility following treatment under the Mental Health Act (including section 3, 47, 48) are accompanied by a 117 aftercare programme (Green Indicator).
Lines Within Indicator (Units):
Data Definition:
MONITORING
Monitoring Frequency:
Annually
Monitoring Data Source:
PHPQI
ACCOUNTABILITY
What success looks like, Direction, Milestones:
100% of prisons self-reporting Green Indicator.
Timeframe/Baseline:
Rationale:
Section 117 gives the statutory authorities a duty to make arrangements for a person's continuing support and care. It applies to people who have been detained under Section 3, Section 37, Section 47, and Section 48. Aftercare should be planned with the patient, their family and carers, as well as professionals, looking at both health and social care needs. Section 117 ensures continuity of care. The type of aftercare required will depend on the circumstances of the individual and health. Section 117 gives a considerable discretion to health and local authorities as to the nature of the services that can be provided. As people move through the prison estate their mental health record may be lost from areas to area, it is therefore imperative that the health care unit source previous mental health history.
PLANNING REQUIREMENTS
Are plans required and if so, at what frequency?
CCG – No. Area Team - Yes, annual for 2014/15 to 2018/19 via AT DC Template

Everyone Counts: Planning for Patients 2014/15 - 2018/19: Technical Definitions for Clinical
Commissioning Groups and Area Teams
135
© Crown copyright Year 2013
First published 23 December 2013