Embed Size (px)
Citation preview
EVERGLADES NATIONAL PARK
UNITED STATES OF AMERICA (N76)
STATE PARTY REPORT
ON THE STATE OF CONSERVATION OF
EVERGLADES NATIONAL PARK
January 2019
Everglades National Park: 2019 State of Conservation
1
1. Executive Summary
In 1993, Everglades National Park was added to the list of World Heritage Sites in Danger, based
on four key threats to its Outstanding Universal Value (OUV): alterations of the hydrologic regime,
adjacent urban and agricultural growth, increased nutrient pollution, and impacts to the protection
and management of Florida Bay. In 2018, record numbers of wading bird nests “supercolonies”
formed in the southern mangroves of the Park for the first time in eight decades. The same year,
water quality entering the upstream Everglades reached its highest performance level, through a
combination of agricultural source controls and expanded stormwater treatment. During the last
three years, Northeast Shark River Slough (SRS) and Taylor Slough experienced some of their
highest water deliveries on record. These three changes represent major milestones, and combined
indicate that Everglades water flow and water quality improvements are progressing, and that the
ecosystem is positively responding.
In 2006, a series of corrective measures were developed to assess progress toward restoration of the
site’s OUV. Six years later, a suite of hydrological and ecological indicators of integrity were
added. The focus of these site-specific conservation efforts include: re-establishing adequate flows
of clean water into the Northeast SRS basin, reducing groundwater seepage losses into the adjacent
eastern developed areas, and redirecting these flows through SRS and Taylor Slough to provide
needed freshwater flows to Florida Bay. Full implementation of three key foundation projects
formed the original basis of the 2006 corrective measures: the Modified Water Deliveries (MWD)
and Canal-111 South Dade (C-111) projects directly adjacent to the site, and water quality
improvements under the State of Florida’s Everglades Construction Project (ECP) in the upstream
watershed. By 2018, construction on all of these projects was complete, and we have been
progressively receiving water flow and water quality benefits. These combined projects will help to
restore more natural marsh water depths and flooding durations, stabilize estuarine salinities, and
advance the recovery of healthy native plant and animal populations.
The Florida Bay ecosystem had been slowly recovering following the seagrass die-off and algal
blooms of 2015–2016. In September 2017, Florida Bay was impacted by Hurricane Irma. The
storm produced significant wind and storm surge damage to large swaths of mangrove forests and
seagrass communities. Since 2018, we have been observing substantial recovery, indicating that
these ecosystems are rather resilient to natural disturbances. Unusually wet conditions during the
2017 and 2018 reporting period provided an unplanned “test” of the new Modified Water
Deliveries and C-111 project infrastructure. While Northeast SRS and Taylor Slough wetlands
experienced record high water levels, and Florida Bay salinities were reduced, concerns over
Tamiami Trail roadway instability and eastern flood protection required Northeast SRS inflows to
be periodically terminated. This illustrates that addition infrastructure improvements are needed.
In 2016, the Tamiami Trail Next Steps (TTNS) project began construction on additional bridges
and roadway raising, further removing this sheetflow impediment, and the State’s Restoration
Strategies project expanded upstream water quality treatment. In 2016 and 2018, the Central
Everglades Planning Project (CEPP) and the Everglades Agricultural Area (EAA) Reservoir were
authorized by Congress. Completion of these four next generation projects over the coming years is
critical for our continuing progress in achieving the site’s Desired State of Conservation.
Everglades National Park: 2019 State of Conservation
2
World Heritage Committee Decision 42 COM 7A.42 Forty-Second Session (Manama, Bahrain, 2018)
Everglades National Park (United States of America) (N76)
Decision: 42 COM 7A.42
The World Heritage Committee,
1. Having examined Document WHC/18/42.COM/7A,
2. Recalling Decision 41 COM 7A.1, adopted at its 41st session (Krakow, 2017),
3. Recalls its request to the State Party to submit to the World Heritage Centre, by 1 February
2019, an updated report on the state of conservation of the property and the implementation of the
adopted corrective measures, for examination by the World Heritage Committee at its 43rd session
in 2019;
4. Decides to retain Everglades National Park (United States of America) on the List of
World Heritage in Danger.
Everglades National Park: 2019 State of Conservation
3
2. Response to the Decisions of the World Heritage Committee
Everglades National Park (ENP) was established in 1947 with a mission unique within the National
Park Service (NPS). In contrast to earlier parks in the western United States featuring dramatic
landscapes, this park was set aside to protect the abundant and diverse biological resources of its
vast subtropical wetlands and coastal/marine ecosystems. Achieving this mission has proven
challenging in light of the extensive human modifications to south Florida, resulting primarily from
alterations in hydrology and land use. The Park is located at the southernmost end of the highly
modified greater Everglades ecosystem that originates in the Kissimmee River headwaters near
Orlando, Florida. The flow of water in this once continuous watershed was altered by the
construction of canals and levees beginning in the 1880’s. The initial private and State of Florida
drainage efforts were expanded by the Army Corps of Engineers, creating the Central and Southern
Florida (C&SF) Flood Control Project, which was authorized by the U.S. Congress in 1948. The
primary result has been unnaturally large discharges from Lake Okeechobee to the Caloosahatchee
and St. Lucie estuaries, and limited flows southward into the Everglades and southern estuaries.
The C&SF Project created a series of five Water Conservation Areas (WCAs) upstream of the
Park, which act as shallow reservoirs to retain wet season rainfall and provide dry season water
deliveries. These WCAs have further altered the volume, distribution, and timing of water
deliveries to the Park.
These long-term changes in the upstream watershed have had tremendous implications within
ENP: Northeast Shark River Slough (NESRS) and Taylor Slough are persistently too dry; Western
Shark River Slough (WSRS) is frequently too wet; and the West Coast estuaries and Florida Bay
are generally starved for freshwater and suffer from high salinity levels. This has promoted
mangrove encroachment into the adjacent freshwater wetlands. The altered wetland and estuarine
functions have profoundly affected both the habitats and the fish and wildlife that depend on them.
In recognition of these threats, and at the request of the U.S. Government, ENP was inscribed on
the list of World Heritage Sites in Danger in 1993. Four major threats have negatively affected the
Park for many decades, and were highlighted at the time of the World Heritage listing.
Threat 1. Alterations of the hydrologic regime have resulted in changes in the volume,
distribution, and timing of water flows to the Park.
Response: Construction is now complete on the Modified Water Deliveries (MWD) and Canal-
111 South Dade (C-111) foundation projects, and we are currently receiving increased water
volumes and flow distribution benefits within Northeast SRS and Taylor Slough. Upcoming
next generation restoration projects such as the Western Everglades Restoration Project
(WERP), Central Everglades (CEPP), and the Everglades Agricultural Area Reservoir (EAAR)
all show promise for improving water flow into the Park. While these projects may take up to a
decade or more to be fully realized, they indicate that the State and Federal governments are
committed to additional projects, which focus on reducing the adverse impacts of upstream
water management on the Park.
Threat 2. Adjacent urban and agricultural growth has resulted in flood protection
improvements, which can drain the park’s eastern wetlands. These areas are also locations where
invasive exotic species enter the Park from man-made environments.
Everglades National Park: 2019 State of Conservation
4
Response: In 2012, a 5-mile long partially penetrating seepage barrier was constructed along
the Park’s northeastern boundary by a local rock-mining company. This was built to mitigate for
increased seepage linked to their adjacent activities. By the end of 2018, a combination of
seepage collection canals and water detention areas were completed along a 20-mile stretch
from the 8.5 Square Mile Area down to the Frog Pond. This water management system was
designed to create a hydraulic ridge between the higher water levels in the Everglades and the
lower water levels in the eastern developed areas. While this system relies on pumping excess
water when it’s available, if can offset some of the impacts of flood protection operations along
the eastern urban/agricultural areas, thereby retaining more surface water in the wetlands of the
Park.
Threat 3. Increased nutrient pollution has resulted from the transport of agricultural and urban
runoff into the Park, causing alterations in native flora and fauna.
Response: The State of Florida’s Everglades Construction Project (ECP) was fully operational
in 2012, and has substantially improved water quality throughout much of the Everglades
marsh. Upcoming projects such as the Western Everglades Restoration Project, Central
Everglades, and the Everglades Agricultural Area Reservoir all include additional planned water
quality treatment features, and show promise for further improving water quality in the Park.
Threat 4. Impacts to the protection and management of Florida Bay have resulted from
reduced or re-directed freshwater inflows, and increased nutrient loadings.
Response: Implementation of the MWD and C-111 projects has resulted in more water being
retained in Northeast SRS and Taylor Slough, and directs this water into Florida Bay. By 2018,
two new pump stations were added adjacent to the Taylor Slough headwaters, strategically
located to reduce Park seepage losses and increase water flow into Florida Bay. As more of the
upstream restoration projects come online, larger volumes of clean water can be delivered
through the Park wetlands and into Florida Bay.
In spite of the long history of alterations to the Everglades watershed, the natural resources
protected by Everglades National Park provide key ecosystem services to the regional human
population. These services include water storage and treatment, recharge of the surficial aquifer,
buffering against the impacts of tropical storms and hurricanes, as well as economic benefits
associated with tourism, including recreational and commercial fishing. In 2011, ENP-related
tourism generated 146.8 M USD in economic benefit locally, and provided 2,408 jobs. Benefits to
the wider, world community include: 1) the protection and preservation of a unique mix of
temperate and subtropical habitats and species, 2) the maintenance of a refuge for rare, threatened,
and endangered species, and 3) climate modification benefits from carbon sequestration within the
freshwater wetlands, mangrove forests, and seagrasses along the Gulf Coast and within Florida
Bay.
This report, prepared in 2019 for examination by the World Heritage Committee at its 43rd session,
is the fourth biennial report to be submitted by the NPS, and includes the full agreed upon physical
and ecological indicators of integrity. This report follows the recommended format of the World
Heritage Committee and responds to the recent decisions of the Committee. It provides updated
Everglades National Park: 2019 State of Conservation
5
information on progress toward implementing the corrective measures and describes recently
detected changes in the status of the indicators of integrity. The information presented is intended
to assist in decision-making for the state of conservation of this site, which is on the List of World
Heritage Sites in Danger. The report will also gauge the overall response of Park ecosystems to
factors such as changes in water management, climatic change, invasive exotic species, and
implementation of Everglades Restoration projects.
The current reporting period (2017–2018), shows continuing progress in the initial foundation
projects, but also included unusual weather conditions associated with three consecutive years of
above average hurricane intensity. High rainfall in September 2017, associated with Hurricane
Irma, led to period of record water levels within the park and adjacent areas. In 2018, similar high
rainfall events in May 2018 (Tropical Storm Alberto) and September 2018 (Tropical Storm
Gordon) made 2018 one of the wettest years on record throughout south Florida. In spite of this, a
2017 dry season drought exacerbated the long-term water deficit stresses on Florida Bay leading to
hypersaline conditions that had negative ecological consequences.
Construction of the MWD and C-111 foundation projects was complete in 2018. This provided the
capacity for additional water flows into the Northeast SRS and Taylor Slough regions of the Park.
These two locations have not seen these types of high water conditions in decades. Though
unplanned and uncontrolled, these unusual wet and dry weather events give us insight into how the
ecosystem may respond to future flow restoration conditions and increased water storage. There are
some notable outcomes that confirm that Everglades restoration efforts are on track:
There have been no large-scale, damaging fires within Everglades National Park in over a
decade,
In spite of seagrass die-offs and hurricanes, Florida Bay continues to support healthy
sportfish populations and a world-class recreational fishery,
Hurricane Irma’s record rainfall did not cause extreme or prolonged flooding in adjacent
agricultural and urban areas, nor did it result in nutrient enriched or contaminated water
entering into the Park,
With 3.3-miles of Tamiami Trail bridging, and the MWD and C-111 project infrastructure
now complete, we at the cusp of realizing significant improvements in water deliveries to
Northeast SRS and Taylor Slough.
2a. Progress in Implementing the 2006 Corrective Measures
Substantial progress has been made since the 2017 SOC report, in implementing the majority of
the corrective measures developed in 2006. In 1994, three water management foundation projects
were proposed to address the threats to Everglades National Park, identified at the time the site
was added to the list of World Heritage Sites in Danger. Today, all three of these initial water
flow and water quality restoration projects have been constructed, and their full operational
benefits should be in place by approximately June 2020. Early results from the post construction
period indicates that flows into Northeast SRS and Taylor Slough are trending upward, while
constraints associated with Tamiami Trail and eastern flood protection still need to be resolved.
Water quality has improved substantially throughout much of the Everglades marsh, but we still
need to resolved SRS water quality exceedances, particularly as we transition quickly, following
Everglades National Park: 2019 State of Conservation
6
marsh dry downs. These findings support the judgement that completion of these initial
foundation projects was not sufficient to deliver the required volumes of clean water needed to
achieve our Desired State of Conservation. Fortunately, a series of four next generation
restoration projects have been authorized, and are moving forward, to address these performance
deficits. The status of each of the 2006 corrective measures is described below, relative to the
originally identified threats.
Threat 1 - Alterations of the Natural Hydrologic Regime
Corrective Measure (CM) 1 focuses on re-establishing water flows into the Northeast Shark
River Slough (SRS) watershed of Everglades National Park. This action requires bringing all of
the privately owned lands in the East Everglades Expansion Area into public ownership (CM
1A), and providing flood protection to any remaining developed areas (CMs 1A/B).
Reestablishing more natural water flows into Northeast SRS also requires the removal of barriers
to natural sheetflow (both within the upstream Water Conservation Areas and along Tamiami
Trail) to reestablish more natural marsh connectivity (CM 1C). All of these actions will support
our efforts to increase water flows back into the historic sloughs and marl prairies, and to restore
more natural water depths and flooding durations within the eastern watersheds of the park.
Corrective Measure 1A addresses the U.S. Congressional requirement to complete acquisition
of approximately 44,000 hectares (109,000 acres) of privately owned land in the East Everglades,
and flood protecting the remaining developed sites, as a prerequisite to restoring water flows into
Northeast SRS.
Status – East Everglades Land Acquisition - Completed: As of July 2016, all 44,000
hectares of the East Everglades were acquired and placed into public ownership. A required
land exchange with the Florida Power and Light Company (relocating a planned utility
corridor) was completed, including transfer of title. The three commercial airboat operations
and two radio tower sites along Tamiami Trail were also brought into federal ownership.
Status – Flood Protection for Commercial Sites - Underway: Protecting the remaining five
developed sites along Tamiami Trail from flooding is required before we can significantly
increase water flows into Northeast SRS. Flood protection plans for these sites are currently
being implemented (through a combination of government and private actions). These flood
protection cures will enable continued business services at the commercial airboat and radio
tower sites, as restoration moves forward. The flood protection features will be in place to
allow the Modified Water Deliveries and C-111 projects to be fully operational by June 2020.
Corrective Measure 1B recognized the need to complete flood mitigation features in the 8.5
Square Mile Area and to develop a new water control plan, prior to implementing the MWD
project full flow benefits.
Status – Flood Mitigation in the 8.5 Square Mile Area - Completed: Construction of the
originally planned flood mitigation features that protect the 8.5 Square Mile Area were initially
completed in 2012, and an additional seepage collection canal and water control structure were
completed in 2018. The features in the 8.5 Square Mile Area not only provide flood mitigation
to the agricultural and residential lands, but also are part of the seepage management system
Everglades National Park: 2019 State of Conservation
7
along the eastern border of the park. This project is also linked to Corrective Measure 4A, since
the C-111 North Detention Area receives stormwater runoff from the 8.5 SMA flood mitigation
system (via the S-357 pump station). Monitoring of these features to determine their year-round
benefits is underway. Full operation of this system is linked to the completion of the Combined
Operational Plan, expected in June 2020.
Status – Development of MWD Water Control Plan - Underway: Corrective Measure 1B
also recognized the need to develop a new water control plan that will improve rainfall-based
water deliveries and promote increased sheetflow to ENP, while maintaining flood control and
water supply requirements. This water control plan has been addressed through a combination
of incremental field testing of the evolving water management infrastructure, and the
development of a final Combined Operational Plan (COP) that will control the operations of
the combined Modified Water Deliveries and C-111 project infrastructure. During the current
reporting period (2017–2018), we completed the first incremental field test (increments 1.1-
1.2), and in September 2018 we initiated increment 2 operations. Under this 2nd increment, we
further relaxed the operational constraints and raised the L-29 canal stage by up to one foot,
allowing us to increase water flows into Northeast Shark River Slough. The final COP will
build on the lessons learned during the incremental field tests. The next report will document
the level of restoration that can be achieved, following completion of the full suite of MWD
and C-111 project components.
Corrective Measure 1C recognizes the benefits of removing barriers to enhance sheetflow and
marsh connectivity between ENP and the upstream Everglades. These barriers included the canals
and levees within Water Conservation Area 3 (WCA 3) upstream of the park, as well as the barrier
created by the eastern Tamiami Trail roadway. When the corrective measures were developed in
2006, both the MWD project and the regional-scale Comprehensive Everglades Restoration Plan
(CERP) contemplated improving water conveyance, sheetflow, and marsh connectivity between
WCA3A, WCA3B, and Northeast SRS. The MWD project would accomplish this by constructing
water conveyance structures in the levees between WCA-3A/3B and Northeast SRS, and adding
structures/plugs in the L-67A canal to promote sheetflow. CERP contemplated going further, by
degrading large portions of these levees and backfilling segments of their associated canals.
Status – MWD/TTNS/CERP Project Sheetflow and Marsh Connectivity - Limited
Progress: The MWD project was formally closed out without constructing the planned water
conveyance and sheetflow improvements in the upstream WCAs, due to cost concerns and
Tamiami Trail design limitations. Several of these features have been carried over into the
CEPP design. In addition, a pilot project (referred to as the Decompartmentalization Physical
Model) constructed a new water control structure to move water across the levee between
WCA-3A and WCA-3B, while testing options for degrading a downstream levee, and
backfilling its associated canal.
The Tamiami Trail Next Steps (TTNS) project began construction in 2016 and was
substantially completed in Feb. 2019. The Phase 1 included construction of 2.3-miles of
additional bridging to further promote sheetflow. Planning for the TTNS phase 2 project began
in 2018, and will include raising/reconstructing the remaining 6.5-miles of un-bridged
roadway. The NPS applied for a Federal Highway Administration grant in Dec. 2018 to cover
Everglades National Park: 2019 State of Conservation
8
this work, along with matching State of Florida funding. If approved, phase 2 planning would
be completed in 2019-2020 and construction would be complete in late 2022. This action
would remove the roadway as a flow constraint, meeting the full CERP conveyance
requirements.
The planned southern CEPP components include three additional water conveyance structures
in the levee between WCA-3A and WCA-3B, and expansion of the DPM levee removal and
backfilling within WCA-3B. While the CEPP Project was authorized by Congress in 2016,
detailed planning and construction has been delayed due to limited Federal appropriations.
These CEPP southern components are expected to be completed by 2030. While some of the
MWD and CERP proposed features, such as plugs and/or backfilling in an internal canal within
WCA-3A (the L-67 canal) are not included, these features may be reevaluated in a future phase
of the CERP Decompartmentalization and Sheetflow Enhancement project. The loss of this
canal plugging reduces sheetflow enhancement benefits, and may have water quality
implications for the park.
Threat 2 – Adjacent Urban and Agricultural Growth
Past actions to improve flood protection in adjacent urban and agricultural areas have reduced
water levels within ENP wetlands and freshwater flows to Florida Bay, due to increased eastward
groundwater seepage. This problem could be compounded as Everglades restoration progressively
increases water flows into the park. Corrective measure 2 addresses these ENP groundwater losses,
through the development of seepage management systems. First federal lands within ENP needed
to be exchanged with lands owned by the State of Florida (CM 2A), to support construction of the
C-111 project water detention areas and pump stations (CM 2C). Completion of the MWD and C-
111 Combined Operational Plan (COP) will formalize the water management operations, and will
optimize the return of groundwater seepage back to the park (CM 2B). Reducing seepage losses
also helps to reestablish flows into the historic sloughs, thereby restoring water depths and flooding
durations within the park.
Corrective Measure 2A recognizes that completion of a land exchange between the South Florida
Water Management District (SFWMD) and NPS is required to construct the C-111 South
Detention Areas (SDA).
Status – C-111 Land Exchange – Completed: The land exchange between the NPS and the
SFWMD was approved by Congress, and no additional real estate within ENP was required for
completion of the C-111 SDAs.
Corrective Measure 2B recognized the need to develop a new water control plan that will
improve rainfall-based water deliveries and promote increased sheetflow to ENP, while
maintaining flood control and water supply requirements (see also CM 1B).
Status – Development of C-111 Water Control Plan - Underway: This water control plan
has been addressed through a combination of incremental field testing of the evolving water
management infrastructure, and the development of the COP that will control the operations of
the combined Modified Water Deliveries and C-111 project infrastructure. The COP is
expected to be complete in June 2020, and will build on the lessons learned during the
Everglades National Park: 2019 State of Conservation
9
incremental field tests. The next SOC report will document the level of restoration that can be
achieved, following completion of the full suite of MWD and C111 project components.
Corrective Measure 2C requires completion of construction of the C-111 detention-area features
from the 8.5 Square Mile Area south to the area known as the Frog Pond. These features include
northern and southern components. The detention areas reduce seepage losses along the portions
of the eastern ENP boundary.
Status – Construction of the C-111 Detention Areas – Completed: The S-332B/C/D pump
stations land the C-111 South Detention Area (SDA) was operational by 2009. Construction of
the C-111 Northern Detention Area was not completed until early 2017. The northern detention
area now receives runoff from the 8.5 SMA via the S-357 pump station. These detention areas
have been shown to maintain higher water levels in upper Taylor Slough, but they are not very
efficient (with 70-80% of the pumped water quickly returning back to the eastern canals via
groundwater seepage). In response, the Army Corps recently completed a new internal levee
system to hold the pumped water along the western edge of the detention areas.
Threat 3 - Increased Nutrient Pollution from Upstream Agricultural Areas
Water entering the park must be low in nutrients, with concentrations of phosphorus in surface
water <10 parts per billion (ppb), as established by State of Florida and Federal water quality
standards. Total phosphorus (TP) concentrations above this level led to imbalances in native flora
and fauna. Corrective Measure 3 focuses on improving water quality upstream of the Water
Conservation Areas and ENP, by implementing agricultural best management practices (BMPs),
and constructing man-made stormwater treatment areas (CM 3A). Reducing ENP inflow nutrient
concentrations and redistributing phosphorus loadings by enhancing sheetflow, will contribute to
healthier freshwater Everglades wetlands, as well as a healthier estuary in Florida Bay.
Corrective Measure 3A focuses on implementing upstream water quality source controls such as
BMPs, and construction of engineered wetlands or stormwater treatment areas (STAs) to achieve
the long-term TP limits for water flowing into Shark River Slough and the Taylor Slough/Coastal
Basins.
Status – Implementation of Agricultural BMPs and STAs – Completed: The State of
Florida passed the Everglades Forever Act in 1994, mandating the implementation of
Everglades Agricultural Area BMPs and requiring the construction of 45,000 acres of STAs, as
part of the Everglades Construction Project (ECP). The ECP was completed by 2006, and the
DOI and the State worked together to expand the STAs by an additional 12,000 acres in 2012.
In addition, the agricultural BMPs were designed to achieve a 25% reduction to total
phosphorus (TP) loads entering the Everglades, but they have performed better than expected,
achieving a 57% TP load reduction.
Status – Implementation of Longer-Term Water Quality Projects – Significant Progress:
In 2010 the U.S. Environmental Protection Agency (EPA) determined that additional actions
were needed to achieve the States’ Everglades water quality standards, beyond the Everglades
Construction Project. The EPA’s amended determination required establishment of a new water
quality based effluent limit (WQBEL) for STA outflows. The State developed the Restoration

Everglades National Park: 2019 State of Conservation
10
Strategies project, which further expanded the STAs within the EAA, and included
construction of new flow equalization basins (FEBs) to regulate the rate of water inflows to the
STAs. The full Restoration Strategies project is scheduled to be complete in 2025, and is
expected to achieve the WQBEL requirements by approximately 2029. Fortunately, the first
new Flow Equalization Basin (referred to as A-1) was constructed in the central EAA flow path
in 2015, and represents the water quality feature that most directly affects water quality
entering the park. In 2018, a very wet year, the combination of the A-1 FEB and its associated
STA produced an annual average outflow TP concentration of approximately 11 ppb, achieving
the WQBEL.
In order for Central Everglades project to redirect new water flows from Lake Okeechobee
southward into the Everglades, an additional 14,000-acre FEB (A-2) was originally planned to
provide the required water quality treatment. In 2017, the State of Florida recommended that this
shallow FEB be replaced with the 10,000-acre Everglades Agricultural Area deep water reservoir,
and a 6,500-acre STA. The new EAA storage reservoir will help retain wet season flows currently
being discharged into the northern estuaries, and pass these flows southward when treatment
capacity is available. The additional flows from Lake Okeechobee (essentially a new water
source) and the existing EAA runoff will need to meet the State’s water quality standard
(WQBEL) before these flows are discharged into the Everglades, including the Park. Finally, a
new Western Everglades Restoration Project (WERP) was initiated after 2015, which focuses on
addressing water flow and water quality improvements in predominately agricultural lands to the
west of the Everglades Agricultural Area. This project is still in the planning phase, but is
expected to improve water deliveries to the Miccosukee Reservation and WCA-3A, prior to the
water entering into western SRS.
Threat 4 - Impacts to the Protection and Management of Florida Bay
Decades of drainage and upstream water diversions have decreased the volume, and altered the
timing and distribution of freshwater flows into Florida Bay. Salinities in the nearshore areas of
Florida Bay have also risen in response to sea level rise. Increased freshwater flows would help to
maintain longer hydroperiods in the coastal freshwater wetlands, reducing soil oxidation and
slowing down the impacts of saltwater intrusion. Corrective measure 4 therefore focuses on
increasing water deliveries through Taylor Slough and the ENP Eastern Panhandle, and reducing
groundwater seepage losses from the coastal wetlands (CMs 4A/B). These actions will reduce
salinity fluctuations in the nearshore and open water areas of Florida Bay, which will promote
healthier and more diverse seagrass communities, as well as increase fish and invertebrates that
support coastal wading bird communities. Our longer-term Everglades restoration efforts, such as
the Central Everglades and EAA Reservoir projects focus on recreating the original/pre-drainage
water flow connection between Lake Okeechobee and the Everglades.
Corrective Measure 4A calls for completion of construction of the C-111 Detention Areas from
the 8.5 Square Mile Area to the Frog Pond. Implementing a new rainfall-based water delivery
formula, as part of the MWD and C-111 Combined Operational Plan, will also reduce the
likelihood of nutrient enrichment via pumping water from the C-111 canal system back into the
ENP marshes and Florida Bay.
Everglades National Park: 2019 State of Conservation
11
Status – C-111 Project Construction – Completed: The S-332B/C/D pump stations and the
C-111 South Detention Area (SDA) were operational by 2009. Construction of the C-111
Northern Detention Area was completed in early 2017. The northern detention area now
receives runoff from the 8.5 SMA via the S-357 pump station. These detention areas have been
shown to maintain higher water levels in upper Taylor Slough, but they are not very efficient
(with approx. 80% of the pumped water quickly returning back to the eastern canals via
groundwater seepage). In response, the Army Corps recently completed a new internal levee
system to hold the pumped water closer to the western edge of the detention areas. The benefits
of this fully completed water management system will be described in the next SOC report.
Status - New Operational Plan – Underway: Development of a new rainfall-based water
delivery formula is being addressed through a combination of incremental field testing of the
evolving water management infrastructure, and the development of a final Combined
Operational Plan (COP) that will control the operations of the combined Modified Water
Deliveries and C-111 project infrastructure. The COP is expected to be complete in June 2020,
and will build on the lessons learned during the incremental field tests. The next SOC report
will document the level of restoration that can be achieved, following completion of the full
suite of MWD and C-111 project components.
Corrective Measure 4B calls for completion of the C-111 Spreader Canal project, and
development of a revised water control plan to include rainfall-driven operations. These new
features would reduce seepage losses from ENP, and direct flows toward Florida Bay.
Status – C-111 Western Spreader Canal Construction – Completed: The SFWMD
completed construction of the C-111 Western Spreader Canal project in 2012, and efforts to
evaluate the operational benefits and impacts of this project are ongoing. The Eastern phase of
the C-111 Spreader Canal project has not yet moved forward, but the project is scheduled to
begin planning in 2023.
Status - New Operational Plan – Underway: The final operations for these features have been
incorporated into the Combined Operational Plan for the MWD and C-111 projects. In the last
year, two additional pumps were added at the S-199 and S-200 pump stations, and the overall
pumping scheme has been increased as part of the most recent incremental field tests.
Preliminary information suggests that the more aggressive pumping does help to retain water in
upper Taylor Slough, but it is unclear if these benefits extend southward into Florida Bay. The
eastern areas of Florida Bay appear to be responding positively to the increased C-111 westward
pumping, while these benefits for the critical areas in central Florida Bay have not yet been
observed.
2b. Is the Timeframe for Implementing the Corrective Measures Suitable?
The 2015 SOC report acknowledged that we face a significant challenge in implementing the
corrective measures, while assuring that the objectives for restoration are not lost during the
extended planning, authorization, and funding process. The original 2006 corrective measures
were linked to three water management projects: the Modified Water Deliveries, Canal-111, and
Everglades Construction Project, which were all authorized by 1994. This date corresponds with
Everglades National Park: 2019 State of Conservation
12
the timeframe when the site was placed on the list of World Heritage Sites in Danger. As of
2019, all three of these initial restoration projects have been constructed and are now operational,
while the final combined operational plan for the MWD and C-111 projects has been delayed
until June 2020.
What we have determined over this long period of implementation is that completion of these
foundation projects was not sufficient to deliver the volumes of clean water to achieve our
Desired State of Conservation. This is due to a combination of: (1) lost benefits resulting from
design, cost, and/or operational changes required to balance ecosystem restoration, water supply,
and flood control goals, (2) the continued deterioration of the overall Everglades ecosystem, and
(3) our evolving understanding of the specific water flow and water quality targets needed to
achieve our long-term restoration goals. In response to these restoration performance shortfalls,
the 2015 SOC report added additional larger-scale water management projects, to our
descriptions of the corrective measures needed to achieve the Desired State of Conservation.
These include the State of Florida’s Restoration Strategies project to further improve water
quality, and the Central Everglades/EAA Reservoir project will redirect Lake Okeechobee
discharges southward, back into the Everglades. While both of these projects are progressing,
their full benefits are not expected to be realized before approximately 2030. The most recent
project that will further improve water quality entering WCA-3A and ultimately the Park is the
Western Everglades Restoration Project that is still in the planning phase.
The National Park Service will continue to track our progress in achieving the corrective measures
and indicators of integrity that define the Desired State of Conservation for Everglades National
Park. At the same time, the status and trends for a larger set of system-wide ecological indicators
are also being evaluated for the entire south Florida ecosystem in the Department of Interior’s
Strategy and Biennial Reports to Congress, which focus on broader Everglades restoration
progress. This report is produced by the South Florida Ecosystem Restoration Working Group and
Science Coordination Group, for dissemination by the South Florida Ecosystem Restoration Task
Force, (http://evergladesrestoration.gov/content/Strategic_Plan_Biennial_Report.html). The
National Park Service’s World Heritage State of Conservation report therefore serves as a subset of
these system-wide indicators, (https://www.nps.gov/ever/learn/nature/worldheritage.htm).
The NPS and the Department of the Interior have actively participated in local and regional
restoration planning and environmental evaluation efforts for decades. We specifically use our
ongoing State of Conservation assessments to shape our restoration recommendations, to more
directly address these park-specific threats. The shorter-term, and more localized MWD and C-111
projects, as well as the regional-scale and longer-term CEPP/EAA Reservoir and Restoration
Strategies projects form a continuum of important corrective measures that will move the park
resources toward the Desired State of Conservation.
Everglades National Park: 2019 State of Conservation
13
2c. Progress Achieved Toward the Desired State of Conservation for the Removal of the Property from the List of World Heritage Sites in Danger
The prior sections of this report have described the progress and challenges in implementing the
correctives measures over the last two decades (e.g., implementation of the Modified Water
Deliveries, C-111, and Everglades Construction Projects). As we have stated, completion of these
water management and water quality treatment projects alone, is not sufficient to deliver the
volumes of clean water into Northeast SRS and reduce groundwater seepage losses to achieve our
Desired State of Conservation. The sections below describe the status and trends of the
hydrological, water quality, and ecological indicators of integrity, for the current reporting period.
The detailed tables describe the specific targets, and compare these metrics for the 2017-2018
reporting period versus the 2011-2012 reporting period (included was the 2013 SOC report).
Hydrological and Water Quality Indicators of Integrity
The current reporting period included unusual weather conditions associated with three consecutive
years of above average hurricane intensity, as well as a major El Nino event in the spring of 2016.
High rainfall in September 2017 (Hurricane Irma) led to period of record water levels within the
park and adjacent areas. In 2018, similar high rainfall events in May 2018 (Tropical Storm Alberto)
and September 2018 (Tropical Storm Gordon), made 2018 one of the highest water flow years on
record throughout south Florida.
Hydrologic Indicators - Northeast SRS Inflows and Water Levels: Water flows from the
upstream Water Conservation Areas into Shark River Slough in water year 2018 (WY18) reached
over 1.6 million acre-feet, the highest annual total inflow volume in 23 years. In spite of this, the
annual total inflow into Northeast SRS reached approximately 300 thousand acre-feet in WY18.
The Northeast SRS inflows were below the established average annual inflow target of 550
thousand ac-ft in WY17 and WY18, and less than 20% of the total SRS inflows passed into
Northeast SRS, versus the established target of 55%. Peak wet season water levels in Northeast
SRS during WY17 and WY18 were some of the highest since the 1980s, even though Northeast
SRS inflows had to be terminated due to water management constraints in both the L-29 canal and
the 8.5 SMA. Reduced wet season inflows to Northeast SRS inflows allowed marsh water levels to
recede quickly. As a result of this operational constraint, the average annual water level at the NE2
gage remained below the dry year target of 7.5 feet in both WY17 and WY18 (see Table 2 for the
status and trend details on the hydrologic metrics).
Water Quality Indicators – Total Phosphorus in Surface Waters and Periphyton: Phosphorus
is the limiting nutrient in the Everglades, and total phosphorus (TP) concentrations in surface water
and plant tissue are good indicators for water quality conditions. The established water quality
metric for the site include TP at the ENP inflow structures and TP in the downstream marsh surface
water. In addition, TP concentrations in periphyton tissue and periphyton biomass were both
measured in the downstream marsh.
For the ENP inflow structures, the water quality goal is to be in compliance with all State of
Florida and Federal standards for total phosphorus. High rainfall in September 2017 (resulting from
Everglades National Park: 2019 State of Conservation
14
Hurricane Irma) caused marsh water levels to rise rapidly throughout the Everglades, re-suspending
nutrients and sediments, and transferring them into the canal system. A rapid spike in TP inflow
concentrations from this unusual event contributed to an exceedance of the TP limit for Shark
River Slough in WY17. Similar high rainfall and rapid marsh water level increases occurred in
WY18, but did not cause a TP exceedance. Phosphorus concentrations across all marsh stations in
our water quality monitoring network indicated the TP levels were below the established limits,
and an improving trend in TP continued during WY17 and WY18. Addressing the causes and
possible remedies for the spikes at ENP inflow structures is a task for an interagency team of water
quality and hydrologic experts in 2019 (see Table 2 for the status and trend details on the water
quality metrics).
Periphyton is an algal/diatom community that represents a large portion of Everglades’ net primary
productivity, and responds quickly to changes in environmental conditions at both small and large
spatial scales. Small increases in phosphorus concentrations can decrease periphyton biomass, shift
periphyton community structure, and adversely impact higher trophic levels. The WY17 and
WY18, measurements of periphyton tissue TP and periphyton biomass at all of the measurement
sites in SRS and Taylor Slough met the established criteria for un-impacted marshes (see Table 2
for the status and trend details for the water quality metrics). A trend of slight decreases in
periphyton biomass was observed in Northeast SRS during WY17 and WY18, but no trend was
detected in Taylor Slough. Future monitoring will determine if there is any cause for concern.
Ecological Indicators in Freshwater Environments
The status of the ecological indicators of integrity in the freshwater marshes are a good reflection
of both the overall health of the park ecosystems, and the progress in achieving the corrective
measures. We focus on freshwater fish and aquatic invertebrates, wading birds, and the American
alligator, which are all a good indicators of our progress in restoring water flows and marsh water
depths.
Freshwater Fauna Indicator – Abundance of Fish and Aquatic Invertebrates: Fish and aquatic
invertebrate assemblages play an important role in Everglades food webs. The factors that
influence the abundance of fish and aquatic invertebrate populations tend to cascade up the food
web, and influence species such as alligators and wading birds. The Desired State of Conservation
is to maximize densities of small-sized freshwater fishes and aquatic invertebrates in a manner
consistent with their expected responses in the pre-drainage Everglades ecosystem. Freshwater fish
and aquatic invertebrate metrics are reported for Shark River Slough (SRS) and Taylor Slough
separately. The overall metric for freshwater fish and large aquatic invertebrates in each slough is
based upon an average of the assessments for all of the monitoring sites (see Table 2 for the status
and trend details on the aquatic fauna metrics).
In SRS, fish and aquatic invertebrate abundance was lower than expected, given the above average
rainfall in 2017-2018. Total fish abundance, and abundance of more drought intolerant species
were below the established targets, while more drought tolerant species were present at a majority
of sites. Our analyses also suggest that lower total native fish abundance corresponded with a
higher abundance of non-native fishes (particularly African Jewelfish). This condition warrants
significant concern. The overall trend in fish and aquatic invertebrate abundance was consistent
Everglades National Park: 2019 State of Conservation
15
with the 2013 assessment. This suggests that aquatic fauna in SRS have not yet improved in
response to the initial MWD and C-111 project implementation.
In Taylor Slough, a similar pattern existed in 2017–2018, with lower fish abundance than expected
and more drought tolerant species than expected. Compared to the 2013 assessment, we observed a
declining trend in native fish and aquatic invertebrates. This warrants significant concern. Increased
pumping of water into the C-111 detention areas has not been in-place long enough to observe
improvements in Taylor Slough aquatic fauna. If we can increase the depth and duration of marsh
flooding, we would expect to see increased freshwater faunal assemblages and more native species.
Understating the role of this localized water pumping on non-native fish populations and the
influence of non-native fishes on total fish abundance, and the broader aquatic food web will
require additional evaluation.
Freshwater Fauna Indicator – Wading Bird Nesting Success, Location, and Timing: The
great abundance and diversity of wading birds (particularly herons, egrets, ibises, and storks) is a
defining characteristic of the Everglades, and a significant reason for the creation of ENP. Since
wading birds are easy to monitor across the landscape and their habitat requirements and historical
nesting patterns are well known, they are excellent indicators of environmental conditions.
Successful wading bird breeding requires abundant aquatic prey, and predictable water depths and
recession rates for foraging. In the pre-drainage Everglades, nesting colonies regularly formed at
the marsh/mangrove ecotone within ENP. Large “supercolonies” were observed during peaks in
prey-base availability, following years with high wet-season water levels and stable dry-season
recessions. By contrast, in the post-drainage Everglades, wading bird numbers have been reduced
by 70–90%, and the major nesting areas have shifted northward into the Water Conservation Areas.
Since water levels in the impounded WCAs tend to recede more slowly, these areas have recently
seen increased nesting success. The slower recessions in the WCAs have triggered a number of
wading bird species (such as the endangered wood stork) to shift the timing of their nesting later
into the dry season. When fledglings emerge near the end of the dry season, they can experience
more nesting failures during very wet years as water levels rise rapidly, dispersing their prey base.
The wading bird metrics are therefore tied to nesting abundance, location, and timing (see Table 2
for the status and trend details on the wading bird metrics).
After sharp ecosystem-wide declines in wading bird nesting from the 1930s through the mid-1980s,
wading bird nesting has been slowly increasing in the WCAs and the park. In 2018, following
back-to-back high rainfall years, the water depth and prey conditions along the marsh/mangrove
ecotone of ENP appeared optimal. In response, supercolonies returned to ENP, with nesting
numbers and fledgling success that has not been observed in 50 years. Under these optimal
conditions, we exceeded our metrics for wading bird nesting and fledgling survival. While there
was a larger percentage of the total wading bird nesting effort return to the ENP marsh/mangrove
ecotone, we remained below the 70% goal. The timing of Wood Stork nesting has moved earlier
into the dry season (Jan. vs Feb.-Mar.) but still is later than the pre-drainage observations of Nov.-
Dec. that assure higher rates of fledging survival. Finally, the interval between successful White
Ibis nesting years has been decreasing, but is still below the metric of 1-2 years. Our next SOC
report will help us determine if the recent positive trends in wading birds nesting will continue,
following completion of our initial phase of restoration projects.
Everglades National Park: 2019 State of Conservation
16
Freshwater Fauna Indicator – American Alligator Abundance, Nesting Success, Location,
and Size Class: The American alligator is a keystone species and an important indicator of
Everglades ecosystem health because they are highly responsive to hydrologic changes. Alligators
were abundant throughout the pre-drainage Everglades, but the highest densities were in the marl
prairies and along the marsh/mangrove ecotone within ENP. Alligators are much less common in
these areas today because of reduced water depths and hydroperiods in the marl prairies, and
reduced freshwater flows and elevated salinities in the southern coastal marshes. The American
alligator metrics focus on nesting effort and success, nest density and distribution, and population
demographics (size class). Since the American alligator responds quickly to changing hydrologic
conditions, annual assessments of nesting effort/success fluctuate substantially from year to year,
and are best evaluated over longer periods.
American alligator nesting effort in the park has increased significantly since 1985, but has
remained below our target. Recent trends have shown more stability during poor to moderate
conditions, and record high numbers during favorable conditions. Two of the five highest nesting
effort years (2014, 2015) were followed by moderate (2016) and extremely low (2017) effort years.
Nesting success has continued to be highly erratic due to both extreme natural rainfall variability,
and managed hydrologic fluctuations. Surveys in 2017–2018 indicate that American alligator
abundance remains relatively low, with reduced alligator numbers in all size classes within ENP.
While alligator numbers remain low, nest density has increased and nests have been better
distributed in recent years (2014–18). While nesting effort and nest densities have increased, we
are below all of the established metrics for the American alligator within ENP (see Table 2 for the
status and trend details on the American alligator metrics).
Ecological Indicators in Coastal/Estuarine Environments The status of the coastal and estuarine integrity indicators are linked to the corrective measures via
their influence on the volume, distribution, and timing of freshwater flows, which impact
downstream salinities. Both mean salinities and the range of variations are drivers of seagrass
abundance and diversity. Periods of high salinity, coupled with warm and calm weather, can lower
dissolved oxygen levels. This has triggered widespread seagrass die-offs in Florida Bay, releasing
nutrients that can cause algal blooms and further reducing light penetration. These water column
and benthic community changes, in turn, control the growth, survival, and abundance of estuarine
fish and invertebrates, coastal bird populations, and keystone species such as the American
crocodile.
Salinity Indicator – Desired Range and Frequency of Extremes: Salinity is the primary
parameter controlling the major ecological processes in coastal and estuarine ecosystems,
influencing the distribution of aquatic plants and animals, overall biological productivity, and
nutrient cycling. In the pre-drainage Everglades, freshwater inflows were more persistent, both
from a seasonal and annual perspective. This created lower salinity conditions throughout much of
the year, over large areas along the park’s coastline (from the Gulf of Mexico and throughout much
of Florida Bay). In the post-drainage Everglades, most of the historic freshwater flows have been
diverted to the northern estuaries, or to meet urban and agricultural water supply needs.
Consequently, the southern coastal ecosystems receive less freshwater, and salinities routinely
reach and exceed oceanic conditions (35 parts per thousand). Three metrics are used to track the
influence of hydrologic restoration activities on salinities in Florida Bay: the amount of time each
Everglades National Park: 2019 State of Conservation
17
year that salinities are in the desired range, the difference between observed salinities and the
desired low-salinity targets, and the frequency of extreme high-salinity events. All of these targets
are based on predicted pre-drainage conditions, derived from a combination of paleo-ecological
studies and model simulations.
During the 2017–2018 reporting period, the Everglades experienced multiple hurricane events,
which led to wide fluctuations in Florida Bay salinities. The spring 2016 El Nino event lowered
salinities across portions of Florida Bay, while rainfall and freshwater inflows declined in late 2016
and early 2017. By August 2017, salinities in central Florida Bay exceeded 40 parts per thousand
(ppt), saltier than ocean water. On September 10th 2017, Hurricane Irma made landfall in the
Florida Keys, and followed a path across western Florida Bay, and through the Gulf Coast
estuaries. High rainfall was recorded over the next week across the Florida Peninsula, which
steadily increased flows into Shark River Slough. The combination of local rainfall and persistent
regional inflows drove salinities into the 20-25 ppt range over much of Florida Bay, well into the
2017 dry season. Florida Bay salinities steadily increased in early 2018, until Tropical Storm
Alberto hit the region in May 2018, followed by Tropical Storm Gordon in September 2018.
Following the 2015 drought, Florida Bay salinity scores generally improved for both the wet and
dry seasons over the next 5–6 years, compared to the previous 5 year period. While Florida Bay
experienced multiple periods of above average rainfall and freshwater inflows, during 2017–2018
salinities were routinely above the target (interquartile) range for desired conditions. In spite of the
2017–2018 tropical events, Florida Bay salinities exceeded the 90th percentile of the desired
targets, and showed no overall improving trend. Florida Bay continues to suffer from a lack of
freshwater flow from Taylor Slough, Shark River Slough, and numerous creeks and rivers. Until
the full suite of flow restoration projects are implemented, hypersaline conditions will continue to
dominate the Florida Bay landscape (see Table 2 for the status and trend details on the salinity
metrics).
Seagrass Indicators – Spatial Extent, Abundance, and Species Dominance: The seagrass
indicators are created from a set of metrics including spatial extent, abundance, species dominance,
and presence of target species, which are monitored throughout Florida Bay. The abundance index
combines these metrics and reflects the status and health of the seagrass community as a whole,
emphasizing overall abundance and spatial extent of seagrasses in Florida Bay. For the abundance
index, the Desired State of Conservation is a sustained submersed aquatic vegetation (SAV)
community (high abundance and spatial extent) in the Florida Bay ecosystem. The species index
combines SAV species diversity and the frequency of occurrence of desired (non-dominant)
species that are expected to increase with higher freshwater flow to Florida bay (Halodule,
Ruppia). For the species index, the desired State of Conservation is a long-term positive trend in
the SAV community and more stable SAV habitat in the Florida Bay ecosystem. A positive trend
would signify that higher freshwater flows into Florida Bay are leading to increased seagrass
diversity and improved habitat quality. These two indicator targets vary spatially due to the
complexities of the bay bottom and associated factors (e.g., Florida Bay morphology consists of
deeper basins separated by isolated by mud banks).
Seagrass abundance and species diversity in Florida Bay varies considerably by location. The
highest and most consistent abundance and species diversity has been in the Northeastern zone,
Everglades National Park: 2019 State of Conservation
18
where freshwater inflows are presumably higher due to the proximity of the lower C-111 canal
system. Species diversity in this zone dropped in 2016, likely in response to droughts and hurricane
disturbance. The Western Zone of the Bay has had moderate seagrass abundance with a decline
after the 2015 die-off, but species diversity has remained high. The Coastal Transition Zone has
had moderate seagrass abundance and species diversity, with some declines after the 2015 die-off.
The Central Zone of the Bay has seen a significant reduction in seagrass abundance and species
diversity post 2015, with little recovery since the 2017 hurricane. Finally, the Southern Zone has
shown a long term trend of low seagrass abundance and moderate species density, since approx.
2011 (see Table 2 for the status and trend details of the seagrass metrics).
Algal Blooms in Florida Bay – Chlorophyll-a Concentrations and Spatial Extent: Florida Bay
has a history of highly variable water quality conditions, with algal bloom episodes that can last
from weeks to even years. Blooms sustained for more than several months can be damaging to
seagrass habitat and fauna, especially sponges. This indicator serves as an alert that harmful water
quality conditions are present in the Bay. This marker for water quality degradation in Florida Bay
was triggered by the seagrass die-off event in 2015, and then again following Hurricane Irma in
2017. This combination of events has spurred the occurrence of record-high chlorophyll a
concentrations in much of the Bay.
During the current reporting period, chlorophyll-concentrations increased in all five zones of
Florida Bay. The areas most impacted extended in a swath from the Northern Coastal Transition
Zone into the Central Zone, where concentrations were more than 10 times greater than the
threshold thought to cause harm to Bay. The Northeastern Zone, where algal blooms have been
relatively rare, displayed poor water quality conditions in 2017-2018, following Hurricane Irma.
Finally, the Western and Southern Zones showed trends dropping from good to fair in response to
these disturbance events (see Table 2 for the status and trend details on the algal bloom metrics).
Estuarine Fauna – Sport Fish Abundance: The abundance and availability of the four native
sport fish species (snook, red drum, spotted seatrout, and gray snapper) were chosen as indicators
of the condition of the coastal and estuarine faunal communities because each of these species
relies on this region throughout its life cycle. Sport fish abundance is known to fluctuate in
response to salinity and other environmental conditions, but these relationships have yet to be fully
quantified. Sport fish abundance is monitored by the NPS using a fishing-dependent metric called
“catch per unit effort” (CPUE), which tracks the catch success of anglers who are targeting a
particular species. Unlike our other ecological indicators that have targets that are linked to a pre-
drainage or historic range of conditions, the Desired State of Conservation for the sport fish species
is to achieve a stable to increasing trend in CPUE, which generally translates to sustainable
recreational use. Over time, we may refine this target with respect to the linkages with restoration
of freshwater flows, stabilization of salinity, or other environmental parameters, as more
information becomes available. In the past, pink shrimp density was also included, which is known
to closely track salinity variations and upstream water management. This indicator has not been
routinely sampled since 2012, and is therefore not included in this assessment.
Snook CPUE dropped in 2010 in response to a winter freeze, but has been stable or increasing each
year up to 2015, our last major seagrass die-off event, which also triggered an algal bloom. Snook
CPUE has since been slowly increasing. After a 5-year low in 2016, red drum CPUE has been
Everglades National Park: 2019 State of Conservation
19
stable. Spotted seatrout CPUE has increased steadily since 2015, and is near its peak level over the
last 12 years. Gray snapper CPUE was stable from 2006 to 2015, and has increased since 2016,
reaching a 38-year high. Three of the four sport fish indicator species have shown a positive trend
during this reporting cycle, suggesting that sport fish have been recovering since our recent natural
disturbances, and that recreational fishing is currently at sustainable levels (see Table 2 for the
status and trend details on the sport fish metrics).
Estuarine Fauna - American Crocodile Abundance, Nesting Effort, and Juvenile Survival:
The American crocodile is a good coastal ecosystem indicator, since the species’ lifecycle is
responsive to changing patterns of freshwater flow and salinity. American crocodiles were
federally listed as “endangered” in 1975, due to extensive habitat degradation (including nesting
sites) and over-hunting. Crocodiles have been slowly recovering in the park and the wider
Everglades. There are now more crocodiles, nesting in more places, than in the prior 35 years,
leading to their reclassification as “threatened” in 2007.
The most important metrics related to hydrologic restoration include the total crocodile population
numbers, nest distribution, nesting effort, and growth/survival from hatching to late juvenile stages.
Crocodiles nest in the late dry season primarily in elevated, sandy areas along ENP mangrove
shorelines. Upstream water management practices have reduced freshwater inflows to the coastal
areas along Florida Bay. In response, hatchlings have to migrate inland from their nesting sites to
nursery areas, since they cannot tolerate high salinity for extended periods. Effects of unnatural
freshwater flows include: longer hatchling migration to suitable nursery habitat, reduced use of nest
sites further from mainland freshwater sources, and impacts to growth, survival, and dispersal of
juvenile crocodiles.
The American crocodile has been studied within the Park since 1978, and the above set of metrics
is used to infer trends in crocodile abundance. American crocodile abundance has been increasing
within the Park, and this trend continued during 2017–2018. Nesting effort has increased
throughout ENP, particularly in the Flamingo/Cape Sable region, where the NPS has been plugging
historic drainage canals, which allowed brackish water to penetrate into the interior wetlands.
Nesting continues to increase in Northeast Florida Bay but at a much slower rate. Nesting success
is typically high in ENP with few total failures. Crocodiles are starting to use new or previously
unknown nesting areas in recent years. Crocodile hatchling growth rates (which increase the odds
of juvenile survival) were variable but high in most regions. Recent improved estimates of survival
using enhanced modeling techniques demonstrate first and second year survival within ENP is
more than five times higher than previously thought, and are demonstrably higher than adjacent
nursery areas. Increased population growth, nesting success, and juvenile survival is expected, once
upstream hydrologic restoration projects are completed and more natural freshwater flows are
restored (see Table 2 for the status and trend details on the American crocodile metrics).
Estuarine Fauna – Roseate Spoonbill Abundance, Nesting Effort, and Juvenile Survival:
Roseate spoonbills are a good indicator, since they nest in and around Florida Bay and forage in
adjacent coastal wetlands. Spoonbills have been studied in the Park since the 1930’s, and were
almost extirpated in Florida due to plume hunting and habitat degradation. By 1935, the only
known nesting colony in the state consisted of about 15 pairs on Bottle Key in Florida Bay. The
establishment of the Park led to increased protection, and spoonbill abundance steadily increased
Everglades National Park: 2019 State of Conservation
20
until the 1980s, when changes in water management began to impact spoonbill nesting by
diminishing, redirecting, and disrupting the timing of freshwater inflows, which reduced the
availability of prey. In 2010, the state of Florida reclassified the roseate spoonbill from a “Species
of Special Concern” to "Threatened" because of the bird's small population and restricted range.
While spoonbill numbers and nesting locations are on the rise statewide, spoonbill nesting in the
Park has not recovered since the 1980’s.
The most important spoonbill metrics include the total number of nesting pairs in Florida Bay, the
return of spoonbill nests to historically important sites, and spoonbill chick production. These
behavioral responses can result in substantial annual variations in these indicator values, and trends
are best evaluated over long periods. Breeding populations (reported as nesting pairs) sharply
declined after the mid 1980’s, and the number of nesting pairs for the 2014-2018 reporting period
remained below the pre-1984 target. One historical colony in Northeast Florida Bay has become
active, but overall nest numbers are below the targets in both eastern and western Florida Bay.
Spoonbill chick production has generally been low since the 1980’s, but there was a slight positive
trend since 2015 in both eastern and western Florida Bay (see Table 2 for the status and trend
details on the Roseate spoonbill metrics).
3. Other Current Conservation Issues Identified by the State Parties which may Impact on the Property’s Outstanding Universal Value
Exotic Invasive Species
In 2015, the South Florida Ecosystem Restoration Task Force developed an Invasive Exotic
Species Action Framework (http://evergladesrestoration.gov/content/ies/ ). This framework is
helping to align and prioritize the work of the various government entities (Federal, State and
Local) in the fight against invasive species in the south Florida ecosystem, including the Park. In
addition, the Task Force effort has brought the situation of invasive species in the south Florida
ecosystem to a higher level of awareness at the national level. The U.S. National Invasive Species
Council (NISC) Secretariat has produced a documentary on invasive species entitled, Protecting
What Matters that includes information on south Florida invasive species. All of these efforts are
positive progress toward addressing the issue of invasive species within the World Heritage
property.
Nevertheless, additional resources and long-term steady attention will be needed to turn the tide on
invasive exotic species within the site. Current data indicate that many additional exotic species are
present in the urban and agricultural areas outside the boundaries of the site, though not yet found
inside the boundaries. Thus we expect to be working on this threat to the Outstanding Universal
Values for many years to come. The NPS places the highest management priority on exotic species
that cause the greatest ecological harm to native plant and animal communities. The Park is
working to maintain and expand existing successful exotics control and maintenance programs, but
the scale of the problem, and limited resources have prevented establishment of control programs
exotic fish and some wildlife species. The Park is focused on tracking existing and new invasions,
investing in research, applying early detection and rapid response, and working with our partners
and the public on education, outreach, and controlling exotic species introductions. We are still in
the early stage of establishing formal corrective measures and quantitative targets, with respect to
Everglades National Park: 2019 State of Conservation
21
exotic species. This section of the report builds on the 2013 World Heritage report, in the
assessment of indicator metrics and preliminary statements of desired conditions.
Exotic Invasive Plants – Relative Abundance or Percentage of Native to Exotic Species:
Approximately 1,000 known plant species occur in the Park, and approximately 250 are considered
exotic (i.e., non-native). The highest management priority is given to the four exotic plant species
that are the most invasive, and cause the greatest ecological harm: melaleuca, Australian pine, Old
World climbing fern, and Brazilian pepper. The percent cover of these key invasive plant species
over the entire park was digitally mapped during low elevation overflights in 2013. Supplemental
mapping of melaleuca and Australian pine has been done in key treatment locations, while the
status of Brazilian pepper and Old World climbing fern has not been systematically updated since
2013, due to limited resources. The percent cover of other invasive plant species are not estimated
by aerial surveys, because these species inhabit the understory or have localized distributions,
making it difficult to confidently estimate changes in percent cover for these taxa.
The desired state for these four key exotic plants and their management approaches are species-
dependent. Their current status reflects available funding for control, current treatment
technologies, and the biology, distribution, and accessibility of the particular exotic plant species.
For melaleuca and Australian pine, the target is less than 1% cover per km2 in the current or
historical areas containing these species and preventing expansion into new areas. The target for
Old World climbing fern and Brazilian pepper is less than 5% cover per km2 in areas currently
containing these species and preventing expansion into new areas. The target for all other exotic
plant species is less than 1% cover per species per km2 in areas currently containing these species,
and preventing expansion into new areas. Our Desired State of Conservation also includes
expanded monitoring and control of newly detected species.
Melaleuca receives the most management attention of any exotic plant in the Park via direct
application of chemical and biological control agents. While we have not achieved the < 1% cover
target, the total km2 of melaleuca infestation has decreased over the last 10 years. Australian pine is
second in terms of management attention, and chemical control is effective, but no effective bio-
control exists. While we have not achieved the < 1% cover target, the total km2 of Australian pine
infestation has decreased in recent years. Management of Old World climbing fern is frequently
limited by its remoteness. Chemical, biocontrol, and prescribed fire have been effectively applied
in areas of dense infestations. We have not achieved the < 5% cover target, and the total km2 of Old
World Climbing Fern infestations has increased in recent years, due to expansion into previously
undetected areas. Management of Brazilian pepper is generally limited to areas near man-made
disturbances (roadsides, former farmlands, etc.), because no effective chemical or bio-control
options exist, and mechanical control is expensive. We have not achieved the < 5% cover target,
and the total km2 of Brazilian pepper infestation has increased in recent years, due to expansion,
particularly in coastal marshes near the mangrove ecotone. Management of other invasive exotic
plants is limited to areas of high concern (visitor use areas, T&E species habitats. The effectiveness
of chemical and biocontrol approaches differs by species. We have not achieved the < 1% cover
target, and the total km2 of these other exotic plant species infestations has increased in recent years
(see Table 2 for the status and trend details on the exotic plant metrics).

Everglades National Park: 2019 State of Conservation
22
Exotic Invasive Fish and Wildlife – Relative Abundance or Percentage of Native to Exotic
Species: Invasive fish and wildlife continue to present significant challenges in the Park, and
preventing the arrival and establishment of new species remains the preferred course of action.
Most of these species arrive in the Park from the upstream canal system, or from adjacent
developed areas, and new regulatory actions to limit introductions are not expected in the near
future. The Park’s control efforts focus on addressing new threats as they emerge, and long-term
management of well-established species.
The management metrics for invasive fish are linked to reducing the rate of new introductions and
maintaining a low relative abundance (less than 2%) vs native species. No new introductions of
exotic freshwater fishes have been observed in the Park since 2010, but surveys in the adjacent
canal systems detected three exotic fishes (either from the aquarium trade or stocked by the
SFWMD for aquatic vegetation control). In addition, several other recently observed exotic fishes
in the broader south Florida canal system have establish populations, and could pose a risk of
spreading into the Park. The relative abundance of exotic freshwater fishes during this reporting
period increased above the 2% threshold at all monitoring sites. In Shark River and Taylor Sloughs,
relative abundance of exotic fishes was 3.8% and 2.4%, respectively. In the ENP-wide monitoring
sites, relative abundance of exotic fishes was 48% during the reporting period. The drought tolerant
African jewelfish continues to be the most abundant exotic fish observed in park-wide monitoring
at 43% of all catches and 89% of all exotic fishes, with patterns of increasing abundance in both
shorter hydroperiod marshes and slough habitats.
The management metrics for herpetofauna include minimizing or eliminating new introductions,
and containing and decreasing known exotic species within the Park. Recent studies suggest that all
previously documented exotic reptile and amphibian species continue to persist across their
formerly known range in and around the Park. Limited monitoring surveys during 2014–2018
suggest range expansion is occurring for the Burmese python and the Argentine tegu within South
Florida. Burmese pythons have been established in the Park for multiple decades. Burmese pythons
were captured in substantial numbers during the reporting period, but there is little optimism to
expect widespread control in the near future. The Argentine tegu established a large population
relatively recently just east of the Park. We have an aggressive containment program, and continue
to capture increasing numbers, but they still present a significant threat for incursion. The North
African python has been observed outside the Park in recent years. Increased monitoring has
produced limited actionable information to determine if containment or eradication is possible.
Additional exotic herpetofauna species have expanded their range in recent years (such as the
African redhead agama, and veiled chameleon). These species also present potential threats of
incursion into the Park.
The Indo-Pacific lionfish was first reported inside the Park in 2010. This is the only notable
invasive marine species in and around the Park. Our management metric is to minimize the number
and reduce the spatial distribution of lionfish. The density of lionfish in the Park is low, with a total
of 40 lionfish sightings reported in the Park since 2010. Our partner agencies have documented a
rapid increase in lionfish numbers on reef habitats in adjacent coastal waters. The only Park
habitats where lionfish have been captured thus far include hard bottom environments or man-made
structures. Lionfish are known to occupy a wide range of other habitats including coral reefs,
seagrass beds, mangroves, and estuaries, so they could potentially invade any habitat within Florida
Everglades National Park: 2019 State of Conservation
23
Bay. Because seagrass beds and mangrove areas are important nursery areas for juvenile fish and
invertebrates, the potential impact of lionfish in the Park is a serious concern. We initiated our first
lionfish survey in 2013, and the rate of lionfish observations has not increased. Limited data
suggest occupancy rates and densities of lionfish in Florida Bay are low and there is currently little
impact to native fish and invertebrate species compared to adjacent shallow-reef and deeper-water
habitats in the Atlantic and Gulf of Mexico. The potential for invasion by this species is still high,
due to high densities and expanding populations in adjacent waters (see Table 2 for the status and
trend details on the exotic herpetofauna and fish metrics).
Climate Change
Everglades National Park is considered to be highly vulnerable to the impacts of climate change,
particularly sea-level rise. An NPS general discussion of the impacts to Everglades National Park is
available at (https://www.nps.gov/subjects/climatechange/sciencevideos.htm). The NPS has been
documenting the impacts of sea-level rise across the Service for a number of years, and sea-level
rise and 2050/2100 projections under various emissions scenarios are available on the NPS
interactive viewer (https://maps.nps.gov/slr/). The NPS developed research, adaptation, and
mitigation guidance, (https://www.nps.gov/subjects/climatechange/sealevelchange.htm). For
Everglades National Park, our 2015 General Management Plan (GMP) outlines a series of
recommended responses including: (1) expanded research to identify specific natural and cultural
resources at risk from climate change, (2) new or ongoing partnerships with management entities to
maintain regional habitat connectivity, (3) restoration of key ecosystem features to increase
ecosystem resilience, and (4) minimization of the impacts of other stressors on park resources.
These are all important aspects of the overall ENP strategy to address climate change and sea-level
rise impacts to park natural and cultural resources.
The Park has several cooperative research and monitoring studies on climate change, to assess the
potential impact of sea-level rise on the ecotone between the marine and freshwater landscapes. A
good example is studies of the loss of organic peat soils as a result of saltwater intrusion, which
impacts freshwater marsh plants via increased pore water salinities. This information is critical to
defining water management actions to increase ENP freshwater inflows to mitigate against sea-
level rise. ENP also continues to work on internal projects to reduce the impact of man-made
features near the coast, such as drainage canals. The park recently completed an Environmental
Assessment to examine the potential for a second phase of canal plug and repairs to multiple
historic canals on Cape Sable, in the southwestern corner of the park. The park is also undertaking
comprehensive climate-change planning now that the GMP is approved. Wayside exhibits are
being developed to illustrate the risk sea-level rise poses to park resources and to open a
conversation with visitors regarding climate change.
Oil and Gas Exploration/Extraction
The WH Committee previously asked about potential impacts of proposed expansion of oil and gas
extraction within the Everglades. These activities have previously been limited to the Big Cypress
Watershed including within the Big Cypress National Preserve (BCNP), or to the west of ENP’s
major drainage basins. In 2015, a major land development company applied for a permit to drill
exploratory wells on five acres of a 20,000 acre tract they own within the Water Conservation
Areas, upstream of the park. The Florida Department of Environmental Protection (FDEP)
previously denied the permit, since the area was considered environmentally sensitive. After a
Everglades National Park: 2019 State of Conservation
24
multi-year legal challenge, a Florida administrative court ruled in the companies favor in 2017, and
the FDEP appealed that decision. In early 2019, a Florida appeals court overruled the FDEP
decision, and granted the land development company authority to conduct exploratory drilling.
While the path forward is unclear, this would be the first new oil or gas permit issued in the
Everglades by FDEP in the last 50 years. The implications of this planned activity on the park are
unknown, but the NPS has previously raised concerns over localized adverse impacts within the
BCNP.
4. Summary of New Developments that may affect the OUVs
As explained previously, completion of three new projects: (1) the Tamiami Trail Next Steps
roadway improvements, (2) the Central Everglades Project, which now includes the EAA
Reservoir south of Lake Okeechobee, and (3) the expanded water quality treatment features
included in the Restoration Strategies Project will be needed to achieve the water flow and water
quality conditions envisioned in the indicators of integrity. Both the Central Everglades and
Restoration Strategies projects are expected to reach key construction milestones around by 2025-
2026. While full construction of these regional-scale projects was originally expected to be a
decade away. The good news is that the water flow and water quality benefits from these
upcoming projects are projected to fully achieve our desired state of conservation.
A key change in water availability in the greater Everglades watershed occurred in 2008, when
safety concerns with the Herbert Hoover Dike (HHD) around Lake Okeechobee prompted the
Army Corps to lower the Lake regulation schedule, via increased discharges to the northern
estuaries. That same year the Army Corps began work on a $1.7 billion HHD rehabilitation
project. To date, numerous improvements have been made to the dike and associated water control
structures, at a cost of $1 billion, with an originally planned completion by 2025. During the wet
seasons of 2017–2018, the public was shocked by the environmental and economic impacts
caused by high Lake Okeechobee regulatory releases and associated harmful algal blooms in the
Lake and northern estuaries. These concerns prompted the federal and state governments to
dedicate $730 million in supplemental funding, to increase the pace of the HHD repairs, and
commit to developing a new Lake regulation schedule by 2022. This acceleration in Lake
Okeechobee projects, has put added pressure on completing the Central Everglades/EAA
Reservoir projects, and other CERP features needed to move clean water southward back into the
Everglades.
Another new development occurred within the State of Florida appropriations, suggesting that
they will be greatly accelerating their Everglades restoration funding. In early 2019, the new
Florida Governor announced a $625 million fiscal year 2019 commitment to advance a number of
key water resources projects (including $360 million toward Everglades water storage reservoirs,
$150 million for targeted water quality projects, and $25 million to address harmful algal blooms
in the northern estuaries). This is the first year of a four-year $2.5 billion commitment of state
appropriations. This marks the start of a growing Federal and State of Florida pledge to advance
Everglades restoration, with a focus on sending more clean water south from Lake Okeechobee
into the southern Everglades and Florida Bay.

Everglades National Park: 2019 State of Conservation
25
The completion of these original Everglades foundation projects, and the signs of a likely
acceleration of key next generation restoration projects, suggests that we are on the verge of
seeing major hydrological, water quality, and ecological improvements throughout the watershed,
and specifically at this site. This bodes well for our ability to recover and maintain the site’s
Outstanding Universal Value.
Everglades National Park: 2019 State of Conservation
Public Access to the State of Conservation Report
We approve public access to the entirety of this report on the World Heritage Centre’s State of
Conservation Information System.
(Signature of the Authority)
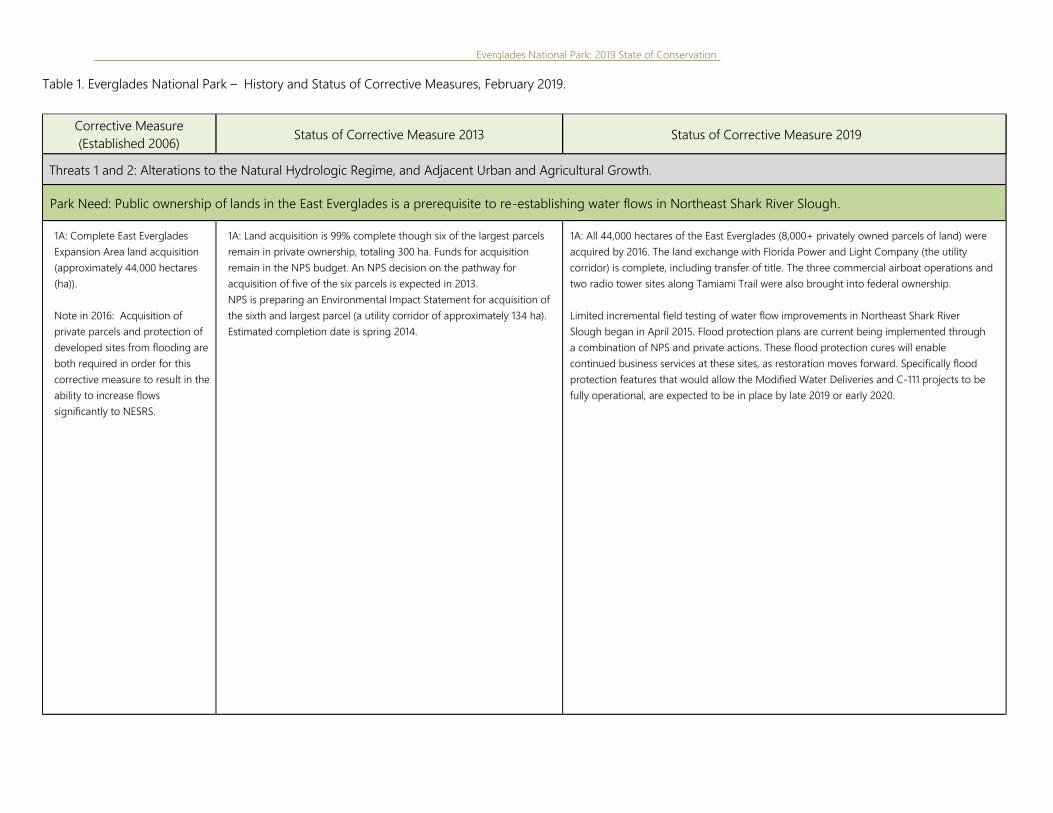
Everglades National Park: 2019 State of Conservation
Table 1. Everglades National Park – History and Status of Corrective Measures, February 2019.
Corrective Measure
(Established 2006) Status of Corrective Measure 2013 Status of Corrective Measure 2019
Threats 1 and 2: Alterations to the Natural Hydrologic Regime, and Adjacent Urban and Agricultural Growth.
Park Need: Public ownership of lands in the East Everglades is a prerequisite to re-establishing water flows in Northeast Shark River Slough.
1A: Complete East Everglades
Expansion Area land acquisition
(approximately 44,000 hectares
(ha)).
Note in 2016: Acquisition of
private parcels and protection of
developed sites from flooding are
both required in order for this
corrective measure to result in the
ability to increase flows
significantly to NESRS.
1A: Land acquisition is 99% complete though six of the largest parcels
remain in private ownership, totaling 300 ha. Funds for acquisition
remain in the NPS budget. An NPS decision on the pathway for
acquisition of five of the six parcels is expected in 2013.
NPS is preparing an Environmental Impact Statement for acquisition of
the sixth and largest parcel (a utility corridor of approximately 134 ha).
Estimated completion date is spring 2014.
1A: All 44,000 hectares of the East Everglades (8,000+ privately owned parcels of land) were
acquired by 2016. The land exchange with Florida Power and Light Company (the utility
corridor) is complete, including transfer of title. The three commercial airboat operations and
two radio tower sites along Tamiami Trail were also brought into federal ownership.
Limited incremental field testing of water flow improvements in Northeast Shark River
Slough began in April 2015. Flood protection plans are current being implemented through
a combination of NPS and private actions. These flood protection cures will enable
continued business services at these sites, as restoration moves forward. Specifically flood
protection features that would allow the Modified Water Deliveries and C-111 projects to be
fully operational, are expected to be in place by late 2019 or early 2020.
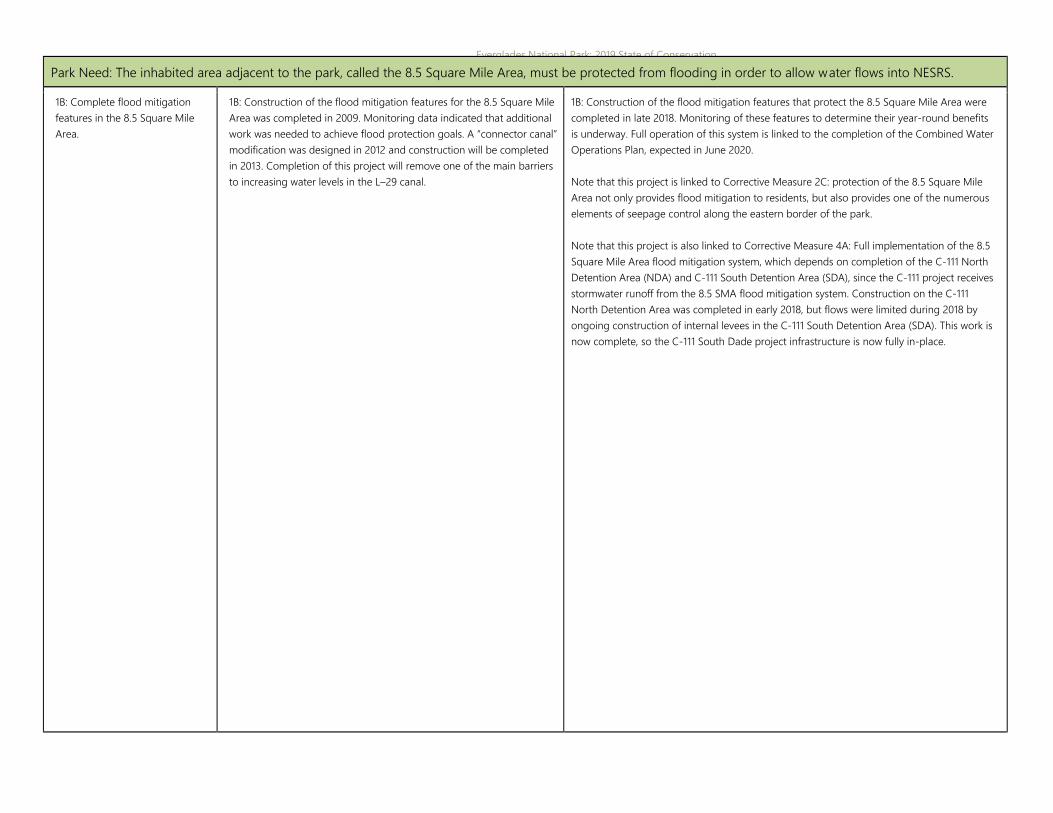
Everglades National Park: 2019 State of Conservation
Park Need: The inhabited area adjacent to the park, called the 8.5 Square Mile Area, must be protected from flooding in order to allow water flows into NESRS.
1B: Complete flood mitigation
features in the 8.5 Square Mile
Area.
1B: Construction of the flood mitigation features for the 8.5 Square Mile
Area was completed in 2009. Monitoring data indicated that additional
work was needed to achieve flood protection goals. A “connector canal”
modification was designed in 2012 and construction will be completed
in 2013. Completion of this project will remove one of the main barriers
to increasing water levels in the L–29 canal.
1B: Construction of the flood mitigation features that protect the 8.5 Square Mile Area were
completed in late 2018. Monitoring of these features to determine their year-round benefits
is underway. Full operation of this system is linked to the completion of the Combined Water
Operations Plan, expected in June 2020.
Note that this project is linked to Corrective Measure 2C: protection of the 8.5 Square Mile
Area not only provides flood mitigation to residents, but also provides one of the numerous
elements of seepage control along the eastern border of the park.
Note that this project is also linked to Corrective Measure 4A: Full implementation of the 8.5
Square Mile Area flood mitigation system, which depends on completion of the C-111 North
Detention Area (NDA) and C-111 South Detention Area (SDA), since the C-111 project receives
stormwater runoff from the 8.5 SMA flood mitigation system. Construction on the C-111
North Detention Area was completed in early 2018, but flows were limited during 2018 by
ongoing construction of internal levees in the C-111 South Detention Area (SDA). This work is
now complete, so the C-111 South Dade project infrastructure is now fully in-place.

Everglades National Park: 2019 State of Conservation
Corrective Measure
(Established 2006) Status of Corrective Measure 2013 Status of Corrective Measure 2018
Park Need: A water control plan defining water operations that will improve rainfall-based water deliveries and promote increased sheetflow to ENP, while maintaining
flood control and water supply requirements, is necessary.
1B: Complete the Combined
Operations Plan (COP) for the
Modified Water Deliveries (MWD)
and C-111 South Dade Projects.
This Corrective Measure is the same
as Corrective Measure 2B.
1B: Everglades Restoration Transition Plan (ERTP) operations have been
implemented. A water operations field test is being designed and agreed
upon between the U.S. Government and the State of Florida that should
address water quality concerns associated with increases in flow to
NESRS. This field test is expected in early 2013 and will last for 2 years.
The COP and the COP plans have been eliminated from the MWD
project, and future water control plans will be developed at the
conclusion of the field test. Changes to water operations are likely to
move forward very slowly and in small increments. Substantial change
will occur only when raising and bridging the Tamiami Trail is complete
as envisioned in the Central Everglades Planning Project (CEPP—a new
element of the CERP) and the Tamiami Trail Next Steps (TTNS) project.
Timeline for completion of these projects is >10 years from now.
1B: During the current reporting period (2017–2018), we completed the first incremental field
test (increment 1.1-1.2), and in September 2018 we initiated increment 2 operations. Under this
2nd increment, we further relaxed the operational constraints and raised the L-29 canal stage
by up to one foot, allowing us to increase water flows into Northeast Shark River Slough. The
final Combined Operational Plan (COP) will build on the lessons learned during the
incremental field tests. The next report will document the level of restoration that can be
achieved, following completion of the full suite of MWD and C111 project components.
The current reporting period (2017–2018), included unusual weather conditions associated
with three consecutive years of above average hurricane intensity. High rainfall in September
2017, associated with Hurricane Irma, lead to period of record water levels within the park and
adjacent areas. In 2018, similar high rainfall events in May (Tropical Storm Alberto) and
September (Tropical Storm Gordon), made 2018 one of the wettest years on record
throughout south Florida. These wet conditions lead to another round of emergency
deviations in ENP water operations, further testing the performance of the evolving MWD and
C-111 infrastructure. The unusually wet conditions in 2017–2018 sparked a State of Florida
effort to enhance flood protection in the agricultural areas east of the park, via addition
pumping and reduced canal operational levels. Analysis of the impacts of these operations is
underway, and will inform the final design of the COP. One lesson learned is that the eastern
flood protection and seepage management infrastructure is not as effective as originally
expected, so inflows to Northeast SRS had to be reduced during these high water periods (see
CM 2C below). Unless this issue is addressed, the restoration benefits of the MWD and C-111
projects may be limited during wet periods.
So far, our assessment remains the same as in 2017: limitations in the water management
infrastructure associated with the MWD and C-111 projects will move restoration forward
slowly and in small increments. Flows under the eastern Tamiami Trail roadway will be
constrained until the Phase 2 roadway reconstruction/raising is complete. Full achievement of
the Everglades National Park water flow and distribution targets for the Desired State of
Conservation won’t occur until the CEPP and EAA reservoir projects are complete in about a
decade.
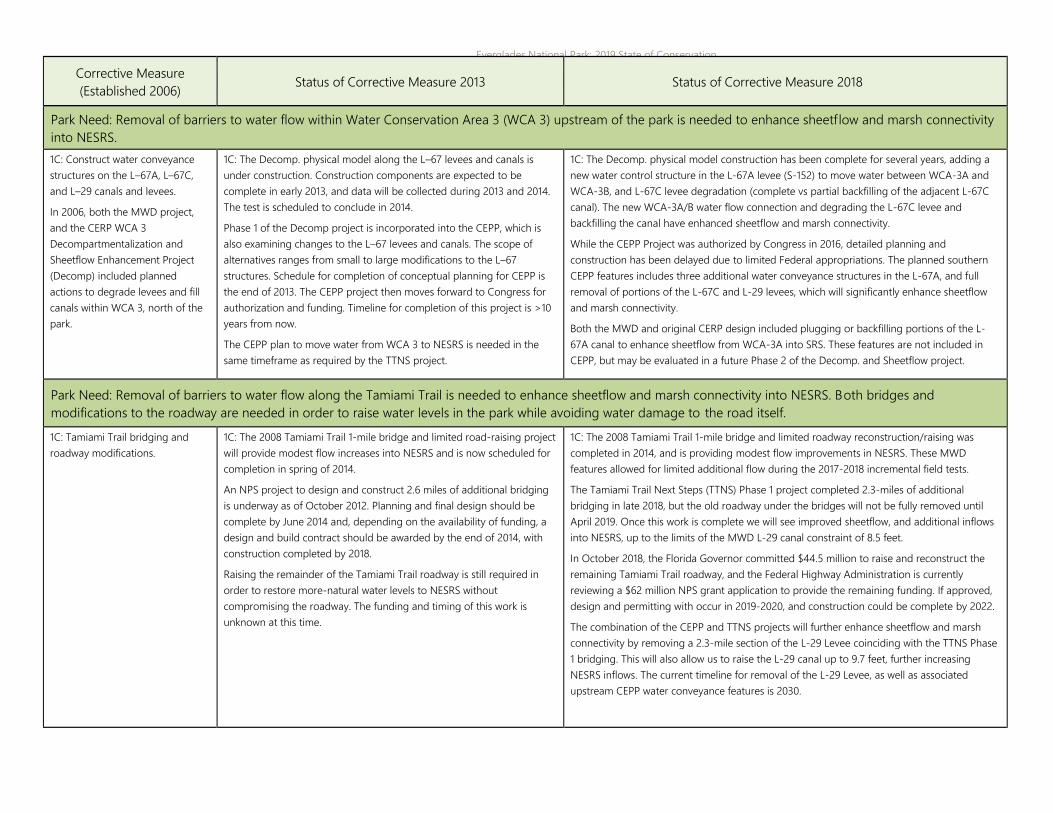
Everglades National Park: 2019 State of Conservation
Corrective Measure
(Established 2006) Status of Corrective Measure 2013 Status of Corrective Measure 2018
Park Need: Removal of barriers to water flow within Water Conservation Area 3 (WCA 3) upstream of the park is needed to enhance sheetf low and marsh connectivity
into NESRS.
1C: Construct water conveyance
structures on the L–67A, L–67C,
and L–29 canals and levees.
In 2006, both the MWD project,
and the CERP WCA 3
Decompartmentalization and
Sheetflow Enhancement Project
(Decomp) included planned
actions to degrade levees and fill
canals within WCA 3, north of the
park.
1C: The Decomp. physical model along the L–67 levees and canals is
under construction. Construction components are expected to be
complete in early 2013, and data will be collected during 2013 and 2014.
The test is scheduled to conclude in 2014.
Phase 1 of the Decomp project is incorporated into the CEPP, which is
also examining changes to the L–67 levees and canals. The scope of
alternatives ranges from small to large modifications to the L–67
structures. Schedule for completion of conceptual planning for CEPP is
the end of 2013. The CEPP project then moves forward to Congress for
authorization and funding. Timeline for completion of this project is >10
years from now.
The CEPP plan to move water from WCA 3 to NESRS is needed in the
same timeframe as required by the TTNS project.
1C: The Decomp. physical model construction has been complete for several years, adding a
new water control structure in the L-67A levee (S-152) to move water between WCA-3A and
WCA-3B, and L-67C levee degradation (complete vs partial backfilling of the adjacent L-67C
canal). The new WCA-3A/B water flow connection and degrading the L-67C levee and
backfilling the canal have enhanced sheetflow and marsh connectivity.
While the CEPP Project was authorized by Congress in 2016, detailed planning and
construction has been delayed due to limited Federal appropriations. The planned southern
CEPP features includes three additional water conveyance structures in the L-67A, and full
removal of portions of the L-67C and L-29 levees, which will significantly enhance sheetflow
and marsh connectivity.
Both the MWD and original CERP design included plugging or backfilling portions of the L-
67A canal to enhance sheetflow from WCA-3A into SRS. These features are not included in
CEPP, but may be evaluated in a future Phase 2 of the Decomp. and Sheetflow project.
Park Need: Removal of barriers to water flow along the Tamiami Trail is needed to enhance sheetflow and marsh connectivity into NESRS. Both bridges and
modifications to the roadway are needed in order to raise water levels in the park while avoiding water damage to the road itself.
1C: Tamiami Trail bridging and
roadway modifications.
1C: The 2008 Tamiami Trail 1-mile bridge and limited road-raising project
will provide modest flow increases into NESRS and is now scheduled for
completion in spring of 2014.
An NPS project to design and construct 2.6 miles of additional bridging
is underway as of October 2012. Planning and final design should be
complete by June 2014 and, depending on the availability of funding, a
design and build contract should be awarded by the end of 2014, with
construction completed by 2018.
Raising the remainder of the Tamiami Trail roadway is still required in
order to restore more-natural water levels to NESRS without
compromising the roadway. The funding and timing of this work is
unknown at this time.
1C: The 2008 Tamiami Trail 1-mile bridge and limited roadway reconstruction/raising was
completed in 2014, and is providing modest flow improvements in NESRS. These MWD
features allowed for limited additional flow during the 2017-2018 incremental field tests.
The Tamiami Trail Next Steps (TTNS) Phase 1 project completed 2.3-miles of additional
bridging in late 2018, but the old roadway under the bridges will not be fully removed until
April 2019. Once this work is complete we will see improved sheetflow, and additional inflows
into NESRS, up to the limits of the MWD L-29 canal constraint of 8.5 feet.
In October 2018, the Florida Governor committed $44.5 million to raise and reconstruct the
remaining Tamiami Trail roadway, and the Federal Highway Administration is currently
reviewing a $62 million NPS grant application to provide the remaining funding. If approved,
design and permitting with occur in 2019-2020, and construction could be complete by 2022.
The combination of the CEPP and TTNS projects will further enhance sheetflow and marsh
connectivity by removing a 2.3-mile section of the L-29 Levee coinciding with the TTNS Phase
1 bridging. This will also allow us to raise the L-29 canal up to 9.7 feet, further increasing
NESRS inflows. The current timeline for removal of the L-29 Levee, as well as associated
upstream CEPP water conveyance features is 2030.
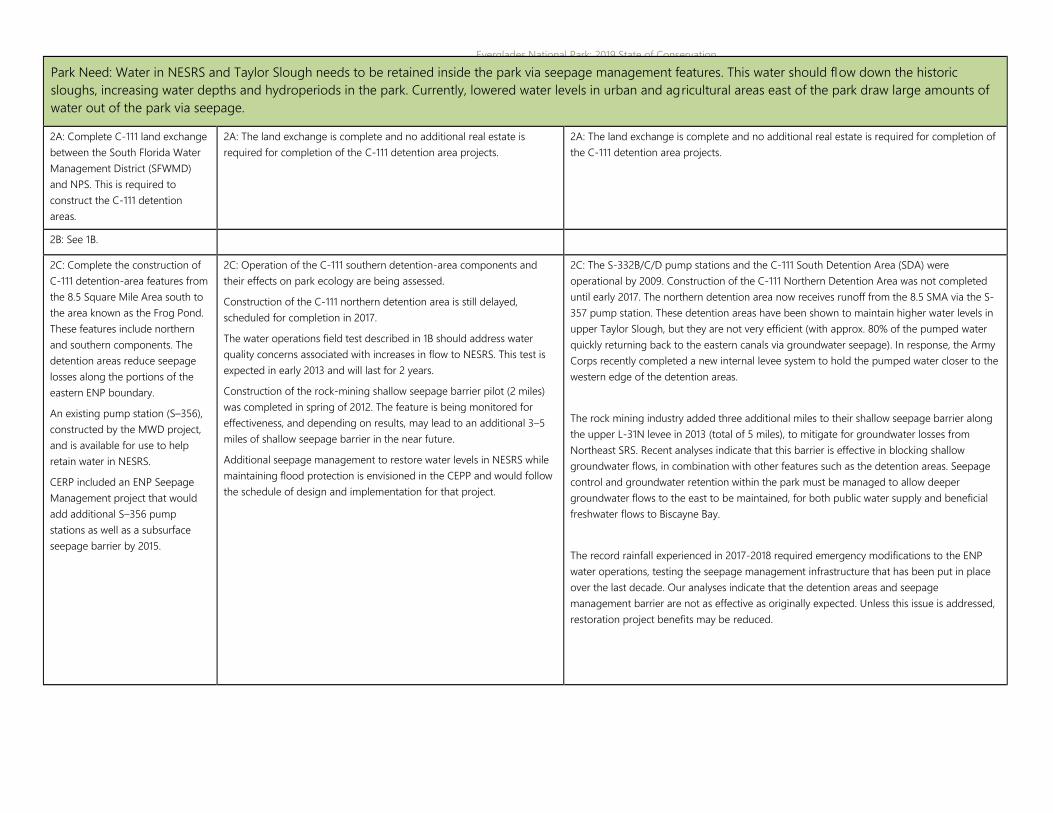
Everglades National Park: 2019 State of Conservation
Park Need: Water in NESRS and Taylor Slough needs to be retained inside the park via seepage management features. This water should flow down the historic
sloughs, increasing water depths and hydroperiods in the park. Currently, lowered water levels in urban and agricultural areas east of the park draw large amounts of
water out of the park via seepage.
2A: Complete C-111 land exchange
between the South Florida Water
Management District (SFWMD)
and NPS. This is required to
construct the C-111 detention
areas.
2A: The land exchange is complete and no additional real estate is
required for completion of the C-111 detention area projects.
2A: The land exchange is complete and no additional real estate is required for completion of
the C-111 detention area projects.
2B: See 1B.
2C: Complete the construction of
C-111 detention-area features from
the 8.5 Square Mile Area south to
the area known as the Frog Pond.
These features include northern
and southern components. The
detention areas reduce seepage
losses along the portions of the
eastern ENP boundary.
An existing pump station (S–356),
constructed by the MWD project,
and is available for use to help
retain water in NESRS.
CERP included an ENP Seepage
Management project that would
add additional S–356 pump
stations as well as a subsurface
seepage barrier by 2015.
2C: Operation of the C-111 southern detention-area components and
their effects on park ecology are being assessed.
Construction of the C-111 northern detention area is still delayed,
scheduled for completion in 2017.
The water operations field test described in 1B should address water
quality concerns associated with increases in flow to NESRS. This test is
expected in early 2013 and will last for 2 years.
Construction of the rock-mining shallow seepage barrier pilot (2 miles)
was completed in spring of 2012. The feature is being monitored for
effectiveness, and depending on results, may lead to an additional 3–5
miles of shallow seepage barrier in the near future.
Additional seepage management to restore water levels in NESRS while
maintaining flood protection is envisioned in the CEPP and would follow
the schedule of design and implementation for that project.
2C: The S-332B/C/D pump stations and the C-111 South Detention Area (SDA) were
operational by 2009. Construction of the C-111 Northern Detention Area was not completed
until early 2017. The northern detention area now receives runoff from the 8.5 SMA via the S-
357 pump station. These detention areas have been shown to maintain higher water levels in
upper Taylor Slough, but they are not very efficient (with approx. 80% of the pumped water
quickly returning back to the eastern canals via groundwater seepage). In response, the Army
Corps recently completed a new internal levee system to hold the pumped water closer to the
western edge of the detention areas.
The rock mining industry added three additional miles to their shallow seepage barrier along
the upper L-31N levee in 2013 (total of 5 miles), to mitigate for groundwater losses from
Northeast SRS. Recent analyses indicate that this barrier is effective in blocking shallow
groundwater flows, in combination with other features such as the detention areas. Seepage
control and groundwater retention within the park must be managed to allow deeper
groundwater flows to the east to be maintained, for both public water supply and beneficial
freshwater flows to Biscayne Bay.
The record rainfall experienced in 2017-2018 required emergency modifications to the ENP
water operations, testing the seepage management infrastructure that has been put in place
over the last decade. Our analyses indicate that the detention areas and seepage
management barrier are not as effective as originally expected. Unless this issue is addressed,
restoration project benefits may be reduced.
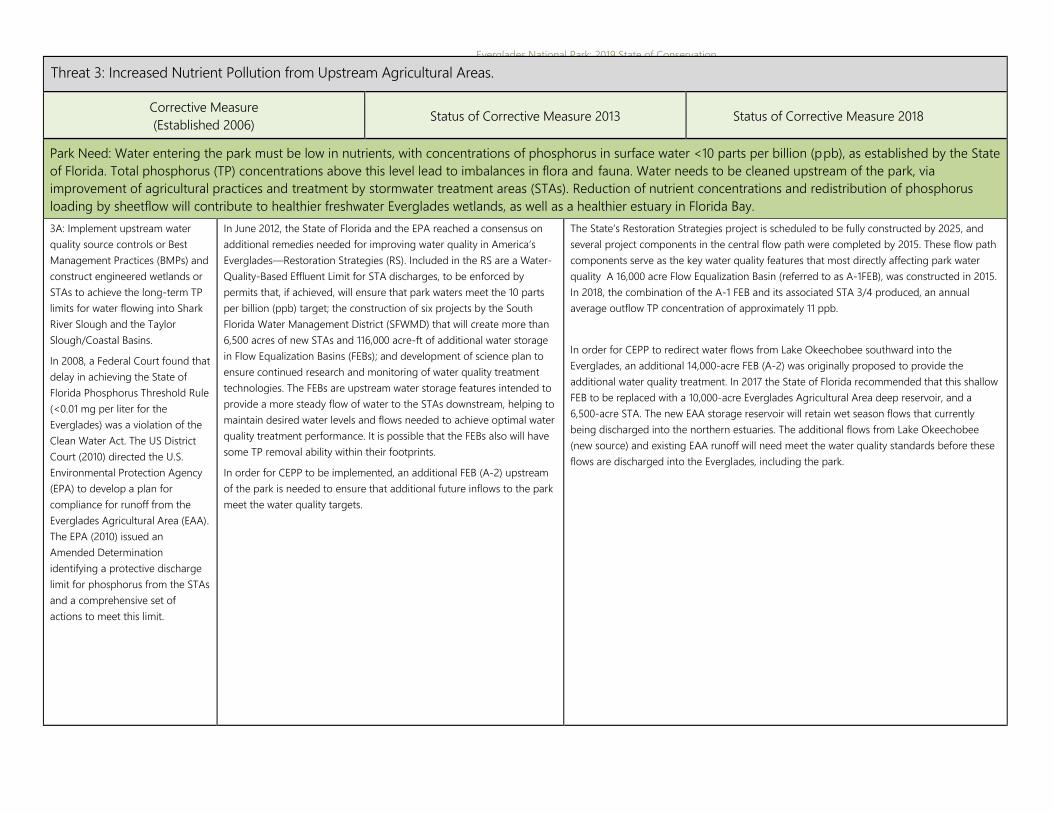
Everglades National Park: 2019 State of Conservation
Threat 3: Increased Nutrient Pollution from Upstream Agricultural Areas.
Corrective Measure
(Established 2006) Status of Corrective Measure 2013 Status of Corrective Measure 2018
Park Need: Water entering the park must be low in nutrients, with concentrations of phosphorus in surface water <10 parts per billion (ppb), as established by the State
of Florida. Total phosphorus (TP) concentrations above this level lead to imbalances in flora and fauna. Water needs to be cleaned upstream of the park, via
improvement of agricultural practices and treatment by stormwater treatment areas (STAs). Reduction of nutrient concentrations and redistribution of phosphorus
loading by sheetflow will contribute to healthier freshwater Everglades wetlands, as well as a healthier estuary in Florida Bay.
3A: Implement upstream water
quality source controls or Best
Management Practices (BMPs) and
construct engineered wetlands or
STAs to achieve the long-term TP
limits for water flowing into Shark
River Slough and the Taylor
Slough/Coastal Basins.
In 2008, a Federal Court found that
delay in achieving the State of
Florida Phosphorus Threshold Rule
(<0.01 mg per liter for the
Everglades) was a violation of the
Clean Water Act. The US District
Court (2010) directed the U.S.
Environmental Protection Agency
(EPA) to develop a plan for
compliance for runoff from the
Everglades Agricultural Area (EAA).
The EPA (2010) issued an
Amended Determination
identifying a protective discharge
limit for phosphorus from the STAs
and a comprehensive set of
actions to meet this limit.
In June 2012, the State of Florida and the EPA reached a consensus on
additional remedies needed for improving water quality in America’s
Everglades—Restoration Strategies (RS). Included in the RS are a Water-
Quality-Based Effluent Limit for STA discharges, to be enforced by
permits that, if achieved, will ensure that park waters meet the 10 parts
per billion (ppb) target; the construction of six projects by the South
Florida Water Management District (SFWMD) that will create more than
6,500 acres of new STAs and 116,000 acre-ft of additional water storage
in Flow Equalization Basins (FEBs); and development of science plan to
ensure continued research and monitoring of water quality treatment
technologies. The FEBs are upstream water storage features intended to
provide a more steady flow of water to the STAs downstream, helping to
maintain desired water levels and flows needed to achieve optimal water
quality treatment performance. It is possible that the FEBs also will have
some TP removal ability within their footprints.
In order for CEPP to be implemented, an additional FEB (A-2) upstream
of the park is needed to ensure that additional future inflows to the park
meet the water quality targets.
The State’s Restoration Strategies project is scheduled to be fully constructed by 2025, and
several project components in the central flow path were completed by 2015. These flow path
components serve as the key water quality features that most directly affecting park water
quality A 16,000 acre Flow Equalization Basin (referred to as A-1FEB), was constructed in 2015.
In 2018, the combination of the A-1 FEB and its associated STA 3/4 produced, an annual
average outflow TP concentration of approximately 11 ppb.
In order for CEPP to redirect water flows from Lake Okeechobee southward into the
Everglades, an additional 14,000-acre FEB (A-2) was originally proposed to provide the
additional water quality treatment. In 2017 the State of Florida recommended that this shallow
FEB to be replaced with a 10,000-acre Everglades Agricultural Area deep reservoir, and a
6,500-acre STA. The new EAA storage reservoir will retain wet season flows that currently
being discharged into the northern estuaries. The additional flows from Lake Okeechobee
(new source) and existing EAA runoff will need meet the water quality standards before these
flows are discharged into the Everglades, including the park.
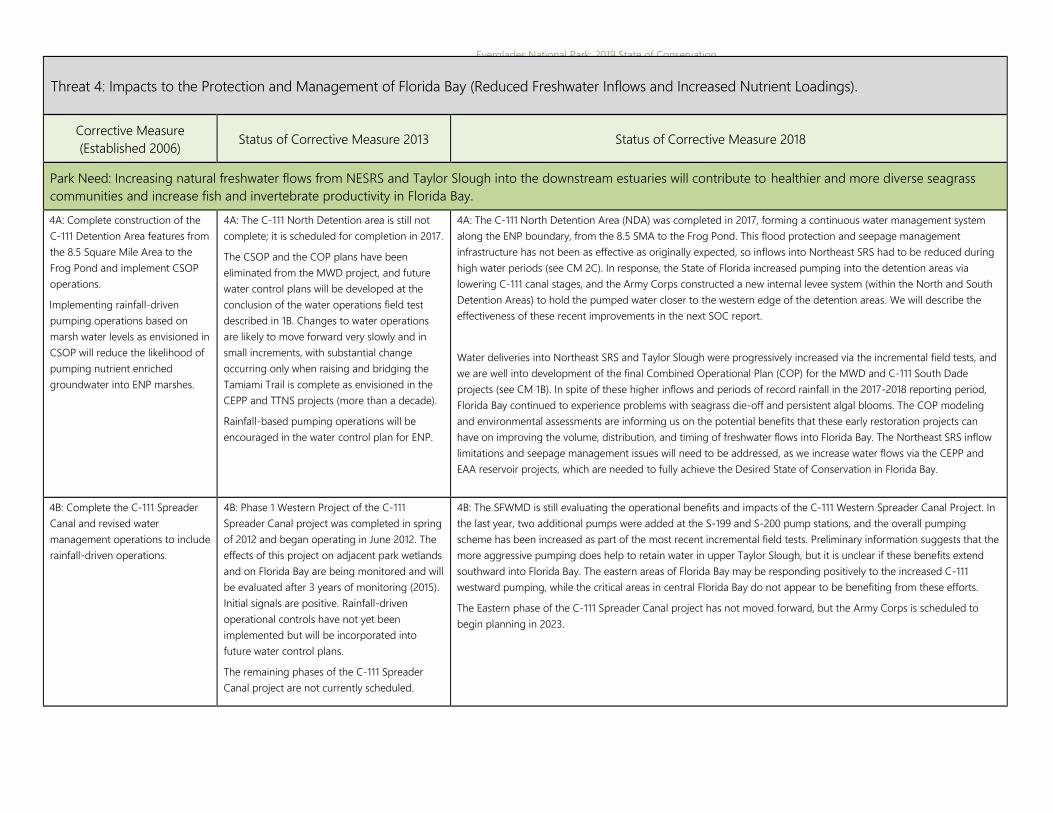
Everglades National Park: 2019 State of Conservation
Threat 4: Impacts to the Protection and Management of Florida Bay (Reduced Freshwater Inflows and Increased Nutrient Loadings).
Corrective Measure
(Established 2006) Status of Corrective Measure 2013 Status of Corrective Measure 2018
Park Need: Increasing natural freshwater flows from NESRS and Taylor Slough into the downstream estuaries will contribute to healthier and more diverse seagrass
communities and increase fish and invertebrate productivity in Florida Bay.
4A: Complete construction of the
C-111 Detention Area features from
the 8.5 Square Mile Area to the
Frog Pond and implement CSOP
operations.
Implementing rainfall-driven
pumping operations based on
marsh water levels as envisioned in
CSOP will reduce the likelihood of
pumping nutrient enriched
groundwater into ENP marshes.
4A: The C-111 North Detention area is still not
complete; it is scheduled for completion in 2017.
The CSOP and the COP plans have been
eliminated from the MWD project, and future
water control plans will be developed at the
conclusion of the water operations field test
described in 1B. Changes to water operations
are likely to move forward very slowly and in
small increments, with substantial change
occurring only when raising and bridging the
Tamiami Trail is complete as envisioned in the
CEPP and TTNS projects (more than a decade).
Rainfall-based pumping operations will be
encouraged in the water control plan for ENP.
4A: The C-111 North Detention Area (NDA) was completed in 2017, forming a continuous water management system
along the ENP boundary, from the 8.5 SMA to the Frog Pond. This flood protection and seepage management
infrastructure has not been as effective as originally expected, so inflows into Northeast SRS had to be reduced during
high water periods (see CM 2C). In response, the State of Florida increased pumping into the detention areas via
lowering C-111 canal stages, and the Army Corps constructed a new internal levee system (within the North and South
Detention Areas) to hold the pumped water closer to the western edge of the detention areas. We will describe the
effectiveness of these recent improvements in the next SOC report.
Water deliveries into Northeast SRS and Taylor Slough were progressively increased via the incremental field tests, and
we are well into development of the final Combined Operational Plan (COP) for the MWD and C-111 South Dade
projects (see CM 1B). In spite of these higher inflows and periods of record rainfall in the 2017-2018 reporting period,
Florida Bay continued to experience problems with seagrass die-off and persistent algal blooms. The COP modeling
and environmental assessments are informing us on the potential benefits that these early restoration projects can
have on improving the volume, distribution, and timing of freshwater flows into Florida Bay. The Northeast SRS inflow
limitations and seepage management issues will need to be addressed, as we increase water flows via the CEPP and
EAA reservoir projects, which are needed to fully achieve the Desired State of Conservation in Florida Bay.
4B: Complete the C-111 Spreader
Canal and revised water
management operations to include
rainfall-driven operations.
4B: Phase 1 Western Project of the C-111
Spreader Canal project was completed in spring
of 2012 and began operating in June 2012. The
effects of this project on adjacent park wetlands
and on Florida Bay are being monitored and will
be evaluated after 3 years of monitoring (2015).
Initial signals are positive. Rainfall-driven
operational controls have not yet been
implemented but will be incorporated into
future water control plans.
The remaining phases of the C-111 Spreader
Canal project are not currently scheduled.
4B: The SFWMD is still evaluating the operational benefits and impacts of the C-111 Western Spreader Canal Project. In
the last year, two additional pumps were added at the S-199 and S-200 pump stations, and the overall pumping
scheme has been increased as part of the most recent incremental field tests. Preliminary information suggests that the
more aggressive pumping does help to retain water in upper Taylor Slough, but it is unclear if these benefits extend
southward into Florida Bay. The eastern areas of Florida Bay may be responding positively to the increased C-111
westward pumping, while the critical areas in central Florida Bay do not appear to be benefiting from these efforts.
The Eastern phase of the C-111 Spreader Canal project has not moved forward, but the Army Corps is scheduled to
begin planning in 2023.
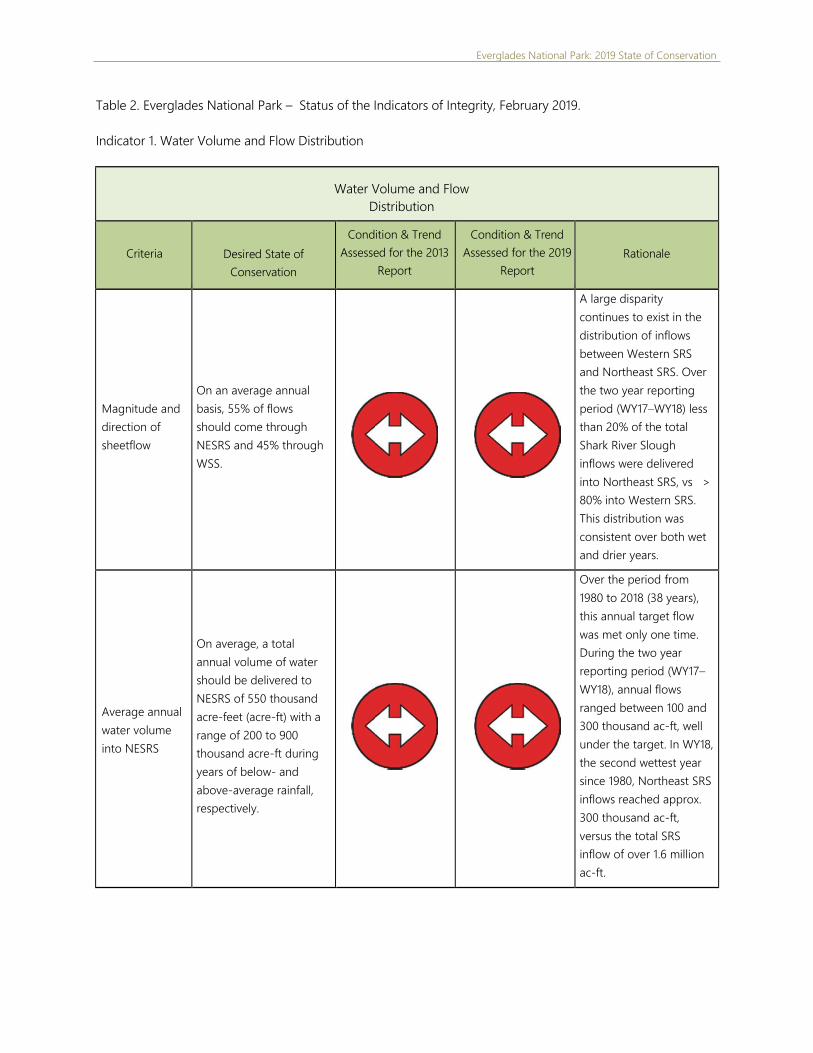
Everglades National Park: 2019 State of Conservation
Table 2. Everglades National Park – Status of the Indicators of Integrity, February 2019.
Indicator 1. Water Volume and Flow Distribution
Water Volume and Flow
Distribution
Criteria
Desired State of
Conservation
Condition & Trend
Assessed for the 2013
Report
Condition & Trend
Assessed for the 2019
Report
Rationale
Magnitude and
direction of
sheetflow
On an average annual
basis, 55% of flows
should come through
NESRS and 45% through
WSS.
A large disparity
continues to exist in the
distribution of inflows
between Western SRS
and Northeast SRS. Over
the two year reporting
period (WY17–WY18) less
than 20% of the total
Shark River Slough
inflows were delivered
into Northeast SRS, vs >
80% into Western SRS.
This distribution was
consistent over both wet
and drier years.
Average annual
water volume
into NESRS
On average, a total
annual volume of water
should be delivered to
NESRS of 550 thousand
acre-feet (acre-ft) with a
range of 200 to 900
thousand acre-ft during
years of below- and
above-average rainfall,
respectively.
Over the period from
1980 to 2018 (38 years),
this annual target flow
was met only one time.
During the two year
reporting period (WY17–
WY18), annual flows
ranged between 100 and
300 thousand ac-ft, well
under the target. In WY18,
the second wettest year
since 1980, Northeast SRS
inflows reached approx.
300 thousand ac-ft,
versus the total SRS
inflow of over 1.6 million
ac-ft.

Everglades National Park: 2019 State of Conservation
Indicator 2. Water Level Patterns in Northeast SRS
Water Level Patterns
Criteria
Desired State of
Conservation
Condition & Trend
Assessed for the
2013 Report
Condition & Trend
Assessed for the
2019 Report
Rationale
Water pattern
and water levels
(timing and
spatial
distribution of
surface- water
depth
hydropattern)
The target is to achieve annual average water levels (stage) in NESRS of approximately 8.0 feet (ft) National Geodetic Vertical Datum of 1929 (NGVD) during years of average annual rainfall. During years of below- and above-average annual rainfall, the average water level in NESRS should be 7.5 and 8.8 ft., respectively.
Northeast SRS water
levels have remained
consistently lower than
these average annual
targets. Since 1980, the
average annual water
level at the NE2 gage
never exceeded the
minimum target of 7.5
feet (NGVD). In WY18,
the second highest SRS
inflow year since 1980,
the average annual
water level at the NE2
gage was approx. 7.0
feet (NGVD).
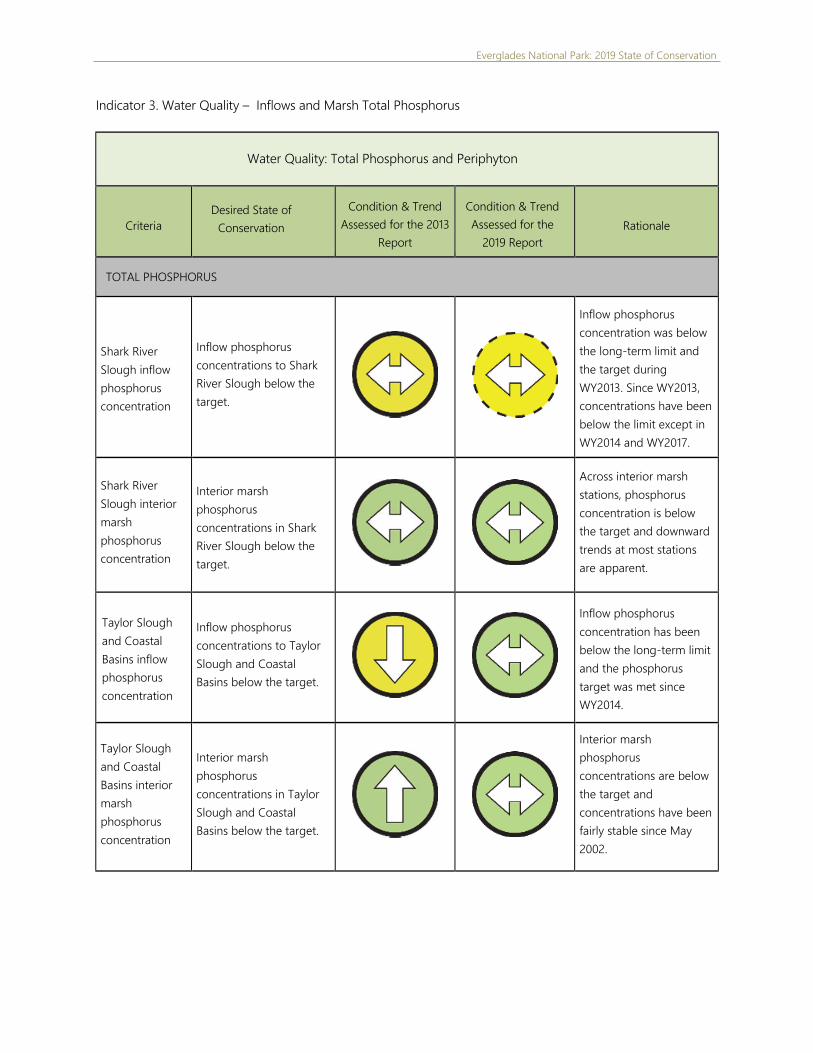
Everglades National Park: 2019 State of Conservation
Indicator 3. Water Quality – Inflows and Marsh Total Phosphorus
Water Quality: Total Phosphorus and Periphyton
Criteria
Desired State of
Conservation
Condition & Trend
Assessed for the 2013
Report
Condition & Trend
Assessed for the
2019 Report
Rationale
TOTAL PHOSPHORUS
Shark River
Slough inflow
phosphorus
concentration
Inflow phosphorus
concentrations to Shark
River Slough below the
target.
Inflow phosphorus
concentration was below
the long-term limit and
the target during
WY2013. Since WY2013,
concentrations have been
below the limit except in
WY2014 and WY2017.
Shark River
Slough interior
marsh
phosphorus
concentration
Interior marsh
phosphorus
concentrations in Shark
River Slough below the
target.
Across interior marsh
stations, phosphorus
concentration is below
the target and downward
trends at most stations
are apparent.
Taylor Slough
and Coastal
Basins inflow
phosphorus
concentration
Inflow phosphorus
concentrations to Taylor
Slough and Coastal
Basins below the target.
Inflow phosphorus
concentration has been
below the long-term limit
and the phosphorus
target was met since
WY2014.
Taylor Slough
and Coastal
Basins interior
marsh
phosphorus
concentration
Interior marsh
phosphorus
concentrations in Taylor
Slough and Coastal
Basins below the target.
Interior marsh
phosphorus
concentrations are below
the target and
concentrations have been
fairly stable since May
2002.
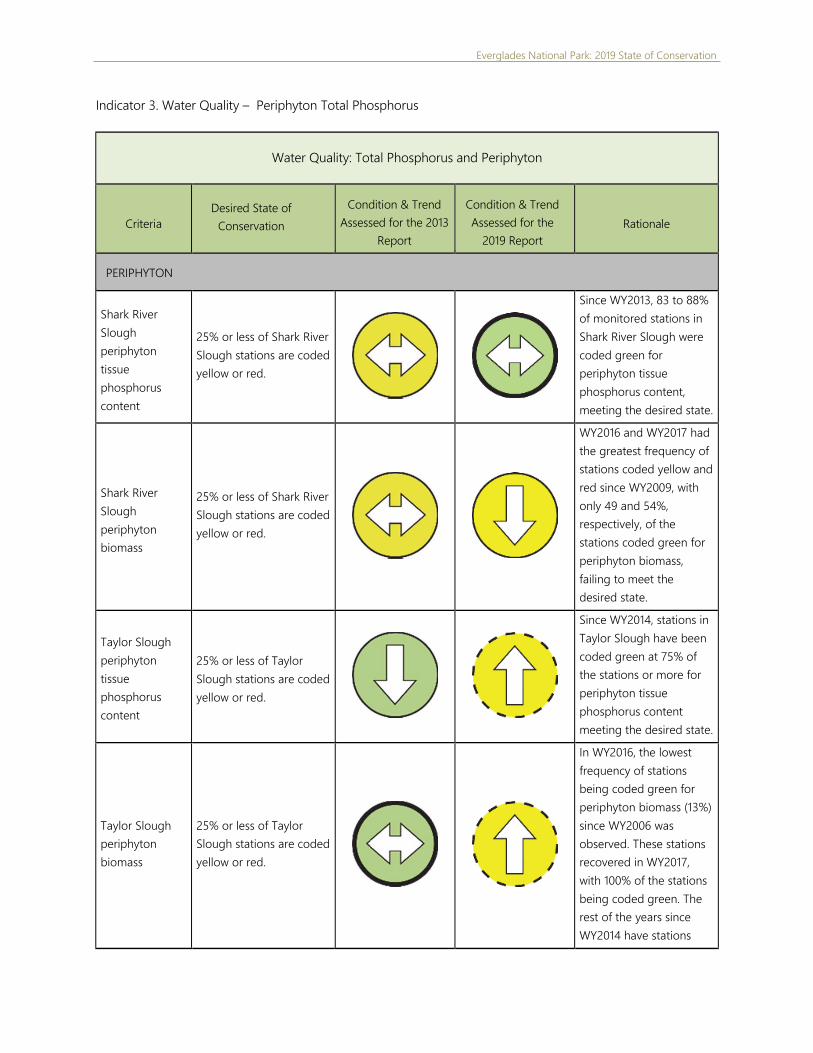
Everglades National Park: 2019 State of Conservation
Indicator 3. Water Quality – Periphyton Total Phosphorus
Water Quality: Total Phosphorus and Periphyton
Criteria
Desired State of
Conservation
Condition & Trend
Assessed for the 2013
Report
Condition & Trend
Assessed for the
2019 Report
Rationale
PERIPHYTON
Shark River
Slough
periphyton
tissue
phosphorus
content
25% or less of Shark River
Slough stations are coded
yellow or red.
Since WY2013, 83 to 88%
of monitored stations in
Shark River Slough were
coded green for
periphyton tissue
phosphorus content,
meeting the desired state.
Shark River
Slough
periphyton
biomass
25% or less of Shark River
Slough stations are coded
yellow or red.
WY2016 and WY2017 had
the greatest frequency of
stations coded yellow and
red since WY2009, with
only 49 and 54%,
respectively, of the
stations coded green for
periphyton biomass,
failing to meet the
desired state.
Taylor Slough
periphyton
tissue
phosphorus
content
25% or less of Taylor
Slough stations are coded
yellow or red.
Since WY2014, stations in
Taylor Slough have been
coded green at 75% of
the stations or more for
periphyton tissue
phosphorus content
meeting the desired state.
Taylor Slough
periphyton
biomass
25% or less of Taylor
Slough stations are coded
yellow or red.
In WY2016, the lowest
frequency of stations
being coded green for
periphyton biomass (13%)
since WY2006 was
observed. These stations
recovered in WY2017,
with 100% of the stations
being coded green. The
rest of the years since
WY2014 have stations
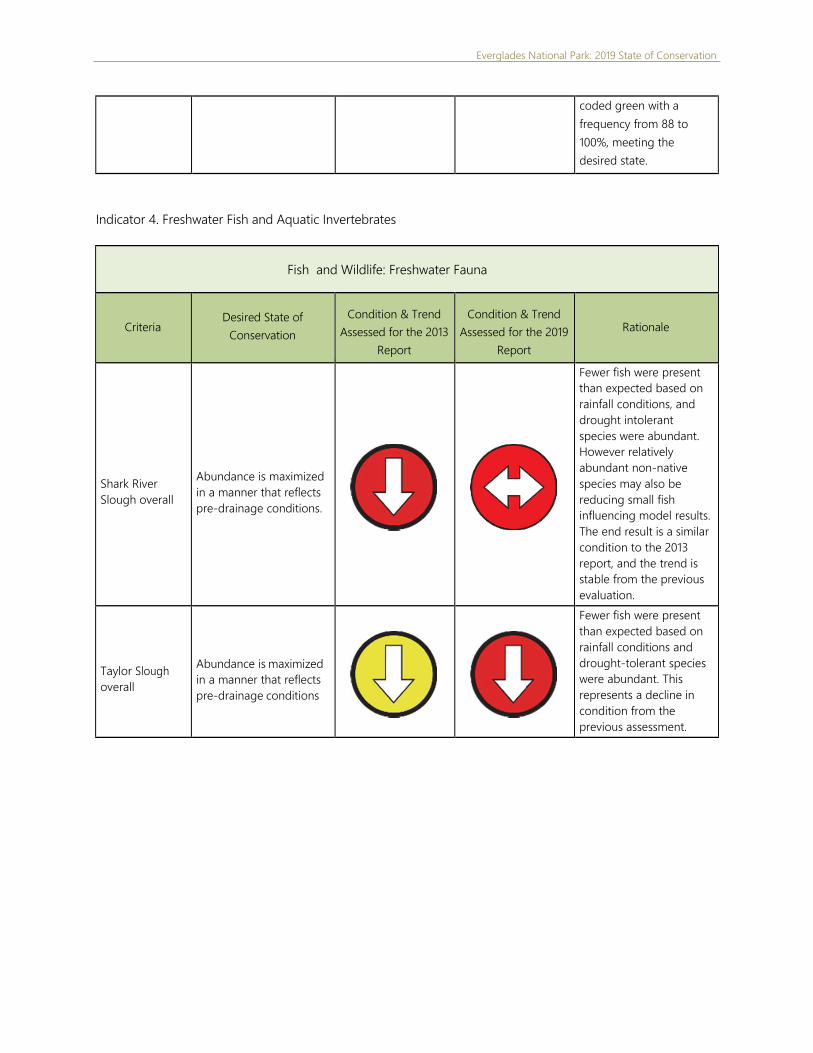
Everglades National Park: 2019 State of Conservation
coded green with a
frequency from 88 to
100%, meeting the
desired state.
Indicator 4. Freshwater Fish and Aquatic Invertebrates
Fish and Wildlife: Freshwater Fauna
Criteria Desired State of
Conservation
Condition & Trend
Assessed for the 2013
Report
Condition & Trend
Assessed for the 2019
Report
Rationale
Shark River
Slough overall
Abundance is maximized
in a manner that reflects
pre-drainage conditions.
Fewer fish were present
than expected based on
rainfall conditions, and
drought intolerant
species were abundant.
However relatively
abundant non-native
species may also be
reducing small fish
influencing model results.
The end result is a similar
condition to the 2013
report, and the trend is
stable from the previous
evaluation.
Taylor Slough
overall
Abundance is maximized
in a manner that reflects
pre-drainage conditions
Fewer fish were present
than expected based on
rainfall conditions and
drought-tolerant species
were abundant. This
represents a decline in
condition from the
previous assessment.
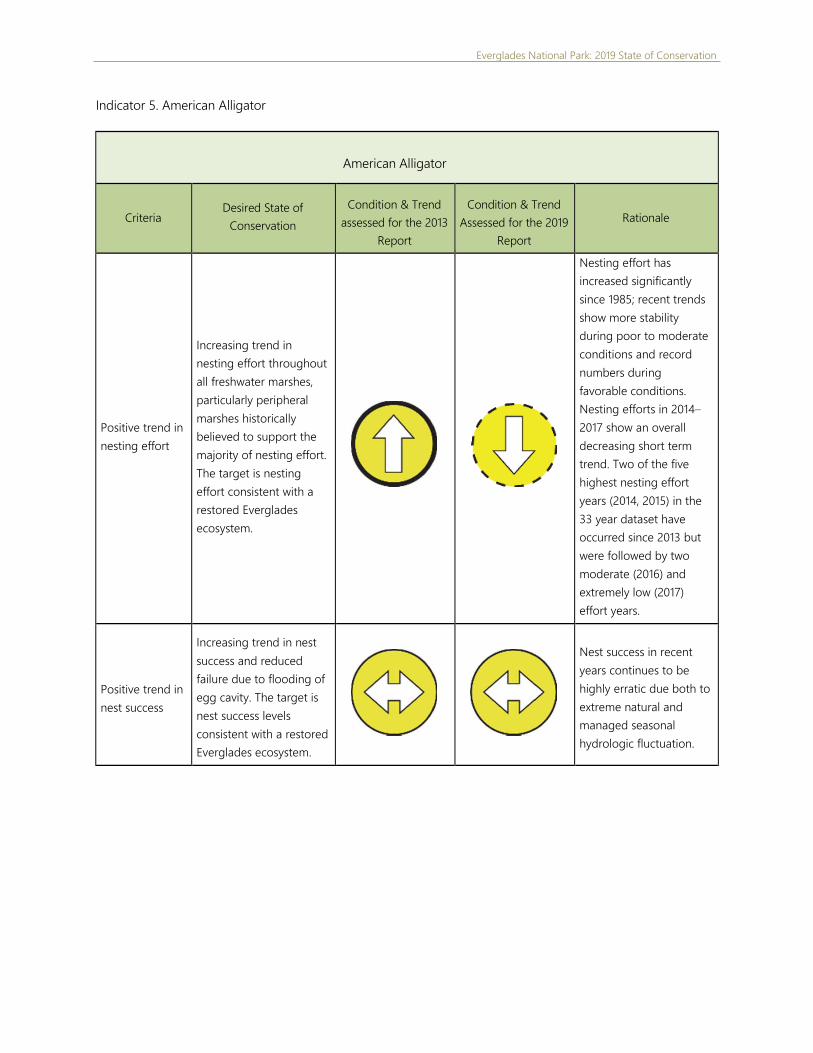
Everglades National Park: 2019 State of Conservation
Indicator 5. American Alligator
American Alligator
Criteria Desired State of
Conservation
Condition & Trend
assessed for the 2013
Report
Condition & Trend
Assessed for the 2019
Report
Rationale
Positive trend in
nesting effort
Increasing trend in
nesting effort throughout
all freshwater marshes,
particularly peripheral
marshes historically
believed to support the
majority of nesting effort.
The target is nesting
effort consistent with a
restored Everglades
ecosystem.
Nesting effort has
increased significantly
since 1985; recent trends
show more stability
during poor to moderate
conditions and record
numbers during
favorable conditions.
Nesting efforts in 2014–
2017 show an overall
decreasing short term
trend. Two of the five
highest nesting effort
years (2014, 2015) in the
33 year dataset have
occurred since 2013 but
were followed by two
moderate (2016) and
extremely low (2017)
effort years.
Positive trend in
nest success
Increasing trend in nest
success and reduced
failure due to flooding of
egg cavity. The target is
nest success levels
consistent with a restored
Everglades ecosystem.
Nest success in recent
years continues to be
highly erratic due both to
extreme natural and
managed seasonal
hydrologic fluctuation.
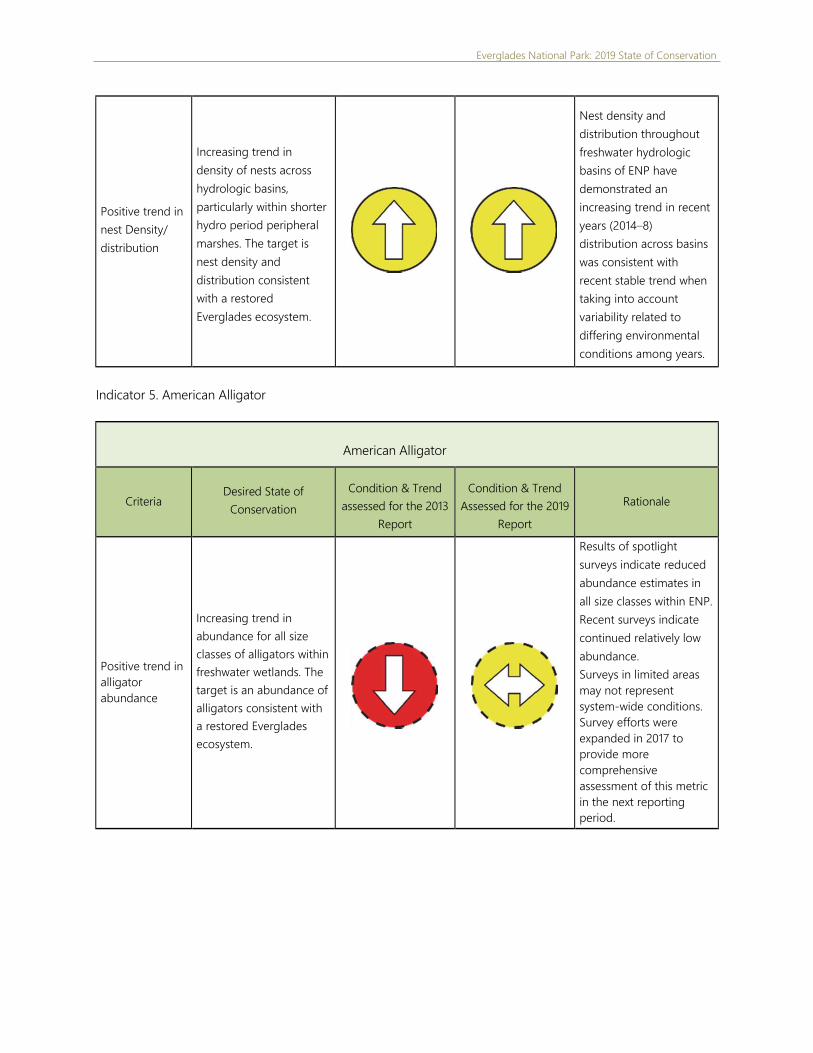
Everglades National Park: 2019 State of Conservation
Positive trend in
nest Density/
distribution
Increasing trend in
density of nests across
hydrologic basins,
particularly within shorter
hydro period peripheral
marshes. The target is
nest density and
distribution consistent
with a restored
Everglades ecosystem.
Nest density and
distribution throughout
freshwater hydrologic
basins of ENP have
demonstrated an
increasing trend in recent
years (2014–8)
distribution across basins
was consistent with
recent stable trend when
taking into account
variability related to
differing environmental
conditions among years.
Indicator 5. American Alligator
American Alligator
Criteria Desired State of
Conservation
Condition & Trend
assessed for the 2013
Report
Condition & Trend
Assessed for the 2019
Report
Rationale
Positive trend in
alligator
abundance
Increasing trend in
abundance for all size
classes of alligators within
freshwater wetlands. The
target is an abundance of
alligators consistent with
a restored Everglades
ecosystem.
Results of spotlight
surveys indicate reduced
abundance estimates in
all size classes within ENP.
Recent surveys indicate
continued relatively low
abundance.
Surveys in limited areas
may not represent
system-wide conditions.
Survey efforts were
expanded in 2017 to
provide more
comprehensive
assessment of this metric
in the next reporting
period.

Everglades National Park: 2019 State of Conservation
Indicator 6. Everglades Wading Birds
Everglades Wading Birds
Criteria
Desired State of
Conservation
Condition & Trend
Assessed for the
2013 Report
Condition & Trend
Assessed for the
2019 Report
Rationale
Total number of
pairs of nesting
birds in south
Florida
Maintain or increase
current total numbers of
nesting birds in ENP
mainland colonies to a
level consistent with a
restored Everglades
ecosystem.
Absolute size of breeding
populations of ibises,
storks, and other long-
legged wading birds
declined sharply from the
1930s to the 1970s.
Numbers nesting in the
park have since been
trending upward.
Although the 2018
nesting season was
exceptionally high year to
year variability is still
expected in future years.
Month of wood
stork nest
initiation
Month of wood stork
nest initiation should be
November or December.
Storks nested earlier (Jan.
as compared to Feb.-
Mar.) in 2017 and 2018,
but the overall trend
continues to remain
below the target of
November or December
nest initiation.
Proportion of
nests located in
ENP
headwaters
At least 70% of all
wading bird nests should
be located in the
headwaters ecotone of
the mangrove estuary of
Florida Bay and the Gulf
of Mexico (ENP).
Indicator continues to
move in a positive
direction, but remains
distant from the 70%
target.
Mean interval
between
exceptional
white ibis
(Eudocimus
albus) nesting
years
Mean interval between
exceptional white Ibis
nesting years (≥13,000
nesting pairs) should be
1–2 years.
The trend is positive and
consistent in recent years.
This interval now
consistently exceeds the
target for restoration and
has shown dramatic
improvement in the last
decade.
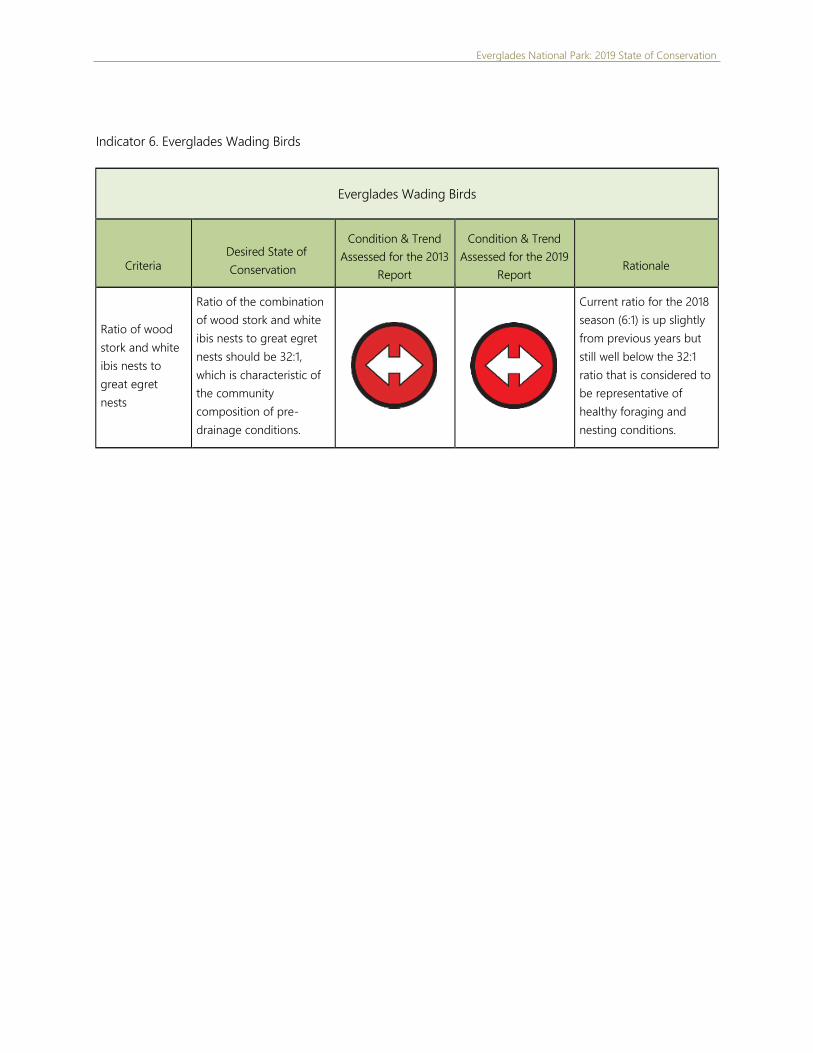
Everglades National Park: 2019 State of Conservation
Indicator 6. Everglades Wading Birds
Everglades Wading Birds
Criteria
Desired State of
Conservation
Condition & Trend
Assessed for the 2013
Report
Condition & Trend
Assessed for the 2019
Report
Rationale
Ratio of wood
stork and white
ibis nests to
great egret
nests
Ratio of the combination
of wood stork and white
ibis nests to great egret
nests should be 32:1,
which is characteristic of
the community
composition of pre-
drainage conditions.
Current ratio for the 2018
season (6:1) is up slightly
from previous years but
still well below the 32:1
ratio that is considered to
be representative of
healthy foraging and
nesting conditions.
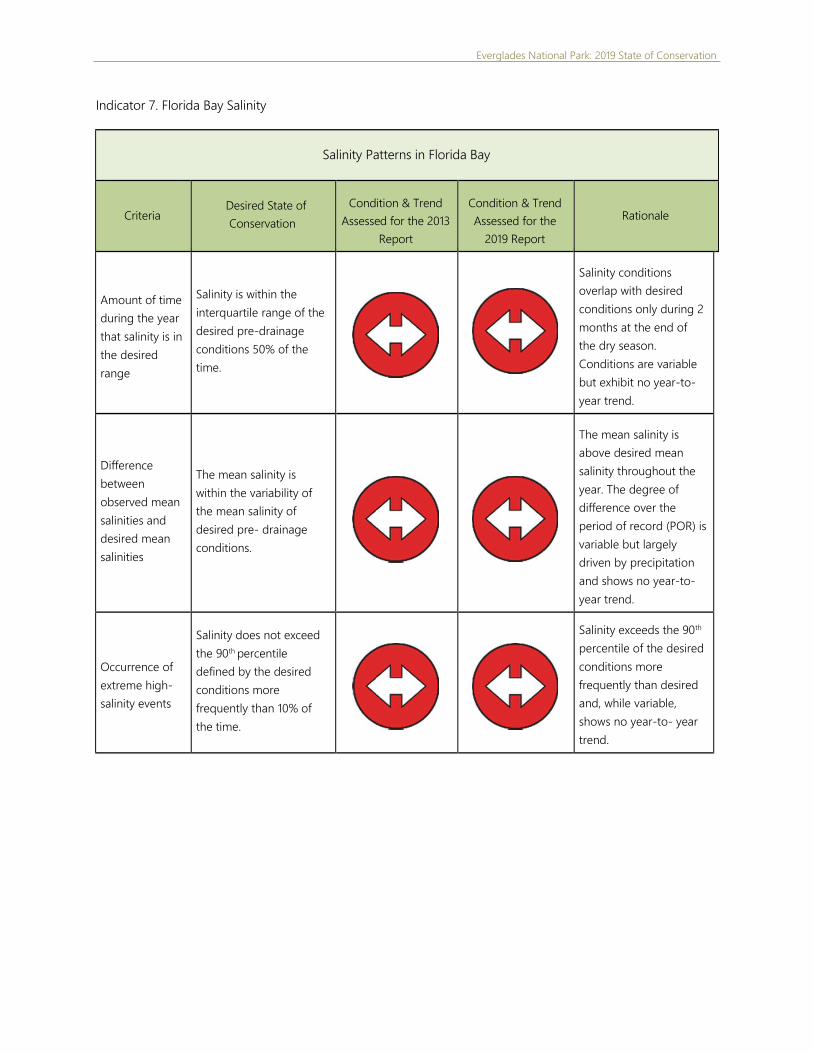
Everglades National Park: 2019 State of Conservation
Indicator 7. Florida Bay Salinity
Salinity Patterns in Florida Bay
Criteria Desired State of
Conservation
Condition & Trend
Assessed for the 2013
Report
Condition & Trend
Assessed for the
2019 Report
Rationale
Amount of time
during the year
that salinity is in
the desired
range
Salinity is within the
interquartile range of the
desired pre-drainage
conditions 50% of the
time.
Salinity conditions
overlap with desired
conditions only during 2
months at the end of
the dry season.
Conditions are variable
but exhibit no year-to-
year trend.
Difference
between
observed mean
salinities and
desired mean
salinities
The mean salinity is
within the variability of
the mean salinity of
desired pre- drainage
conditions.
The mean salinity is
above desired mean
salinity throughout the
year. The degree of
difference over the
period of record (POR) is
variable but largely
driven by precipitation
and shows no year-to-
year trend.
Occurrence of
extreme high-
salinity events
Salinity does not exceed
the 90th percentile
defined by the desired
conditions more
frequently than 10% of
the time.
Salinity exceeds the 90th
percentile of the desired
conditions more
frequently than desired
and, while variable,
shows no year-to- year
trend.

Everglades National Park: 2019 State of Conservation
Indicator 8. Florida Bay Algal Blooms (Chlorophyll- a Concentration)
Algal Blooms in Florida Bay: Chlorophyll a Concentration
Criteria
Desired State of
Conservation
Condition & Trend
Assessed for the 2013
Report
Condition & Trend
Assessed for the
2019 Report
Rationale
Northeastern
Florida Bay
chlorophyll a
concentration
Annual median
concentrations below 1
ppb.
Algal bloom conditions
improved after poor to
fair conditions in 2013–
2014. However,
following the
disturbance of Hurricane
Irma in 2017, relatively
strong and widespread
blooms occurred.
Central Florida
Bay chlorophyll a
concentration
Annual median
concentrations below 3
ppb.
Conditions had been
good since 2008, but
degraded broadly
following the seagrass
die-off in this region in
2015. Extremely high
chlorophyll a
concentrations were
measured following
Hurricane Irma.
Southern Florida
Bay chlorophyll a
concentration
Annual median
concentrations below
1 ppb.
Algal bloom conditions
were good from water
years 2011-2014, but
subsequently decreased
to fair. Recent decreases
likely was driven by
seagrass die-off and
Hurricane Irma.
Western Florida
Bay chlorophyll a
concentration
Annual median
concentrations below 3
ppb.
Western Florida Bay had
good water quality
conditions for the
decade prior to the 2015
seagrass die-off event.
Subsequent water
quality degradation
likely was driven by the
die-off and Hurricane
Irma.

Everglades National Park: 2019 State of Conservation
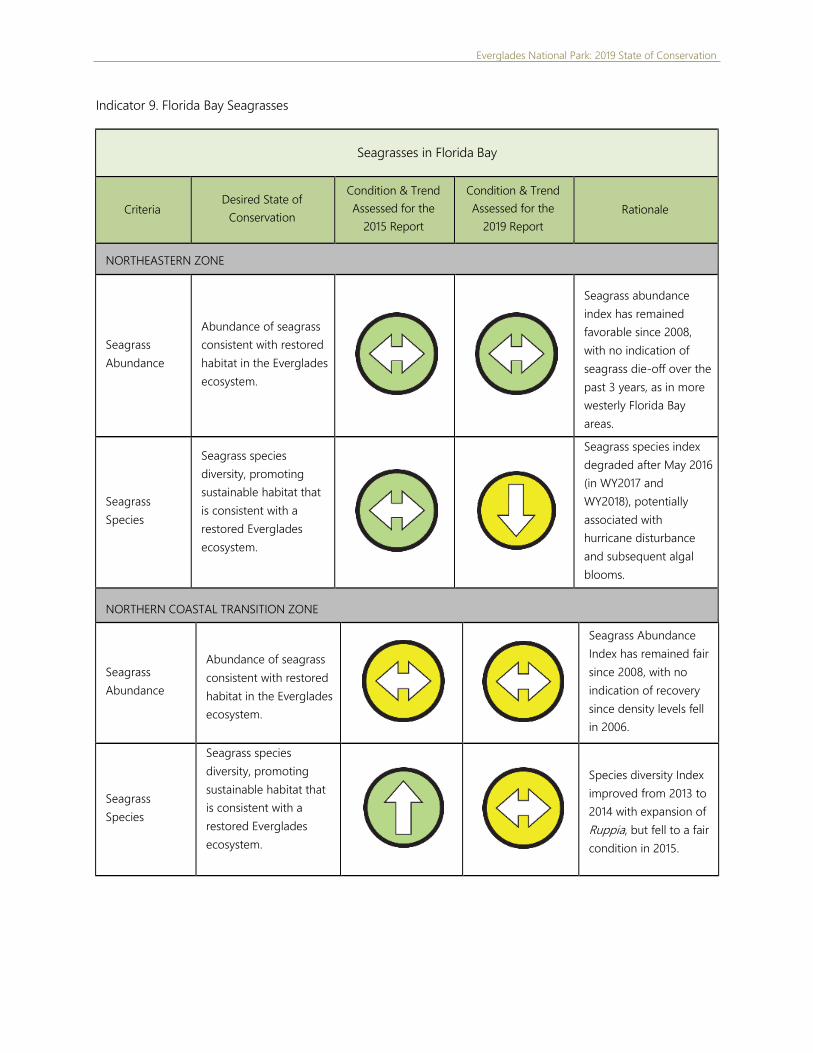
Everglades National Park: 2019 State of Conservation
Indicator 9. Florida Bay Seagrasses
Seagrasses in Florida Bay
Criteria Desired State of
Conservation
Condition & Trend
Assessed for the
2015 Report
Condition & Trend
Assessed for the
2019 Report
Rationale
NORTHEASTERN ZONE
Seagrass
Abundance
Abundance of seagrass
consistent with restored
habitat in the Everglades
ecosystem.
Seagrass abundance
index has remained
favorable since 2008,
with no indication of
seagrass die-off over the
past 3 years, as in more
westerly Florida Bay
areas.
Seagrass
Species
Seagrass species
diversity, promoting
sustainable habitat that
is consistent with a
restored Everglades
ecosystem.
Seagrass species index
degraded after May 2016
(in WY2017 and
WY2018), potentially
associated with
hurricane disturbance
and subsequent algal
blooms.
NORTHERN COASTAL TRANSITION ZONE
Seagrass
Abundance
Abundance of seagrass
consistent with restored
habitat in the Everglades
ecosystem.
Seagrass Abundance
Index has remained fair
since 2008, with no
indication of recovery
since density levels fell
in 2006.
Seagrass
Species
Seagrass species
diversity, promoting
sustainable habitat that
is consistent with a
restored Everglades
ecosystem.
Species diversity Index
improved from 2013 to
2014 with expansion of
Ruppia, but fell to a fair
condition in 2015.
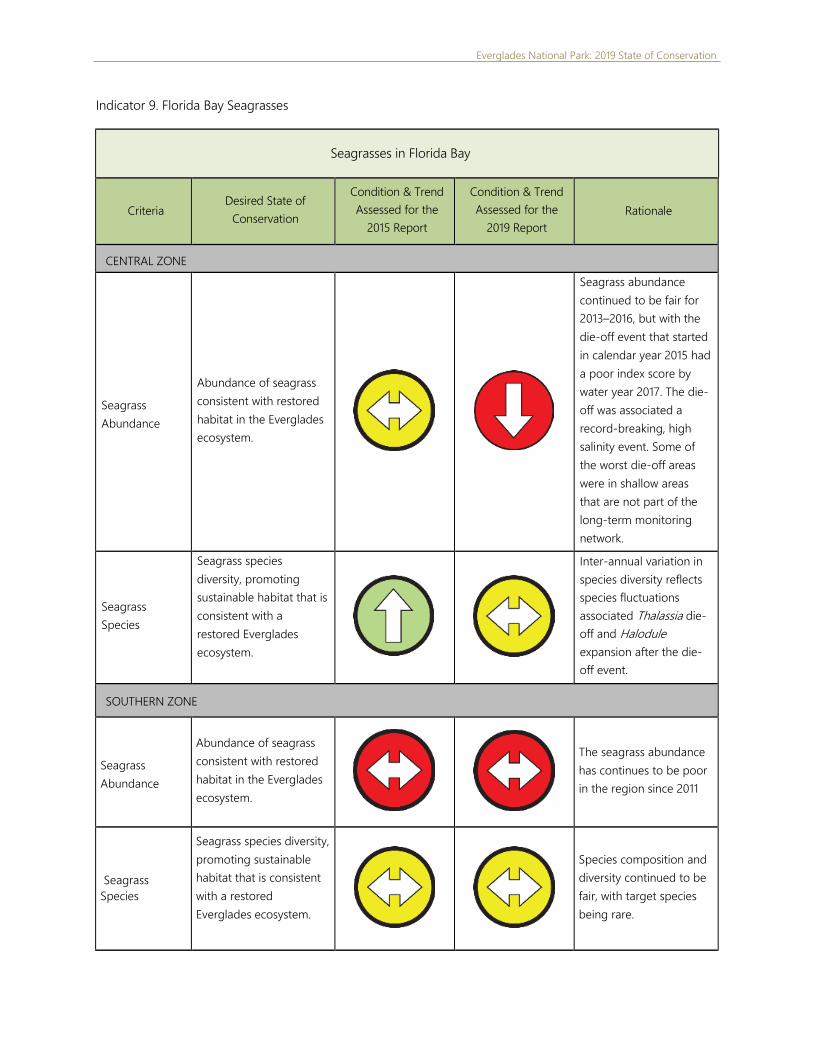
Everglades National Park: 2019 State of Conservation
Indicator 9. Florida Bay Seagrasses
Seagrasses in Florida Bay
Criteria Desired State of
Conservation
Condition & Trend
Assessed for the
2015 Report
Condition & Trend
Assessed for the
2019 Report
Rationale
CENTRAL ZONE
Seagrass
Abundance
Abundance of seagrass
consistent with restored
habitat in the Everglades
ecosystem.
Seagrass abundance
continued to be fair for
2013–2016, but with the
die-off event that started
in calendar year 2015 had
a poor index score by
water year 2017. The die-
off was associated a
record-breaking, high
salinity event. Some of
the worst die-off areas
were in shallow areas
that are not part of the
long-term monitoring
network.
Seagrass
Species
Seagrass species
diversity, promoting
sustainable habitat that is
consistent with a
restored Everglades
ecosystem.
Inter-annual variation in
species diversity reflects
species fluctuations
associated Thalassia die-
off and Halodule
expansion after the die-
off event.
SOUTHERN ZONE
Seagrass
Abundance
Abundance of seagrass
consistent with restored
habitat in the Everglades
ecosystem.
The seagrass abundance
has continues to be poor
in the region since 2011
Seagrass
Species
Seagrass species diversity,
promoting sustainable
habitat that is consistent
with a restored
Everglades ecosystem.
Species composition and
diversity continued to be
fair, with target species
being rare.
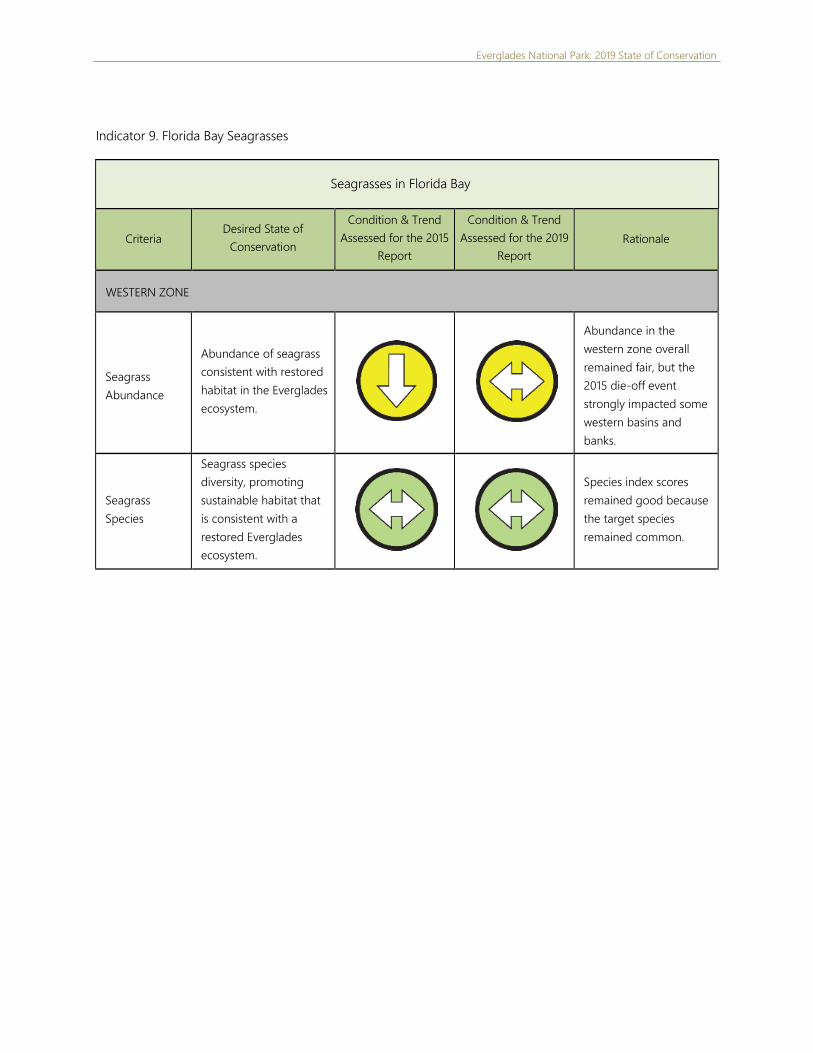
Everglades National Park: 2019 State of Conservation
Indicator 9. Florida Bay Seagrasses
Seagrasses in Florida Bay
Criteria Desired State of
Conservation
Condition & Trend
Assessed for the 2015
Report
Condition & Trend
Assessed for the 2019
Report
Rationale
WESTERN ZONE
Seagrass
Abundance
Abundance of seagrass
consistent with restored
habitat in the Everglades
ecosystem.
Abundance in the
western zone overall
remained fair, but the
2015 die-off event
strongly impacted some
western basins and
banks.
Seagrass
Species
Seagrass species
diversity, promoting
sustainable habitat that
is consistent with a
restored Everglades
ecosystem.
Species index scores
remained good because
the target species
remained common.
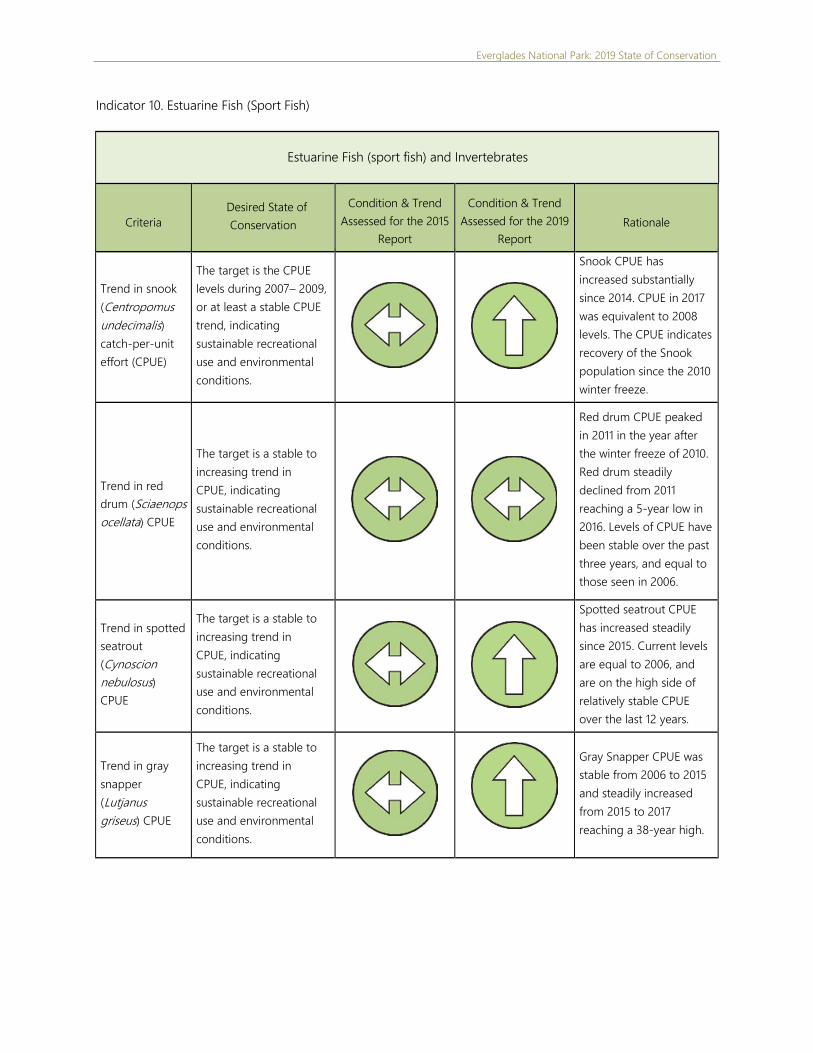
Everglades National Park: 2019 State of Conservation
Indicator 10. Estuarine Fish (Sport Fish)
Estuarine Fish (sport fish) and Invertebrates
Criteria
Desired State of
Conservation
Condition & Trend
Assessed for the 2015
Report
Condition & Trend
Assessed for the 2019
Report
Rationale
Trend in snook
(Centropomus
undecimalis)
catch-per-unit
effort (CPUE)
The target is the CPUE
levels during 2007– 2009,
or at least a stable CPUE
trend, indicating
sustainable recreational
use and environmental
conditions.
Snook CPUE has
increased substantially
since 2014. CPUE in 2017
was equivalent to 2008
levels. The CPUE indicates
recovery of the Snook
population since the 2010
winter freeze.
Trend in red
drum (Sciaenops
ocellata) CPUE
The target is a stable to
increasing trend in
CPUE, indicating
sustainable recreational
use and environmental
conditions.
Red drum CPUE peaked
in 2011 in the year after
the winter freeze of 2010.
Red drum steadily
declined from 2011
reaching a 5-year low in
2016. Levels of CPUE have
been stable over the past
three years, and equal to
those seen in 2006.
Trend in spotted
seatrout
(Cynoscion
nebulosus)
CPUE
The target is a stable to
increasing trend in
CPUE, indicating
sustainable recreational
use and environmental
conditions.
Spotted seatrout CPUE
has increased steadily
since 2015. Current levels
are equal to 2006, and
are on the high side of
relatively stable CPUE
over the last 12 years.
Trend in gray
snapper
(Lutjanus
griseus) CPUE
The target is a stable to
increasing trend in
CPUE, indicating
sustainable recreational
use and environmental
conditions.
Gray Snapper CPUE was
stable from 2006 to 2015
and steadily increased
from 2015 to 2017
reaching a 38-year high.
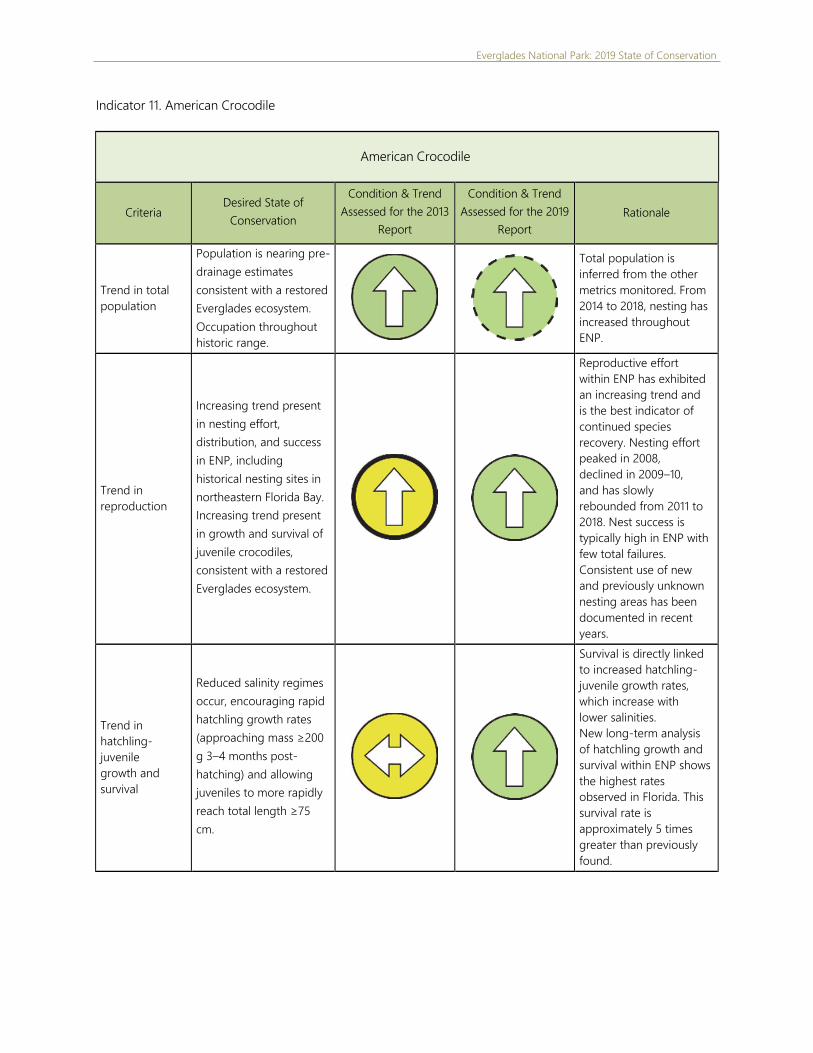
Everglades National Park: 2019 State of Conservation
Indicator 11. American Crocodile
American Crocodile
Criteria Desired State of
Conservation
Condition & Trend
Assessed for the 2013
Report
Condition & Trend
Assessed for the 2019
Report
Rationale
Trend in total
population
Population is nearing pre-
drainage estimates
consistent with a restored
Everglades ecosystem.
Occupation throughout
historic range.
Total population is
inferred from the other
metrics monitored. From
2014 to 2018, nesting has
increased throughout
ENP.
Trend in
reproduction
Increasing trend present
in nesting effort,
distribution, and success
in ENP, including
historical nesting sites in
northeastern Florida Bay.
Increasing trend present
in growth and survival of
juvenile crocodiles,
consistent with a restored
Everglades ecosystem.
Reproductive effort
within ENP has exhibited
an increasing trend and
is the best indicator of
continued species
recovery. Nesting effort
peaked in 2008,
declined in 2009–10,
and has slowly
rebounded from 2011 to
2018. Nest success is
typically high in ENP with
few total failures.
Consistent use of new
and previously unknown
nesting areas has been
documented in recent
years.
Trend in
hatchling-
juvenile
growth and
survival
Reduced salinity regimes
occur, encouraging rapid
hatchling growth rates
(approaching mass ≥200
g 3–4 months post-
hatching) and allowing
juveniles to more rapidly
reach total length ≥75
cm.
Survival is directly linked
to increased hatchling-
juvenile growth rates,
which increase with
lower salinities.
New long-term analysis
of hatchling growth and
survival within ENP shows
the highest rates
observed in Florida. This
survival rate is
approximately 5 times
greater than previously
found.
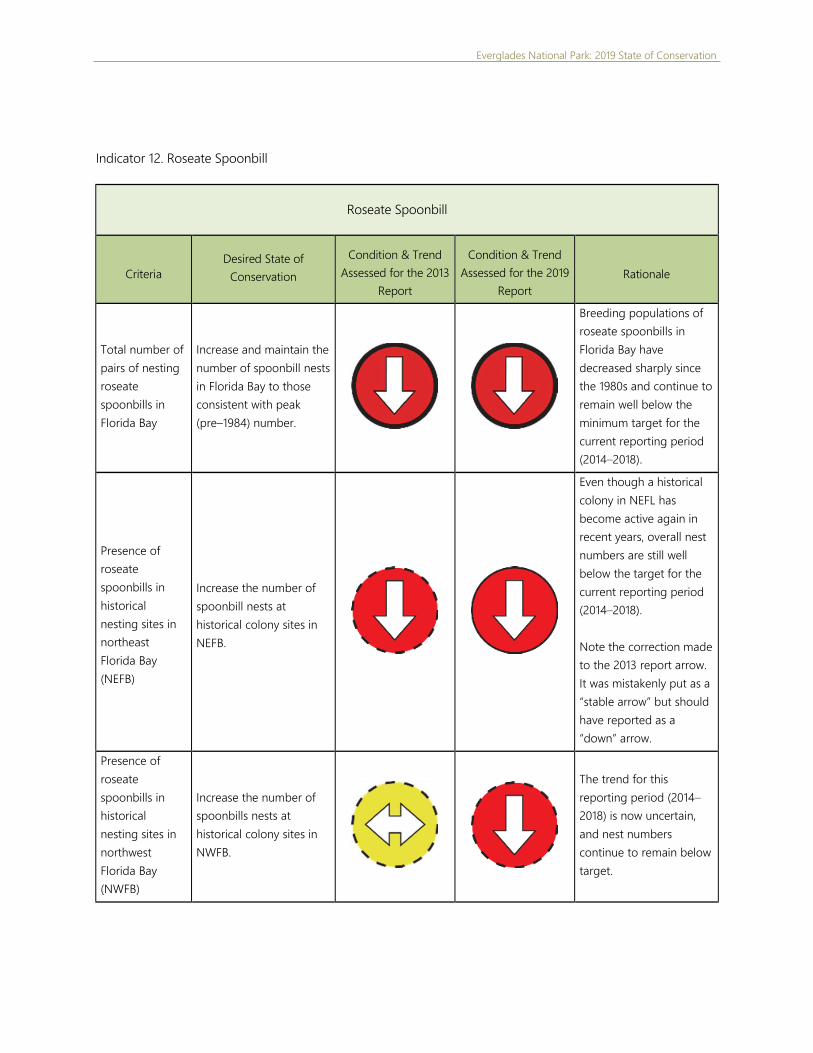
Everglades National Park: 2019 State of Conservation
Indicator 12. Roseate Spoonbill
Roseate Spoonbill
Criteria
Desired State of
Conservation
Condition & Trend
Assessed for the 2013
Report
Condition & Trend
Assessed for the 2019
Report
Rationale
Total number of
pairs of nesting
roseate
spoonbills in
Florida Bay
Increase and maintain the
number of spoonbill nests
in Florida Bay to those
consistent with peak
(pre–1984) number.
Breeding populations of
roseate spoonbills in
Florida Bay have
decreased sharply since
the 1980s and continue to
remain well below the
minimum target for the
current reporting period
(2014–2018).
Presence of
roseate
spoonbills in
historical
nesting sites in
northeast
Florida Bay
(NEFB)
Increase the number of
spoonbill nests at
historical colony sites in
NEFB.
Even though a historical
colony in NEFL has
become active again in
recent years, overall nest
numbers are still well
below the target for the
current reporting period
(2014–2018).
Note the correction made
to the 2013 report arrow.
It was mistakenly put as a
“stable arrow” but should
have reported as a
“down” arrow.
Presence of
roseate
spoonbills in
historical
nesting sites in
northwest
Florida Bay
(NWFB)
Increase the number of
spoonbills nests at
historical colony sites in
NWFB.
The trend for this
reporting period (2014–
2018) is now uncertain,
and nest numbers
continue to remain below
target.

Everglades National Park: 2019 State of Conservation
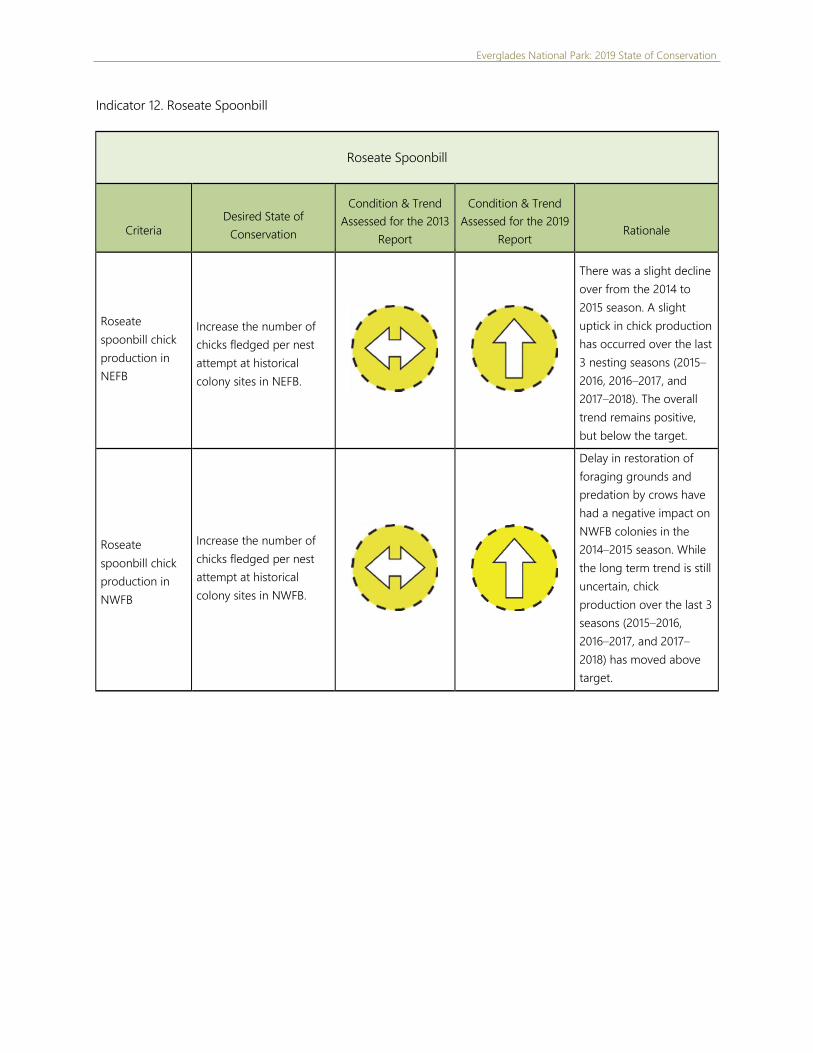
Everglades National Park: 2019 State of Conservation
Indicator 12. Roseate Spoonbill
Roseate Spoonbill
Criteria
Desired State of
Conservation
Condition & Trend
Assessed for the 2013
Report
Condition & Trend
Assessed for the 2019
Report
Rationale
Roseate
spoonbill chick
production in
NEFB
Increase the number of
chicks fledged per nest
attempt at historical
colony sites in NEFB.
There was a slight decline
over from the 2014 to
2015 season. A slight
uptick in chick production
has occurred over the last
3 nesting seasons (2015–
2016, 2016–2017, and
2017–2018). The overall
trend remains positive,
but below the target.
Roseate
spoonbill chick
production in
NWFB
Increase the number of
chicks fledged per nest
attempt at historical
colony sites in NWFB.
Delay in restoration of
foraging grounds and
predation by crows have
had a negative impact on
NWFB colonies in the
2014–2015 season. While
the long term trend is still
uncertain, chick
production over the last 3
seasons (2015–2016,
2016–2017, and 2017–
2018) has moved above
target.
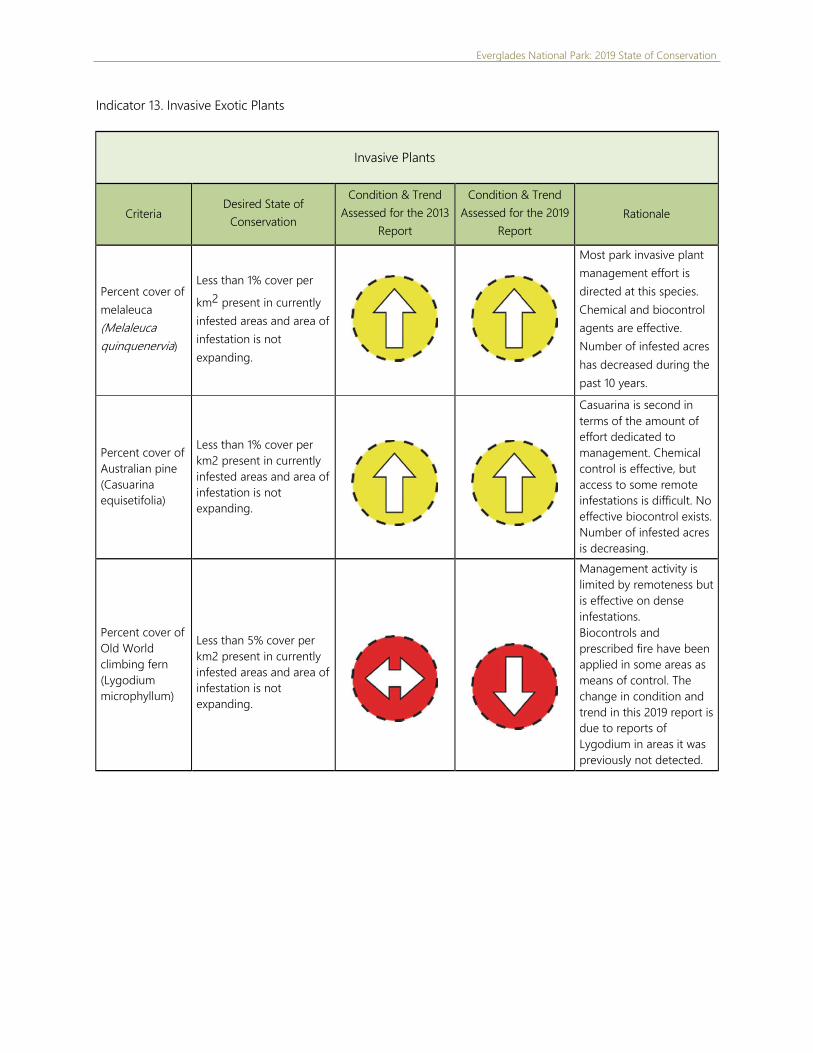
Everglades National Park: 2019 State of Conservation
Indicator 13. Invasive Exotic Plants
Invasive Plants
Criteria Desired State of
Conservation
Condition & Trend
Assessed for the 2013
Report
Condition & Trend
Assessed for the 2019
Report
Rationale
Percent cover of
melaleuca
(Melaleuca
quinquenervia)
Less than 1% cover per
km2 present in currently
infested areas and area of
infestation is not
expanding.
Most park invasive plant
management effort is
directed at this species.
Chemical and biocontrol
agents are effective.
Number of infested acres
has decreased during the
past 10 years.
Percent cover of
Australian pine
(Casuarina
equisetifolia)
Less than 1% cover per
km2 present in currently
infested areas and area of
infestation is not
expanding.
Casuarina is second in
terms of the amount of
effort dedicated to
management. Chemical
control is effective, but
access to some remote
infestations is difficult. No
effective biocontrol exists.
Number of infested acres
is decreasing.
Percent cover of
Old World
climbing fern
(Lygodium
microphyllum)
Less than 5% cover per
km2 present in currently
infested areas and area of
infestation is not
expanding.
Management activity is
limited by remoteness but
is effective on dense
infestations.
Biocontrols and
prescribed fire have been
applied in some areas as
means of control. The
change in condition and
trend in this 2019 report is
due to reports of
Lygodium in areas it was
previously not detected.
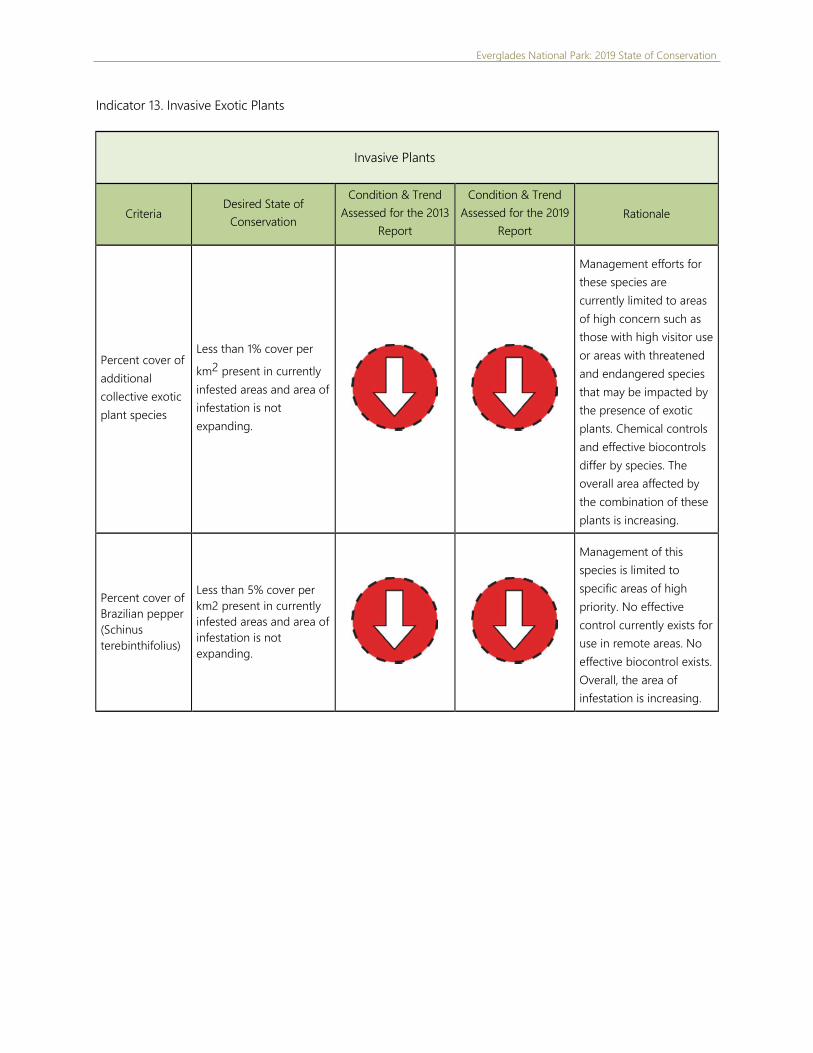
Everglades National Park: 2019 State of Conservation
Indicator 13. Invasive Exotic Plants
Invasive Plants
Criteria Desired State of
Conservation
Condition & Trend
Assessed for the 2013
Report
Condition & Trend
Assessed for the 2019
Report
Rationale
Percent cover of
additional
collective exotic
plant species
Less than 1% cover per
km2 present in currently
infested areas and area of
infestation is not
expanding.
Management efforts for
these species are
currently limited to areas
of high concern such as
those with high visitor use
or areas with threatened
and endangered species
that may be impacted by
the presence of exotic
plants. Chemical controls
and effective biocontrols
differ by species. The
overall area affected by
the combination of these
plants is increasing.
Percent cover of
Brazilian pepper
(Schinus
terebinthifolius)
Less than 5% cover per
km2 present in currently
infested areas and area of
infestation is not
expanding.
Management of this
species is limited to
specific areas of high
priority. No effective
control currently exists for
use in remote areas. No
effective biocontrol exists.
Overall, the area of
infestation is increasing.
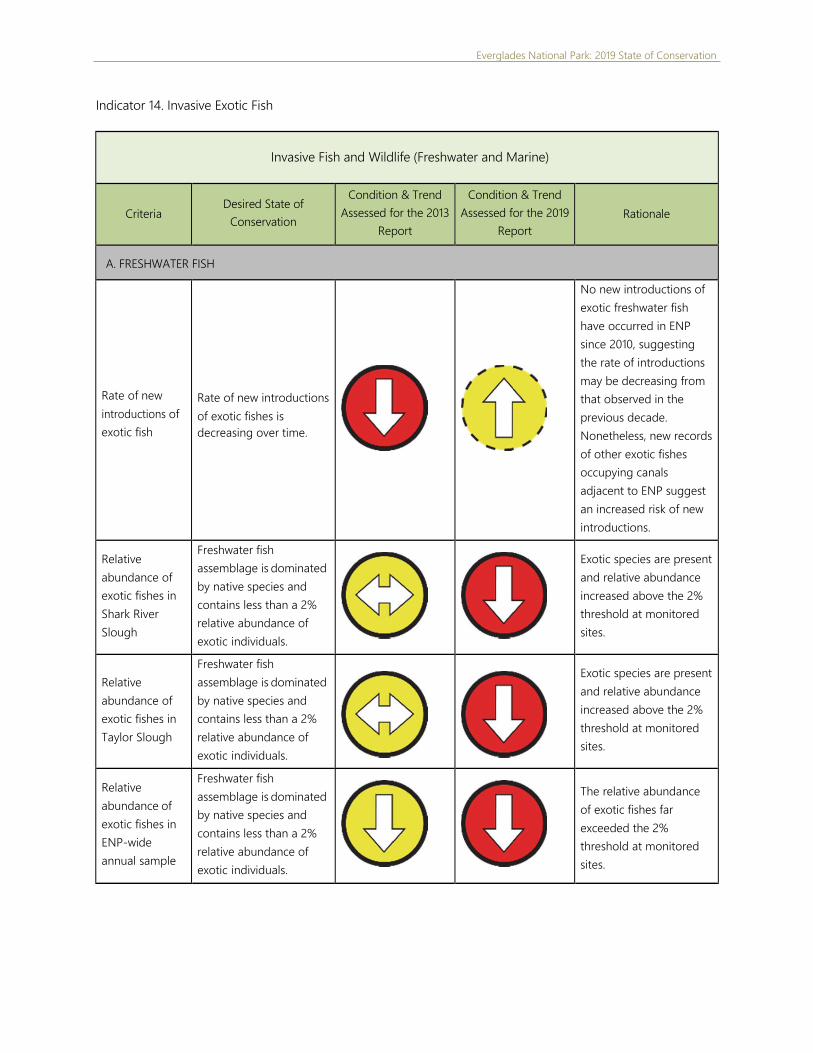
Everglades National Park: 2019 State of Conservation
Indicator 14. Invasive Exotic Fish
Invasive Fish and Wildlife (Freshwater and Marine)
Criteria Desired State of
Conservation
Condition & Trend
Assessed for the 2013
Report
Condition & Trend
Assessed for the 2019
Report
Rationale
A. FRESHWATER FISH
Rate of new
introductions of
exotic fish
Rate of new introductions
of exotic fishes is
decreasing over time.
No new introductions of
exotic freshwater fish
have occurred in ENP
since 2010, suggesting
the rate of introductions
may be decreasing from
that observed in the
previous decade.
Nonetheless, new records
of other exotic fishes
occupying canals
adjacent to ENP suggest
an increased risk of new
introductions.
Relative
abundance of
exotic fishes in
Shark River
Slough
Freshwater fish
assemblage is dominated
by native species and
contains less than a 2%
relative abundance of
exotic individuals.
Exotic species are present
and relative abundance
increased above the 2%
threshold at monitored
sites.
Relative
abundance of
exotic fishes in
Taylor Slough
Freshwater fish
assemblage is dominated
by native species and
contains less than a 2%
relative abundance of
exotic individuals.
Exotic species are present
and relative abundance
increased above the 2%
threshold at monitored
sites.
Relative
abundance of
exotic fishes in
ENP-wide
annual sample
Freshwater fish
assemblage is dominated
by native species and
contains less than a 2%
relative abundance of
exotic individuals.
The relative abundance
of exotic fishes far
exceeded the 2%
threshold at monitored
sites.
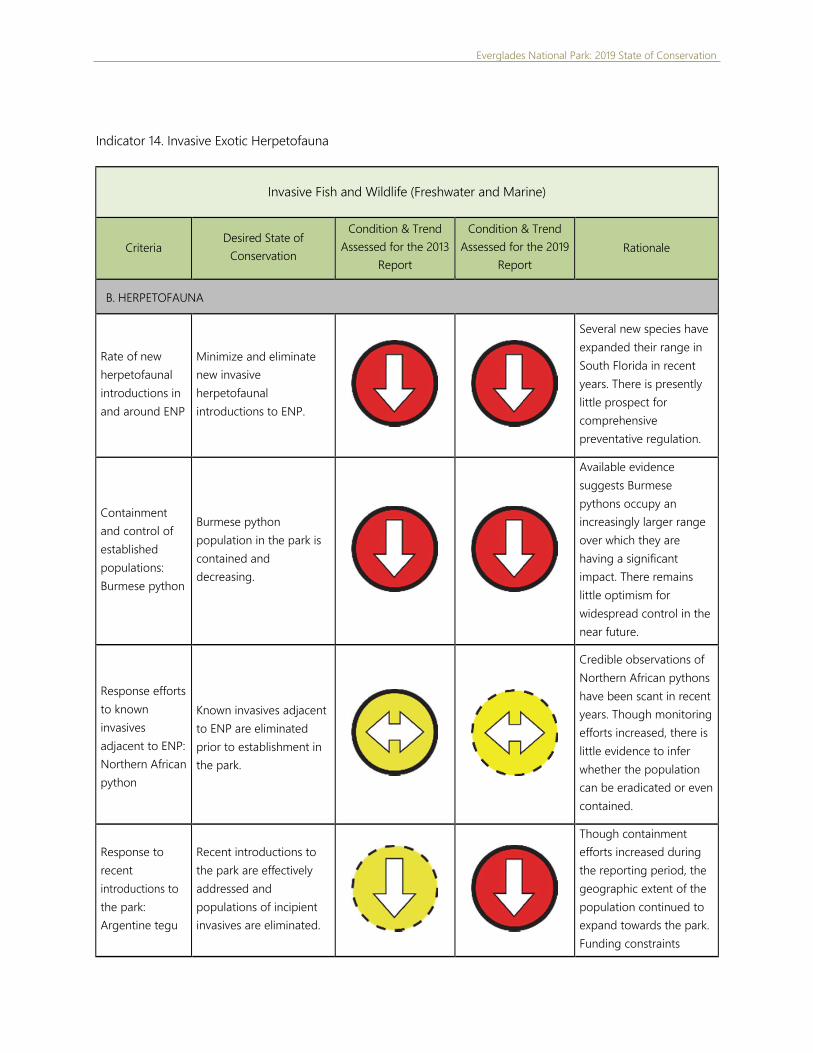
Everglades National Park: 2019 State of Conservation
Indicator 14. Invasive Exotic Herpetofauna
Invasive Fish and Wildlife (Freshwater and Marine)
Criteria Desired State of
Conservation
Condition & Trend
Assessed for the 2013
Report
Condition & Trend
Assessed for the 2019
Report
Rationale
B. HERPETOFAUNA
Rate of new
herpetofaunal
introductions in
and around ENP
Minimize and eliminate
new invasive
herpetofaunal
introductions to ENP.
Several new species have
expanded their range in
South Florida in recent
years. There is presently
little prospect for
comprehensive
preventative regulation.
Containment
and control of
established
populations:
Burmese python
Burmese python
population in the park is
contained and
decreasing.
Available evidence
suggests Burmese
pythons occupy an
increasingly larger range
over which they are
having a significant
impact. There remains
little optimism for
widespread control in the
near future.
Response efforts
to known
invasives
adjacent to ENP:
Northern African
python
Known invasives adjacent
to ENP are eliminated
prior to establishment in
the park.
Credible observations of
Northern African pythons
have been scant in recent
years. Though monitoring
efforts increased, there is
little evidence to infer
whether the population
can be eradicated or even
contained.
Response to
recent
introductions to
the park:
Argentine tegu
Recent introductions to
the park are effectively
addressed and
populations of incipient
invasives are eliminated.
Though containment
efforts increased during
the reporting period, the
geographic extent of the
population continued to
expand towards the park.
Funding constraints
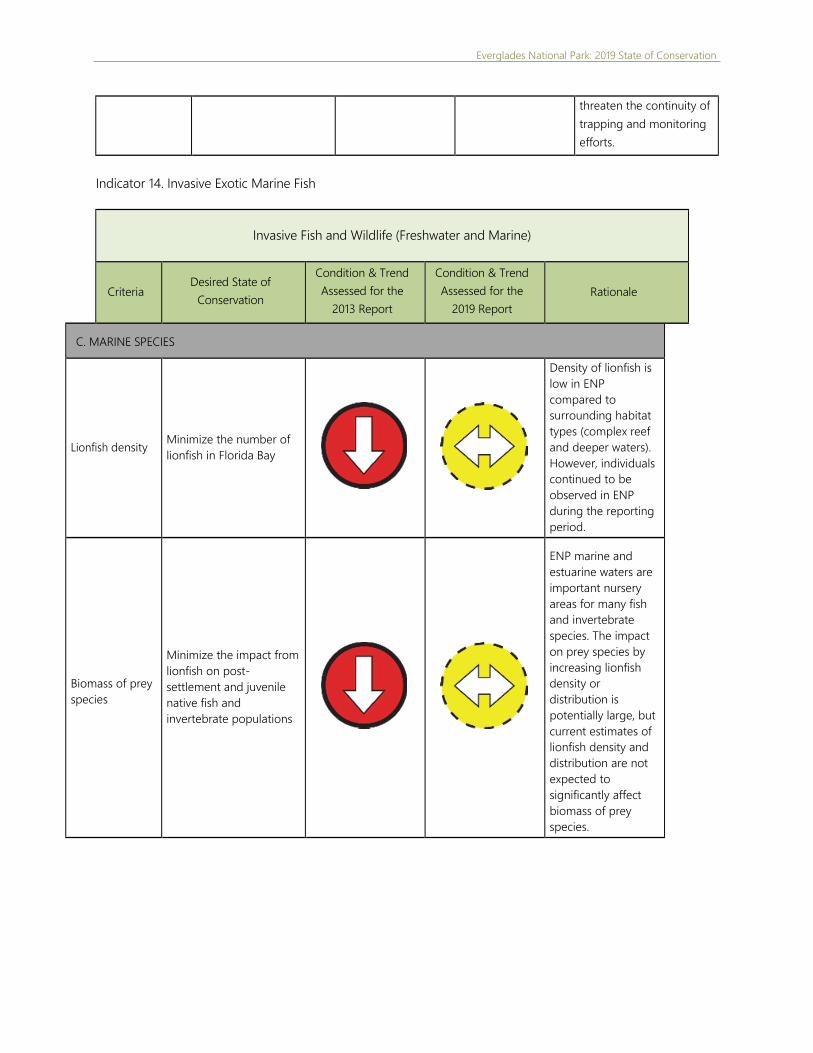
Everglades National Park: 2019 State of Conservation
threaten the continuity of
trapping and monitoring
efforts.
Indicator 14. Invasive Exotic Marine Fish
Invasive Fish and Wildlife (Freshwater and Marine)
Criteria Desired State of
Conservation
Condition & Trend
Assessed for the
2013 Report
Condition & Trend
Assessed for the
2019 Report
Rationale
C. MARINE SPECIES
Lionfish density Minimize the number of
lionfish in Florida Bay
Density of lionfish is
low in ENP
compared to
surrounding habitat
types (complex reef
and deeper waters).
However, individuals
continued to be
observed in ENP
during the reporting
period.
Biomass of prey
species
Minimize the impact from
lionfish on post-
settlement and juvenile
native fish and
invertebrate populations
ENP marine and
estuarine waters are
important nursery
areas for many fish
and invertebrate
species. The impact
on prey species by
increasing lionfish
density or
distribution is
potentially large, but
current estimates of
lionfish density and
distribution are not
expected to
significantly affect
biomass of prey
species.
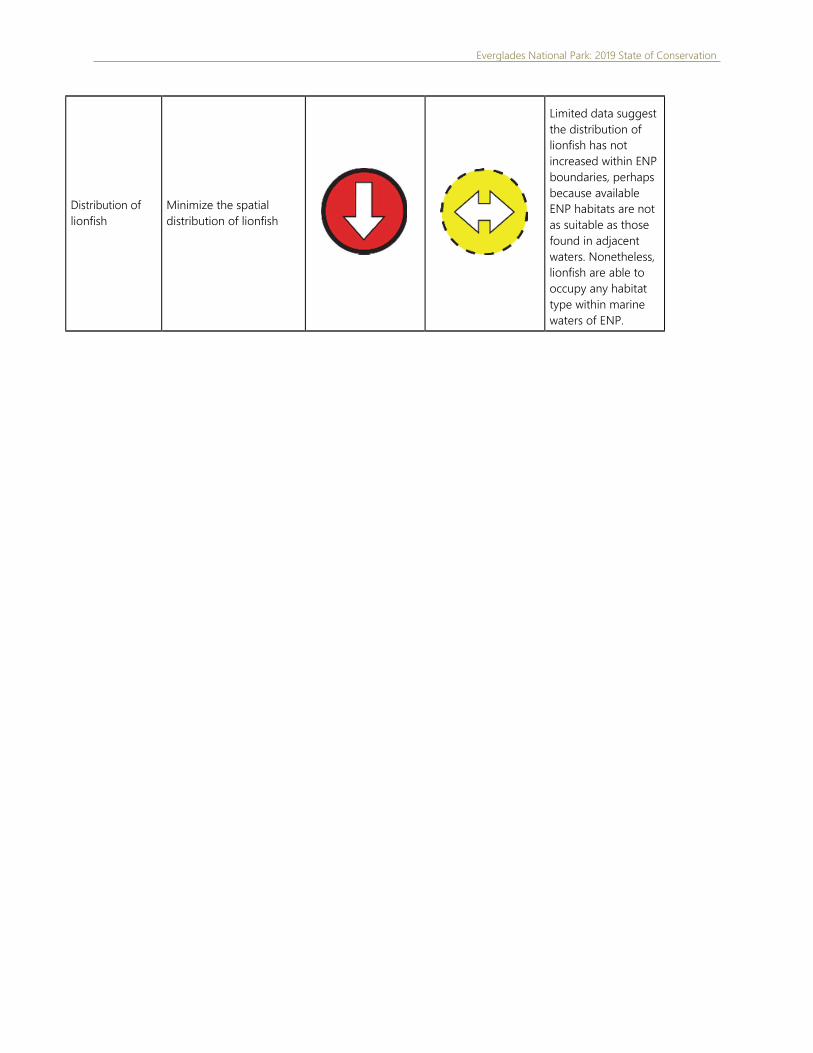
Everglades National Park: 2019 State of Conservation
Distribution of
lionfish
Minimize the spatial
distribution of lionfish
Limited data suggest
the distribution of
lionfish has not
increased within ENP
boundaries, perhaps
because available
ENP habitats are not
as suitable as those
found in adjacent
waters. Nonetheless,
lionfish are able to
occupy any habitat
type within marine
waters of ENP.