Embed Size (px)
Citation preview

EVENT RESPONSE 2018.
www.jbarisk.com
CONTENTS.
EXECUTIVE SUMMARY.
Event Response 2018 | www.jbarisk.com
Tropical Storm Yagi ....................................................................................................................... 2
Kerala Flooding .............................................................................................................................. 4
Typhoon Jebi .................................................................................................................................. 8
Nigeria Flooding ............................................................................................................................ 10
Typhoon Mangkhut - storm surge in Hong Kong ................................................................... 12
Mekong Delta Flooding ................................................................................................................ 14
Italy Flooding ................................................................................................................................. 16
Sydney Flooding ............................................................................................................................. 18
References ..................................................................................................................................... 20
Contact Information ...................................................................................................................... 21
This year, we’ve produced commentaries and reports for flooding around the world, with flood footprints delineating the estimated flood extents and depths available for some flood events.
2018’s major flood events began with ex-tropical cyclone Gita in February, the first major tropical cyclone of the 2017-2018 South Pacific cyclone season. It passed through the region towards New Zealand after badly impacting Tonga, parts of Samoa and southern Fiji, with significant wind losses experienced.
Winter Storm Oliver also occurred during February, causing record breaking flooding from Texas to Michigan. Localised property flooding was reported across the areas affected, with mandatory evacuation in place in many towns and cities and reports of three fatalities.
Western Japan experienced extensive flooding in July following Storm Prapiroon’s passage over the country, with multiple prefectures experiencing flash flooding and landslides which caused approximately
Our specialist event response team monitors global conditions to ensure our clients can respond rapidly as major flood events occur. Here is a round-up of our 2018 event response work.

www.jbarisk.com
Event Response 2018 | www.jbarisk.com Page 1
114 fatalities. Economic impacts were widespread, with several large manufacturing companies in the region ceasing production.
In August, the Philippines was hit by Tropical Storm Yagi which caused widespread disruption on the island of Luzon. The estimated cost for assistance for this event was reported at around USD $270,000.
August also brought another major flood event to Kerala, India, which experienced unprecedented summer monsoon rainfall and widespread flooding across the state. Reports estimated around 340 deaths with initial economic losses estimated at USD $2.8 billion, much of this stemming from agricultural loss.
In August, Typhoon Rumbia similarly made landfall in Shandong Province, China, bringing heavy rainfall to cities including Shaoguang, Qingzhou, Weifang and Changle. The event resulted in at least 14 fatalities and an estimated economic loss of USD $1.45 billion, being described as the most serious flooding in the region since 1974.
Nigeria experienced torrential rain in northern and central areas in August, coinciding with high river levels that exacerbated flood risk in the states of Kano, Nasarawa and Niger. This resulted in 19 fatalities and major disruption to agricultural activity, with 6,500 hectares of crops destroyed.
September saw widespread flood activity, with Typhoon Jebi making landfall in Japan as the strongest typhoon to hit the country in the last 25 years. Jebi caused extensive flood and wind damage in southern Japan, including Osaka Bay, causing severe economic disruption.
Hurricane Florence also made landfall on the US east coast in September as a category 1 storm with sustained winds of 90mph. It caused widespread inland and coastal flooding in the Carolinas and West Virginia, with an immense storm surge of up to 10ft. Approximately 18 people lost their lives and 1.7 million were evacuated.
Hot on the heels of Hurricane Florence, Typhoon Mangkhut travelled through the Pacific before making landfall in the Philippines, southern China and Hong Kong with widespread flooding and storm surge. Huge economic losses were reported across the area, reaching into the billions of USD, with 74 fatalities reported in the Philippines alone.
In October, Hurricane Michael made landfall as a category 4 hurricane on the northwest coast of Florida’s panhandle, the second major hurricane during the 2018 Atlantic hurricane season. Severe storm surge resulted in coastal flooding with sustained winds of 80-100mph and a reported six fatalities were recorded in the area.
October also brought widespread coastal flooding to the Mekong Delta, Vietnam, due to a combination of high tides, heavy rainfall and high river levels. Can Tho City was the worst affected, with 91 hectares of crops severely damaged.
In October, Italy experienced widespread flooding across the country with torrential rainfall and strong winds claiming at least 30 lives. The worst damage was felt in the northern regions of Trentino and Veneto, with Venice experiencing the worst high tide flooding seen in the past decade.
In November, Sydney experienced torrential rainfall with reports of more than 100mm of rain falling across the city in less than two hours, with the total rainfall comparable to the average rainfall normally received for the whole month of November. This storm claimed two lives and is estimated to have caused around AUD $13.5 million in flood claims.
You can find the full range of our global flood reports below. Please get in touch with our event response team at [email protected] for our footprints and event commentaries.
Event Report Footprint Commentary
Ex-tropical cyclone Gita 7 7
Winter Storm Oliver 7 7
Birmingham (UK) flood 7
Western Japan flood 7 7
Tropical Storm Yagi 7
Kerala flood 7
Shandong flood 7
Typhoon Jebi 7
Nigeria flood 7
Hurricane Florence 7 7
Typhoon Mangkhut 7 7 7
Hurricane Michael 7 7
Mekong Delta flood 7
Italy flood 7
Sydney flood 7
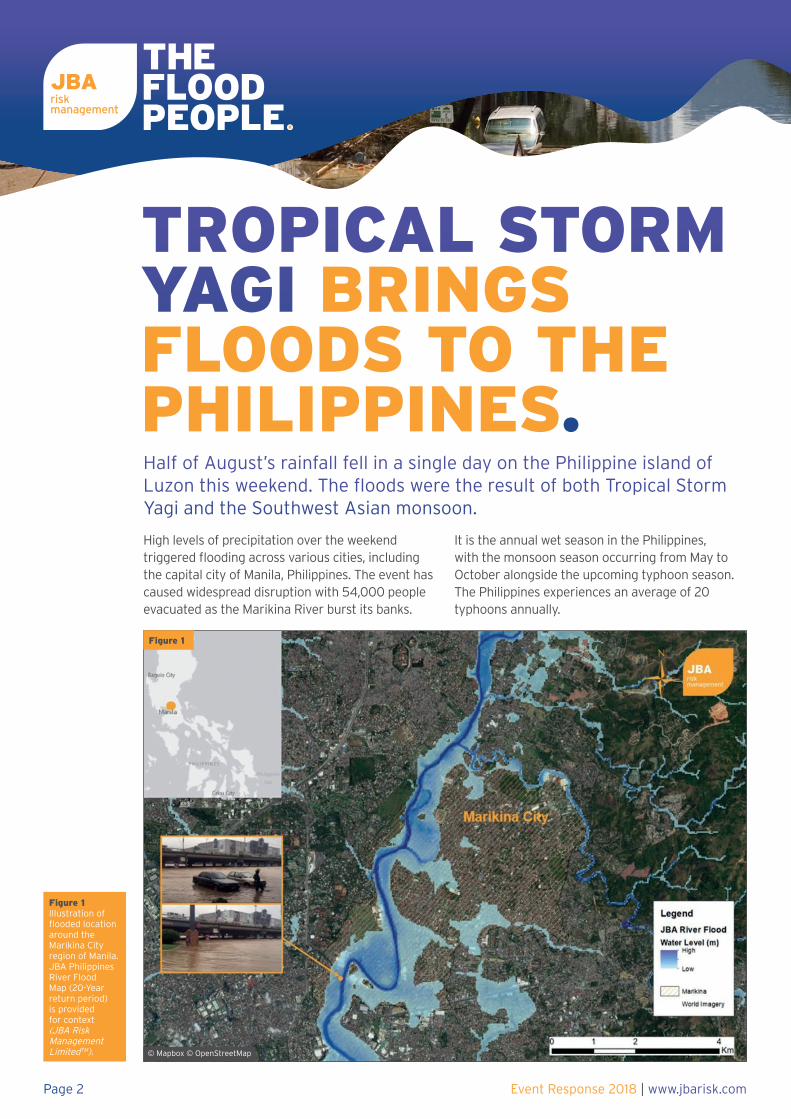
High levels of precipitation over the weekend triggered flooding across various cities, including the capital city of Manila, Philippines. The event has caused widespread disruption with 54,000 people evacuated as the Marikina River burst its banks.
It is the annual wet season in the Philippines, with the monsoon season occurring from May to October alongside the upcoming typhoon season. The Philippines experiences an average of 20 typhoons annually.
Figure 1Illustration of flooded location around the Marikina City region of Manila. JBA Philippines River Flood Map (20-Year return period) is provided for context (JBA Risk Management LimitedTM).
TROPICAL STORM YAGI BRINGS FLOODS TO THE PHILIPPINES.Half of August’s rainfall fell in a single day on the Philippine island of Luzon this weekend. The floods were the result of both Tropical Storm Yagi and the Southwest Asian monsoon.
© Mapbox © OpenStreetMap
Event Response 2018 | www.jbarisk.comPage 2
Figure 1
www.jbarisk.com
Over the weekend, Tropical Storm Yagi passed north of the Philippines before making landfall in Zhejiang, China. Despite the distance between Yagi and Metro Manila, the powerful tropical storm further enhanced monsoonal rainfall in Metro Manila and other regions such as Rizal and Bulacan. On Saturday (11 August 2018), the central Luzon area received half of the precipitation expected for the whole month of August in just one day (PAGASA). Due to the persistent rainfall, several regions were given the red alert (the highest tier for the flood warning system in Philippines) and advised to take precautionary measures against possible flooding and landslides (PAGASA).
Marikina City was one of the cities worst affected by the floods with approximately 22,000 Marikenos evacuated to shelters when the red-alert was issued. The local authorities evacuated people forcefully to prevent extra casualties as river levels continued to increase. The height of the river peaked at 20.6m on 23:00 PST, 11 August 2018. It has been reported by the National Disaster Risk Reduction and Management Council (NDRRMC) that the total cost of assistance for this event will be approximately PHP 14.7 million (USD $270,000), with Marikina City accounting for ~77% of this total. However, economic losses and costs incurred due to damaged properties and contents are likely to be more significant.
A summary of past flood events in Marikina CityIt is not unusual for Marikina City to experience flooding along the Marikina River. In 1992, flooding from the Marikina River inundated 27% of the city and 10,000 houses were found to be at risk of flooding (Asian Disaster Preparedness Centre). In 2009, Tropical Storm Ondoy delivered a month’s worth of rainfall on Metro Manila within 12 hours on 26 September 2009. The 2009 event remains etched in people’s memory. The Marikina river peaked at 23.6m and was accountable for 465 deaths in Metro Manila, with total damages of PHP 10.9 billion (USD $200 million).
The recent flooding is not in isolation: the Philippines has a high exposure to various natural perils. Rainfall and strong winds repeatedly cause casualties and damage to properties. On average, such natural hazards cost approximately 1% of the national GDP. Non-life insurance penetration in the Philippines is estimated at 1.9% of GDP (Oxford Business Group). This is slightly higher than many neighbouring countries such as Sri Lanka (1.2%) and Vietnam (1.6%), but quite far behind others in the region such as Malaysia (5%) and Thailand (6%).
JBA Risk Management has nationwide return period flood maps for the Philippines at 30m resolution. Please get in touch for further information.
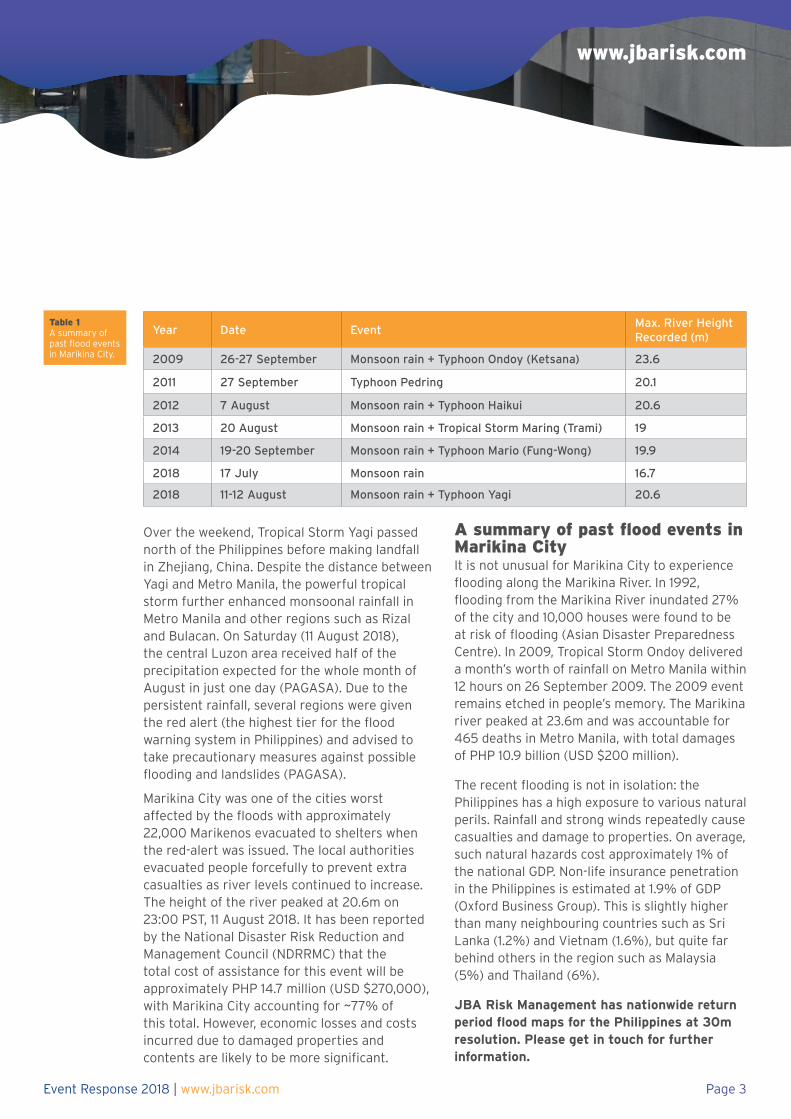
Table 1A summary of past flood events in Marikina City.
Event Response 2018 | www.jbarisk.com Page 3
Year Date EventMax. River Height Recorded (m)
2009 26-27 September Monsoon rain + Typhoon Ondoy (Ketsana) 23.6
2011 27 September Typhoon Pedring 20.1
2012 7 August Monsoon rain + Typhoon Haikui 20.6
2013 20 August Monsoon rain + Tropical Storm Maring (Trami) 19
2014 19-20 September Monsoon rain + Typhoon Mario (Fung-Wong) 19.9
2018 17 July Monsoon rain 16.7
2018 11-12 August Monsoon rain + Typhoon Yagi 20.6
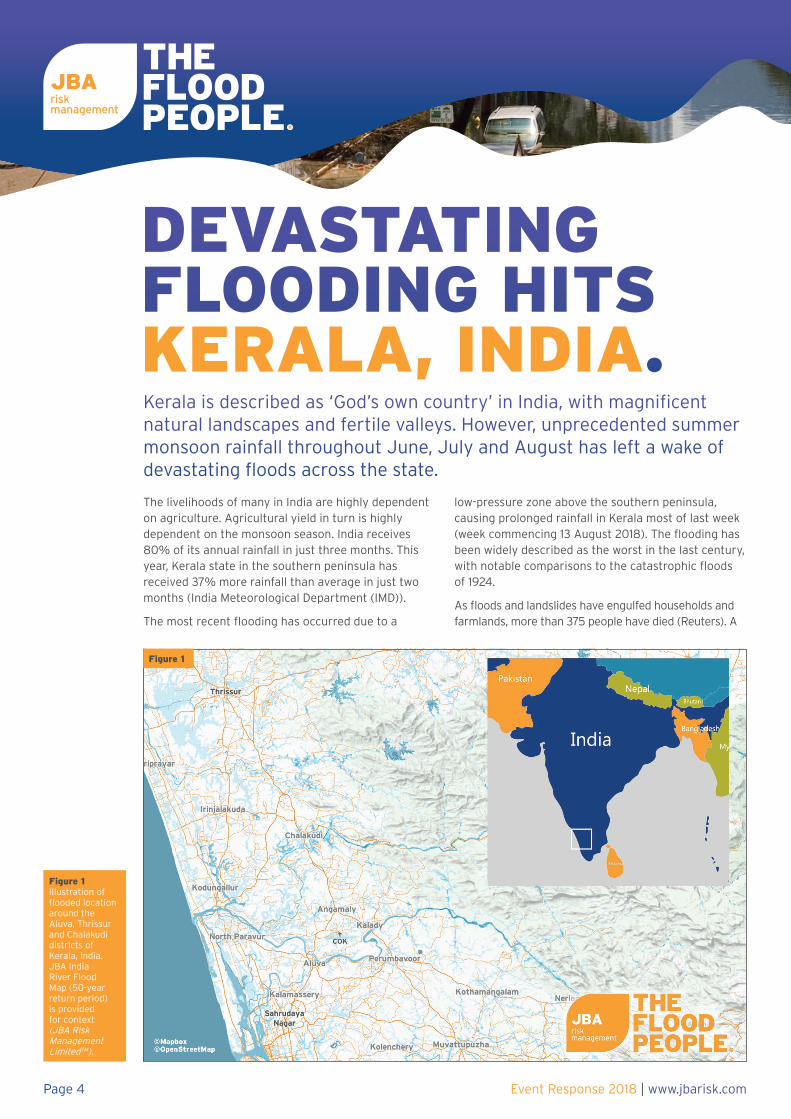
The livelihoods of many in India are highly dependent on agriculture. Agricultural yield in turn is highly dependent on the monsoon season. India receives 80% of its annual rainfall in just three months. This year, Kerala state in the southern peninsula has received 37% more rainfall than average in just two months (India Meteorological Department (IMD)).
The most recent flooding has occurred due to a
low-pressure zone above the southern peninsula, causing prolonged rainfall in Kerala most of last week (week commencing 13 August 2018). The flooding has been widely described as the worst in the last century, with notable comparisons to the catastrophic floods of 1924.
As floods and landslides have engulfed households and farmlands, more than 375 people have died (Reuters). A
Figure 1Illustration of flooded location around the Aluva, Thrissur and Chalakudi districts of Kerala, India. JBA India River Flood Map (50-year return period) is provided for context (JBA Risk Management LimitedTM).
DEVASTATING FLOODING HITS KERALA, INDIA.Kerala is described as ‘God’s own country’ in India, with magnificent natural landscapes and fertile valleys. However, unprecedented summer monsoon rainfall throughout June, July and August has left a wake of devastating floods across the state.
Event Response 2018 | www.jbarisk.comPage 4
Figure 1
www.jbarisk.com
large majority of the fatalities occurred due to landslides caused by the floods. Idukki and Wayand were the states most affected by landslides, with an estimated 1.2 million people now in temporary shelters (Reuters).
Further issues have continued for many as shelters face shortages of water and medical supplies, given that roads are impassable in certain areas (BBC UK). In some places, young children and the elderly have been airlifted to safety. Total economic losses are estimated at USD $2.8 billion thus far and are likely to increase as recovery efforts continue (Reuters/ Singapore Straits
Times).
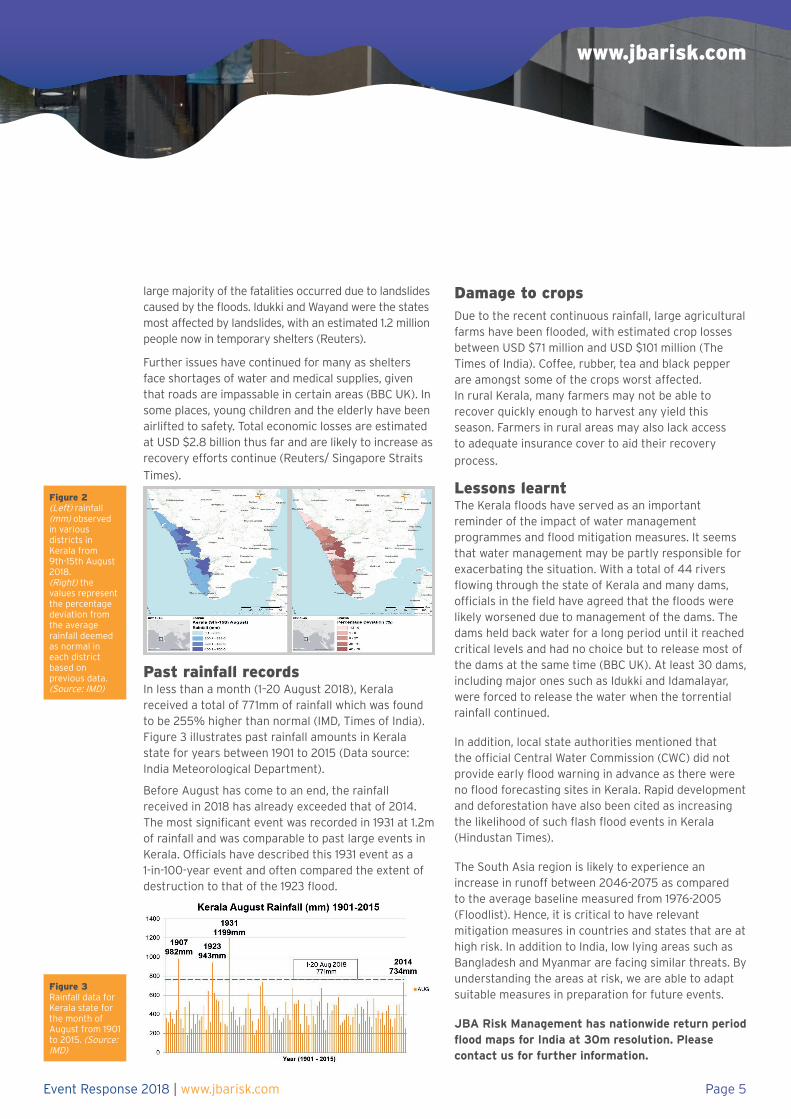
Past rainfall recordsIn less than a month (1–20 August 2018), Kerala received a total of 771mm of rainfall which was found to be 255% higher than normal (IMD, Times of India). Figure 3 illustrates past rainfall amounts in Kerala state for years between 1901 to 2015 (Data source: India Meteorological Department).
Before August has come to an end, the rainfall received in 2018 has already exceeded that of 2014. The most significant event was recorded in 1931 at 1.2m of rainfall and was comparable to past large events in Kerala. Officials have described this 1931 event as a 1-in-100-year event and often compared the extent of destruction to that of the 1923 flood.
Damage to cropsDue to the recent continuous rainfall, large agricultural farms have been flooded, with estimated crop losses between USD $71 million and USD $101 million (The Times of India). Coffee, rubber, tea and black pepper are amongst some of the crops worst affected. In rural Kerala, many farmers may not be able to recover quickly enough to harvest any yield this season. Farmers in rural areas may also lack access to adequate insurance cover to aid their recovery
process.
Lessons learntThe Kerala floods have served as an important reminder of the impact of water management programmes and flood mitigation measures. It seems that water management may be partly responsible for exacerbating the situation. With a total of 44 rivers flowing through the state of Kerala and many dams, officials in the field have agreed that the floods were likely worsened due to management of the dams. The dams held back water for a long period until it reached critical levels and had no choice but to release most of the dams at the same time (BBC UK). At least 30 dams, including major ones such as Idukki and Idamalayar, were forced to release the water when the torrential rainfall continued.
In addition, local state authorities mentioned that the official Central Water Commission (CWC) did not provide early flood warning in advance as there were no flood forecasting sites in Kerala. Rapid development and deforestation have also been cited as increasing the likelihood of such flash flood events in Kerala (Hindustan Times).
The South Asia region is likely to experience an increase in runoff between 2046-2075 as compared to the average baseline measured from 1976-2005 (Floodlist). Hence, it is critical to have relevant mitigation measures in countries and states that are at high risk. In addition to India, low lying areas such as Bangladesh and Myanmar are facing similar threats. By understanding the areas at risk, we are able to adapt suitable measures in preparation for future events.
JBA Risk Management has nationwide return period flood maps for India at 30m resolution. Please contact us for further information.
Figure 2(Left) rainfall (mm) observed in various districts in Kerala from 9th-15th August 2018. (Right) the values represent the percentage deviation from the average rainfall deemed as normal in each district based on previous data. (Source: IMD)
Figure 3Rainfall data for Kerala state for the month of August from 1901 to 2015. (Source: IMD)
Event Response 2018 | www.jbarisk.com Page 5
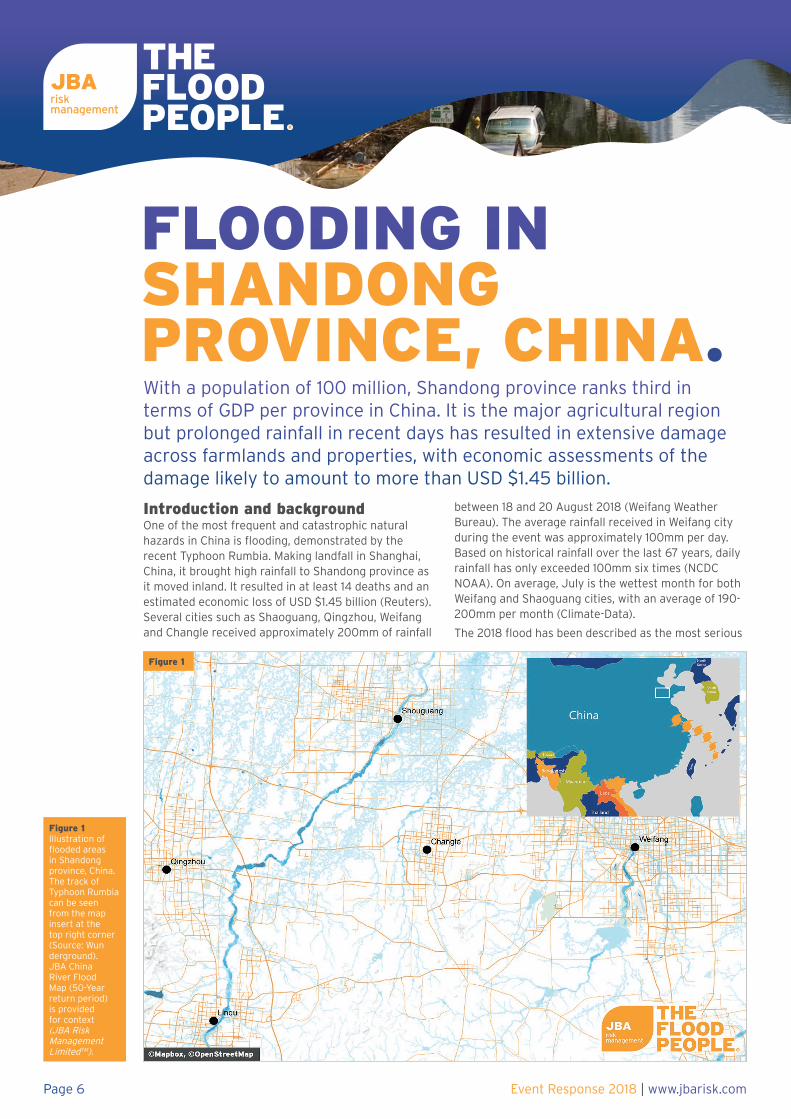
Introduction and backgroundOne of the most frequent and catastrophic natural hazards in China is flooding, demonstrated by the recent Typhoon Rumbia. Making landfall in Shanghai, China, it brought high rainfall to Shandong province as it moved inland. It resulted in at least 14 deaths and an estimated economic loss of USD $1.45 billion (Reuters). Several cities such as Shaoguang, Qingzhou, Weifang and Changle received approximately 200mm of rainfall
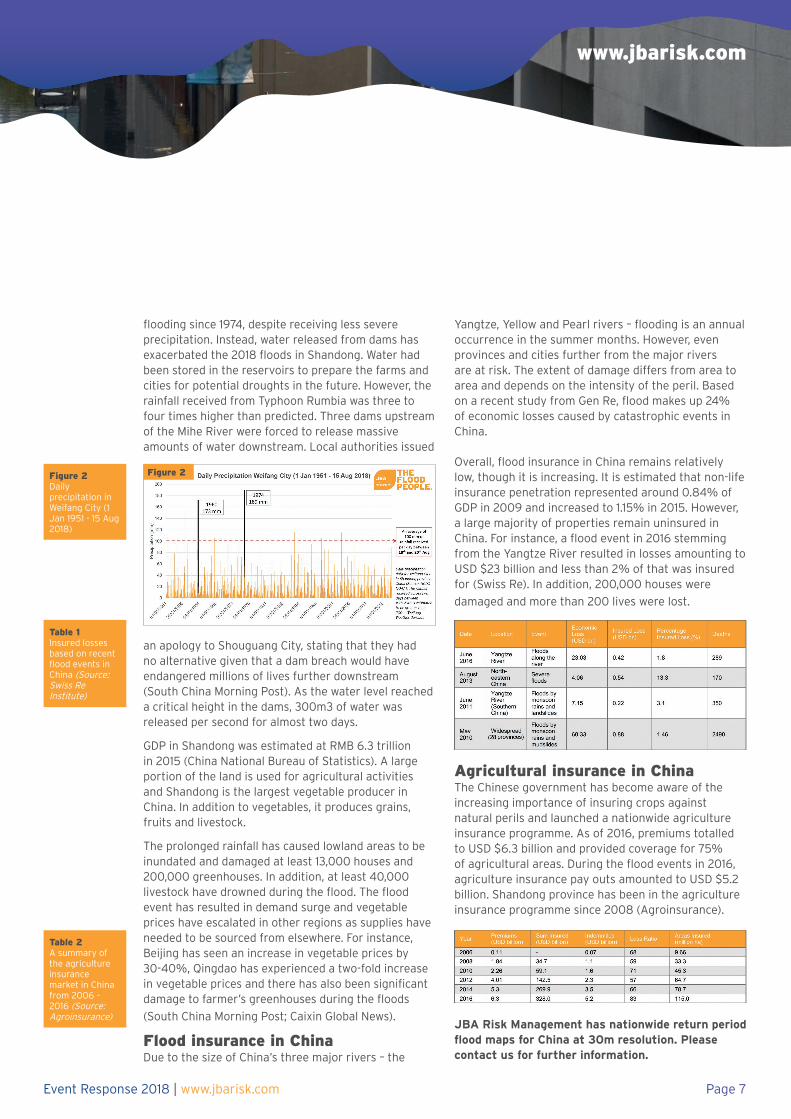
between 18 and 20 August 2018 (Weifang Weather Bureau). The average rainfall received in Weifang city during the event was approximately 100mm per day. Based on historical rainfall over the last 67 years, daily rainfall has only exceeded 100mm six times (NCDC NOAA). On average, July is the wettest month for both Weifang and Shaoguang cities, with an average of 190-200mm per month (Climate-Data).
The 2018 flood has been described as the most serious
Figure 1Illustration of flooded areas in Shandong province, China. The track of Typhoon Rumbia can be seen from the map insert at the top right corner (Source: Wun derground). JBA China River Flood Map (50-Year return period) is provided for context (JBA Risk Management LimitedTM).
FLOODING IN SHANDONGPROVINCE, CHINA.With a population of 100 million, Shandong province ranks third in terms of GDP per province in China. It is the major agricultural region but prolonged rainfall in recent days has resulted in extensive damage across farmlands and properties, with economic assessments of the damage likely to amount to more than USD $1.45 billion.
Figure 1
Event Response 2018 | www.jbarisk.comPage 6
www.jbarisk.com
flooding since 1974, despite receiving less severe precipitation. Instead, water released from dams has exacerbated the 2018 floods in Shandong. Water had been stored in the reservoirs to prepare the farms and cities for potential droughts in the future. However, the rainfall received from Typhoon Rumbia was three to four times higher than predicted. Three dams upstream of the Mihe River were forced to release massive amounts of water downstream. Local authorities issued
an apology to Shouguang City, stating that they had no alternative given that a dam breach would have endangered millions of lives further downstream (South China Morning Post). As the water level reached a critical height in the dams, 300m3 of water was released per second for almost two days.
GDP in Shandong was estimated at RMB 6.3 trillion in 2015 (China National Bureau of Statistics). A large portion of the land is used for agricultural activities and Shandong is the largest vegetable producer in China. In addition to vegetables, it produces grains, fruits and livestock.
The prolonged rainfall has caused lowland areas to be inundated and damaged at least 13,000 houses and 200,000 greenhouses. In addition, at least 40,000 livestock have drowned during the flood. The flood event has resulted in demand surge and vegetable prices have escalated in other regions as supplies have needed to be sourced from elsewhere. For instance, Beijing has seen an increase in vegetable prices by 30-40%, Qingdao has experienced a two-fold increase in vegetable prices and there has also been significant damage to farmer’s greenhouses during the floods
(South China Morning Post; Caixin Global News).
Flood insurance in ChinaDue to the size of China’s three major rivers – the
Yangtze, Yellow and Pearl rivers – flooding is an annual occurrence in the summer months. However, even provinces and cities further from the major rivers are at risk. The extent of damage differs from area to area and depends on the intensity of the peril. Based on a recent study from Gen Re, flood makes up 24% of economic losses caused by catastrophic events in China.
Overall, flood insurance in China remains relatively low, though it is increasing. It is estimated that non-life insurance penetration represented around 0.84% of GDP in 2009 and increased to 1.15% in 2015. However, a large majority of properties remain uninsured in China. For instance, a flood event in 2016 stemming from the Yangtze River resulted in losses amounting to USD $23 billion and less than 2% of that was insured for (Swiss Re). In addition, 200,000 houses were
damaged and more than 200 lives were lost.
Agricultural insurance in ChinaThe Chinese government has become aware of the increasing importance of insuring crops against natural perils and launched a nationwide agriculture insurance programme. As of 2016, premiums totalled to USD $6.3 billion and provided coverage for 75% of agricultural areas. During the flood events in 2016, agriculture insurance pay outs amounted to USD $5.2 billion. Shandong province has been in the agriculture insurance programme since 2008 (Agroinsurance).
JBA Risk Management has nationwide return period flood maps for China at 30m resolution. Please contact us for further information.
Table 1Insured losses based on recent flood events in China (Source: Swiss Re Institute)
Figure 2Daily precipitation in Weifang City (1 Jan 1951 - 15 Aug 2018)
Table 2A summary of the agriculture insurance market in China from 2006 – 2016 (Source: Agroinsurance)
Event Response 2018 | www.jbarisk.com Page 7
Figure 2
As it approached the cooler water of higher latitudes, the storm weakened, though it still made landfall in southern Japan as the strongest typhoon to hit the country in the last 25 years.
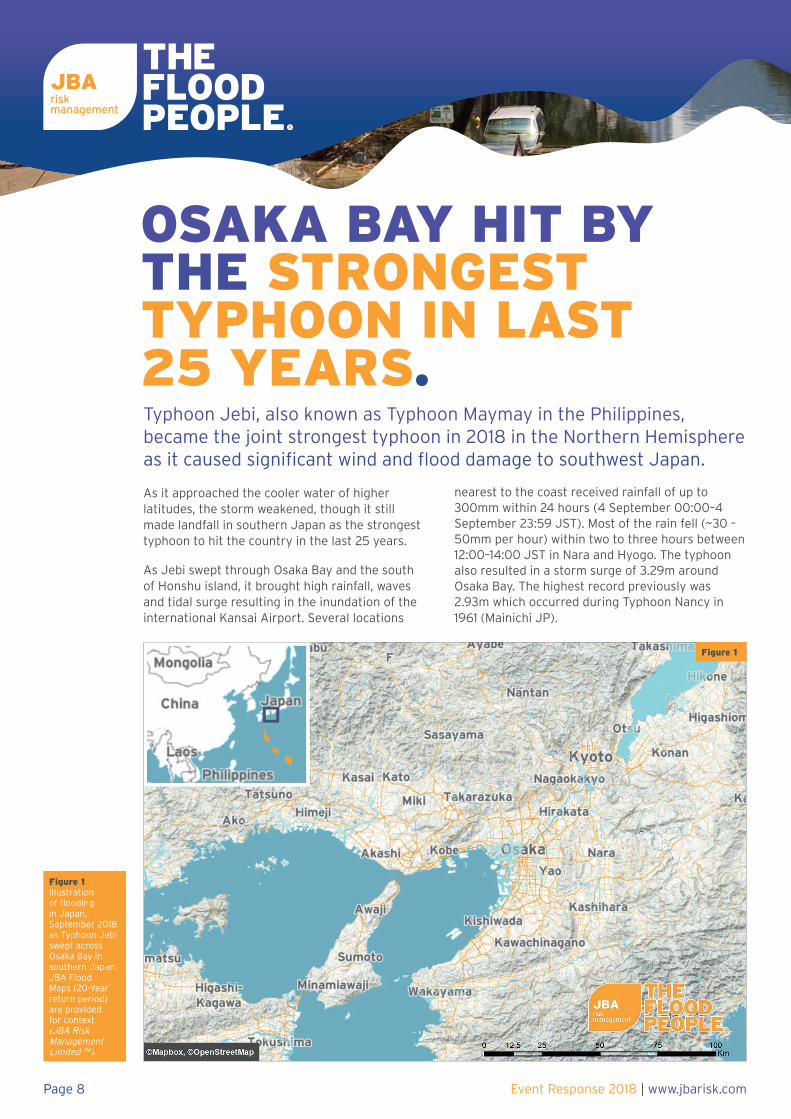
As Jebi swept through Osaka Bay and the south of Honshu island, it brought high rainfall, waves and tidal surge resulting in the inundation of the international Kansai Airport. Several locations
nearest to the coast received rainfall of up to 300mm within 24 hours (4 September 00:00–4 September 23:59 JST). Most of the rain fell (~30 – 50mm per hour) within two to three hours between 12:00–14:00 JST in Nara and Hyogo. The typhoon also resulted in a storm surge of 3.29m around Osaka Bay. The highest record previously was 2.93m which occurred during Typhoon Nancy in 1961 (Mainichi JP).
Figure 1Illustration of flooding in Japan, September 2018 as Typhoon Jebi swept across Osaka Bay in southern Japan. JBA Flood Maps (20-Year return period) are provided for context (JBA Risk Management Limited TM).
OSAKA BAY HIT BY THE STRONGEST TYPHOON IN LAST 25 YEARS.Typhoon Jebi, also known as Typhoon Maymay in the Philippines, became the joint strongest typhoon in 2018 in the Northern Hemisphere as it caused significant wind and flood damage to southwest Japan.
Figure 1
Event Response 2018 | www.jbarisk.comPage 8

www.jbarisk.com
Strong winds disrupted cities in the Kansai region, including Osaka, Kyoto and Kobe (Express UK). With reported wind gusts of up to 209km/h, the strong winds overturned cars, port containers and damaged buildings. Neighbouring cities were similarly disrupted as containers were damaged by the strong winds. Kyoto main rail station also suffered as part of the glass roof collapsed, causing several injuries (Kyodo News).
Kansai airport is the third largest in Japan after Tokyo’s Narita and Haneda airports. Services at the airport were halted, with at least 1,000 flights cancelled and 3,000 people stranded. The airport was closed for several days and has reopened partially for limited domestic and international flights.
Economic losses from Typhoon JebiMost of the damage appears to have been due to the strong winds and some flooding as the storm’s track hit Osaka directly, putting major infrastructure at risk. Kansai airport is located on reclaimed land in the east of the Osaka Bay and was particularly
vulnerable to the storm surge that impacted the bay.
It’s likely there will be high buildings, contents and business interruption losses given the wide ranging impact of this event. The Kansai airport is the main airport in Kansai and serves as a major link for people travelling to Osaka, Kobe and Kyoto. The closure of the airport meant that the manufacturing industry may have needed to source alternatives for their export goods. It is also a major hub for tourists; in 2017, a total of 28.8 million tourists used the Kansai airport. At present, there is no estimated figure for the losses incurred due to the closure of the airport.
Insurance coverage in JapanThis event could generate significant losses for insurers when compared to recent months. Since July, at least 46,000 buildings have been damaged and it’s estimated that over USD $715 million has been paid out for over 53,000 claims (General Insurance Association of Japan). Business interruption to agricultural, tourism and manufacturing industries accounted for the massive insured losses in July (JLT Re). Insurance penetration in Japan for non-life insurance represents an estimated 1.73% of its GDP. This is around 9% of global life and non-life premium (Insurance Information Institute).
OutlookJapan experiences multiple occurrences of natural disasters such as earthquakes, tsunamis and typhoons due to its location on the Pacific Ring of Fire and exposure to Western Pacific typhoons. Such perils are an annual occurrence in Japan and it has become a leader in risk management, with some of the most stringent building codes and effective emergency response in the world.
JBA Risk Management has nationwide return period flood maps for Japan at 30m resolution. Please get in touch for more information.
Figure 2Figure 2llustration of wind speed as Typhoon Jebi swept through southern Japan. The darkest red colours represent higher wind speeds. Dark blue represent lower wind speeds. Wind footprint is based on JBA analysis (JBA Risk Management Limited TM).
Figure 3Illustration of total rainfall in Hyogo, Kochi, Nara, Osaka, Shiga and Wakayama prefectures across 24 hours on 4 September 2018. The smallest blue circle represents a rainfall total of at least 30mm, whereas the largest red circles represent a rainfall total of 220-320mm. (Map: by JBA Risk Management Limited TM. Data source: Japan Meteorological Agency.)
Figure 3
Table illustrating past typhoon events in Japan and their respective economic losses and percentage of insured losses. (Source: Swiss Re)
Event Response 2018 | www.jbarisk.com Page 9
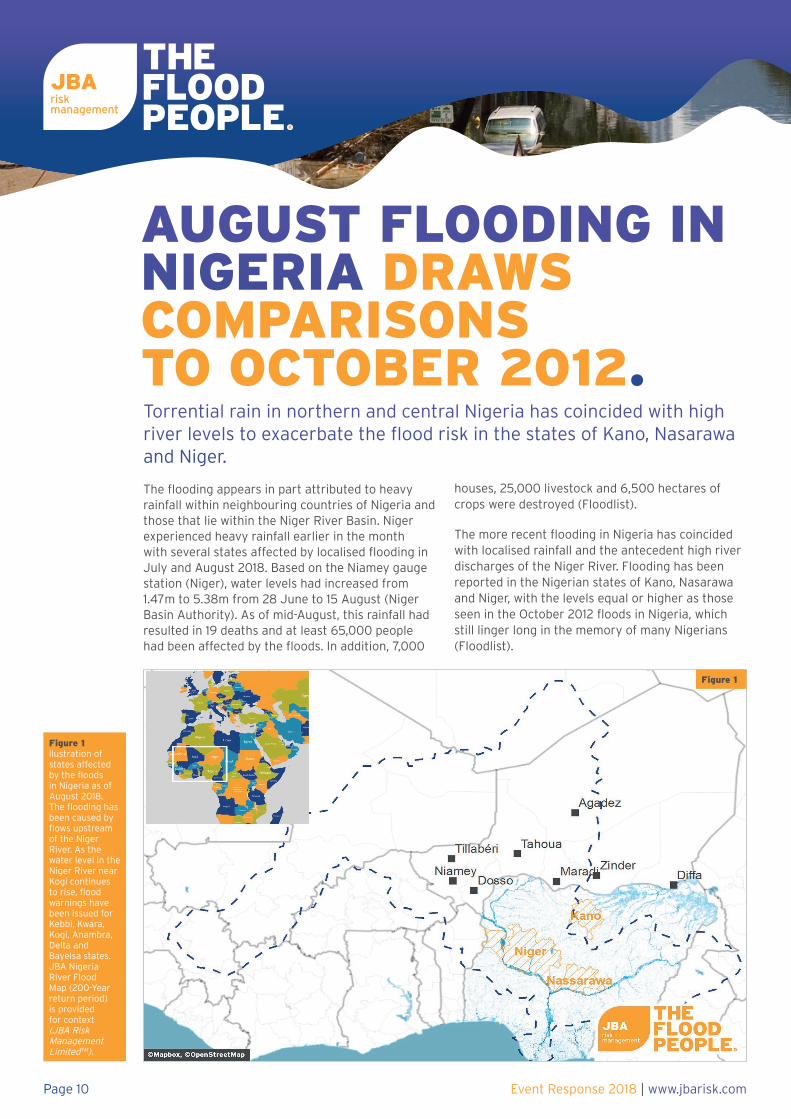
The flooding appears in part attributed to heavy rainfall within neighbouring countries of Nigeria and those that lie within the Niger River Basin. Niger experienced heavy rainfall earlier in the month with several states affected by localised flooding in July and August 2018. Based on the Niamey gauge station (Niger), water levels had increased from 1.47m to 5.38m from 28 June to 15 August (Niger Basin Authority). As of mid-August, this rainfall had resulted in 19 deaths and at least 65,000 people had been affected by the floods. In addition, 7,000
houses, 25,000 livestock and 6,500 hectares of crops were destroyed (Floodlist).
The more recent flooding in Nigeria has coincided with localised rainfall and the antecedent high river discharges of the Niger River. Flooding has been reported in the Nigerian states of Kano, Nasarawa and Niger, with the levels equal or higher as those seen in the October 2012 floods in Nigeria, which still linger long in the memory of many Nigerians (Floodlist).
Figure 1llustration of states affected by the floods in Nigeria as of August 2018. The flooding has been caused by flows upstream of the Niger River. As the water level in the Niger River near Kogi continues to rise, flood warnings have been issued for Kebbi, Kwara, Kogi, Anambra, Delta and Bayelsa states. JBA Nigeria River Flood Map (200-Year return period) is provided for context (JBA Risk Management LimitedTM).
AUGUST FLOODING INNIGERIA DRAWS COMPARISONSTO OCTOBER 2012.Torrential rain in northern and central Nigeria has coincided with high river levels to exacerbate the flood risk in the states of Kano, Nasarawa and Niger.
Figure 1
Event Response 2018 | www.jbarisk.comPage 10

www.jbarisk.com
Comparisons to 2012On 29 August 2012, water heights of 8.57m were recorded at Lokoja (a confluence of the Niger and Benue rivers) (Nigerian Hydrological Services Agency). The same gauge recorded 8.69m on 29 August 2018 which has created alarm among authorities and citizens. However, despite the recent river levels, flood damage has not been on par with 2012.
The Niger River Basin is a large and highly complex network of rivers which encompasses nine countries: Benin, Burkina Faso, Cameroon, Chad, Ivory Coast, Guinea, Mali, Niger and Nigeria. In Nigeria, the Niger Delta contributes up to 8% of the land area.
In 2012, heavy rainfall occurred throughout the month of September causing high volumes of water to be held back in dam reservoirs. At the end of September, as these dams were forced to open, the high volume of water could no longer be contained, resulting in extensive floods across floodplains of the Niger and Benue rivers. This resulted in extensive economic losses and damage to properties and infrastructure. For instance, flooding in the Niger Delta disrupted oil production and damaged many hectares of crops (Reuters, 2012). Towards the end of October 2012, more than 2 million people had been displaced, 450 lives were lost and 400,000 houses were damaged (Swiss Re). In total, 30 out of 37 states were affected including Lagos, the capital city. It was reported by Swiss Re that the event incurred USD $440 million in losses and only 2.3% were insured for (Swiss Re). Other countries in the Niger basin were not spared the damage as 519,000 people were affected in Chad and more than 250,000 hectares of croplands were inundated (Reliefweb).
Lessons learntAs flooding occurs frequently along the Niger and Benue rivers, the large population situated along the river is at high risk. High rainfall, poor urban planning, inadequate drainage systems and a lack of advanced technologies to monitor and mitigate flood are common reasons cited for flooding in African cities (World Bank Group). These urbanised cities were developed rapidly, incurring the loss of natural soils as land areas were replaced by roads and buildings. Unregulated housing in flood prone areas has significantly contributed to the flood risk (World Bank Group).
Thankfully, the government understands the increasing need for improved flood management in Nigeria, as noted during the 2013 floods. During this event, approximately 22,000 volunteers were trained by the Nigerian Red Cross for post-event response. The warehouses were also stocked with necessities in preparation for future emergencies. In addition, dam officials were advised to release water from the dams periodically to reduce the risk of flooding for communities downstream (The Guardian, 2013).
OutlookTo the countless villages, towns and cities that lie alongside its banks, the August 2018 flooding is a reminder of the perennial risk that the Niger River Basin poses to both Nigeria and other neighbouring countries. One aspect that may mitigate the impact of this risk in future is the increased capacity and resilience of the emergency responders in Nigeria to manage these floods – many of whom were not in place in 2012.
JBA Risk Management has nationwide return period flood maps for Nigeria at 30m resolution. Please get in touch for more information.
Figure 2Figure 2Estimated rainfall across Nigeria measured in millimetres (mm). The darkest shade of blue seen on the map represents 30mm of rainfall over a day and white represents 0mm. The affected states are highlighted in orange. These states received some rainfall before 27 August 2018. Continuous and heavy rainfall on 27 August 2018 resulted in flooding in Kano, whereas rainfall between 28–29 August 2018 triggered flooding in Niger and Nassarawa. (Data Source: NASA EOSDIS Worldview; GES DISC – AIRS2UP_NRT: AIRS/Aqua L Near Real Time Support Retrieval V006; GES DISC – Near Real Time Data).
Event Response 2018 | www.jbarisk.com Page 11

The typhoon then continued westwards across the South China Sea before eventually making landfall close to the Pearl River Delta, a densely populated and industrious area in the south-east of China. Mangkhut made landfall in Jiang Men City at 17:00 16 September (CST) with wind speeds of approximately 175km/h. The event brought strong winds and storm surge flooding to Guangdong province (China), Macau and Hong Kong.
The storm surges in Hong Kong were reported to be 2.35m at Quarry Bay and 3.38m at Tai Po Kau (South China Morning Post). Based on historical tide gauge data collected between 1954 and 2017 (Hong Kong
Observatory (HKO)), the surge level experienced at Quarry Bay /North Point (Kowloon Bay) represents an estimated return period of 200 years.
Fortunately, the storm surge level was somewhat mitigated as it did not coincide with the high astronomical tide that day. Similarly, historical records suggests that there have been previous typhoons causing larger surge heights in the past, including a surge height of 3.8m in 1937 (HKO). Considering this, it suggests that Mangkhut may have a lower return period for the surge than 200 years. Storm surge data at Quarry Bay was available from 1954 and was used to generate
an estimated typhoon return period for Hong Kong. As events before 1954 were not recorded at the same location, these events were not taken into consideration for the analysis.
Many compared the scale of the event to Typhoon Hato which hit Hong Kong in August 2017 and was the strongest to hit Macau in the past 53 years
Figure 1Overview of the track of Typhoon Mangkhut and destruction it caused in various locations.
TYPHOON MANGKHUT: A FOCUS ON THE STORM SURGE FLOODING IN HONG KONG.Typhoon Mangkhut swept past the Philippines on the morning of Saturday 15 September at 01:40 (PST), bringing sustained wind speeds of up to 270km/h (CNN). It is the strongest event since Typhoon Megi hit the region in 2010.
Figure 1
Event Response 2018 | www.jbarisk.comPage 12
www.jbarisk.com
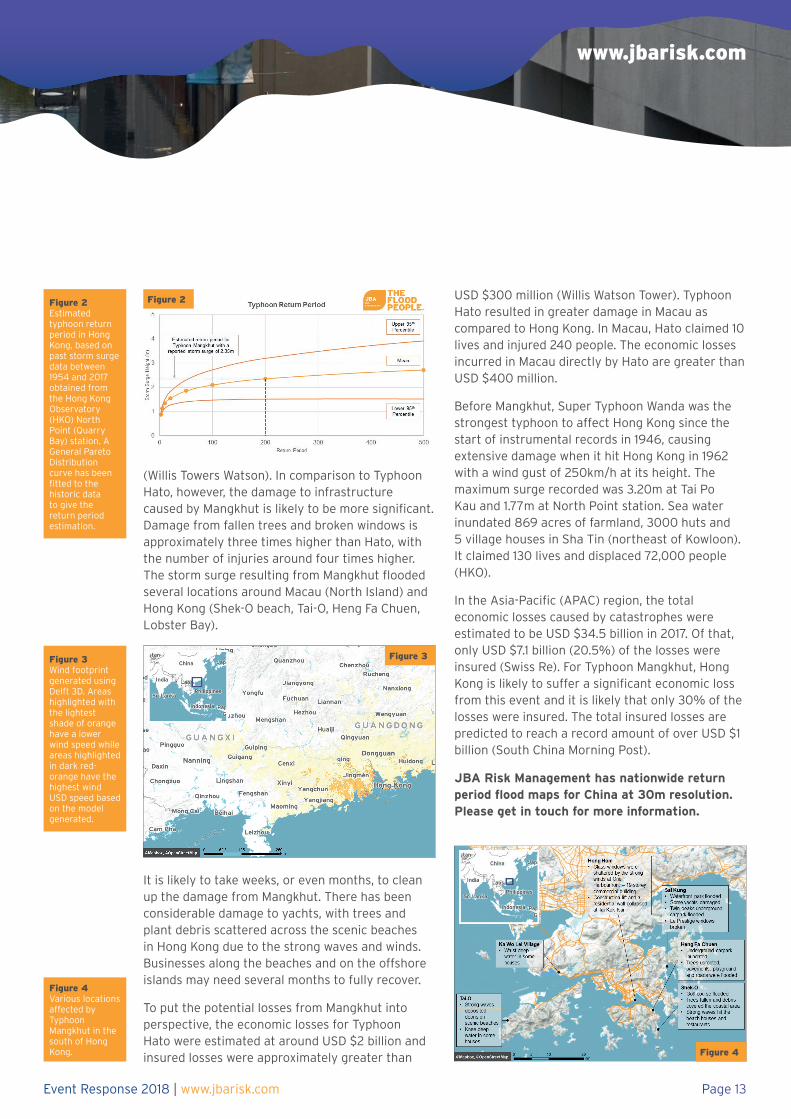
(Willis Towers Watson). In comparison to Typhoon Hato, however, the damage to infrastructure caused by Mangkhut is likely to be more significant. Damage from fallen trees and broken windows is approximately three times higher than Hato, with the number of injuries around four times higher. The storm surge resulting from Mangkhut flooded several locations around Macau (North Island) and Hong Kong (Shek-O beach, Tai-O, Heng Fa Chuen, Lobster Bay).
It is likely to take weeks, or even months, to clean up the damage from Mangkhut. There has been considerable damage to yachts, with trees and plant debris scattered across the scenic beaches in Hong Kong due to the strong waves and winds. Businesses along the beaches and on the offshore islands may need several months to fully recover.
To put the potential losses from Mangkhut into perspective, the economic losses for Typhoon Hato were estimated at around USD $2 billion and insured losses were approximately greater than
USD $300 million (Willis Watson Tower). Typhoon Hato resulted in greater damage in Macau as compared to Hong Kong. In Macau, Hato claimed 10 lives and injured 240 people. The economic losses incurred in Macau directly by Hato are greater than USD $400 million.
Before Mangkhut, Super Typhoon Wanda was the strongest typhoon to affect Hong Kong since the start of instrumental records in 1946, causing extensive damage when it hit Hong Kong in 1962 with a wind gust of 250km/h at its height. The maximum surge recorded was 3.20m at Tai Po Kau and 1.77m at North Point station. Sea water inundated 869 acres of farmland, 3000 huts and 5 village houses in Sha Tin (northeast of Kowloon). It claimed 130 lives and displaced 72,000 people (HKO).
In the Asia-Pacific (APAC) region, the total economic losses caused by catastrophes were estimated to be USD $34.5 billion in 2017. Of that, only USD $7.1 billion (20.5%) of the losses were insured (Swiss Re). For Typhoon Mangkhut, Hong Kong is likely to suffer a significant economic loss from this event and it is likely that only 30% of the losses were insured. The total insured losses are predicted to reach a record amount of over USD $1 billion (South China Morning Post).
JBA Risk Management has nationwide return period flood maps for China at 30m resolution. Please get in touch for more information.
Figure 2Estimated typhoon return period in Hong Kong, based on past storm surge data between 1954 and 2017 obtained from the Hong Kong Observatory (HKO) North Point (Quarry Bay) station. A General Pareto Distribution curve has been fitted to the historic data to give the return period estimation.
Figure 3Wind footprint generated using Delft 3D. Areas highlighted with the lightest shade of orange have a lower wind speed while areas highlighted in dark red-orange have the highest wind USD speed based on the model generated.
Figure 4Various locations affected by Typhoon Mangkhut in the south of Hong Kong.
Figure 2
Figure 3
Figure 4
Event Response 2018 | www.jbarisk.com Page 13
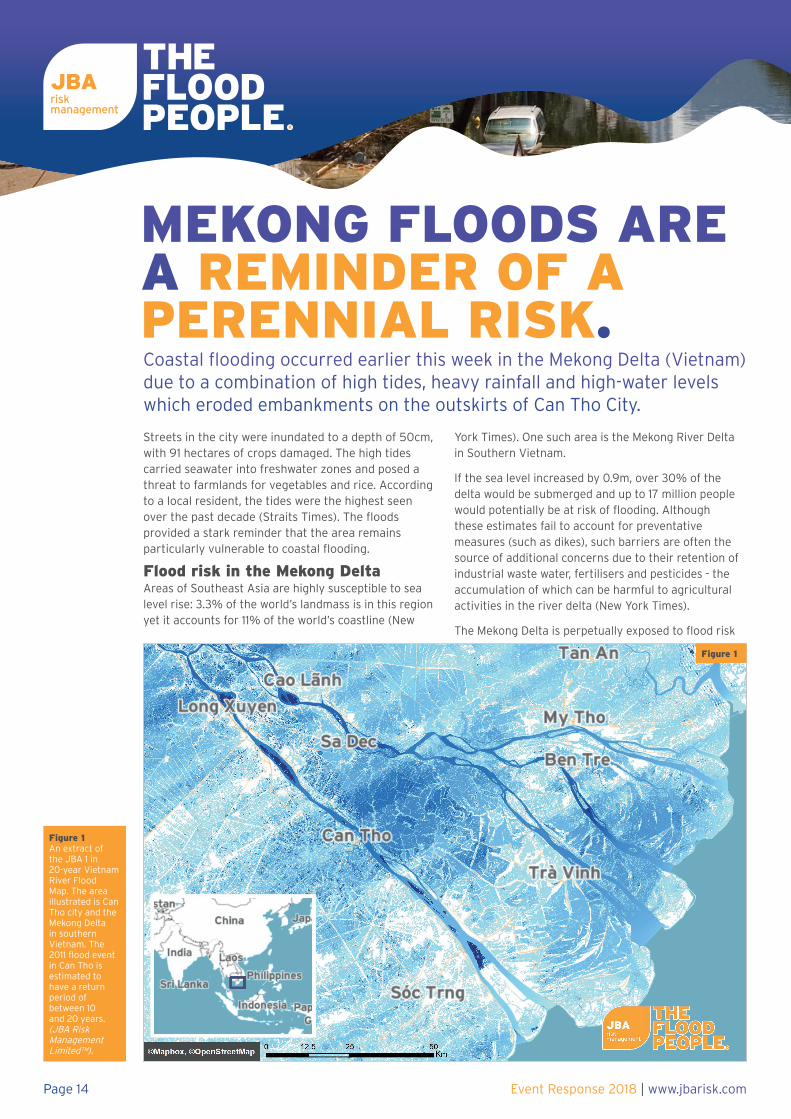
Streets in the city were inundated to a depth of 50cm, with 91 hectares of crops damaged. The high tides carried seawater into freshwater zones and posed a threat to farmlands for vegetables and rice. According to a local resident, the tides were the highest seen over the past decade (Straits Times). The floods provided a stark reminder that the area remains particularly vulnerable to coastal flooding.
Flood risk in the Mekong DeltaAreas of Southeast Asia are highly susceptible to sea level rise: 3.3% of the world’s landmass is in this region yet it accounts for 11% of the world’s coastline (New
York Times). One such area is the Mekong River Delta in Southern Vietnam.
If the sea level increased by 0.9m, over 30% of the delta would be submerged and up to 17 million people would potentially be at risk of flooding. Although these estimates fail to account for preventative measures (such as dikes), such barriers are often the source of additional concerns due to their retention of industrial waste water, fertilisers and pesticides - the accumulation of which can be harmful to agricultural activities in the river delta (New York Times).
The Mekong Delta is perpetually exposed to flood risk
Figure 1An extract of the JBA 1 in 20-year Vietnam River Flood Map. The area illustrated is Can Tho city and the Mekong Delta in southern Vietnam. The 2011 flood event in Can Tho is estimated to have a return period of between 10 and 20 years. (JBA Risk Management Limited™).
MEKONG FLOODS ARE A REMINDER OF A PERENNIAL RISK.Coastal flooding occurred earlier this week in the Mekong Delta (Vietnam) due to a combination of high tides, heavy rainfall and high-water levels which eroded embankments on the outskirts of Can Tho City.
Figure 1
Event Response 2018 | www.jbarisk.comPage 14
www.jbarisk.com
as it lies only slightly above sea level. Floods occur annually, typically in the wet season. The four main components of this flooding are flood water carried downstream by the Mekong River; high intensity localised rainfall over a short period; tidal floods due to storms and high tides and human intervention.
In recent years, a growing concern for many has been flooding related to the management of hydropower dams upstream (Duong et al.). However, it’s important to be mindful that some flooding is an important component of maintaining the fertility of farmlands and aquatic farms in the Mekong. Overall, it’s estimated that 85% of the population in the Mekong Delta rely on it for their livelihood (New York Times).
When flooding does occur, the mean annual economic losses are USD $71 million in the Mekong Delta in Vietnam and USD $88 million in the Lower Mekong
Basin in Thailand (Mekong River Commission, 2018).
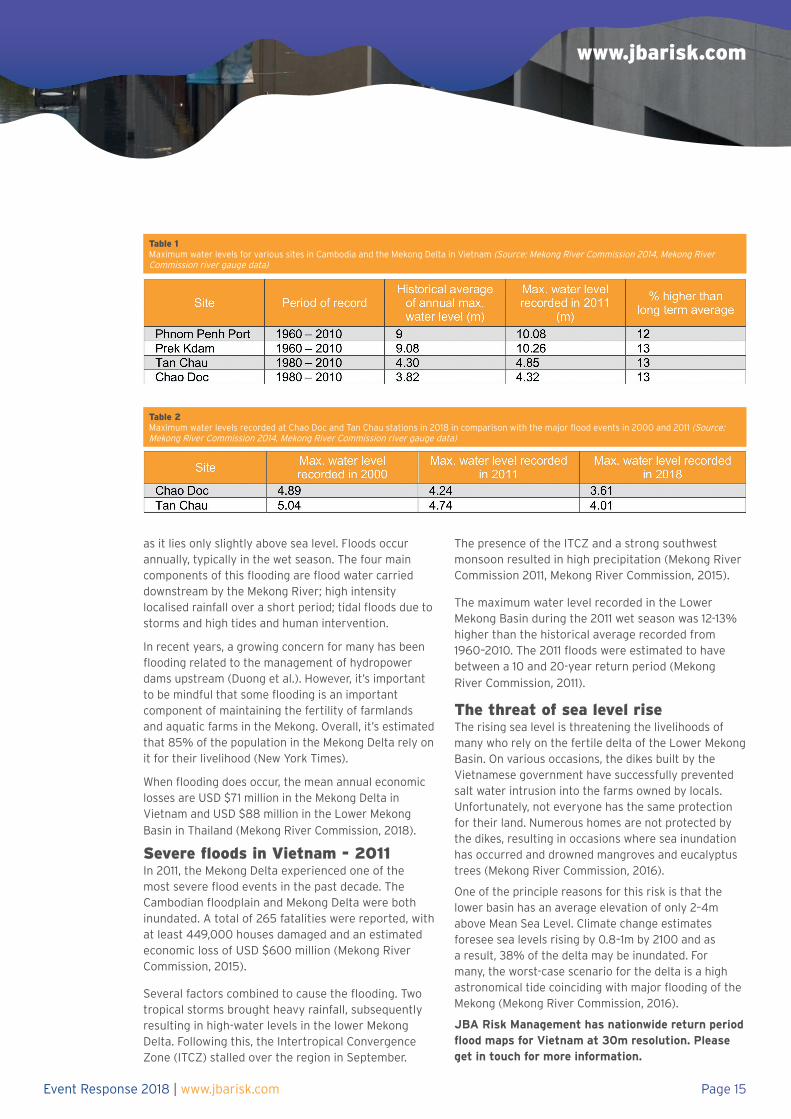
Severe floods in Vietnam - 2011In 2011, the Mekong Delta experienced one of the most severe flood events in the past decade. The Cambodian floodplain and Mekong Delta were both inundated. A total of 265 fatalities were reported, with at least 449,000 houses damaged and an estimated economic loss of USD $600 million (Mekong River Commission, 2015).
Several factors combined to cause the flooding. Two tropical storms brought heavy rainfall, subsequently resulting in high-water levels in the lower Mekong Delta. Following this, the Intertropical Convergence Zone (ITCZ) stalled over the region in September.
The presence of the ITCZ and a strong southwest monsoon resulted in high precipitation (Mekong River Commission 2011, Mekong River Commission, 2015).
The maximum water level recorded in the Lower Mekong Basin during the 2011 wet season was 12-13% higher than the historical average recorded from 1960–2010. The 2011 floods were estimated to have between a 10 and 20-year return period (Mekong
River Commission, 2011).
The threat of sea level riseThe rising sea level is threatening the livelihoods of many who rely on the fertile delta of the Lower Mekong Basin. On various occasions, the dikes built by the Vietnamese government have successfully prevented salt water intrusion into the farms owned by locals. Unfortunately, not everyone has the same protection for their land. Numerous homes are not protected by the dikes, resulting in occasions where sea inundation has occurred and drowned mangroves and eucalyptus trees (Mekong River Commission, 2016).
One of the principle reasons for this risk is that the lower basin has an average elevation of only 2–4m above Mean Sea Level. Climate change estimates foresee sea levels rising by 0.8–1m by 2100 and as a result, 38% of the delta may be inundated. For many, the worst-case scenario for the delta is a high astronomical tide coinciding with major flooding of the Mekong (Mekong River Commission, 2016).
JBA Risk Management has nationwide return period flood maps for Vietnam at 30m resolution. Please get in touch for more information.
Table 2Maximum water levels recorded at Chao Doc and Tan Chau stations in 2018 in comparison with the major flood events in 2000 and 2011 (Source: Mekong River Commission 2014, Mekong River Commission river gauge data)
Event Response 2018 | www.jbarisk.com Page 15
Table 1Maximum water levels for various sites in Cambodia and the Mekong Delta in Vietnam (Source: Mekong River Commission 2014, Mekong River Commission river gauge data)

Torrential rainfall, combined with strong winds, claimed at least 30 lives across Italy and extensively damaged properties (CNN). In addition, a part of the Red Fir forest in the Dolomites was wiped out by the extreme winds, uprooting approximately 14 million trees (Italy Magazine). The worst damage, however, was observed in the northern regions of Trentino and Veneto; it is estimated that losses in Veneto alone will exceed €1 billion (CNN).
Risk of illegal housing in ItalyIn the town of Casteldaccia in Sicily, a family of nine lost their lives as their house was engulfed by the Milicia River when the river burst its banks (Guardian).
These fatalities highlighted the issue of unauthorised housing. In this instance, the villa was ordered to be demolished two years ago as it was located close to the river and thereby considered as a high flood risk (Guardian). However, the family appealed against the order and remained in the property (Guardian).
Approximately 1.2 million houses are estimated to have been built illegally in Italy and these houses are typically built close to foothills or river banks, exposing them to landslides and high flood risk (Guardian). In 2012, 46,700 properties were ordered to be demolished but only 10% of these orders were implemented (Guardian). Furthermore, 80% of
Figure 1An extract of the JBA 1 in 20-year Italy 5m River Flood Map. The area illustrated is Treviso, located in the region of Veneto which experienced some of the worst damage. The Venetian Lagoon can be seen at the bottom right, with Venice experiencing widespread flooding. (JBA Risk Management Limited™).
SEVERE STORMS BRING FLOODING TO ITALY.Strong storms brought severe rainfall and high winds to much of Europe last week resulting in flooding in Italy and Croatia.
Figure 1
Event Response 2018 | www.jbarisk.comPage 16

www.jbarisk.com
demolition orders issued between 2004 and 2018 have not been carried out (Guardian).
High tide flooding in Venice - the worst seen in the past decadeLast week, Venice experienced flooding as strong winds combined with high tides during a series of storms (Independent).
A strong low-pressure system in southern Europe enhanced southerly high winds, pushing water towards Venice from the Adriatic Sea (Wunderground). The winds coincided with the seasonal high tides bringing a maximum water level of 156cm (61 inches) above sea level on 29 October 2018 (Wunderground). Based on historical records dating back to 1872, there have been only three occasions where water levels have surpassed this height, with this being the worst flooding observed in the last decade (Table 1) (Wunderground).
Venice continually struggles to remain above sea water levels due to land subsidence and sea level rise (Wunderground). Since 1897, the average water level in Venice has increased by 23cm (9 inches), with approximately 60% of this rise due to land subsidence caused by water extraction from the underlying aquifer during the 1920s and early 1970s (Wunderground). The remaining 40% is likely due to the increase in sea level (Wunderground). Exceptional tides (defined as being greater than 140cm in Venice) are occurring more frequently in Venice; in the late 20th century, tides greater than 140cm happened once every 5 to 10 years (Wunderground). In the past
two decades, exceptional tides have occurred 10 times (Figure 2) (Wunderground).
The flooding in Venice may have been avoided had the planned flood gates of the MOSES project been implemented. Originally scheduled to finish in 2011, the MOSES project remains unfinished with the project in turmoil due to corruption and poor management (La Stampa). The original estimated cost for the flood gates was €1.6 billion which rose to €5.5 billion due to further investment needed for construction and future maintenance (La Stampa).
However, the flood gate will only be effective against tidal flooding that exceeds 110cm in Venice which means prolonged rainfall may still result in flooding, as witnessed at the Piazza San Marco (La Stampa; New York Times; Wunderground).
Flood risk in ItalyFlood remains a severe peril in Italy and, in particular, the valleys through which the Po and Arno rivers flow. Heavy rainfall in the north of Italy makes many areas highly vulnerable to flash floods. 70% of Italy is exposed to flood risk and landslides, with previous severe floods costing an estimated €0.37 billion– €3.5 billion (USD $0.50 billion– USD $6.46 billion) (Table 2) (NatCatSERVICE by Munich Re; Sigma explorer by Swiss Re).
Italy is behind other developed European countries in insurance penetration. The insurance penetration for non-life insurance in 2016 is approximately 1.9% of GDP for Italy, lower than both France (3.4%), Germany (3.3%) and Belgium (2.8%) (Ania). The majority of insurance for natural hazard covers industrial and commercial properties, with less than 0.5% of households having any form of insurance to protect themselves against natural catastrophe.
This event is a timely reminder of the need for more adequate flood defences and the dangers of living in high-risk flood areas.
JBA Risk Management has just released nationwide return period flood maps for Italy at 5m resolution. Please get in touch for more information.
Event Response 2018 | www.jbarisk.com Page 17
Table 1: Highest tide levels observed in Venice, based on records from 1872 - 2018 (Source: Wunderground)
Table 2: Economic and insured losses from recent flood events (NatCatSERVICE by Munich Re, Sigma explorer by Swiss Re)
Figure 2Tides greater than 140cm (above Mean Sea Level) in Venice between 1872 – 2015 (orange dots). The highest tide recorded in the 2018 flooding was 164cm and is shown in red in this graph. (Source: City of Venice).
Figure 2
The amount of rainfall was comparable to the average rainfall that Sydney receives in the month of November- the historical average and median for November is 84.2mm and 66.9mm respectively (Reuters, 2018; Bureau of Meteorology Australian Government). Wind gusts of 96km/h were also reported at Wattamolla during the passage of the storm (The Sydney Morning Herald).
Two deaths have been attributed to the storm as it hit during morning rush hour. It resulted in chaos for many commuters, causing widespread disruption. The flood water and fallen trees resulted in power failure for several thousand households (The Sydney Morning Herald).
Initial observations suggest this was the wettest day since November 1984, when rainfall totals of 235mm
were recorded (the highest since 1858), and the first day since that event to achieve rainfall totals in excess of 100mm (ABC; Bureau of Meteorology Australian Government). The Observation Hill gauge in Sydney
recorded 105mm of rainfall in less than two hours as a result of the 2018 storm. Based on historical data from the gauge, this would translate to a 24-hour rainfall return period of 20 years (calculated by applying the Generalised Pareto Distribution curve to the historical daily data for the month of November, as shown in Figure 4).
However, because the downpour occurred within a two-hour period, the event is estimated to have a 1 in 100-year return period by the authorities (Bureau of Meteorology Australian Government; The Sydney Morning Herald; Reuters). Insured losses for the storm are thought to be relatively low in comparison to other
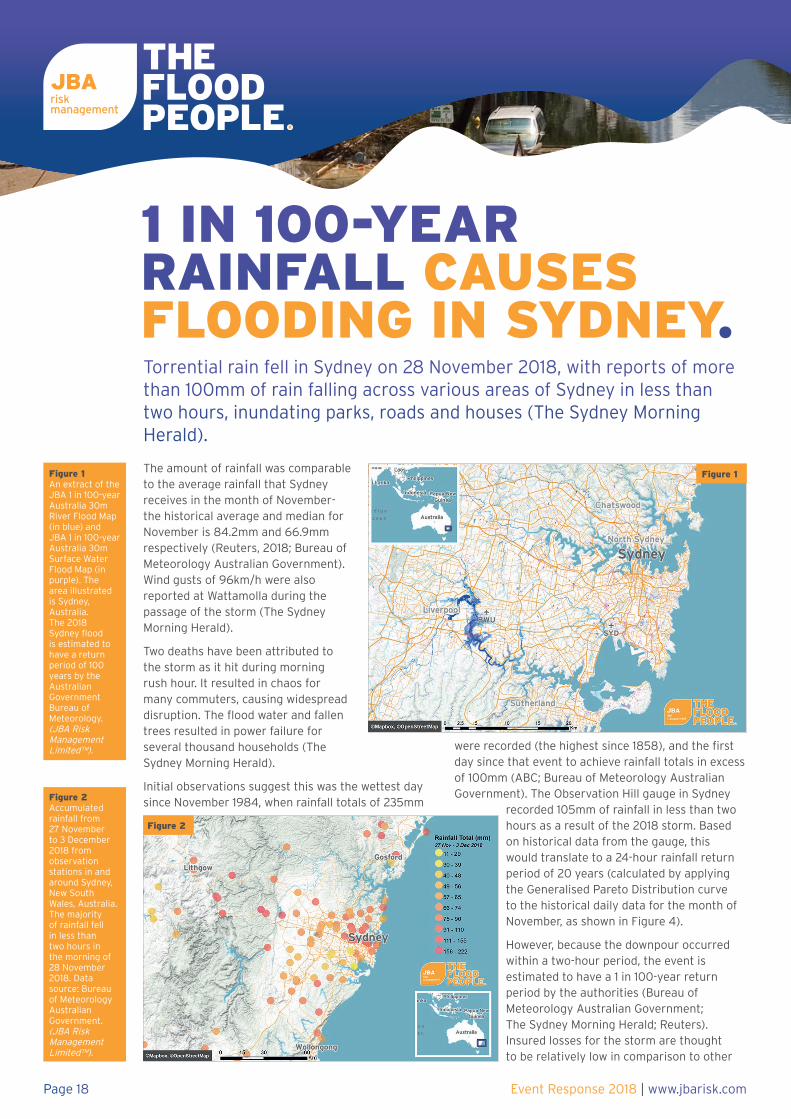
Figure 1An extract of the JBA 1 in 100-year Australia 30m River Flood Map (in blue) and JBA 1 in 100-year Australia 30m Surface Water Flood Map (in purple). The area illustrated is Sydney, Australia. The 2018 Sydney flood is estimated to have a return period of 100 years by the Australian Government Bureau of Meteorology. (JBA Risk Management Limited™).
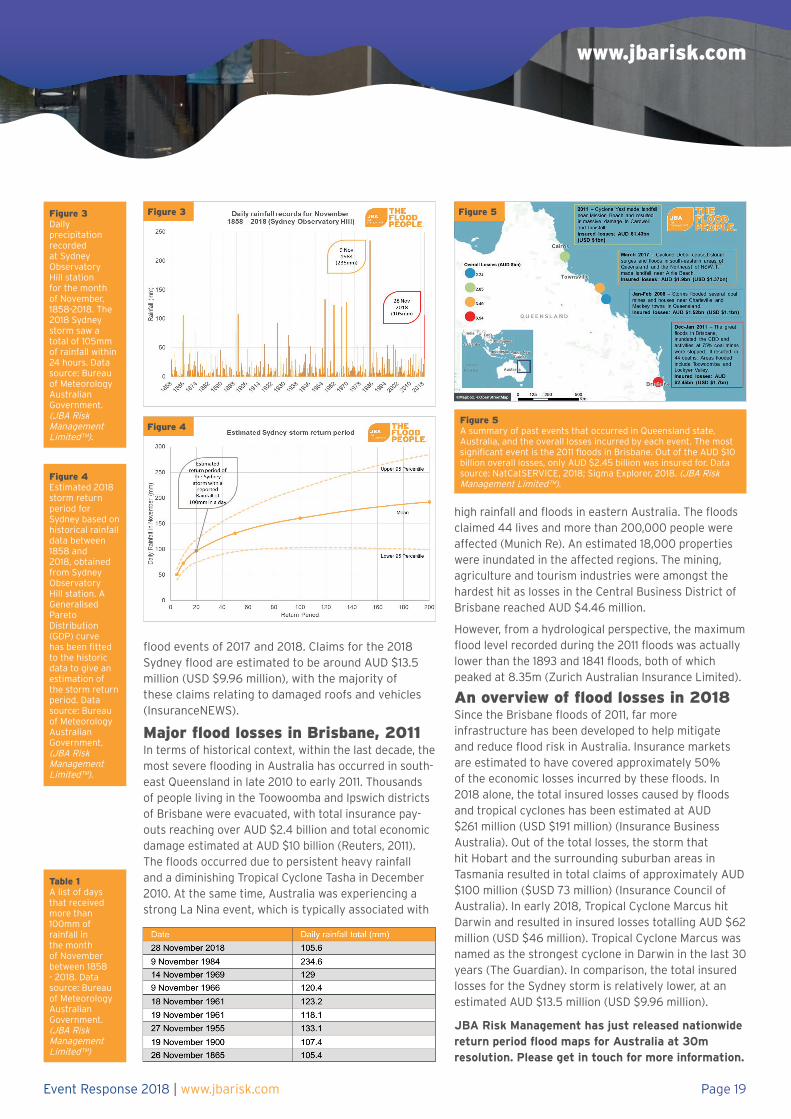
Figure 2Accumulated rainfall from 27 November to 3 December 2018 from observation stations in and around Sydney, New South Wales, Australia. The majority of rainfall fell in less than two hours in the morning of 28 November 2018. Data source: Bureau of Meteorology Australian Government.(JBA Risk Management Limited™).
1 IN 100-YEAR RAINFALL CAUSES FLOODING IN SYDNEY.Torrential rain fell in Sydney on 28 November 2018, with reports of more than 100mm of rain falling across various areas of Sydney in less than two hours, inundating parks, roads and houses (The Sydney Morning Herald).
Event Response 2018 | www.jbarisk.comPage 18
Figure 1
Figure 2
www.jbarisk.com
flood events of 2017 and 2018. Claims for the 2018 Sydney flood are estimated to be around AUD $13.5 million (USD $9.96 million), with the majority of these claims relating to damaged roofs and vehicles (InsuranceNEWS).
Major flood losses in Brisbane, 2011In terms of historical context, within the last decade, the most severe flooding in Australia has occurred in south-east Queensland in late 2010 to early 2011. Thousands of people living in the Toowoomba and Ipswich districts of Brisbane were evacuated, with total insurance pay-outs reaching over AUD $2.4 billion and total economic damage estimated at AUD $10 billion (Reuters, 2011). The floods occurred due to persistent heavy rainfall and a diminishing Tropical Cyclone Tasha in December 2010. At the same time, Australia was experiencing a strong La Nina event, which is typically associated with
high rainfall and floods in eastern Australia. The floods claimed 44 lives and more than 200,000 people were affected (Munich Re). An estimated 18,000 properties were inundated in the affected regions. The mining, agriculture and tourism industries were amongst the hardest hit as losses in the Central Business District of Brisbane reached AUD $4.46 million.
However, from a hydrological perspective, the maximum flood level recorded during the 2011 floods was actually lower than the 1893 and 1841 floods, both of which peaked at 8.35m (Zurich Australian Insurance Limited).
An overview of flood losses in 2018Since the Brisbane floods of 2011, far more infrastructure has been developed to help mitigate and reduce flood risk in Australia. Insurance markets are estimated to have covered approximately 50% of the economic losses incurred by these floods. In 2018 alone, the total insured losses caused by floods and tropical cyclones has been estimated at AUD $261 million (USD $191 million) (Insurance Business Australia). Out of the total losses, the storm that hit Hobart and the surrounding suburban areas in Tasmania resulted in total claims of approximately AUD $100 million ($USD 73 million) (Insurance Council of Australia). In early 2018, Tropical Cyclone Marcus hit Darwin and resulted in insured losses totalling AUD $62 million (USD $46 million). Tropical Cyclone Marcus was named as the strongest cyclone in Darwin in the last 30 years (The Guardian). In comparison, the total insured losses for the Sydney storm is relatively lower, at an estimated AUD $13.5 million (USD $9.96 million).
JBA Risk Management has just released nationwide return period flood maps for Australia at 30m resolution. Please get in touch for more information.
Table 1A list of days that received more than 100mm of rainfall in the month of November between 1858 - 2018. Data source: Bureau of Meteorology Australian Government. (JBA Risk Management Limited™)
Event Response 2018 | www.jbarisk.com Page 19
Figure 3
Figure 4
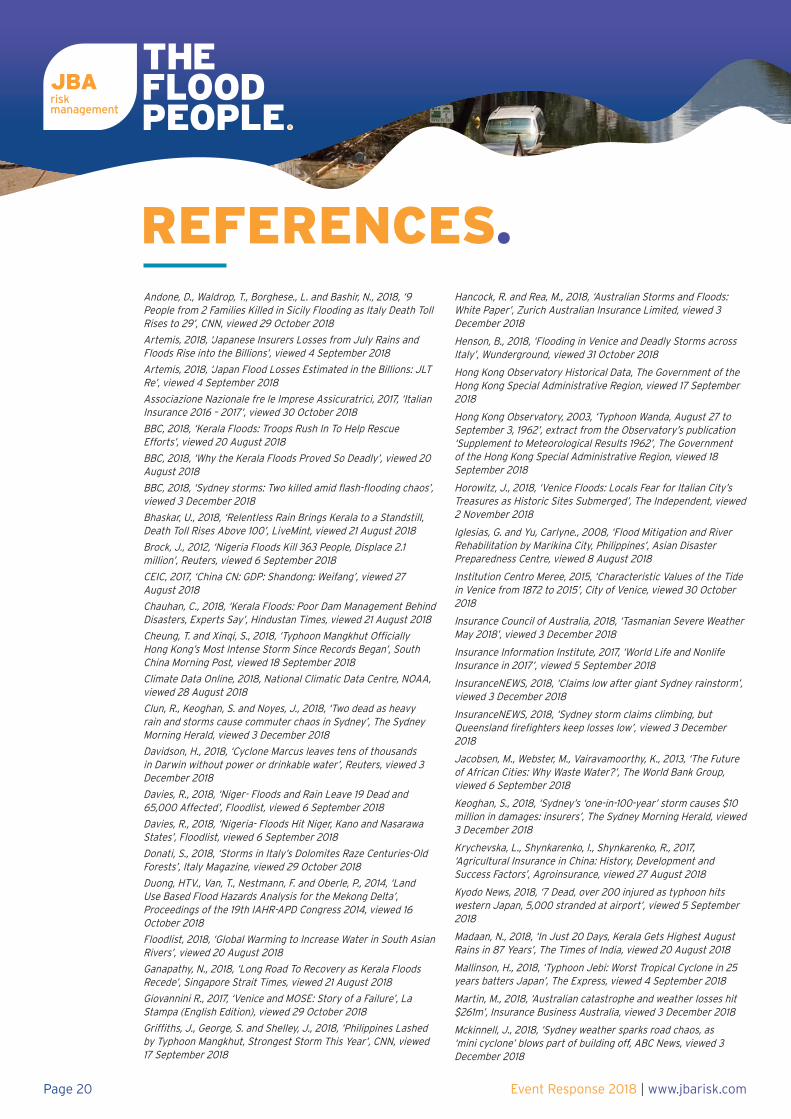
Figure 3Daily precipitation recorded at Sydney Observatory Hill station for the month of November, 1858-2018. The 2018 Sydney storm saw a total of 105mm of rainfall within 24 hours. Data source: Bureau of Meteorology Australian Government.(JBA Risk Management Limited™).
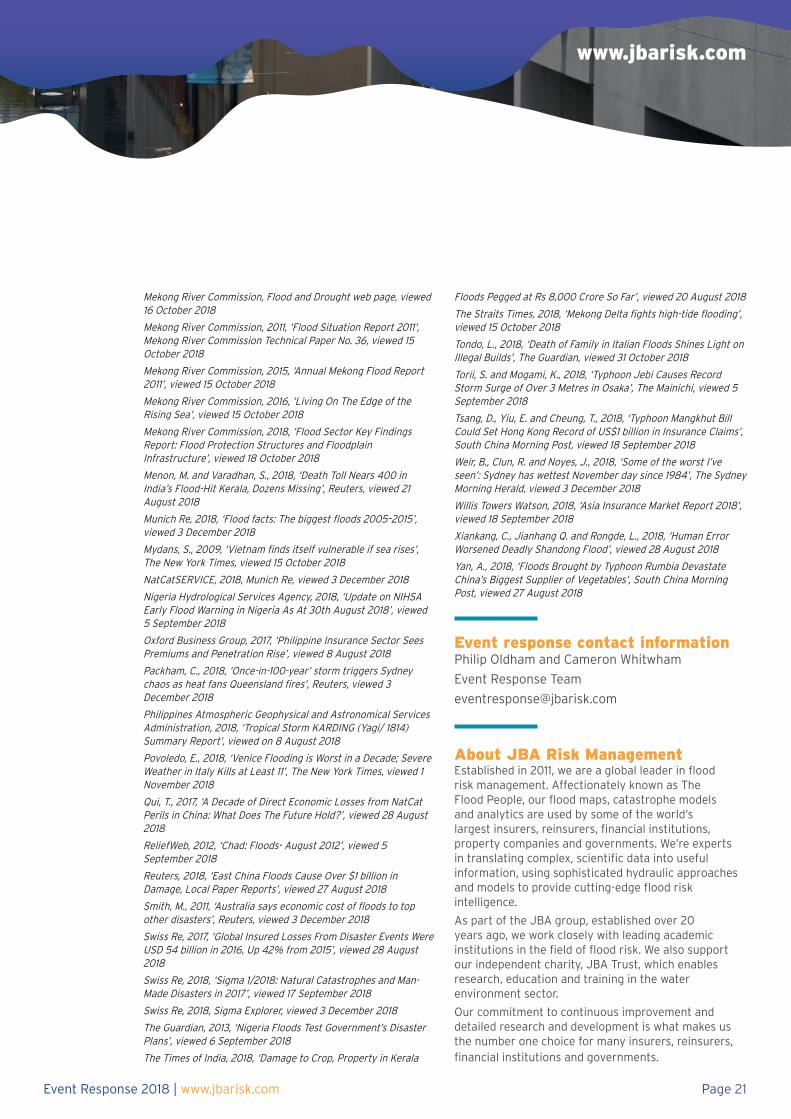
Figure 4Estimated 2018 storm return period for Sydney based on historical rainfall data between 1858 and 2018, obtained from Sydney Observatory Hill station. A Generalised Pareto Distribution (GDP) curve has been fitted to the historic data to give an estimation of the storm return period. Data source: Bureau of Meteorology Australian Government.(JBA Risk Management Limited™).
Figure 5A summary of past events that occurred in Queensland state, Australia, and the overall losses incurred by each event. The most significant event is the 2011 floods in Brisbane. Out of the AUD $10 billion overall losses, only AUD $2.45 billion was insured for. Data source: NatCatSERVICE, 2018; Sigma Explorer, 2018. (JBA Risk Management Limited™).
Figure 5
Event Response 2018 | www.jbarisk.comPage 20
REFERENCES.Andone, D., Waldrop, T., Borghese., L. and Bashir, N., 2018, ‘9 People from 2 Families Killed in Sicily Flooding as Italy Death Toll Rises to 29’, CNN, viewed 29 October 2018
Artemis, 2018, ‘Japanese Insurers Losses from July Rains and Floods Rise into the Billions’, viewed 4 September 2018
Artemis, 2018, ‘Japan Flood Losses Estimated in the Billions: JLT Re’, viewed 4 September 2018
Associazione Nazionale fre le Imprese Assicuratrici, 2017, ‘Italian Insurance 2016 – 2017’, viewed 30 October 2018
BBC, 2018, ‘Kerala Floods: Troops Rush In To Help Rescue Efforts’, viewed 20 August 2018
BBC, 2018, ‘Why the Kerala Floods Proved So Deadly’, viewed 20 August 2018
BBC, 2018, ‘Sydney storms: Two killed amid flash-flooding chaos’, viewed 3 December 2018
Bhaskar, U., 2018, ‘Relentless Rain Brings Kerala to a Standstill, Death Toll Rises Above 100’, LiveMint, viewed 21 August 2018
Brock, J., 2012, ‘Nigeria Floods Kill 363 People, Displace 2.1 million’, Reuters, viewed 6 September 2018
CEIC, 2017, ‘China CN: GDP: Shandong: Weifang’, viewed 27 August 2018
Chauhan, C., 2018, ‘Kerala Floods: Poor Dam Management Behind Disasters, Experts Say’, Hindustan Times, viewed 21 August 2018
Cheung, T. and Xinqi, S., 2018, ‘Typhoon Mangkhut Officially Hong Kong’s Most Intense Storm Since Records Began’, South China Morning Post, viewed 18 September 2018
Climate Data Online, 2018, National Climatic Data Centre, NOAA, viewed 28 August 2018
Clun, R., Keoghan, S. and Noyes, J., 2018, ‘Two dead as heavy rain and storms cause commuter chaos in Sydney’, The Sydney Morning Herald, viewed 3 December 2018
Davidson, H., 2018, ‘Cyclone Marcus leaves tens of thousands in Darwin without power or drinkable water’, Reuters, viewed 3 December 2018
Davies, R., 2018, ‘Niger- Floods and Rain Leave 19 Dead and 65,000 Affected’, Floodlist, viewed 6 September 2018
Davies, R., 2018, ‘Nigeria- Floods Hit Niger, Kano and Nasarawa States’, Floodlist, viewed 6 September 2018
Donati, S., 2018, ‘Storms in Italy’s Dolomites Raze Centuries-Old Forests’, Italy Magazine, viewed 29 October 2018
Duong, HTV., Van, T., Nestmann, F. and Oberle, P., 2014, ‘Land Use Based Flood Hazards Analysis for the Mekong Delta’, Proceedings of the 19th IAHR-APD Congress 2014, viewed 16 October 2018
Floodlist, 2018, ‘Global Warming to Increase Water in South Asian Rivers’, viewed 20 August 2018
Ganapathy, N., 2018, ‘Long Road To Recovery as Kerala Floods Recede’, Singapore Strait Times, viewed 21 August 2018
Giovannini R., 2017, ‘Venice and MOSE: Story of a Failure’, La Stampa (English Edition), viewed 29 October 2018
Griffiths, J., George, S. and Shelley, J., 2018, ‘Philippines Lashed by Typhoon Mangkhut, Strongest Storm This Year’, CNN, viewed 17 September 2018
Hancock, R. and Rea, M., 2018, ‘Australian Storms and Floods: White Paper’, Zurich Australian Insurance Limited, viewed 3 December 2018
Henson, B., 2018, ‘Flooding in Venice and Deadly Storms across Italy’, Wunderground, viewed 31 October 2018
Hong Kong Observatory Historical Data, The Government of the Hong Kong Special Administrative Region, viewed 17 September 2018
Hong Kong Observatory, 2003, ‘Typhoon Wanda, August 27 to September 3, 1962’, extract from the Observatory’s publication ‘Supplement to Meteorological Results 1962’, The Government of the Hong Kong Special Administrative Region, viewed 18 September 2018
Horowitz, J., 2018, ‘Venice Floods: Locals Fear for Italian City’s Treasures as Historic Sites Submerged’, The Independent, viewed 2 November 2018
Iglesias, G. and Yu, Carlyne., 2008, ‘Flood Mitigation and River Rehabilitation by Marikina City, Philippines’, Asian Disaster Preparedness Centre, viewed 8 August 2018
Institution Centro Meree, 2015, ‘Characteristic Values of the Tide in Venice from 1872 to 2015’, City of Venice, viewed 30 October 2018
Insurance Council of Australia, 2018, ‘Tasmanian Severe Weather May 2018’, viewed 3 December 2018
Insurance Information Institute, 2017, ‘World Life and Nonlife Insurance in 2017’, viewed 5 September 2018
InsuranceNEWS, 2018, ‘Claims low after giant Sydney rainstorm’, viewed 3 December 2018
InsuranceNEWS, 2018, ‘Sydney storm claims climbing, but Queensland firefighters keep losses low’, viewed 3 December 2018
Jacobsen, M., Webster, M., Vairavamoorthy, K., 2013, ‘The Future of African Cities: Why Waste Water?’, The World Bank Group, viewed 6 September 2018
Keoghan, S., 2018, ‘Sydney’s ‘one-in-100-year’ storm causes $10 million in damages: insurers’, The Sydney Morning Herald, viewed 3 December 2018
Krychevska, L., Shynkarenko, I., Shynkarenko, R., 2017, ‘Agricultural Insurance in China: History, Development and Success Factors’, Agroinsurance, viewed 27 August 2018
Kyodo News, 2018, ‘7 Dead, over 200 injured as typhoon hits western Japan, 5,000 stranded at airport’, viewed 5 September 2018
Madaan, N., 2018, ‘In Just 20 Days, Kerala Gets Highest August Rains in 87 Years’, The Times of India, viewed 20 August 2018
Mallinson, H., 2018, ‘Typhoon Jebi: Worst Tropical Cyclone in 25 years batters Japan’, The Express, viewed 4 September 2018
Martin, M., 2018, ‘Australian catastrophe and weather losses hit $261m’, Insurance Business Australia, viewed 3 December 2018
Mckinnell, J., 2018, ‘Sydney weather sparks road chaos, as ‘mini cyclone’ blows part of building off, ABC News, viewed 3 December 2018
www.jbarisk.com
Event Response 2018 | www.jbarisk.com Page 21
Mekong River Commission, Flood and Drought web page, viewed 16 October 2018
Mekong River Commission, 2011, ‘Flood Situation Report 2011’, Mekong River Commission Technical Paper No. 36, viewed 15 October 2018
Mekong River Commission, 2015, ‘Annual Mekong Flood Report 2011’, viewed 15 October 2018
Mekong River Commission, 2016, ‘Living On The Edge of the Rising Sea’, viewed 15 October 2018
Mekong River Commission, 2018, ‘Flood Sector Key Findings Report: Flood Protection Structures and Floodplain Infrastructure’, viewed 18 October 2018
Menon, M. and Varadhan, S., 2018, ‘Death Toll Nears 400 in India’s Flood-Hit Kerala, Dozens Missing’, Reuters, viewed 21 August 2018
Munich Re, 2018, ‘Flood facts: The biggest floods 2005–2015’, viewed 3 December 2018
Mydans, S., 2009, ‘Vietnam finds itself vulnerable if sea rises’, The New York Times, viewed 15 October 2018
NatCatSERVICE, 2018, Munich Re, viewed 3 December 2018
Nigeria Hydrological Services Agency, 2018, ‘Update on NIHSA Early Flood Warning in Nigeria As At 30th August 2018’, viewed 5 September 2018
Oxford Business Group, 2017, ‘Philippine Insurance Sector Sees Premiums and Penetration Rise’, viewed 8 August 2018
Packham, C., 2018, ‘Once-in-100-year’ storm triggers Sydney chaos as heat fans Queensland fires’, Reuters, viewed 3 December 2018
Philippines Atmospheric Geophysical and Astronomical Services Administration, 2018, ‘Tropical Storm KARDING (Yagi/ 1814) Summary Report’, viewed on 8 August 2018
Povoledo, E., 2018, ‘Venice Flooding is Worst in a Decade; Severe Weather in Italy Kills at Least 11’, The New York Times, viewed 1 November 2018
Qui, T., 2017, ‘A Decade of Direct Economic Losses from NatCat Perils in China: What Does The Future Hold?’, viewed 28 August 2018
ReliefWeb, 2012, ‘Chad: Floods- August 2012’, viewed 5 September 2018
Reuters, 2018, ‘East China Floods Cause Over $1 billion in Damage, Local Paper Reports’, viewed 27 August 2018
Smith, M., 2011, ‘Australia says economic cost of floods to top other disasters’, Reuters, viewed 3 December 2018
Swiss Re, 2017, ‘Global Insured Losses From Disaster Events Were USD 54 billion in 2016, Up 42% from 2015’, viewed 28 August 2018
Swiss Re, 2018, ‘Sigma 1/2018: Natural Catastrophes and Man-Made Disasters in 2017’, viewed 17 September 2018
Swiss Re, 2018, Sigma Explorer, viewed 3 December 2018
The Guardian, 2013, ‘Nigeria Floods Test Government’s Disaster Plans’, viewed 6 September 2018
The Times of India, 2018, ‘Damage to Crop, Property in Kerala
Floods Pegged at Rs 8,000 Crore So Far’, viewed 20 August 2018
The Straits Times, 2018, ‘Mekong Delta fights high-tide flooding’, viewed 15 October 2018
Tondo, L., 2018, ‘Death of Family in Italian Floods Shines Light on Illegal Builds’, The Guardian, viewed 31 October 2018
Torii, S. and Mogami, K., 2018, ‘Typhoon Jebi Causes Record Storm Surge of Over 3 Metres in Osaka’, The Mainichi, viewed 5 September 2018
Tsang, D., Yiu, E. and Cheung, T., 2018, ‘Typhoon Mangkhut Bill Could Set Hong Kong Record of US$1 billion in Insurance Claims’, South China Morning Post, viewed 18 September 2018
Weir, B., Clun, R. and Noyes, J., 2018, ‘Some of the worst I’ve seen’: Sydney has wettest November day since 1984’, The Sydney Morning Herald, viewed 3 December 2018
Willis Towers Watson, 2018, ‘Asia Insurance Market Report 2018’, viewed 18 September 2018
Xiankang, C., Jianhang Q. and Rongde, L., 2018, ‘Human Error Worsened Deadly Shandong Flood’, viewed 28 August 2018
Yan, A., 2018, ‘Floods Brought by Typhoon Rumbia Devastate China’s Biggest Supplier of Vegetables’, South China Morning Post, viewed 27 August 2018
Event response contact informationPhilip Oldham and Cameron Whitwham
Event Response Team
About JBA Risk ManagementEstablished in 2011, we are a global leader in flood risk management. Affectionately known as The Flood People, our flood maps, catastrophe models and analytics are used by some of the world’s largest insurers, reinsurers, financial institutions, property companies and governments. We’re experts in translating complex, scientific data into useful information, using sophisticated hydraulic approaches and models to provide cutting-edge flood risk intelligence.
As part of the JBA group, established over 20 years ago, we work closely with leading academic institutions in the field of flood risk. We also support our independent charity, JBA Trust, which enables research, education and training in the water environment sector.
Our commitment to continuous improvement and detailed research and development is what makes us the number one choice for many insurers, reinsurers, financial institutions and governments.

LEGAL BITS JBA Risk Management and The Flood People are UK registered trademarks of JBA Risk Management Limited. © JBA Risk Management Limited 2018.JCalf® is a registered trademark in the UK, and an unregistered trademark elsewhere, of JBA Risk Management Limited. All references to JCalf in this document refer to JCalf® in the UK.JFlow® is a registered trademark in the UK, and an unregistered trademark elsewhere, of Jeremy Benn Associates Limited. All references to JFlow in this document refer to JFlow® in the UK.All intellectual property rights in the contents of this document
belong to and shall remain the property of JBA Risk Management Limited. Please don’t copy, reproduce or adapt any of it in any way.The information in this document is subject to change. No guarantee is made as to its accuracy or completeness. JBA shall have no liability in connection with use of this document or the information it contains. Its contents deal with the modelled probabilities of natural hazards, which are highly uncertain.JBA Risk Management Limited, registered in England & Wales number 7732946, South Barn, Broughton Hall, Skipton, North Yorkshire, BD23 3AE, United Kingdom.
Get in [email protected]
UK+44 1756 799919
EUROPE+49 8092 2326756
USA+1 510 585 8401
SINGAPORE+65 968 62 968
www.jbarisk.com @jbarisk
JBA
JBA
JBA
JBA
GLOBAL LEADERS IN FLOOD RISK MANAGEMENT.