Embed Size (px)
Citation preview
1 International Interactions, forthcoming, 2012
Event Data on Armed Conflict and Security:
New Perspectives, Old Challenges, and Some Solutions1
SVEN CHOJNACKI
Free University of Berlin, Department of Political and Social Sciences,
CHRISTIAN ICKLER, MICHAEL SPIES, and JOHN WIESEL
SFB700: Governance in Areas of Limited Statehood, Berlin, Germany
This article presents the Event Data on Conflict and Security dataset (EDACS), discusses
the inherent problems of georeferenced conflict data, and shows how these challenges are met
within EDACS. Based on an event data approach, EDACS contributes to the growing number of
novel georeferenced datasets that allow researchers to identify causal pathways of violence and
the dynamics of (transboundary) violence through spatiotemporal disaggregation. However, the
unreflected use of any of these datasets will give researchers unjustified confidence in their
findings, as the pitfalls are many and propagating errors can result in misleading conclusions. In
order to identify and handle the different challenges to overall event data quality, we reflect upon
key problems and argue in favor of transparency in data collection and coding process, to
empower analysts to challenge the data and avoid cascading errors. In particular, we investigate
how the choice of news sources, the handling of geographic precision, and the use of auxiliary
data can bias event data. We demonstrate how the EDACS dataset design enables the analyst to
deal with these issues by providing a set of variables indicating the news sources, possible
sources of bias, and detailed information on geographic precision. This allows for a flexible
usage of the data based on individual analytical requirements.
International Interactions, forthcoming, 2012 2
Recent conflict research has focused more and more on geographically and temporally
disaggregated conflict data. A variety of datasets containing detailed, georeferenced information
on violent conflict events have emerged (Dulic 2010; Melander and Sundberg 2011; Raleigh et al.
2010). These datasets provide the opportunity to open the black box of war by allowing more
precise analyses of time-dependent variations of warfare and geographical differences in the
occurrence of violent events (see Buhaug 2010; Weidmann 2010; O’Loughlin et al. 2010). In
particular, the disaggregation of warfare contributes to our scientific understanding of the micro
mechanisms of armed conflicts within or across states, as well as to our knowledge on the
evolution of fragmented security environments in zones of civil wars and areas of limited
statehood.
Despite the welcome availability of a growing number of georeferenced event datasets,
several practical and analytical issues remain controversial or unresolved. In particular, data
collection efforts may lack transparency about subjectivity, uncertainty, or inter-coder consistency
of coding results (Gleditsch and Beardsey 2010). Hence, the unreflected use of any of these
datasets will give researchers unjustified confidence in their findings, which in turn may result in
misleading conclusions. In other words, since the “world of violence is what researchers make of
it” (Eberwein and Chojnacki 2001),2 users should be aware that the existing datasets only portray
the world of violence that is accessible (as reported by the selected news services) and
conceptually relevant (as based on operational definitions of violent events). Thus, by assuming
that both event data and the research strategies to collect information are inherently biased, the
overall scientific objective is not the completeness of events, but a proactive problem-oriented
approach to deal with biased information and transform source data into event data.
Focusing on georeferenced conflict event data, this article aims to identify and cope with
core challenges to overall event data quality.3 We reflect upon key problems and argue in favor of
3 International Interactions, forthcoming, 2012
transparency in data collection and coding process, to empower analysts to challenge the data and
avoid cascading errors. Furthermore, we present the new Event Data on Conflict and Security
(EDACS) dataset and show how the issues discussed are addressed within EDACS. In order to
highlight certain issues, we will also draw comparisons between EDACS and the two different,
georeferenced conflict event datasets currently available for comparison:4 the Armed Conflict
Location and Events Dataset (ACLED) (Raleigh et al. 2010) and the recently published beta
version of the Uppsala Conflict Data Program – Georeferenced Event Dataset (UCDP-GED)
(Melander and Sundberg 2011).
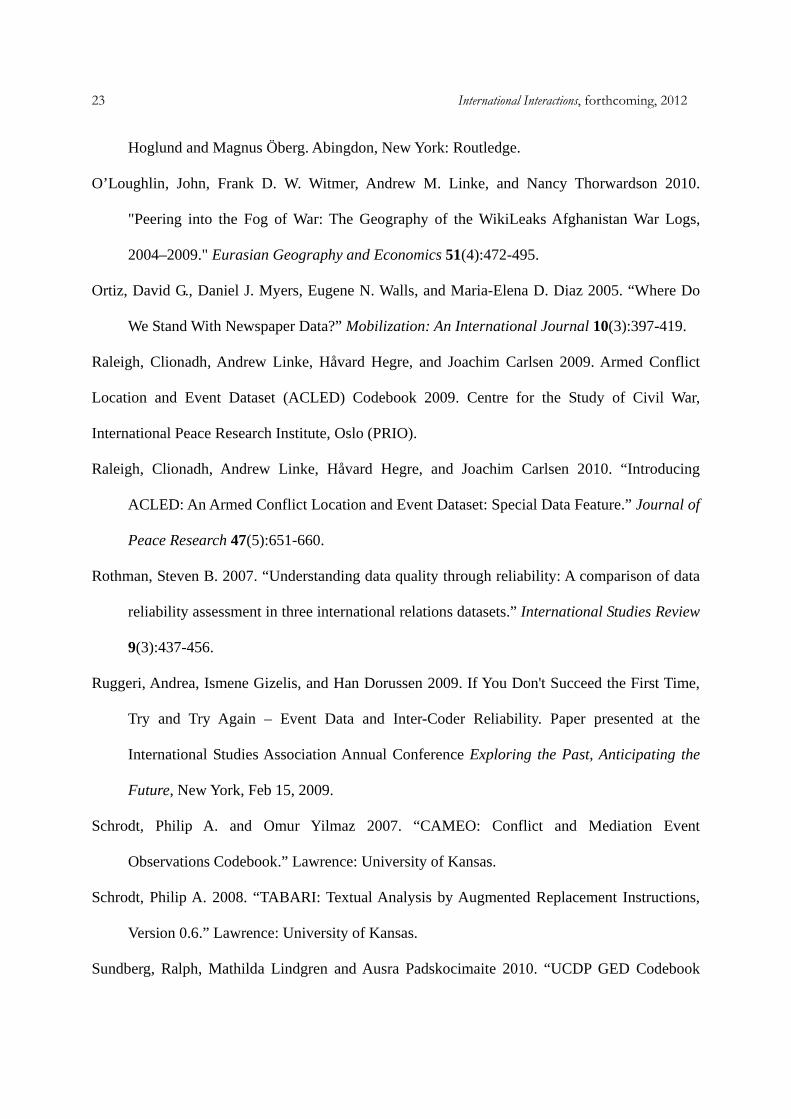
We distinguish between four different categories of challenges to data quality (see Figure
1): errors and bias contained in the source (news) or the auxiliary data (maps, etc.) and faults in
the processes of transformation of source data into event data (misinterpretation, oversights, etc.)
or in the contextualization of the events using auxiliary data (event localization, actor
identification, etc.).
(Figure 1 about here)
Data quality, in turn, can be broken down into several aspects: completeness, accuracy,
consistency, and relevancy (Batini and Scannapieca 2006, 40; Thion-Goasdoué et al. 2007). For
instance, inter-coder reliability – which prevents oversights and misinterpretations – helps to
achieve consistency, while higher resolution settlement data enhance accuracy. Considering the
complexity of the subject matter, there are boundaries to every quality dimension in the resulting
data. Whenever there is no optimal solution to a challenge to data quality, the resulting
shortcomings have to be made visible to the end users, to allow for a considered analysis and
prevent cascading errors.
International Interactions, forthcoming, 2012 4
After providing a brief introduction of the EDACS data, we will demonstrate ways to
push the inherent boundaries of data quality, guided by our four analytical categories of
challenges to data quality (see Figure 1): systematic errors in the source data (section Source Bias
in Conflict Event Data), fault-tolerant transformation of source data into event data (section
Event Extraction), errors contained in the auxiliary data, and possible faults in the processes of
spatiotemporal contextualization (section Event Contextualization).
EVENT DATA ON CONFLICT AND SECURITY (EDACS)
The project Event Data on Conflict and Security (EDACS) provides one approach that
allows users to disaggregate the institution of (civil) war and analyze the processes of armed
conflict as well as spatiotemporal variations of (in)security. EDACS is based on similar ideas as
ACLED (Raleigh et al. 2010) and UCDP-GED (Melander and Sundberg 2011), but focuses more
explicitly on violence in areas of limited or failed statehood. The dataset currently contains
detailed information on violent events in seven countries of Sub-Saharan Africa (Somalia,
Democratic Republic Congo, Republic of the Congo, Burundi, Rwanda, Sierra Leone, and
Liberia) between 1990 and 2009.
EDACS distinguishes itself fundamentally from the ACLED dataset by its stricter event
definition (see the section Selection Bias). Conceptually, violent incidents with at least one
fatality resulting from the direct use of armed force are coded with their location and timeframe.
Among other factors, the type of military action (fighting or diverse forms of one-sided violence),
the number and type of fatalities, as well as the involved violent or non-violent actors are coded.
Furthermore, we provide a set of variables indicating the news sources, possible sources of bias,
and detailed information on geographic precision to allow for flexible use of the data based on
5 International Interactions, forthcoming, 2012
individual requirements. A more detailed description of the dataset can be found in the download
section of our website.5
In contrast to UCDP-GED, which employs a similar event definition, EDACS covers
events with unknown actor participation (see the sub-section Problems of Actor Differentiation)
and includes actors and dyads not surpassing the minimum threshold of twenty-five conflict-
related fatalities per year applied in UCDP-GED (Melander and Sundberg 2011, Sundberg et al.
2010). By not limiting our focus to well-observed actors and conflict dyads, EDACS provides a
more comprehensive and detailed picture than UCDP-GED of patterns of violence in the
observed countries and periods. In the following sections, we demonstrate how the EDACS
dataset design enables the analyst to deal with the core challenges to georeferenced event data
coding and usage as outlined above.
SOURCE BIAS IN CONFLICT EVENT DATA
Like other event datasets (e.g. ACLED, UCDP, WEIS), EDACS relies on news sources
for gathering information on armed conflict. However, the biased nature of media-based (and
other kinds of secondary) sources has implications for data reliability. Quantitative researchers
have been studying these issues for almost forty years. Doran et al. (1973), Hazlewood and West
(1974), and Jackman and Boyd (1979), just to name a few, have analyzed how the selection of
different news sources affects data reliability for conflict events such as demonstrations, coups, or
assassinations in cross-country conflict research. While Doran et al. (1973) detected contradicting
trends in data collected from international versus regional newspapers, others have concluded that
differences in event reporting are rather marginal, and that “increasing coverage beyond two
sources is not likely to result in substantial changes to the ‘overall picture’ ” of event data trends
International Interactions, forthcoming, 2012 6
(Hazlewood and West 1974; Jackman and Boyd 1979, 457; Taylor and Hudson 1972).
More recently, a vast array of literature has emerged in the field of protest research that
deals with the causes, consequences, and handling of reporting bias in media-based event datasets
(e.g. Barranco and Wisler 1999; Earl et al. 2004; Hug and Wisler 1998; Mueller 1997; Ortiz et al.
2005). Unlike violent conflict event data projects, this literature mainly deals with (violent)
protest events in ‘Western’ countries, where the circumstances differ significantly from war-torn
countries in the Global South. Nonetheless, conflict research has to acknowledge the analytical
concepts and methods from this literature to address media bias in the development and analysis
of event data.
It is important to distinguish between causes and effects of selective event reporting
(selection bias) and erroneous information on events (description bias) (Earl et al. 2004, 67).
These different levels of news bias will be discussed in the following. However, only a few
aspects can be considered here; for a more detailed discussion of various types of media bias in
event reporting, see for example Öberg and Sollenberg (2011).
Selection Bias
Media-based event datasets are only a subsample of the “real” events (Barranco and
Wisler 1999; Doran et al. 1973). This is especially true for armed conflict events, since reporting
in war-torn areas is often limited due to censorship, security, and other reasons (Öberg and
Sollenberg 2011). However, as Earl et al. (2004) point out, “a sample of even 5% of [real] events
would not be problematic if it were truly representative” (Earl et al. 2004, 70). Researchers can
only assume that the event data collected by them is representative and try to minimize the effect
of potential sources of bias and miscoding.
7 International Interactions, forthcoming, 2012
Media reporting is decisively influenced by varying news values, potentially resulting in
selection bias (Hocke 1995; Mueller 1997). Several factors such as frequency and relevance
influence the perceived newsworthiness of an event and the decision to report it or not (Galtung
and Ruge 1965; Öberg and Sollenberg 2011, 57). Furthermore, these factors might change
depending on location and time, making it difficult to assess the resulting selection bias. Violent
events are generally considered to be relatively newsworthy (Barranco and Wisler 1999, 304;
Woolley 2000, 158), as are armed conflicts in general (Öberg and Sollenberg 2011, 53). However,
this assumption must be treated with caution, since other aspects such as abruptness or
identification strongly influence newsworthiness as perceived by media outlets. In other words,
the interest of international media in a specific armed conflict declines gradually over time, but
increases with a great power military intervention or the involvement of UN-led multilateral
forces.
Nonetheless, we argue that conflict events resulting in the loss of life are reported with
higher consistency than those without fatalities, even if they, of course, remain susceptible to
selection bias, but in a positive way – in the media they are selected over other events that do not
involve loss of life. While ACLED includes lethal and non-lethal battles or one-sided attacks as
events in an undifferentiated manner (Raleigh et al. 2010), we define an event as a violent
incidence at a specific location and a specific time with at least one fatality resulting from the
direct use of armed force. This lethality threshold of single events corresponds to the approach
taken by UCDP-GED (Sundberg et al. 2010) and seems appropriate to obtain a more reliable and
consistent data basis for studying patterns of violence and (in)security.
If certain regions or time periods have higher news coverage than others, systematic
selection bias is likely to fake trends. If alternative datasets are lacking, the analyst has to address
this problem through source criticism and a careful interpretation of the results, considering the
International Interactions, forthcoming, 2012 8
nature of the information sources (Öberg and Sollenberg 2011). We therefore argue that
consistency of the data sources across time and regions is a necessary precondition when
interpreting empirical findings.
EDACS is based on a set of four predefined sources or media outlets that are used for all
coded countries and years of observation. First, the archives of three international newspapers
(The Guardian, The New York Times, and The Washington Post) and the broad collection of
translated local news reports by BBC Monitoring were searched by keywords through
LexisNexis. All sources had been pretested and were found to report relatively consistently for
the cases selected and the period under study (1990 to the present). This approach of searching
predefined news outlets is similar to UCDP-GED but contrasts with ACLED, where sources
differ between regions and periods of observation, as shown in the following.6
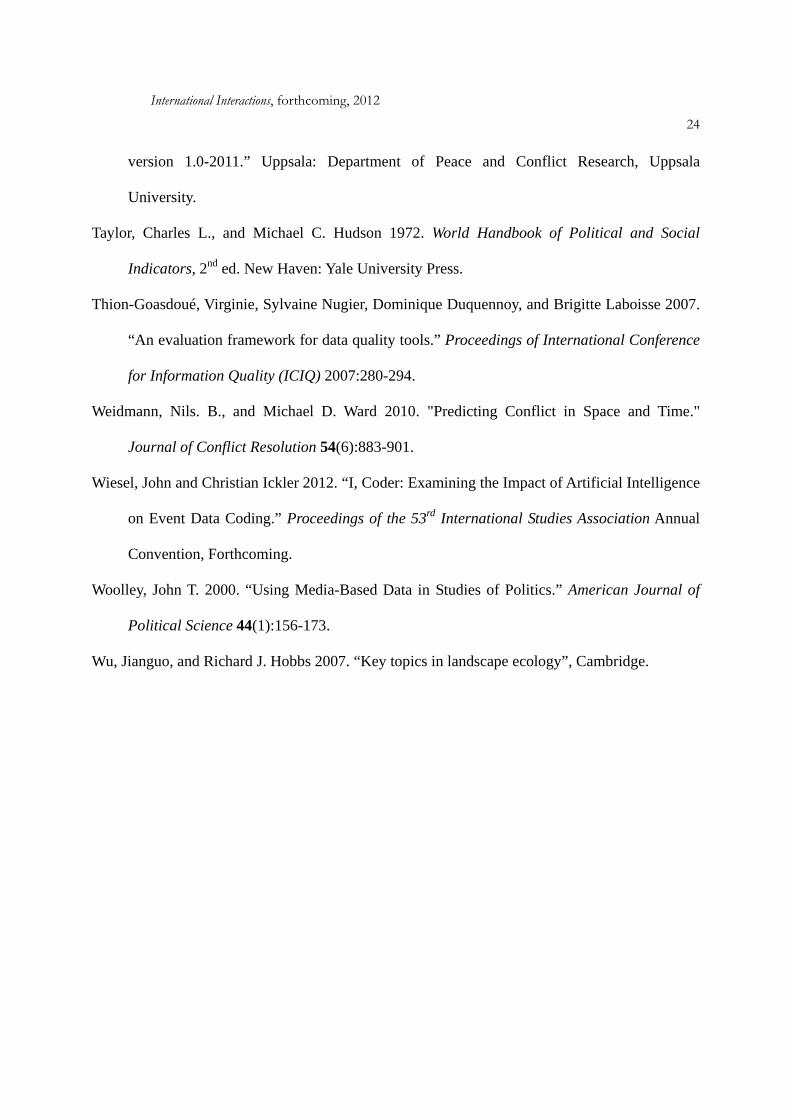
When comparing EDACS for Somalia 1997-20097 with UCDP-GED events and battle-
and one-sided violence against civilians events8 of ACLED, the issue of source consistency
becomes striking (see Figure 2): Until 2003, EDACS collected slightly more events (split by
days9) than ACLED and UCDP-GED. From 2003 onwards, however, the number of ACLED
events sharply increased, while EDACS and UCDP-GED followed a common trend of slightly
declining event numbers until the Ethiopian invasion of Somalia in late 2006. One explanation
for this strong discrepancy in the data may be that about 88% of the ACLED events from 2003
are based on data from the Worldwide Incidents Tracking System (WITS) and reports from the
Security Preparedness and Support Program (SPAS). While they probably provide more detailed
information than the news reports used for EDACS and UCDP-GED, this inconsistency
overemphasizes violence after 2003, leading to artificial data trends.
(Figure 2 about here)
9 International Interactions, forthcoming, 2012
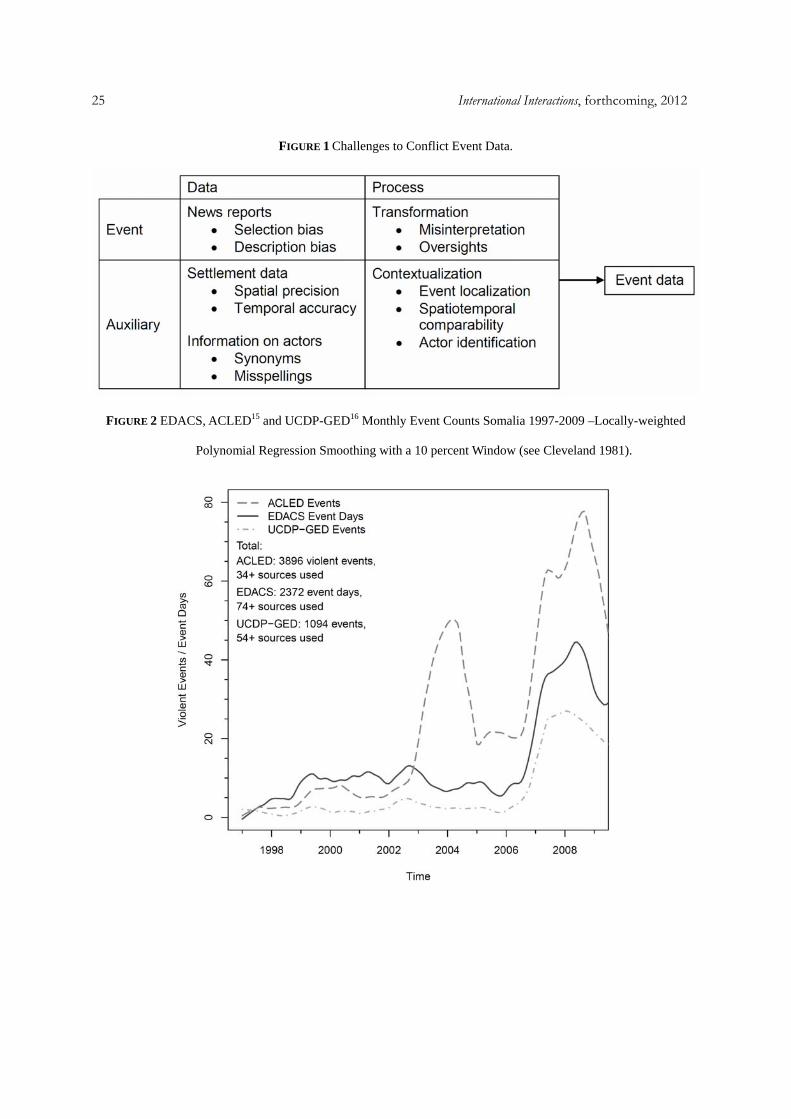
Even more extreme than the discrepancy in Somalia 1997-2009, where ACLED collected
between two and four times as many events as EDACS or UCDP-GED (see Figure 2), in the case
of Sierra Leone ACLED counted between five and eight times as many violent events (1287) as
EDACS (194 events/276 event days) or UCDP-GED (156 events) for the years 1997-2003 (see
Figure 3), the time period for which data is available in all three datasets. Like in Somalia, event
numbers over time of EDACS and UCDP-GED appear to correlate during the period of
observation in Sierra Leone. Clearly it is important to question whether the high deviation of
ACLED event numbers can be explained by ACLED’s inclusion of violent events not resulting in
fatalities, in contrast to the other two datasets.
(Figure 3 about here)
If we suspected all three data projects to have similarly high event coding standards, this
discrepancy would probably be a result of differing strategies of source selection. While EDACS
and UCDP-GED follow a similar standardized approach in all countries of observation of
searching the predefined media outlets, ACLED uses more than fifty different secondary sources
or media outlets for Sierra Leone 1997-2003. While it may be questioned whether the sources
used in EDACS and UCDP-GED neglect this region (compared to Somalia), source criticism and
the detection of selection bias are not possible for the ACLED data, since there is no
documentation available to explain the selection of this vast array of sources.
ACLED, similar to other event data projects (e.g. Nardulli et al. 2011), appears to reduce
source selectivity by maximizing the number of sources used. However, it is unclear whether this
reduces or only obscures selection bias. Using additional news sources does not necessarily
International Interactions, forthcoming, 2012
10
reduce bias, since they might all be affected by the same biases (Hug and Wisler 1998). Other
sources of selective news coverage, such as presence or absence of observers, censorship, or
general media restrictions (Öberg and Sollenberg 2011) might be more pronounced. Considering
the rapid spread of information and communications technology in the Global South over the last
few years, the inclusion of all available sources would further intensify this bias towards recent
conflict events. Furthermore, maximizing the number of sources lessens reproducibility and
hinders source criticism. Besides, additional sources increase the costs of data coding and
promote coding errors.
We currently conduct research on (semi-)automated event data coding (see below), which
will provide opportunities to test the effects of including additional news sources. Though our
data cannot be traced back to real events, we are able to compare data from different sources to
estimate causes and patterns of selection bias. In order to allow for such comparative studies,
event datasets must precisely indicate their sources and coding processes, and avoid interpretation
of sources by coders via strict coding rules. Only through careful interpretation of results and
source selectivity can research findings become meaningful.
Description Bias
Not only that an event is reported, but also how it is reported is crucial for event data
quality. In order to carry out research using event data, one must assume that the given location
and time of events are trustworthy (Abbott 2006, 17; Earl et al. 2004). However, it remains
difficult to argue that specified actors can be considered “hard data” (Raleigh et al. 2010, 656).
Going through the news reports it is often impossible to differentiate whether an actor is named
or blamed by a source or cited witness. Likewise, fatality counts are highly susceptible to bias
11 International Interactions, forthcoming, 2012
since they are often subject to government or rebel propaganda.
The issue of description bias is especially severe when media outlets retrieve information
directly or indirectly from conflict actors. However, we would miss a large share of events and
risk an even stronger media restriction bias if we excluded these reports. For each event, names
and publication dates of the news sources are indicated. Furthermore, events are marked as
biased in EDACS if the information on the event is provided by this type of source. We therefore
enable the data user to exclude these events from their analysis. In the EDACS data on Sierra
Leone, for instance, biased sources constitute about 20% of events in the early nineties in Sierra
Leone – in the period 1990-1995, this share is almost 40%.
With the EDACS project we code actors as they are reported in the respective sources.
However, when information is seemingly biased, we mark the specified actor as “unconfirmed”.
Specific coding rules regarding actors and coded variables are documented in detail in a
downloadable codebook.10
The inherent bias in fatality counts, however, must be addressed in a more complex way.
Since fatality numbers may constitute the least reliable information related to armed conflict
events (Raleigh et al. 2010), their coding, analysis, and interpretation must be handled with care.
We code minimum and maximum fatality numbers whenever different sources provide
contradicting figures.11 Further, we have developed a set of strict and conservative rules to code
fatalities in order to ensure intersubjectivity and consistency of our data.
For instance, a violent event in southern Somalia was reported as follows in The New
York Times:
“Somalia's faltering government and powerful Islamists on Saturday
exchanged artillery fire for the second day near the government seat … After an
overnight lull, rival forces resumed clashes in villages south of Baidoa …
International Interactions, forthcoming, 2012
12
witnesses and officials said.
‘The fighting has resumed and it is raging in the same area as yesterday,’
Sheik Osmail Addo, an Islamic commander, said. Each side confirmed casualties,
with the Islamists saying that 50 people had died – 30 government soldiers and 20
Islamists – but there was no independent confirmation. The government army said
it had lost soldiers in Friday's fighting, but declined to give a figure. ‘We lost a lot
of men,’ Commander Ibrahim Batari said.” (Agence France-Presse, 2006)
According to our coding rules, any claims regarding death figures by parties involved in
the conflict are coded conservatively, with the minimum set at twenty-two and the maximum at
the number stated in the claim. Since there is no optimal solution to this challenge, we provide a
descriptive string variable citing the death figures’ description, which enables end users to apply
their own coding rules.
EVENT EXTRACTION
Compounding the challenges to completeness (selection bias), accuracy, and consistency
(description bias), there are also inherent obstacles to the generation of event data during the
actual transformation of news articles into structured information. During the process of coding,
or more precisely, event extraction, accuracy can be affected by oversights and inconsistency in
the subjective judgments of human coders, as investigated more in detail by Laver et al. (2003),
Rothman (2007), and Ruggeri et al. (2009).
To address these issues, EDACS enforces certain constraints stored in a relational
database. For instance, we have already mentioned that an event must be attributed to at least one
news source. Therefore, our database model does not accept a data entry without the source name
13 International Interactions, forthcoming, 2012
and the date of publication. Without these precautions, the transformation process would become
less robust and might lead to artificial data. Furthermore, using the querying infrastructure
provided by the database, ex-post checks are run to explore more complex reliability issues. This
includes checks for potential duplicate events, potentially unreasonable values, and outlier
detection.
Another significant, albeit labor-intensive precaution taken in EDACS is to code all data
twice, by two different coders, automatically documenting which coder creates and which coder
revises each entry. Conflicting results from the two coding rounds are reconciled by a supervising
coder, which eventually leads to enhanced completeness and consistency.
As a consequence of the inherent susceptibility to inconsistency of manual coding,
automated methods have been evaluated (King and Lowe 2003; Laver et al. 2003; Schrodt 2008).
King and Lowe reported accuracy “virtually identical” to machine coding with human coders
(King and Lowe 2003, 636). Upon closer examination, the results were very mixed: King and
Lowe found a precision of 93% but also a false positive rate of 77%, i.e. 77% of sources were
wrongly classified as containing an event. Such a high false positive rate would render any
automated coding result useless. A similar strategy has been chosen by Nardulli et al. (2011) who
employ manual coding supported by a more sophisticated document classification approach and
achieve a false positive rate of 35%, which already “enables human operators to process huge
amounts of text in an efficient manner” (Nardulli et al. 2011, 4). Nevertheless, 35% of all
irrelevant articles have to be reviewed and dismissed manually – a high burden to human coders
that devaluates the very low false negative rate of 1-4% (i. e. few relevant articles are erroneously
excluded).
This strongly suggests going one step further: to use document classification in
combination with machine coding to assist human coders whenever possible. Nardulli et al.
International Interactions, forthcoming, 2012
14
(2011) propose the same but are still in the development phase of such event extraction software.
In EDACS, we have implemented and road-tested a combination of text classification and event
extraction methods using supervised machine learning and natural language processing. This
approach takes less time than manual extraction and allows for automated recoding using altered
coding rules if desired (Wiesel and Ickler 2012).
EVENT CONTEXTUALIZATION
During the data generation process, researchers face problems that go beyond the mere
transformation of news articles into event data. Using information such as maps, settlement data,
and qualitative reports, data projects contextualize events, translate toponyms to geographic
coordinates, determine actor alliances, and more.
Problems of Event Localization
All three data projects under investigation draw on the toponymic GEOnet Names Server
(GNS) for event localization. The GNS database is maintained by the US National Geospatial-
Intelligence Agency (NGA) and provides location names and coordinates in the World Geodetic
System 1984 (WGS 84) on a global level (NGA 2011). GNS provides an extensive settlement
dataset that is easily accessible at no charge. For micro-level analysis of conflict dynamics,
however, GNS coordinates may be of limited use. Firstly, “GNS feature coordinates are
approximate and are intended for finding purposes” (NGA 2011). Furthermore, large urban
agglomerations are represented by a single vector point, even though cities cover large areas.
Temporary settlements, which are common in the rapidly changing environment of civil wars,
15 International Interactions, forthcoming, 2012
further complicate the matter. Toponym ambiguities are also frequent – for instance, the town of
Koidu in Sierra Leone has seven entries in the GNS dataset, located up to fifty-five kilometers
apart from each other but within the same district (Kono District, Eastern Province). In EDACS,
we estimate locations in such cases after consulting additional map data such as GoogleEarth or
Harvard’s AfricaMap. Toponym ambiguities are indicated in an additional, event-specific text
variable.
Newspaper articles often do not give the event location precisely. Instead, an article might
indicate only a region or administrative unit, or mention relative geographic locations: e.g. “not
far from A,” “in between B and C,” or “about twenty kilometers northeast of D.” This is the case
for about one third of all events (see Table 1) in the EDACS dataset. In ACLED and UCDP-GED,
this problem is approached by specifying various levels of geoprecision, designating whether the
coordinates refer to an exact location, an administrative division, or other approximate areas such
as part of a region (Raleigh et al. 2009) or “near” an exact location (Sundberg et al. 2010, 14).
Instead of predefining levels of accuracy, we quantify the accuracy. We specify buffers according
to a set of strict buffer rules, while providing the original location description in an additional text
variable. For instance, if a specific administrative unit is indicated, we code the coordinates of the
centroid and specify a buffer relative to the size of the unit. If a location is described as “along the
road between A and B,” we code the central point along the respective road using auxiliary map
data, and specify the distance to A or B as a location-specific buffer radius.
(Table 1 about here)
Other problems originating from the lack of accuracy of digitized maps and context data
in civil war areas include, but are not limited to, incomplete data, lack of remote sensing data
International Interactions, forthcoming, 2012
16
(especially in tropical regions due to cloud coverage), incompatible scales (due to generalization-
impeding data pooling), accessibility (due to military restrictions, privacy laws, etc.), accuracy
(expensiveness in acquisition and generation), temporal dynamics, propagation of errors (caused
by miscoded information which cascades through the data – and renders results useless), and the
Modifiable Areal Unit Problem (MAUP) (erroneous belief that a data attribute is homogenous)
(Cressie and Wikle 2011, 197; Wu and Hobbs 2007, 117ff.). Coding events in remote or rural
areas, as well as border or coastal regions, is also highly problematic due to the imprecision of
underlying base maps and imprecise source indications. These problems can only be addressed
via a multi-data approach and interpolation techniques, but they are far from solved.
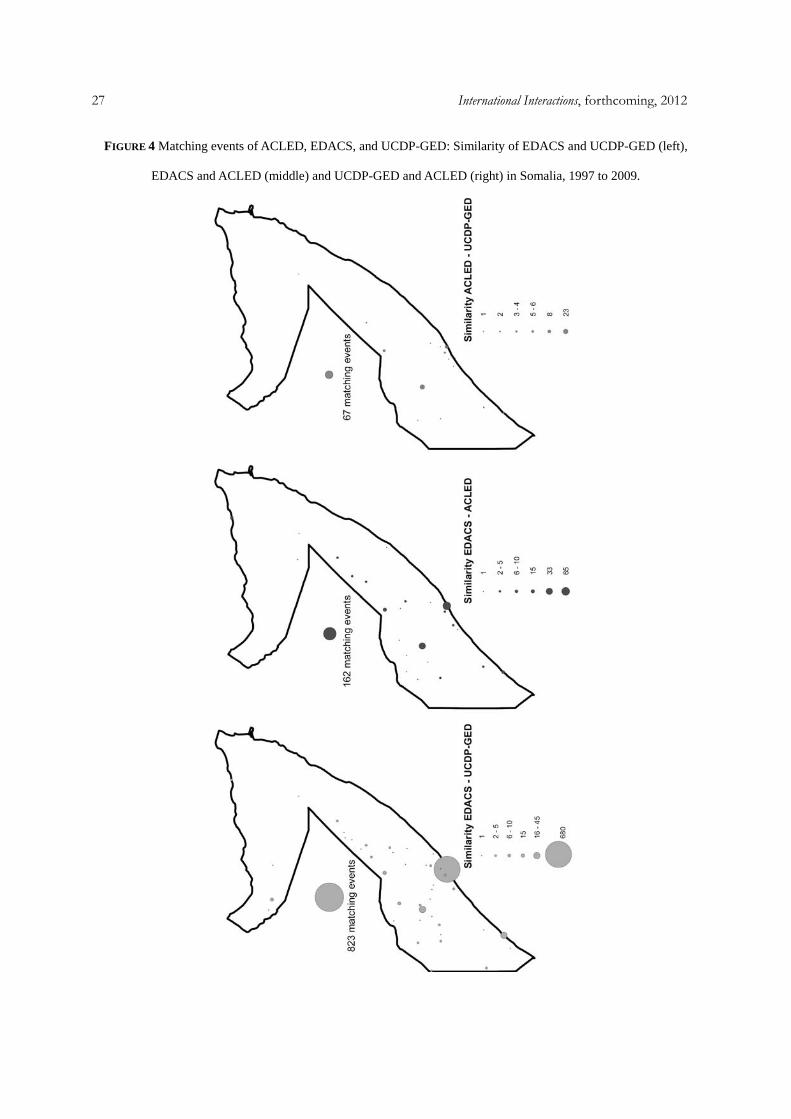
When comparing the degree of spatial-temporal similarity of EDACS, UCDP-GED, and
ACLED events in Somalia (1997-2009) (see Figure 4) coded with the highest temporal and
geographical precision,12 the results show a high overlap between EDACS and UCDP-GED,
while both EDACS and UCDP-GED largely differ from ACLED. Only 8.47% of EDACS event
days occur on the same day as ACLED violent events within a distance of five kilometers,
whereas 33% of EDACS event days match UCDP-GED events (see Figure 4).
(Figure 4 about here)
Problems of Temporal Inaccuracy
The temporal dimension of violent events is essential for the analysis of conflict
dynamics, but the coding of start and end dates of events is a highly problematic issue. First,
reports of violence are often not accurate enough to distinguish between single and aggregated
events and to determine exact time spans. Imprecise wording such as “last week” or “recently”
17 International Interactions, forthcoming, 2012
makes estimations necessary. Again, we defined a set of coding rules to handle such
specifications in a consistent way. To allow for deviating interpretations by the analyst, EDACS
indicates such cases using the Boolean variable estimated date (see time-estimated events in
Table 1) and stores the original source description for further use.
Temporal disaggregation is further complicated by events that span several days – for
instance, when fatality counts per day are necessary. We provide two versions of EDACS data: a
standard version and a version disaggregated by day. Temporally disaggregated, the number of
fatalities is divided by the number of days, enabling the researcher to analyze “event days”
instead of events. We do not consider this an ideal solution, but rather a practicable attempt to
reduce the problem.
Problems of Actor Differentiation
As mentioned earlier, the identification of violent actors by news sources must be treated
with caution. However, an exclusion of reported events, as in UCDP-GED (see above), with one
of the participating actors not identified, harms data completeness and creates a selection bias
towards well-documented events. Similar to ACLED (Raleigh et al. 2010), we therefore code
these events using generic actor categories such as “rebels,” “bandits,” “clan militia,” or else
“unspecified actor.” Of course, most categories are highly problematic since they are often
created by the media. However, the informed researcher might be able to identify actors that are
most likely to be responsible for a specific event. In order to assure data consistency and allow
for source criticism, we generally refrain from judgment and leave such educated guesses to the
analyst.13 In some cases, however, interpretation based on auxiliary data is necessary in order to
avoid redundancy in the actor database. While one source might name a particular actor by its
International Interactions, forthcoming, 2012
18
self-declared name (e.g. “Somali National Alliance”), another might specify the actor by its
leading commander (e.g. “fighters loyal to warlord Mohamed Farah Aidid”) or by its involvement
in previous events (e.g. “militia alliance fighting the UNOSOM II mission in the Battle of
Mogadishu”). Consulting qualitative conflict reports as well as consolidated actor databases, for
instance provided by UCDP or the Institute for Strategic Studies (IISS), actors are coded in
EDACS by their most commonly used name. We are aware that this approach can introduce new
bias into our data. However, the consequent literal coding of actors as indicated in the sources
would maximize data replicability, but also minimize its utility for research. Again, there is no
optimal solution. Consequently, possible shortcomings have to be made visible to end users and
analysts, thereby enabling them to challenge our coding decisions and gain new insights and
more credible conclusions.
CONCLUSIONS
The attraction of developing event datasets has resulted from the lack of existing research
programs to account for the mechanisms and dynamics of violent conflict and warfare on the
local or sub-state level. Today, a new generation of event data on armed conflict and security
sheds light on patterns of who fights where and under what local conditions, and allows
researchers to test hypotheses that highlight spatial and temporal dynamics of violence. Paying
theoretical and empirical attention to the complex relationship between time, spaces, actors, and
violent behavior is a necessary condition not only to advance the scientific study of conflict and
war in general, but also to better understand regional or local variations of one-sided and mutual
violence. However, we should be aware of serious errors resulting from the sources and auxiliary
data used, as well as of shortcomings in the processes of transforming source data into event data
19 International Interactions, forthcoming, 2012
(misinterpretation, oversights) and faults in the contextualization of events. In this sense, the
growing diversity of georeferenced event datasets becomes a chance to enhance data quality by
comparing sources, events, and results. It could, at least to some degree, minimize the ‘one-stop
shopping’ problem that typically arises from (unjustified) confidence in the quality of large data
collections.
Nevertheless, even an increase in collected information on violent events cannot portray
the ‘real world’ of violence or war. The methodological problem remains of how to confirm
causal relationships of single events or between a series of events. If one assumes that the
occurrence of a particular event is always better reflected as “a matter of chance” (Lebow 2000,
592), then conclusions drawn from a recorded sequence of violent events concerning the
mechanisms and dynamics of armed conflict become illusive.
At the end of the day, there is no guarantee that the collection of more and more events or
the cyclical development of new data projects will improve our knowledge of the etiology and
dynamics of violence. On the contrary, there is a high risk that both coders and users
underestimate challenges to the accuracy, consistency, and relevancy of event data. The
consequential problem is one of credibility. What conflict research needs and what EDACS offers
is transparency and a proactive problem-oriented approach to empower analysts to question the
data and avoid cascading errors. Overcoming the ‘one-stop shopping’ problem means striking a
balance between quantitative and qualitative methods, confirming the correctness of computed
event clusters by crosschecking them with qualitative reports,14 and being aware of the
uncertainty of conflict environments and the limitations of scientific knowledge.
International Interactions, forthcoming, 2012
20
REFERENCES
Abbott, Marianne 2006. Dangerous Intervention: An Analysis of Humanitarian Fatalities in
Assistance Contexts. Dissertation, Graduate School of The Ohio State University.
Agence France-Presse December 10, 2006. “Islamists and Somali Troops Exchange Fire.” The
New York Times.
Barranco, José, and Dominique Wisler 1999. “Validity and Systematicity of Newspaper Data in
Event Analysis.” European Sociological Review 15(3):301-322.
Batini, Carlo, and Monica Scannapieca 2006. Data quality: Concepts, methodologies and
techniques (Data-Centric Systems and Applications). Secaucus, NJ, USA: Springer-Verlag
New York, Inc.
Buhaug, Halvard 2010. "Dude, Where's My Conflict? LSG, Relative Strength, and the Location
of Civil War." Conflict Management and Peace Science 27(2):107-128.
Cleveland, William S. 1981. “LOWESS: A program for smoothing scatterplots by robust locally
weighted regression.” The American Statistician 35, 54.
Cressie, Noel, and Christopher K. Wikle 2011. Statistics for Spatio-Temporal Data. Wiley Series
in Probability and Statistics. John Wiley & Sons, Inc., Hoboken, New Jersey.
Doran, Charles F., Robert E. Pendley, and George E. Antunes 1973. “A Test of Cross-National
Event Reliability: Global Versus Regional Data Sources.” International Studies Quarterly
17(2):175-203.
Dulic, Tomislav 2010. Geocoding Bosnian Violence: A note on methodological possibilities and
constraints in the production and analysis of geocoded event data. Paper presented at the
annual meeting of the Theory vs. Policy? Connecting Scholars and Practitioners, New
Orleans, Feb 17, 2010.
Earl, Jennifer, Andrew Martin, John D. McCarthy, and Sarah A. Soule 2004. “The Use of
21 International Interactions, forthcoming, 2012
Newspaper Data in the Study of Collective Action.” Annual Review of Sociology 30:65-80.
Eck, Kristine 2012. “In Data We Trust? A Comparison of UCDP GED and ACLED Conflict
Events Datasets.” Forthcoming in Cooperation and Conflict 47(1).
Eberwein, Wolf-Dieter, and Sven Chojnacki 2001. “Scientific necessity and political utility. A
comparison of data on violent conflicts.” Discussion Paper P01-304, Social Science
Research Center Berlin.
Galtung, Johan, and Marie H. Ruge 1965. “The Structure of Foreign News: The Presentation of
the Congo, Cuba and Cyprus Crises in Four Norwegian Newspapers.” Journal of Peace
Research 2(1):64-91.
Gleditsch, Nils Petter and Peter Wallensteen, Mikael Eriksson, Margareta Sollenberg & Håvard
Strand 2002. “Armed Conflict 1946–2001: A New Dataset”, Journal of Peace Research
39(5): 615-637.
Gleditsch, Kristian Skrede & Kyle Beardsley, 2010. “Core Issues in International Data
Collection” in Paul F. Diehl & James D. Morrow, eds, International Studies Encyclopedia,
Volume on Scientific Study of International Processes. New York.
Hazlewood, Leo A., and Gerald T. West 1974. “Bivariate Associations, Factor Structures, and
Substantive Impact: The Source Coverage Problem Revisited.” International Studies
Quarterly 18(3):317-337.
Hocke, Peter 1995. Determining the Selection Bias in Local and National Newspaper Reports on
Protest Events. Paper presented at the Workshop on Protest Event Analysis, Social Science
Research Center Berlin.
Hug, Simon, and Dominique Wisler 1998. “Correcting for Selection Bias in Social Movement
Research.” Mobilization: An International Journal 3(2):141-161.
Jackman, Robert W., and William A. Boyd 1979. “The Workshop: Multiple Sources in the
International Interactions, forthcoming, 2012
22
Collection of Data on Political Conflict.” American Journal of Political Science 23(2):343-
458.
King, Gary, and Will Lowe 2003. “An automated information extraction tool for international
conflict data with performance as good as human coders: A rare events evaluation design.”
International Organization 57:617-642.
Laver, Michael, Kenneth Benoit, and John Garry 2003. “Extracting policy positions from
political texts using words as data.” American Political Science Review 97(2):311-331.
Lebow, Richard N. 2000. “Contingency, Catalysts, and International System Change.” Political
Science Quarterly 15(4):591-616.
McClelland, Charles A. 1976. “World Event/Interaction Survey Codebook.” Ann Arbor: Inter-
University Consortium for Political and Social Research.
Melander, Erik, and Ralph Sundberg 2011. Climate Change, Environmental Stress, and Violent
Conflict - Tests introducing the UCDP Georeferenced Event Dataset. Presented at the
International Studies Association Annual Conference.
Mueller, Carol 1997. “Media Measurement Models of Protest Event Data.” Mobilization: An
International Journal 2(2):165-184.
Nardulli, Peter F., Kalev H. Leetaru, and Matthew Hayes 2011. “Event data, civil unrest and the
speed project.” Proceedings of the International Studies Association Annual Convention,
2011.
National Geospatial-Intelligence Agency (NGA) 2011. GEOnet Names Server (GNS). Document
last modified April 15, 2011. <http://earth-info.nga.mil/gns/html/index.html> (2011, April
18).
Öberg, Magnus, and Margareta Sollenberg 2011. “Gathering Conflict Information Using News
Resources.” Understanding Peace Research: Methods and Challenges, eds. Kristine
23 International Interactions, forthcoming, 2012
Hoglund and Magnus Öberg. Abingdon, New York: Routledge.
O’Loughlin, John, Frank D. W. Witmer, Andrew M. Linke, and Nancy Thorwardson 2010.
"Peering into the Fog of War: The Geography of the WikiLeaks Afghanistan War Logs,
2004–2009." Eurasian Geography and Economics 51(4):472-495.
Ortiz, David G., Daniel J. Myers, Eugene N. Walls, and Maria-Elena D. Diaz 2005. “Where Do
We Stand With Newspaper Data?” Mobilization: An International Journal 10(3):397-419.
Raleigh, Clionadh, Andrew Linke, Håvard Hegre, and Joachim Carlsen 2009. Armed Conflict
Location and Event Dataset (ACLED) Codebook 2009. Centre for the Study of Civil War,
International Peace Research Institute, Oslo (PRIO).
Raleigh, Clionadh, Andrew Linke, Håvard Hegre, and Joachim Carlsen 2010. “Introducing
ACLED: An Armed Conflict Location and Event Dataset: Special Data Feature.” Journal of
Peace Research 47(5):651-660.
Rothman, Steven B. 2007. “Understanding data quality through reliability: A comparison of data
reliability assessment in three international relations datasets.” International Studies Review
9(3):437-456.
Ruggeri, Andrea, Ismene Gizelis, and Han Dorussen 2009. If You Don't Succeed the First Time,
Try and Try Again – Event Data and Inter-Coder Reliability. Paper presented at the
International Studies Association Annual Conference Exploring the Past, Anticipating the
Future, New York, Feb 15, 2009.
Schrodt, Philip A. and Omur Yilmaz 2007. “CAMEO: Conflict and Mediation Event
Observations Codebook.” Lawrence: University of Kansas.
Schrodt, Philip A. 2008. “TABARI: Textual Analysis by Augmented Replacement Instructions,
Version 0.6.” Lawrence: University of Kansas.
Sundberg, Ralph, Mathilda Lindgren and Ausra Padskocimaite 2010. “UCDP GED Codebook
International Interactions, forthcoming, 2012
24
version 1.0-2011.” Uppsala: Department of Peace and Conflict Research, Uppsala
University.
Taylor, Charles L., and Michael C. Hudson 1972. World Handbook of Political and Social
Indicators, 2nd ed. New Haven: Yale University Press.
Thion-Goasdoué, Virginie, Sylvaine Nugier, Dominique Duquennoy, and Brigitte Laboisse 2007.
“An evaluation framework for data quality tools.” Proceedings of International Conference
for Information Quality (ICIQ) 2007:280-294.
Weidmann, Nils. B., and Michael D. Ward 2010. "Predicting Conflict in Space and Time."
Journal of Conflict Resolution 54(6):883-901.
Wiesel, John and Christian Ickler 2012. “I, Coder: Examining the Impact of Artificial Intelligence
on Event Data Coding.” Proceedings of the 53rd International Studies Association Annual
Convention, Forthcoming.
Woolley, John T. 2000. “Using Media-Based Data in Studies of Politics.” American Journal of
Political Science 44(1):156-173.
Wu, Jianguo, and Richard J. Hobbs 2007. “Key topics in landscape ecology”, Cambridge.
25 International Interactions, forthcoming, 2012
FIGURE 1 Challenges to Conflict Event Data.
FIGURE 2 EDACS, ACLED15 and UCDP-GED16 Monthly Event Counts Somalia 1997-2009 –Locally-weighted
Polynomial Regression Smoothing with a 10 percent Window (see Cleveland 1981).
International Interactions, forthcoming, 2012
26
FIGURE 3 EDACS, ACLED and UCDP-GED Monthly Event Counts Sierra Leone 1997-2003 – Locally-weighted
Polynomial Regression Smoothing with a 10 percent Window.
TABLE 1 Mean EDACS Event Buffering, Median of ACLED Geoprecision Level, Range of Event
Buffering/Geoprecision, Median UCDP-GED Geoprecision Level, and Share of Event Time Estimates for Somalia
and Sierra Leone.
Total N Mean buffer/ Median level
Range geo1 Share of buffered events in % of
total
Share of time estimated events in % of total2
EDACS Somalia (split by day)
3027 14.51
1.091
0 – 930
5 – 103
18.33 21.01
EDACS Sierra Leone (split by day)
499 63.40
1.43
1 – 220
0 – 87
48.89 41.68
ACLED Somalia
3899 1 0 – 3 50.30 4.13
ACLED Sierra Leone
1290 1 1 – 3 8.06 5.96
UCDP-GED Somalia
1829 1 1 – 6 18.86 21.43
UCDP-GED Sierra Leone
420 1 1 – 6 47.62 41.43
Notes: 1 EDACS buffer types: Geo-Location, Event-Location in km; ACLED geo-precision level: 1 – 3; UCDP-GED geo-precision level: 1 – 7; 2
EDACS time estimate and ACLED time-precision level: 1-3; UCDP-GED time-precision level: 1-5.
27 International Interactions, forthcoming, 2012
FIGURE 4 Matching events of ACLED, EDACS, and UCDP-GED: Similarity of EDACS and UCDP-GED (left),
EDACS and ACLED (middle) and UCDP-GED and ACLED (right) in Somalia, 1997 to 2009.
International Interactions, forthcoming, 2012
28
NOTES
1 This research has received financial support from the German Research Foundation (DFG).
2 This was the conclusion from a comparison of war data sets. Eberwein and Chojnacki’s key finding was that the data-gathering projects in the study showed different ‘worlds’ of violence irrespective of whether they were based on qualitative or quantitative operational criteria.
3 Many issues discussed here are relevant for media-based event datasets in general. Nevertheless, non-georeferenced event datasets such as the Conflict and Mediation Event Observations (CAMEO) of the Kansas Event Data System (KEDS) project (Schrodt and Yilmaz 2007) or the World Event/Interaction Survey (WEIS – McClelland 1978) are not the focus of this paper.
4 Other geo-referenced conflict event datasets are either not (yet) publicly available (e.g. Nardulli et al. 2011) or cover different regions or time series (e.g. Dulic 2010; O’Loughlin et al. 2010).
5 See www.conflict-data.org.
6 UCDP-GED appears to follow a similar approach by coding data from five different news wires (BBC Monitoring, Reuters News, Agence France Presse, Dow Jones International News, and Xinhua News Agency) (Eck and Hultman 2007), although no detailed documentation on how sources are searched is available. ACLED, in contrast, does not apply a standardized search but arbitrarily selects different sources for different countries and periods of observation.
7 A comparison of the datasets is limited to this time period, since ACLED is available for the years 1997-2010, UCDP-GED for 1989-2010, and EDACS for 1990-2009.
8 ACLED also comprises non-violent event types that are excluded from this comparison (see Raleigh et al. 2010).
9 EDACS collects start and end dates, since events can last for more than one day. To make our data comparable to ACLED events that have a single date only, we split events by days (see the sub-section Problems of Temporal Inaccuracy).
10 See www.conflict-data.org.
11 UCDP-GED follows a similar approach by providing three different fatality estimate categories (low, high, and best estimates) (see Sundberg et al. 2010).
12 i.e. EDACS events without buffer and estimated start date, UCDP-GED events without summary events, events lasting more than 1 day (continuous events have been split), and ACLED violent events with precision variables = 1.
13 One approach we currently follow is to contextualize actors within their spatiotemporal areas of operation. In a second step, this can help to identify, to a certain probability, generic and unspecified actors.
14 Other recently available sources and techniques that have the potential to generate event data are based on information provided by Cablegate (wikileaks.org) or crowd-sourcing and crowd-seeding approaches, such as Voix Des Kivu, conducted by staff of the Columbia University in Eastern Congo. See http://cu-csds.org/wp-content/uploads/2009/10/Voix-des-Kivus-Leaflet.pdf.
15 Only “violent” ACLED events are counted here, i.e. the event types “battle” and “violence against civilians”. The ACLED event types “headquarters or base establishment”, “non-violent rebel presence”,

29 International Interactions, forthcoming, 2012
“rioting/protesting”, and “non-violent transfer of location control” cannot be compared with EDACS data.
16 UCDP-GED event type 2 (summary events) and Events with a temporal precision 0 and 5 (summary event and year) are excluded here.