Embed Size (px)
Citation preview
Agricultural and Forest Meteorology 125 (2004) 241–258
Evapotranspiration components determined by stable isotope, sapflow and eddy covariance techniques
D.G. Williamsa,∗, W. Cableb, K. Hultineb, J.C.B. Hoedjesc, E.A. Yepezb,V. Simonneauxa, S. Er-Rakid, G. Bouleta, H.A.R. de Bruinc, A. Chehbounia,
O.K. Hartogensisc, F. Timouka
a Centre d’Etudes Spatiales de la Biosphère, Toulouse, Franceb School of Renewable Natural Resources, The University of Arizona, Tucson, USA
c Meteorology and Air Quality Group, Wageningen University and Research Center, Wageningen, The Netherlandsd Physics Department LMFE, Faculty of Sciences Semlalia, Marrakech, Morocco
Received 21 September 2003; received in revised form 2 April 2004; accepted 16 April 2004
Abstract
Understanding and modeling water exchange in arid and semiarid ecosystems is complicated by the very heterogeneousdistribution of vegetation and moisture inputs, and the difficulty of measuring and validating component fluxes at a commonscale. We combined eddy covariance (EC), sap flow, and stable isotope techniques to investigate the responses of transpirationand soil evaporation to an irrigation event in an olive (Olea europaeaL.) orchard in Marrakech, Morocco. The primary goalwas to evaluate the usefulness of stable isotope measurements of water vapor in the turbulent boundary layer for partitioningevapotranspiration under such dynamic conditions. The concentration and deuterium isotope composition (δ2H) of watervapor was collected from different heights within the ecosystem boundary layer of the olive canopy before and over severaldays following a 100 mm surface irrigation. ‘Keeling plots’ (isotope turbulent mixing relationships) were generated fromthese data to estimate the fractions of evaporation and transpiration contributing to the total evapotranspiration (ET) flux.Transpiration accounted for 100% of total ET prior to irrigation, but only 69–86% of ET during peak midday fluxes over the5-day period following irrigation. The rate of soil evaporation and plant transpiration at the stand level was calculated fromeddy covariance measurements and the evaporation and transpiration fractions from isotope measurements. Soil evaporationrate was positively correlated with daily atmospheric vapor pressure deficit (D), but transpiration was not. Component fluxesestimated from the isotope technique were then compared to those obtained from scaled sap flow measurements. Sap flowin multiple-stemmed trees increased following the irrigation, but large single-stemmed trees did not. We matched the sourcearea for eddy covariance estimates of total ET fluxes with scaled sap flow estimates developed for the different tree types. Soilevaporation was determined from the difference between total ET and the scaled sap flow. Ecosystem-level transpiration andsoil evaporation estimated by the isotope approach were within 4 and 15% of those estimated by scaled sap flow, respectively,
∗ Corresponding author. Present address: Department of Renewable Resources, University of Wyoming, Dept. 3354, 1000 E University Ave.,Laramie, WY 82071, USA. Tel.:+1 307 776 2263; fax:+1 307 766 6403.E-mail address:[email protected] (D.G. Williams).
0168-1923/$ – see front matter © 2004 Elsevier B.V. All rights reserved.doi:10.1016/j.agrformet.2004.04.008

242 D.G. Williams et al. / Agricultural and Forest Meteorology 125 (2004) 241–258
for periods of peak fluxes at midday. Our data illustrate the utility of the isotope ‘Keeling plot’ approach for partitioningET at the ecosystem scale on short time steps and the importance of accurate spatial representation of scaled sap flow forcomparison with eddy covariance measurements of ET.© 2004 Elsevier B.V. All rights reserved.
Keywords:δ2H; Keeling plot; Transpiration; Soil evaporation; Water balance; Morocco;Olea europaea
1. Introduction
Evapotranspiration (ET) is an important componentof ecosystem water balance and is strongly relatedto gross ecosystem production in terrestrial vege-tation (Law et al., 2002). The correlation betweenET and ecosystem production highlights the role ofwater as a principal limiting resource for plant pho-tosynthetic metabolism. Ecosystem productivity isespecially limited by water availability in arid andsemiarid ecosystems (Noy-Meir, 1973), which aremarked by highly variable moisture inputs in spaceand time (MacMahon and Schimpf, 1981). The fre-quently long periods of inactivity during dry periodsin these environments are punctuated by active peri-ods of water and carbon exchange following precipi-tation events. Accurate prediction of water exchangeand ecosystem carbon metabolism in these dynamicresource environments requires an understandingof the factors driving the rates and timing of soilevaporation and plant transpiration at the ecosystemscale.
The contributions of soil evaporation and plant tran-spiration to total ecosystem ET in arid and semiaridenvironments are highly variable in space and time(Sammis and Gay, 1979; Evans et al., 1981; Smithet al., 1995; Kemp et al., 1997; Reynolds et al., 2000;Hutley et al., 2001; Ferretti et al., 2003). Prediction andmodeling of evapotranspiration in these environmentsis complicated by the heterogeneous distribution ofvegetation elements that often have different func-tional properties, and the difficulty of measuring com-ponents of water exchange at meaningful and compa-rable scales. These problems are especially acute dur-ing the very dynamic period following precipitationevents when ET fluxes are highest and when soil andcanopy conductances are changing rapidly (Huxmanet al., 2004). Partitioning of the total evapotranspira-tion flux is important in these ecosystems because ofthe need to understand biotic and abiotic factors un-
derlying the efficiency with which water from pulsedinputs of rainfall is circulated through the transpira-tion pathway and thus contributes to photosyntheticgas exchange and productivity (Aguiar et al., 1996;Prince et al., 1998).
Evaporation and transpiration fluxes are sepa-rately represented in ecosystem water balance models(Paruelo and Sala, 1995; Reynolds et al., 2000), butare very difficult to measure independently at theecosystem scale. Some surface-vegetation-atmospheretransfer (SVAT) models (e.g. SiSPAT,Braud et al.,1995; Boulet et al., 2000) operate at hourly or dailytime steps, and thus are useful for investigating fluxesduring the highly dynamic period following moisturepulses and extrapolating these fluxes to landscapeand larger scales. However, ET parameterizations inSVAT models generally are validated at the ecosys-tem level using measurements of net fluxes taken ata single reference height above the vegetation (e.g.eddy covariance (EC) method). Soil evaporation andplant transpiration are often not independently veri-fied with measurements at the same scale. Recently,measurements of the stable isotope composition ofwater vapor exchanged between vegetation and at-mosphere have been used to trace the sources of ETat the ecosystem level allowing total ET fluxes tobe partitioned into their component fluxes (Moreiraet al., 1997; Harwood et al., 1999; Wang and Yakir,2000; Yepez et al., 2003). When combined with eddycovariance measurements of ecosystem ET flux, theisotope partitioning approach becomes extremelypowerful. Estimates of component fluxes from theisotope technique can be used to validate parame-terizations in SVAT models. SVAT models then canbe tested for their ability to predict how componentfluxes and processes respond to changing environ-mental conditions after pulsed inputs of moisture inarid and semiarid environments. Water vapor for iso-tope measurements is typically collected at or nearthe same height that eddy covariance measurements
D.G. Williams et al. / Agricultural and Forest Meteorology 125 (2004) 241–258 243
are made, but source area dimensions for the con-centration measurements are larger than that for thefluxes (Schmid, 1994). Consequently, care should betaken when relating the eddy covariance and isotopetechniques.
Evaporation from soil and transpiration from plantseach contribute unique isotopic signals to water va-por within the ecosystem boundary layer. Water evap-orated from the soil is depleted in the heavy isotopes(2H, 18O) compared to liquid water at the evapo-rating surface of the soil as a result of kinetic andequilibrium fractionations (Craig and Gordon, 1965;Allison et al., 1983). Although the water in leavesis enriched in the heavy isotopes during transpirationbecause of these same fractionations, at steady-statethe water transpired from leaf surfaces is isotopicallysimilar to that taken up by the plant’s roots (Flanaganet al., 1991; Wang and Yakir, 1995). Since fractiona-tion generally does not occur during uptake of waterby roots (Dawson and Ehleringer, 1991; Thornburnet al., 1993), the isotopic composition of vapor derivedfrom soil evaporation and plant transpiration is verydifferent and easily distinguished.
Isotope ratios of the water vapor present in theplanetary boundary layer (δpbl), within the turbulentlymixed ecosystem boundary layer (δebl), and that com-ing from evapotranspiration sources (δET) can be rep-resented by a mass balance mixing equation:
δebl = Cpbl(δpbl − δET)
(1
Cebl
)+ δET (1)
whereCpbl and Cebl are the water vapor concentra-tions. This ‘Keeling-type’ relationship (Keeling, 1958;Yakir and Sternberg, 2000) is linear with a slope ofCpbl(δpbl–δET) and an intercept (δET) that representsthe net isotopic contribution from the ET flux. Mea-surements of the concentration and isotopic composi-tion of water vapor collected at different heights withinthe ecosystem boundary layer will provide data to fitthe linear model. The fractional contribution of tran-spiration to the total ET fluxes (FT) can be calculatedfrom:
FT = δET − δE
δT − δE(2)
whereδE andδT are the isotopic compositions of soilevaporation and plant transpiration. Values forδE and
δT can be estimated from field sampling and modeling(Yakir and Sternberg, 2000).
Soil evaporation should comprise a significantfraction of the ET flux following input of water insemiarid and arid ecosystems (Paruelo and Sala,1995). Soil evaporation rates initially are high fol-lowing the wetting event, but decline rapidly as thesoil surface dries (Ritchie, 1972). Transpiration mayor may not change following inputs of water, de-pending on the rooting distribution of the dominantplants and response of leaf stomata to a change insoil water availability. The isotope technique recentlywas shown to be useful for partitioning ET within asemiarid ecosystem dominated by woody plants in theoverstory and grasses in the understory (Yepez et al.,2003). However, the Keeling plot approach has notbeen employed to examine the short-term dynamicsof evaporation and transpiration following a wettingevent.
Sap flux techniques also are useful for partition-ing total ET fluxes when combined with eddy covari-ance measurements (Hutley et al., 2001, Mackay et al.,2002), but scaling to the ecosystem level can be com-plicated by spatially and functionally heterogeneousvegetation (Schaeffer et al., 2000). Unique responsesby different species or individuals to a wetting eventand the poor representation of this variation within thefootprint of the eddy covariance measurement can leadto significant error in partitioning estimates from sapflux. Scaling ecosystem-level transpiration from sapflux to the footprint of eddy covariance measurementspresents unique challenges.
Here, we compare estimates of ET partitioningfrom eddy covariance and sap flux to that derivedfrom stable isotope measurements of water vapor.These comparisons were made over several daysfollowing a large surface irrigation in an olive or-chard in Marrakech, Morocco. Our goals were to:(1) test the utility of the Keeling plot method forpartitioning ET fluxes over a dynamic wetting cy-cle in a semiarid environment; and (2) evaluate theconsequences of plant functional heterogeneity forscaling sap flux to the ecosystem level. The studywas part of a larger effort (project SUD-MED;http://www.cesbio.ups-tlse.fr/cadrerech.htm) to char-acterize the water and energy balance and hydro-logical resources in the Tensift region in southernMorocco.
244 D.G. Williams et al. / Agricultural and Forest Meteorology 125 (2004) 241–258
2. Materials and methods
2.1. Site description
We conducted our study in the 275 ha Agdal olive(Olea europaeaL.) orchard on the southern endof the ancient walled city of Marrakech, Morocco.Marrakech has a semiarid Meditterranean climate;76% of the 253 mm average annual precipitationfalls during winter and spring (November–April).Very little precipitation falls between May and Oc-tober. Our study was conducted between October27 and November 11 (DOY 300–315), 2002. Nosignificant rainfall had been recorded at our studysite for at least 100 days prior to initiation of ourmeasurements.
The density of olive trees was∼400 ha−1 in thesoutheastern portion of the Agdal orchard where ourstudy was conducted. Many of the trees at our studylocation were quite old, having been coppiced atleast four times. Others had been recently planted inspaces where older trees had died. Thus, tree crownstructure was somewhat variable across the studyarea; large, multi- and single-stemmed trees were in-terspersed with smaller and younger single-stemmedtrees.
The Agdal olive orchard is periodically surface-irrigated by diverting flow from a large impoundmentthrough a network of ditches. Water is diverted man-ually to every tree by manipulation of small earthencheck dams. The∼45 m2 ground surface occupiedby each tree is bordered by a small∼30 cm highearthen levy that retains the irrigation water, allow-ing precise application of irrigation water to everytree.
All understory plants were cleared from thestudy area by tilling prior to the start of mea-surements. Eddy covariance, micrometeorological,soil temperature, and sap flux measurements werecontinuously recorded over the 10-day study pe-riod. Isotope sampling took place on four dates;once prior to the large irrigation event, and threetimes following irrigation. Irrigation was appliedon November 3 (DOY 307) to the section ofthe orchard containing our instrumentation. Irri-gation completely wetted the entire soil surfaceof this 3 ha section with approximately 100 mmwater.
2.2. Eddy covariance and micrometeorologicalmeasurements
Two 9.2 m tall instrument towers were erected inSeptember 2002 in the Agdal orchard. One tower(south tower) was placed in the southeastern por-tion of the orchard near the center of the sectionthat was irrigated on DOY 307. The second tower(north tower) was placed in the north-central portionof the orchard 3 km north of the first tower in anarea that did not receive irrigation during the studyperiod. Near-continuous measurements of water va-por, carbon dioxide, and sensible heat fluxes wererecorded on each tower at 8.8 m height 2 m abovethe top of the olive canopy. A 3D sonic anemometer(CSAT3, Campbell Scientific, Logan, UT) on eachtower measured the fluctuations in the wind velocitycomponents and temperature. An open-path infraredgas analyzer (LI7500, LiCor, Lincoln, NE) measuredconcentrations of water vapor and carbon dioxide.The calm, prevailing winds were from the northeastto northwest during daytime periods of our study,providing a large and homogeneous fetch.
The wind speed and concentration measurementswere made at 20 Hz on CR23X dataloggers (Camp-bell Scientific, Logan, UT) and on-site portable com-puters to enable the storage of large raw data files.Fluxes were later calculated off-line after performingcoordinate rotations, correcting the sonic temperaturefor the lateral velocity and the presence of humidity,making frequency response corrections for slow ap-paratus and path length integration, and the inclusionof the mean vertical velocity according toWebb et al.(1980). Data from the eddy covariance system wasprocessed using the software “ec-pack” developed bythe Meteorology and Air Quality Group, WageningenUniversity. The software is available for download athttp://www.met.wau.nl/.
Air temperature and humidity were measured at 8.8and 3.7 m heights on the towers with Vaisala HMP45Cprobes. Total shortwave irradiance (St) was measuredat 9.2 m height with a BF2 Delta T radiometer. Netradiation was measured with a Kipp and Zonen CNR1net radiometer placed over the olive canopy at 8 mheight. Soil temperature was recorded at 5 cm depthat two locations approximately 30 m from the towers.Three heat flux plates continuously monitored changesin soil heat storage at each of the two tower sites.

D.G. Williams et al. / Agricultural and Forest Meteorology 125 (2004) 241–258 245
2.3. Sap flow measurements
We used a modified heat-pulse velocity technique(heat ratio method, HRM) to measure xylem sap fluxon eight olive trees at the south tower (irrigation) site.The HRM employs temperature probes inserted intothe active xylem at equal distances up- and down-stream from a pulsed heat source. The difference inheat carried up- and downstream is proportional to themagnitude of sap flux (Burgess et al., 2001; Hultineet al., 2003). This technique was employed becauseof its precision at low sap velocities and because theheat-pulse velocity methods have been shown to berobust for olive (Fernández et al., 2001). Low tran-spiration rates were anticipated in the water-limitedolives late in the dry season, before the irrigation in-put.
Sap flux sensors were installed on four largesingle-stemmed and four large multi-stemmed treesadjacent to the flux tower. Initial surveys revealedan aggregated, non-random distribution of these treetypes within the potential flux source area of thetower. We did not measure sap flux in the young,single-stemmed trees that were sparsely scatteredthrough the stand, but assumed that these treeswould have similar sap flux rates and irrigation re-sponses to the coppiced, multi-stemmed trees. Twosensors were installed on each of the eight trees.The HRM measurements were conducted everyhalf-hour spanning DOY 303–313 using a datalog-ger control and measurement system (Hultine et al.,2003).
After correcting for wounding effect (Burgesset al., 2001), heat-pulse velocity was converted tosap velocity according toBarrett et al. (1995)using1200 J kg−1 ◦C−1 for the specific heat of dry wood,4182 J kg−1 ◦C−1 for the specific heat of xylem sap(assumed to equal that of water at 20◦C) and 1.0×10³ kg m−3 for the density of sap (assumed to equalthat of water). Wood density and moisture contentwere measured on 12 cores from single-stemmedtrees and 12 cores from multi-stemmed trees. Wevalidated zero flow in situ at the end of the 10-daymeasurement period by drilling 2 cm diameter holes∼10 cm up- and downstream from the probe to com-pletely interrupt flow in the vicinity of the sensors.The holes were then sealed with silicon to preventdesiccation during the zeroing measurements. Spac-
ing error between probes was calculated according toBurgess et al. (1998).
Volumetric sap flow (L h−1) was calculated fromsap velocity with measurements of the active sap-wood area of trees fitted with HRM probes. Sapwoodarea was calculated first by subtracting the bark thick-ness from the total radius of the stem. The heartwooddepth, visually identified by its dark color on coresamples, was used to calculate heartwood area. Thiswas then subtracted from total wood area to estimatesapwood area for each tree. The sapwood area wasthen divided into concentric bands coinciding with thedepth into the sapwood of each thermocouple junc-tion within the probes (10, 20, and 30 mm). A lin-ear decay function was used to estimate sap velocitywithin the active xylem at depths beyond the insertionof the probe. Thus, estimates of sap flow were ad-justed by the percent of conducting sapwood of eachband.
Scaling of sap flow to the eddy covariance sourcearea was facilitated with a detailed survey of averageper tree sapwood area for the three tree classes inthe stand. Thirty single-stemmed, 16 multi-stemmedand 10 young trees were randomly selected fromwithin a 200 m× 200 m plot using the tower as thecenter position. Each stem was measured for diam-eter at 1 m above ground surface, bark thickness,sapwood depth, and per cent damage to the stem.These data were used to estimate sapwood area us-ing the above procedure. Additionally, every tree(965 total) within the 200 m× 200 m plot was as-signed to one of the three tree classes. A portionof the plot extended beyond the northern boundaryof the section irrigated on DOY 307. Trees that fellwithin this non-irrigated section were noted. Vol-umetric sap flow was scaled to transpiration on aground area basis (mm h−1 or mm d−1) from mea-surements of the average ground area domain (41.9to 46.0 m2 per tree) occupied by each tree typewithin the potential eddy covariance flux sourcearea.
2.4. Evapotranspiration partitioning from sap flowand eddy covariance
We assumed that differences between the totalecosystem evapotranspiration estimated by eddy co-variance and ecosystem transpiration estimated from

246 D.G. Williams et al. / Agricultural and Forest Meteorology 125 (2004) 241–258
scaled sap flow before irrigation were due to error insap flow scaling. Since soil evaporation during thispre-irrigation period was negligible (the soil was dryto 30 cm depth prior to irrigation), the ET flux mea-sured by EC was used to calibrate the scaled sap flowmeasurements for estimating stand transpiration. Af-ter calibrating the scaled sap flow estimates of transpi-ration to the EC measurements for this pre-irrigationperiod, differences between scaled sap flow and ETfrom eddy covariance after irrigation were presumedto reflect the contribution of soil evaporation. To com-pare sapflow estimates of transpiration on a per treebasis (as described inSection 2.3) to the evapotran-spiration estimates from EC, we calculated the ECflux footprint (i.e. the relative contribution of eachunit element of the upwind surface area to the mea-sured vertical flux). Also, to ensure that we scaled sapflux to the corresponding flux source area measuredby the EC system, we spatialized the tree distributionaccording to the above mentioned tree-classificationwithin the EC source area.
The EC flux source area for each interval was cal-culated using the analytical footprint model proposedby Horst and Weil (1992, 1994). The flux footprintf,or the contribution per unit surface flux of each unitelement of the upwind surface area to a measured ver-tical flux, is related to the vertical flux measured atheightzm, F(x, y, z = zm), and to the spatial distribu-tion of surface fluxes,F(x, y, z = 0) ≡ F0(x, y), i.e.
F(x, y, zm) =∫ ∞
−∞
∫ x
−∞F0(x
′, y′)f(x − x′, y
− y′, zm) dx′ dy′ (3)
(Horst and Weil, 1992). The source area arises from theintegration of the footprint function. In this study wecalculated the crosswind-integrated footprint functionusing the model ofHorst and Weil (1994):
f y(x, zm) ∼= dz
dx
zm
z2
u(zm)
u(cz)Ae−(zm/bz)r (4)
wherez is the mean plume height for diffusion from asurface source andu(z) the mean wind speed profile.The variablesA, b andc are gamma functions of shapeparameterr. We have assumed thatU(x) = u(cz), andthat the violation of the Monin–Obukhov similaritytheory is small (Horst, 1999; Meijninger et al., 2002).
In order to spatialize the surface contributions toevapotranspiration, the trees within the 200 m× 200 m
plot surrounding the eddy-covariance tower (965 treesin total) were georeferenced using a high resolutionsatellite image of the orchard, and every tree was as-signed to one of the three tree classes. A detailedland-cover layer was thus obtained. Overlaying thislayer with the calculated EC flux source area (i.e.overlaying the land cover layer with a “ponderationfield” for surface contributions) allowed us to obtainthe relative contributions for each of the tree classes(either single-stemmed, multi-stemmed, young tree ormissing tree; irrigated or non-irrigated) for each in-terval. Combining these relative contributions and thesap flow estimated transpiration of each tree-type, thetotal footprint-integrated transpiration within the ECflux source area was calculated.
2.5. Isotope sampling
Water vapor was collected on four dates (DOY 303,308, 310, and 313) at the south (irrigated) site withan automated cryogenic trapping system (Yepez et al.,2003). Water vapor was collected from five heightswithin the ecosystem boundary layer (8.9, 6.4, 3.7,1.2 and 0.1 m above ground surface) by drawing airthrough low-absorption tubing attached to the eddy co-variance tower. Air was pumped through a network ofsolenoid switching valves that every 90 s routed the airfrom each height through a hygrometer (OEM-2010,Yankee Environmental Systems, MA, USA) to recorddew point temperature. From each height, air con-tinuously circulated through glass vapor traps (mod-ified from Helliker et al., 2002) immersed in an al-cohol bath. The alcohol was kept at−80 ◦C by pe-riodically adding liquid nitrogen. Samples from thefive heights were collected during three 30 min peri-ods between 10:00 and 12:30 h and between 14:00 and16:30 h on each sampling day (30 samples total oneach day). Sample traps were removed from the alco-hol after 30 min of continuous trapping and then sealedwith a rubber stopper and Parafilm. Water was quan-titatively transferred from the vapor traps within 48 hafter collection to flame-sealed 6 mL diameter Pyrextubes by cryogenic vacuum distillation (Ehleringer andOsmond, 1989).
Plant and soil samples were collected at midday(13:00–14:00 h) on all sampling days to estimate theδ2H value of soil evaporation (δE) and plant transpi-ration (δT). It was assumed that transpiration of olive
D.G. Williams et al. / Agricultural and Forest Meteorology 125 (2004) 241–258 247
trees was at isotopic steady-state, such that theδ2Hvalue of non-evaporated twig xylem water would berepresentative of that of transpiration vapor duringthe sample collection periods (Yakir and Sternberg,2000). Soil and olive twig samples (n = 4–6 per sam-ple day) were collected near the south tower. Soil sam-ples were collected from 20 to 30 cm depth (the shal-lowest moist soil layer) on DOY 303 prior to irriga-tion and from the moist soil surface (0–2 cm depth) onsampling days after irrigation. Twig and soil sampleswere placed into screw-cap glass vials, sealed withParafilm, and extracted by cryogenic vacuum distilla-tion into flame-sealed Pyrex tubes within a few daysof collection. A single sample of the irrigation waterwas collected on DOY 307.
2.6. δ2H analysis
δ2H analysis was performed at the Universityof Arizona Laboratory of Isotope Geochemistry ona dual-inlet stable isotope ratio mass spectrometer(Delta S, Finnigan MAT, San Jose, CA, USA), ex-cept for vapor samples collected on DOY 313. Small(3�L) water subsamples were injected into a reac-tion furnace (HDevice, Finnigan MAT, San Jose, CA,USA) in the presence of chromium at 1025◦C to pro-duce diatomic hydrogen (Nelson and Dettman, 2001).The hydrogen was transferred on-line into the samplebellows on the mass spectrometer for analysis. Thestandard deviation for repeated analysis of calibratedworking standards with this method was 0.8‰. Vaporsamples from DOY 313 were analyzed by pyrolysiswith a continuous flow method on a Finnigan MATDeltaplus stable isotope mass spectrometer (San Jose,CA, USA) coupled with a thermal combustion ele-mental analyzer (Finnigan MAT TC-EA, San Jose,CA, USA) that combusted samples at 1380◦C. Sam-ples then flowed at 40◦C and 50 ml min−1 from a GCcolumn packed with 5 Å molecular sieve to the massspectrometer. The repeated measurements of knownstandards had a standard deviation forδ2H of 2‰. Allδ2H values are reported relative to V-SMOW.
2.7. Evapotranspiration partitioning from isotopes
Theδ2H value of the ET flux (δET; Eq. (2)) was es-timated from they-axis intercept of the linear regres-
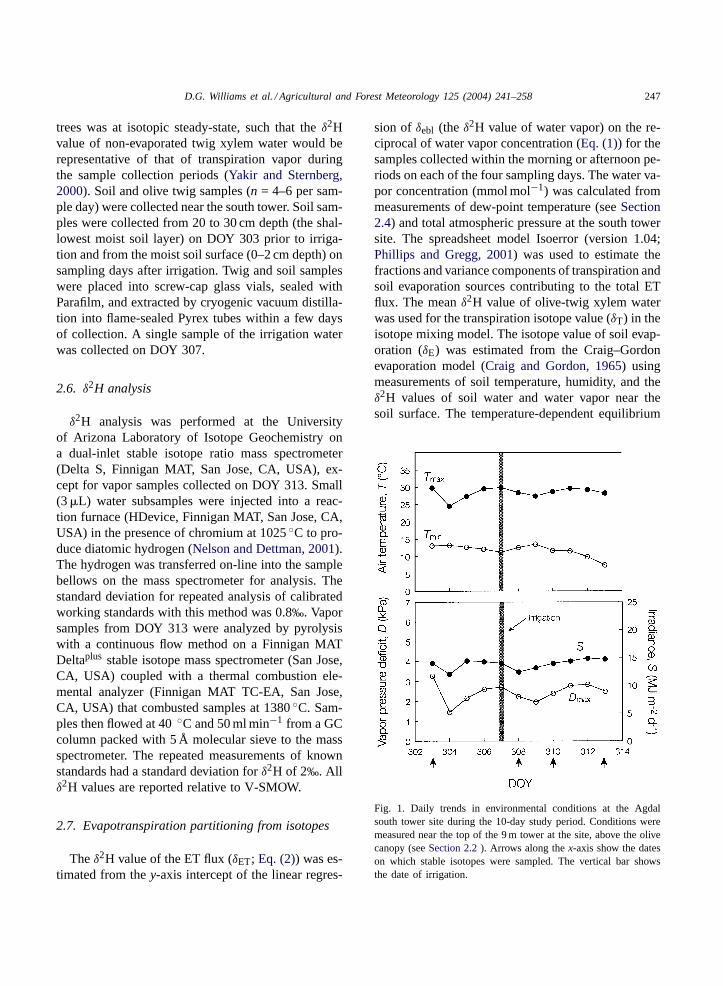
sion of δebl (the δ2H value of water vapor) on the re-ciprocal of water vapor concentration (Eq. (1)) for thesamples collected within the morning or afternoon pe-riods on each of the four sampling days. The water va-por concentration (mmol mol−1) was calculated frommeasurements of dew-point temperature (seeSection2.4) and total atmospheric pressure at the south towersite. The spreadsheet model Isoerror (version 1.04;Phillips and Gregg, 2001) was used to estimate thefractions and variance components of transpiration andsoil evaporation sources contributing to the total ETflux. The meanδ2H value of olive-twig xylem waterwas used for the transpiration isotope value (δT) in theisotope mixing model. The isotope value of soil evap-oration (δE) was estimated from the Craig–Gordonevaporation model (Craig and Gordon, 1965) usingmeasurements of soil temperature, humidity, and theδ2H values of soil water and water vapor near thesoil surface. The temperature-dependent equilibrium
Fig. 1. Daily trends in environmental conditions at the Agdalsouth tower site during the 10-day study period. Conditions weremeasured near the top of the 9 m tower at the site, above the olivecanopy (seeSection 2.2). Arrows along thex-axis show the dateson which stable isotopes were sampled. The vertical bar showsthe date of irrigation.

248 D.G. Williams et al. / Agricultural and Forest Meteorology 125 (2004) 241–258
fractionation factor for the liquid-vapor phase changewas calculated fromMajoube (1971). The kinetic frac-tionation was assumed to be high (26‰) for the pe-riod prior to irrigation (diffusive transport through drysoil), and low (13‰) after irrigation (turbulent trans-port from wet soil surface) (Merlivat, 1978).
3. Results and discussion
Accurate measurement of the component fluxesof ET on a scale useful for integration with eddycovariance and remote sensing is necessary for thedevelopment and validation of modeling and obser-vation tools that can be used to monitor and predictthe dynamic responses of water-limited ecosystems torainfall variability. Our study took place over a10-day period at the end of the dry season in anolive orchard in southern Morocco. Meteorological
Fig. 2. Example of diurnal trends in environmental conditions on 2 days during the study. Horizontal bars abovex-axis show the timeintervals during which atmospheric water vapor was collected for stable isotope analysis.
conditions were fairly stable over the study period;air temperature, solar radiation, and vapor pressuredeficit were high, especially after irrigation, providingoptimal conditions for flux and stable isotope mea-surements (Fig. 1). Vapor pressure deficit increasedover the last several measurement periods providingan opportunity to investigate responses of vegetationand soil components to variable ET demand by theatmosphere. Isotope sampling took place under calm,cloudless conditions. However, afternoon sampling(14:30–16:30 h) took place under changing conditionsas solar irradiance and air temperature declined at theend of the solar period (Fig. 2).
3.1. Evapotranspiration estimated by eddycovariance
Sap flow and isotope measurements were carriedout within the potential flux source area measured byan eddy covariance system installed on a 9.2 m tower
D.G. Williams et al. / Agricultural and Forest Meteorology 125 (2004) 241–258 249
in the southern portion of the Agdal olive orchard.The validity of eddy covariance measurements at thissite was tested by evaluating how well the availableenergy (i.e. net radiation,Rn, minus ground heat flux,G) was balanced by the sum of the turbulent fluxes(i.e. the sum of the latent,�E, and sensible,H, heatfluxes). Closure of the energy balance (Rn − G = �E+ H) depends on the validity of the eddy covariancemeasurements and the ability to quantify the avail-able energy within the flux source area. The closureof the energy balance was acceptable (slope = 0.74,r2 = 0.94) for this site over the 10-day measurementperiod (Fig. 3). Energy storage within the olive treebiomass and in the air column beneath theRn mea-surement are not included in this simple analysis. En-ergy storage within the biomass may account for asmuch as 10% of the available energy in such ecosys-tems (Scott et al., 2003). Soil heat flux plates used toestimateG were concentrated in a shaded area on thenorth side of a large olive tree at the south tower site.We are not confident that this location accurately rep-resentedG for the flux source area across the orchardas many locations were exposed to higher direct solarradiation than the area chosen for soil heat flux mea-surements. Such exposed locations likely experiencemuch higher positiveG during the day and higher neg-ative G during the night compared to that in shadylocations. These differences easily could account for
Fig. 3. Energy balance closure for the Agdal south tower site.Data are paired 30 min averages collected before the irrigation onDOY 303-306 (�) and after irrigation on DOY 308-313 (�). The1:1 line is provided as is the regression equation and coefficientof determination for the best-fit line through the data.
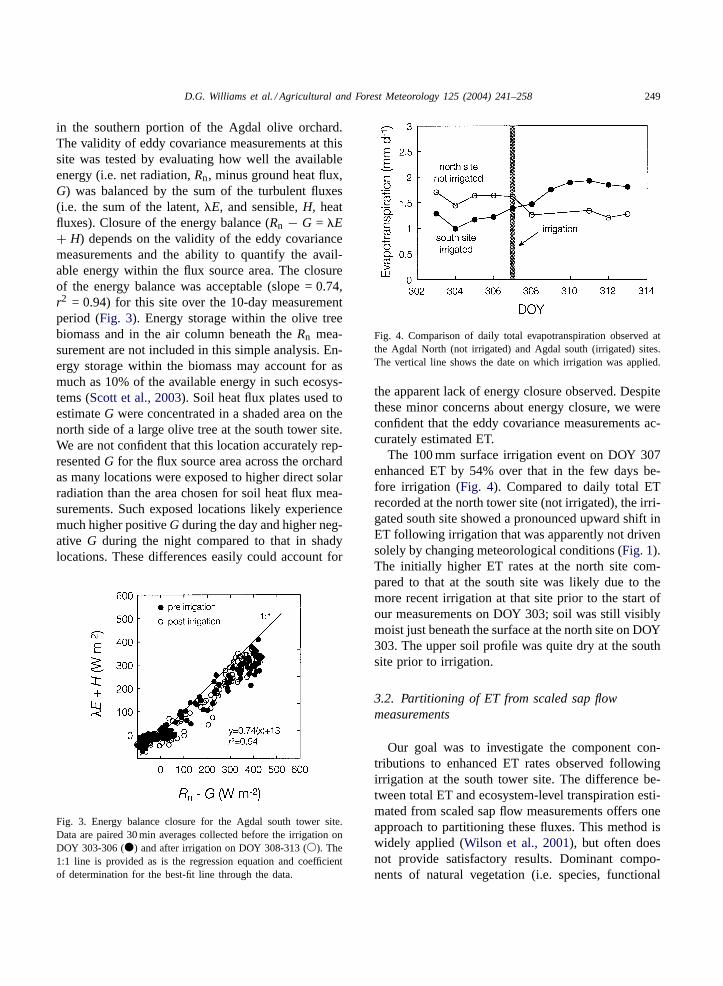
Fig. 4. Comparison of daily total evapotranspiration observed atthe Agdal North (not irrigated) and Agdal south (irrigated) sites.The vertical line shows the date on which irrigation was applied.
the apparent lack of energy closure observed. Despitethese minor concerns about energy closure, we wereconfident that the eddy covariance measurements ac-curately estimated ET.
The 100 mm surface irrigation event on DOY 307enhanced ET by 54% over that in the few days be-fore irrigation (Fig. 4). Compared to daily total ETrecorded at the north tower site (not irrigated), the irri-gated south site showed a pronounced upward shift inET following irrigation that was apparently not drivensolely by changing meteorological conditions (Fig. 1).The initially higher ET rates at the north site com-pared to that at the south site was likely due to themore recent irrigation at that site prior to the start ofour measurements on DOY 303; soil was still visiblymoist just beneath the surface at the north site on DOY303. The upper soil profile was quite dry at the southsite prior to irrigation.
3.2. Partitioning of ET from scaled sap flowmeasurements
Our goal was to investigate the component con-tributions to enhanced ET rates observed followingirrigation at the south tower site. The difference be-tween total ET and ecosystem-level transpiration esti-mated from scaled sap flow measurements offers oneapproach to partitioning these fluxes. This method iswidely applied (Wilson et al., 2001), but often doesnot provide satisfactory results. Dominant compo-nents of natural vegetation (i.e. species, functional

250 D.G. Williams et al. / Agricultural and Forest Meteorology 125 (2004) 241–258
Fig. 5. Average daily sap flow per tree for the three tree classes atthe Agdal south tower site. Values were calculated from average sapvelocity recorded by the HRM sensors and the average sapwoodarea measured on a subset of trees at the site. Sap velocity measuredfor multiple stemmed trees was used to estimate sap flow in theyoung single-stemmed trees. The vertical line shows the date onwhich irrigation was applied.
types) are heterogeneously distributed within ecosys-tems and among landscape units and often haveunique responses to wetting events (Williams andEhleringer, 2000). To be successful, partitioning ofET fluxes from scaled sap flow must account for thisheterogeneity through distributed sampling. The fluxsource area measured by eddy covariance can changerapidly depending on wind speed and direction andcan frustrate attempts to match scaled sap flow toeddy covariance measurements. This is arguably lessof a problem in a tree orchard where cultivation hasled to a structurally and functionally homogenousvegetation cover. However, sap flow in the multi- andsingle-stemmed olive trees in this study respondedvery differently to irrigation (Fig. 5). Average dailysap flow in the large single-stemmed trees increasedonly slightly (17%; from 49.5 to 53.8 L d−1) fol-lowing the irrigation, whereas the average sap flowof multi-stemmed trees increased by 86% (21.8 to40.4 L d−1). Multi-stemmed trees occur on less favor-able micro-sites within the orchard and experiencegreater levels of water stress, and thus respond moreto the periodic irrigations. In fact, these trees werecoppiced because they were less productive.
We modeled the source flux area measured fromthe tower and used this to scale tree sap flowto the ecosystem level based on a geographically
referenced classification of the olive tree types(Fig. 6). Sap flux measurements were not made onthe young single-stemmed trees because they rep-resented only 9.4% of all trees in the stand. Thelarge single-stemmed trees accounted for 77.3% andmulti-stemmed trees accounted for 13.3% of trees inthe stand. For the purposes of scaling transpirationto the stand level, we assumed that sap flux in theyoung single-stemmed trees was the same as that inmulti-stemmed trees. Although we anticipated in oursap flow sampling design that prevailing winds andthe flux source area would include a large cluster ofmulti-stemmed trees situated to the west-northwest ofthe eddy covariance tower (Fig. 6), the winds werepredominantly from the northeast over the study pe-riod where very few multi-stemmed trees were found.By super-imposing the calculated flux footprint overa geographically referenced tree classification, wedetermined that on average only 1.8% of the fluxsource area during daytime periods was occupiedby multi-stemmed trees. Large single-stemmed treesoccupied 88.7% of the flux source area, and themuch smaller young single-stemmed trees occupied7.3% of the flux source area. Since whole-tree sapflow was low in the young single-stemmed trees(Fig. 5), their contribution to stand transpirationwas minimal. Simple scaling of sap flow from theabsolute proportions of each tree type from the ini-tial surveys would have led to considerable error inpartitioning estimates. Accounting for spatial andfunctional heterogeneity in tree sap flow, especiallywhen integrating with eddy flux measurements isclearly important, even in relatively homogeneous treeorchards.
We assumed that differences between sap flowscaled to the eddy covariance footprint and the eddycovariance estimates of ET would reflect the contri-bution of soil evaporation. This difference should benegligible when the soil surface is dry, as was the caseprior to irrigation (DOYs 303–306) at the south towersite. However, our scaled sap flow tended to underes-timate ET during this period by about 24% (Fig. 7).This error is likely due to either: (1) underestimationof wounding damage (Swanson and Whitfield, 1981);(2) a failure to capture sap flux in the most activeregion of the xylem that is generally located near thecambium (Swanson, 1994); or (3) underestimation ofsap flux at depths beyond which our sensors were
D.G. Williams et al. / Agricultural and Forest Meteorology 125 (2004) 241–258 251
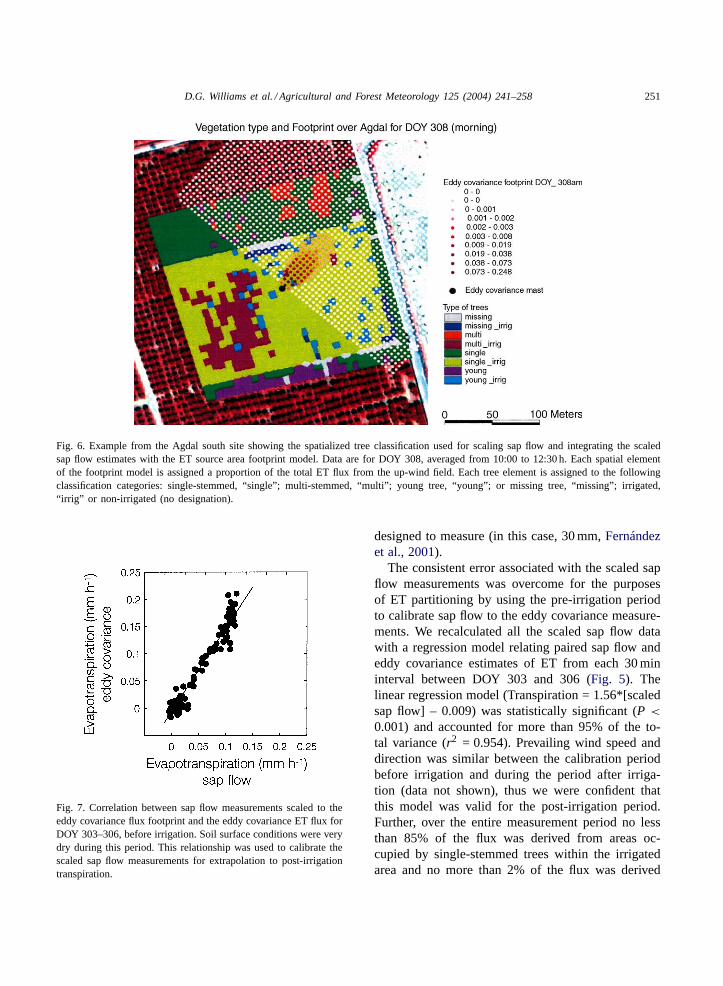
Fig. 6. Example from the Agdal south site showing the spatialized tree classification used for scaling sap flow and integrating the scaledsap flow estimates with the ET source area footprint model. Data are for DOY 308, averaged from 10:00 to 12:30 h. Each spatial elementof the footprint model is assigned a proportion of the total ET flux from the up-wind field. Each tree element is assigned to the followingclassification categories: single-stemmed, “single”; multi-stemmed, “multi”; young tree, “young”; or missing tree, “missing”; irrigated,“irrig” or non-irrigated (no designation).
Fig. 7. Correlation between sap flow measurements scaled to theeddy covariance flux footprint and the eddy covariance ET flux forDOY 303–306, before irrigation. Soil surface conditions were verydry during this period. This relationship was used to calibrate thescaled sap flow measurements for extrapolation to post-irrigationtranspiration.
designed to measure (in this case, 30 mm,Fernándezet al., 2001).
The consistent error associated with the scaled sapflow measurements was overcome for the purposesof ET partitioning by using the pre-irrigation periodto calibrate sap flow to the eddy covariance measure-ments. We recalculated all the scaled sap flow datawith a regression model relating paired sap flow andeddy covariance estimates of ET from each 30 mininterval between DOY 303 and 306 (Fig. 5). Thelinear regression model (Transpiration = 1.56*[scaledsap flow] – 0.009) was statistically significant (P <
0.001) and accounted for more than 95% of the to-tal variance (r2 = 0.954). Prevailing wind speed anddirection was similar between the calibration periodbefore irrigation and during the period after irriga-tion (data not shown), thus we were confident thatthis model was valid for the post-irrigation period.Further, over the entire measurement period no lessthan 85% of the flux was derived from areas oc-cupied by single-stemmed trees within the irrigatedarea and no more than 2% of the flux was derived
252 D.G. Williams et al. / Agricultural and Forest Meteorology 125 (2004) 241–258
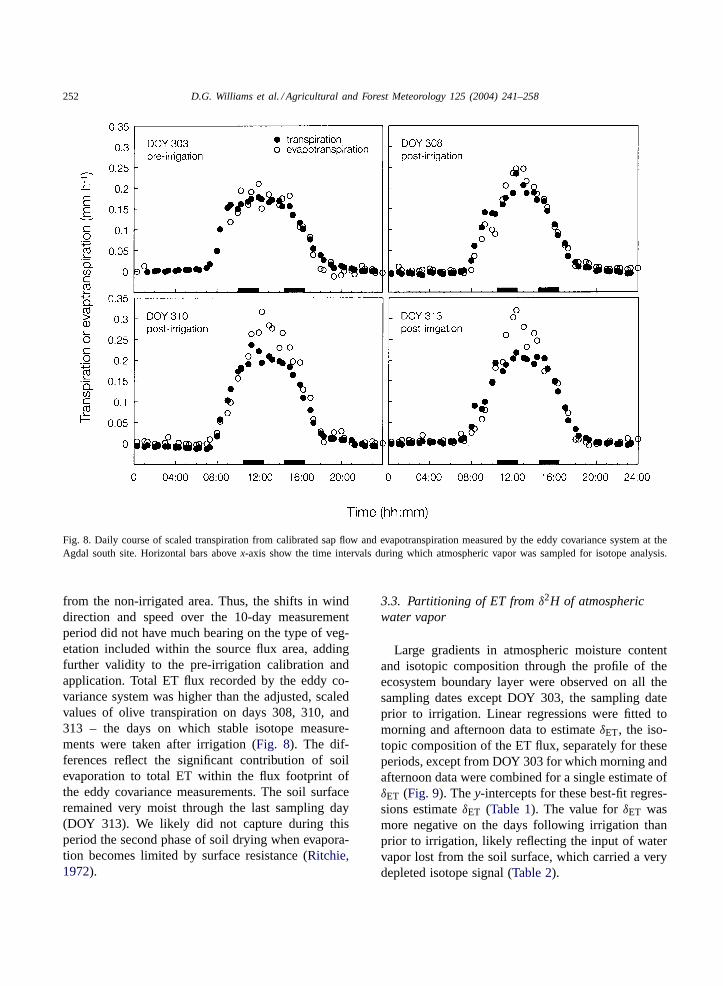
Fig. 8. Daily course of scaled transpiration from calibrated sap flow and evapotranspiration measured by the eddy covariance system at theAgdal south site. Horizontal bars abovex-axis show the time intervals during which atmospheric vapor was sampled for isotope analysis.
from the non-irrigated area. Thus, the shifts in winddirection and speed over the 10-day measurementperiod did not have much bearing on the type of veg-etation included within the source flux area, addingfurther validity to the pre-irrigation calibration andapplication. Total ET flux recorded by the eddy co-variance system was higher than the adjusted, scaledvalues of olive transpiration on days 308, 310, and313 – the days on which stable isotope measure-ments were taken after irrigation (Fig. 8). The dif-ferences reflect the significant contribution of soilevaporation to total ET within the flux footprint ofthe eddy covariance measurements. The soil surfaceremained very moist through the last sampling day(DOY 313). We likely did not capture during thisperiod the second phase of soil drying when evapora-tion becomes limited by surface resistance (Ritchie,1972).
3.3. Partitioning of ET fromδ2H of atmosphericwater vapor
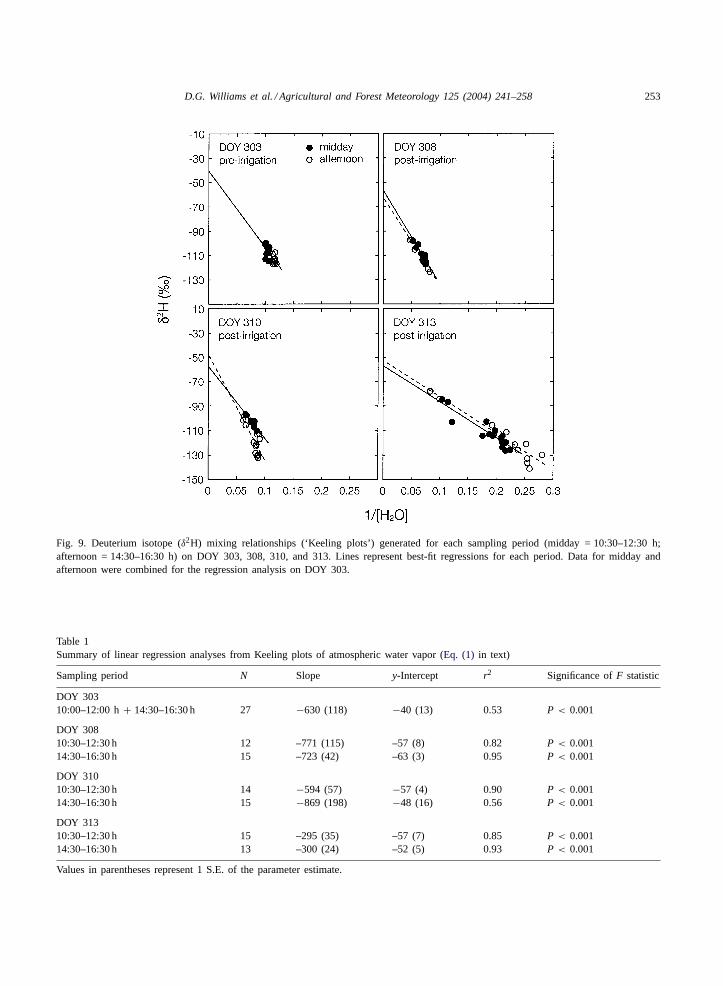
Large gradients in atmospheric moisture contentand isotopic composition through the profile of theecosystem boundary layer were observed on all thesampling dates except DOY 303, the sampling dateprior to irrigation. Linear regressions were fitted tomorning and afternoon data to estimateδET, the iso-topic composition of the ET flux, separately for theseperiods, except from DOY 303 for which morning andafternoon data were combined for a single estimate ofδET (Fig. 9). They-intercepts for these best-fit regres-sions estimateδET (Table 1). The value forδET wasmore negative on the days following irrigation thanprior to irrigation, likely reflecting the input of watervapor lost from the soil surface, which carried a verydepleted isotope signal (Table 2).
D.G. Williams et al. / Agricultural and Forest Meteorology 125 (2004) 241–258 253
Fig. 9. Deuterium isotope (δ2H) mixing relationships (‘Keeling plots’) generated for each sampling period (midday = 10:30–12:30 h;afternoon = 14:30–16:30 h) on DOY 303, 308, 310, and 313. Lines represent best-fit regressions for each period. Data for midday andafternoon were combined for the regression analysis on DOY 303.
Table 1Summary of linear regression analyses from Keeling plots of atmospheric water vapor (Eq. (1) in text)
Sampling period N Slope y-Intercept r2 Significance ofF statistic
DOY 30310:00–12:00 h+ 14:30–16:30 h 27 −630 (118) −40 (13) 0.53 P < 0.001
DOY 30810:30–12:30 h 12 –771 (115) –57 (8) 0.82 P < 0.00114:30–16:30 h 15 –723 (42) –63 (3) 0.95 P < 0.001
DOY 31010:30–12:30 h 14 −594 (57) −57 (4) 0.90 P < 0.00114:30–16:30 h 15 −869 (198) −48 (16) 0.56 P < 0.001
DOY 31310:30–12:30 h 15 –295 (35) –57 (7) 0.85 P < 0.00114:30–16:30 h 13 –300 (24) –52 (5) 0.93 P < 0.001
Values in parentheses represent 1 S.E. of the parameter estimate.
254 D.G. Williams et al. / Agricultural and Forest Meteorology 125 (2004) 241–258
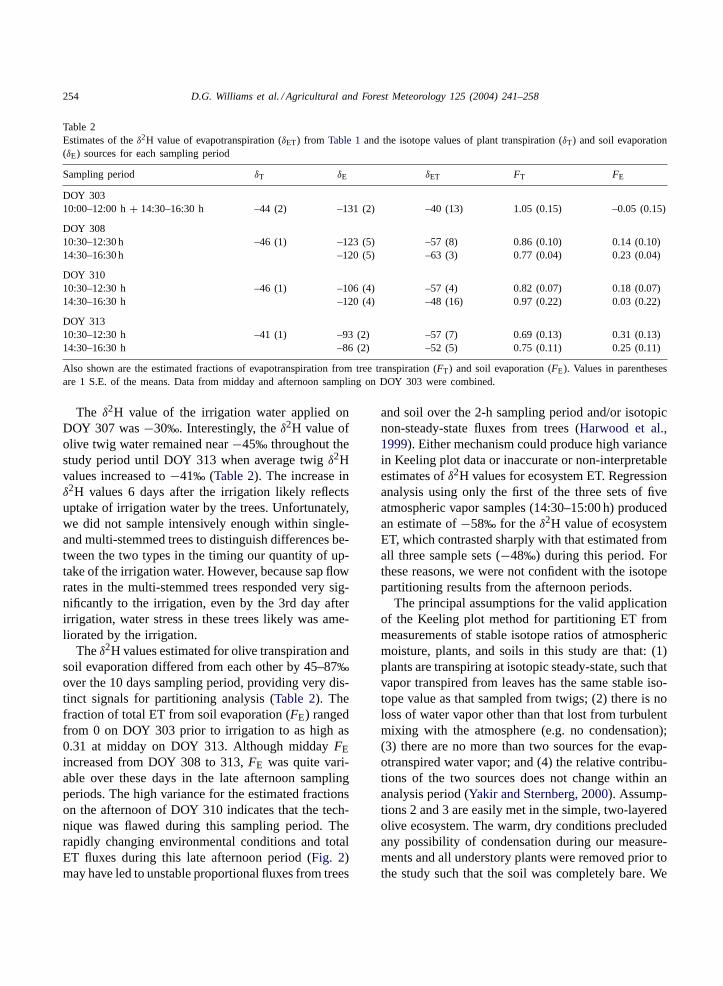
Table 2Estimates of theδ2H value of evapotranspiration (δET) from Table 1and the isotope values of plant transpiration (δT) and soil evaporation(δE) sources for each sampling period
Sampling period δT δE δET FT FE
DOY 30310:00–12:00 h+ 14:30–16:30 h –44 (2) –131 (2) –40 (13) 1.05 (0.15) –0.05 (0.15)
DOY 30810:30–12:30 h –46 (1) –123 (5) –57 (8) 0.86 (0.10) 0.14 (0.10)14:30–16:30 h –120 (5) –63 (3) 0.77 (0.04) 0.23 (0.04)
DOY 31010:30–12:30 h –46 (1) –106 (4) –57 (4) 0.82 (0.07) 0.18 (0.07)14:30–16:30 h –120 (4) –48 (16) 0.97 (0.22) 0.03 (0.22)
DOY 31310:30–12:30 h –41 (1) –93 (2) –57 (7) 0.69 (0.13) 0.31 (0.13)14:30–16:30 h –86 (2) –52 (5) 0.75 (0.11) 0.25 (0.11)
Also shown are the estimated fractions of evapotranspiration from tree transpiration (FT) and soil evaporation (FE). Values in parenthesesare 1 S.E. of the means. Data from midday and afternoon sampling on DOY 303 were combined.
The δ2H value of the irrigation water applied onDOY 307 was−30‰. Interestingly, theδ2H value ofolive twig water remained near−45‰ throughout thestudy period until DOY 313 when average twigδ2Hvalues increased to−41‰ (Table 2). The increase inδ2H values 6 days after the irrigation likely reflectsuptake of irrigation water by the trees. Unfortunately,we did not sample intensively enough within single-and multi-stemmed trees to distinguish differences be-tween the two types in the timing our quantity of up-take of the irrigation water. However, because sap flowrates in the multi-stemmed trees responded very sig-nificantly to the irrigation, even by the 3rd day afterirrigation, water stress in these trees likely was ame-liorated by the irrigation.
Theδ2H values estimated for olive transpiration andsoil evaporation differed from each other by 45–87‰over the 10 days sampling period, providing very dis-tinct signals for partitioning analysis (Table 2). Thefraction of total ET from soil evaporation (FE) rangedfrom 0 on DOY 303 prior to irrigation to as high as0.31 at midday on DOY 313. Although middayFEincreased from DOY 308 to 313,FE was quite vari-able over these days in the late afternoon samplingperiods. The high variance for the estimated fractionson the afternoon of DOY 310 indicates that the tech-nique was flawed during this sampling period. Therapidly changing environmental conditions and totalET fluxes during this late afternoon period (Fig. 2)may have led to unstable proportional fluxes from trees
and soil over the 2-h sampling period and/or isotopicnon-steady-state fluxes from trees (Harwood et al.,1999). Either mechanism could produce high variancein Keeling plot data or inaccurate or non-interpretableestimates ofδ2H values for ecosystem ET. Regressionanalysis using only the first of the three sets of fiveatmospheric vapor samples (14:30–15:00 h) producedan estimate of−58‰ for the δ2H value of ecosystemET, which contrasted sharply with that estimated fromall three sample sets (−48‰) during this period. Forthese reasons, we were not confident with the isotopepartitioning results from the afternoon periods.
The principal assumptions for the valid applicationof the Keeling plot method for partitioning ET frommeasurements of stable isotope ratios of atmosphericmoisture, plants, and soils in this study are that: (1)plants are transpiring at isotopic steady-state, such thatvapor transpired from leaves has the same stable iso-tope value as that sampled from twigs; (2) there is noloss of water vapor other than that lost from turbulentmixing with the atmosphere (e.g. no condensation);(3) there are no more than two sources for the evap-otranspired water vapor; and (4) the relative contribu-tions of the two sources does not change within ananalysis period (Yakir and Sternberg, 2000). Assump-tions 2 and 3 are easily met in the simple, two-layeredolive ecosystem. The warm, dry conditions precludedany possibility of condensation during our measure-ments and all understory plants were removed prior tothe study such that the soil was completely bare. We
D.G. Williams et al. / Agricultural and Forest Meteorology 125 (2004) 241–258 255
assumed that the short intervals for morning and af-ternoon measurements (∼2 h) was insufficient time toallow large shifts in the proportional fluxes from tran-spiration and soil evaporation. We did not directly testthe assumption of isotopic steady-state, however, be-cause of the large differences in the isotope values ofmodeled soil evaporation flux (δE) and twig water (δT),we assumed that deviations from isotopic steady-statetranspiration would not greatly compromise accuracyin our partitioning estimates. The most unfavorableconditions for applying this approach were clearly dur-ing the afternoon sampling periods, when solar irradi-ance (Fig. 2), olive transpiration, and ET fluxes weredeclining rapidly (Fig. 8).
3.4. Technique comparison
Partitioning total ET into its components at theecosystem or larger scale requires integration of sev-eral measurement techniques. Often these techniquesrequire measurements that differ greatly in spatialor temporal scale (Grelle et al., 1997;Wilson et al.,2001). Tree sap flow and stable isotope estimates ofcomponent ET fluxes are derived from measurementsrepresenting very different spatial scales. Sap flow istypically carried out on just a subset of trees withinthe stand, and it is assumed that these trees capturethe variance and mean response of all trees within thefootprint of the eddy covariance flux measurements.This is a reasonable assumption for a relatively homo-geneous agricultural ecosystem, but we found it nec-essary to account for tree-to-tree variation in sap flowresponses in the Agdal olive orchard. Confidence inthe component ET estimates was improved by scalingtree sap flow responses to the flux source area of theeddy covariance measurements. Careful evaluation offlux source area is even more essential in natural veg-etation where heterogeneity in species compositionand stand structure precludes accurate representationof ET components at a large scale (Grelle et al.,1997; Mackay et al., 2002). Still, this technique de-pends on adequate sampling of trees within each classand validity of the eddy flux source area modeling(Moncrieff et al., 2000; Mackay et al., 2002). Anotherconcern with sap flow measurements is that tree ca-pacitance can lead to temporal lags between rates ofsap movement in the base where measurements aremade and evaporation from leaf surfaces (Goldstein
et al., 1998). We saw little evidence of a lag betweensap flow and ET in olive.
The isotope technique arguably has fewer con-straints with respect to spatial and temporal scalewhen partitioning fluxes measured by eddy covari-ance. Isotope samples are collected within the ecosys-tem boundary layer, including the constant flux zonewhere eddy covariance sensors are deployed. Thus,the footprint for the atmospheric vapor samples issomewhat similar to that for the eddy covariancemeasurements (but seeRannik et al., 2000). Althoughwe collected some samples for isotope analysis fromnear the ground surface, the Keeling plots were linear(Fig. 9) with no apparent break or non-linearity thatmight be expected if upper and lower profiles wereintegrating different source areas with different fluxproperties (Yepez et al., 2003). Air was likely wellmixed within the canopy.
Despite the concerns of spatial scale and temporalmatching between the isotope and sap flux techniques,the two approaches yielded very similar estimates ofcomponent fluxes in the present study for the middayperiod (10:30–12:30 h) between DOY 308 and 313 af-ter irrigation (Fig. 10). Ecosystem-level transpirationand soil evaporation estimated by the isotope approachwere within 4 and 15% of that estimated by scaled sapflow, respectively. These slight differences may havebeen due to errors in matching source areas of wa-ter vapor and isotope concentrations with eddy fluxes(Schmid, 1994; Rannik et al., 2000). Regardless, soilevaporation rates estimated by both approaches werehighly correlated with vapor pressure deficit (D), asis expected for the first, energy-limited stage of soilevaporation (Ritchie, 1972). However, as with the tran-spiration rates estimated from sap flow, transpirationrates partitioned from total ET using the isotope tech-nique were not correlated withD. Apparently olivetrees at the south tower site at midday were transpir-ing at near-maximum rates set by soil and/or plant hy-draulic limitations (Sperry, 2000), and thus were notsensitive to day-to-day variation in maximumD. Otherstudies have noted that olive is insensitive to high af-ternoonD (Fernández et al., 2001).
The isotope and sap flow techniques for parti-tioning ecosystem ET did not compare favorablyfor the late-afternoon sampling periods (Fig. 10).Plant transpiration declined substantially during the2 h sampling period in the late afternoon due to

256 D.G. Williams et al. / Agricultural and Forest Meteorology 125 (2004) 241–258
Fig. 10. Comparisons of soil evaporation and tree transpirationrates estimated from stable isotopes (solid symbols) and scaled sapflow (open symbols) plotted as a function of atmospheric vaporpressure-deficit (D).
the rapidly changing light conditions and/or highD(Figs. 2 and 7). Transpiration possibly was not at iso-topic steady-state under these dynamic environmentalconditions, although we have no direct evidence tosupport this claim. Another possible reason for thedifference between isotope and sap flow partitioningfor the late afternoon sampling periods is that thesource area for eddy covariance fluxes and isotopeconcentration measurements are different. The con-centration footprint and the flux footprint source areashave different decay functions in the upwind direction(Rannik et al., 2000); sources farther upwind have agreater influence on the isotope measurement than onthe flux measurement. Afternoon winds were fromthe northwest, while in the morning winds were fromthe east. In the morning the upwind distance to the
non-irrigated portion of the stand to the north of themast was much larger than in the afternoon, therefore,in the afternoon the influence of the non-irrigatedsection may have influenced the isotope results.
4. Summary
A greater understanding of processes driving thedynamics of soil evaporation and plant transpirationduring wetting–drying episodes in arid and semiaridenvironments is needed to manage scarce water sup-plies and to elucidate factors controlling variability inecosystem productivity. Our data illustrate the utilityof the isotope ‘Keeling plot’ approach for partitioningET at the ecosystem scale on short time steps, and theimportance of accurate spatial representation of scaledsap flux for comparison with eddy covariance mea-surements of ET. Estimates of component ET fluxesderived by partitioning total ET using either scaledsap flow or the isotope approach were very similarfor midday periods when ecosystem gas exchange wasat maximum daily rates, but compared less favorablyduring late afternoon periods. The isotope approach,when combined with eddy covariance estimates of to-tal ET fluxes, can be a very useful alternative to ap-proaches that rely on scaling-up from leaf-, plant-, orplot-level measurements in heterogeneous ecosystemstypical of arid and semiarid environments.
Acknowledgements
We are indebted to Drs. A. Qatibi, L. Hanich,A. Outzourhit, A. Benkaddour for use of laboratoryspace and equipment in Marrakech. We thank the di-rector and staff of the Agdal olive orchard for accessand use of the field site and for assistance with irriga-tion scheduling and security. Dr. W. Meijninger verykindly provided assistance with calculations of fluxfootprints. We are grateful to the Institut de Recherchepour le Développement (IRD), the University ofArizona, SAHRA-NSF Science and Technology Cen-ter, and the Dutch Science Foundation for financialsupport of this research. D.G. Williams was sup-ported by a Fulbright Research Fellowship in France,E.A. Yepez was supported by a graduate researchfellowship from CONACYT, Mexico, and J.C.B.
D.G. Williams et al. / Agricultural and Forest Meteorology 125 (2004) 241–258 257
Hoedjes and O.K. Hartogensis were supported by afellowship from STW, The Netherlands (project no.WMO3544).
References
Aguiar, M.R., Paruelo, J.M., Sala, O.E., Lauenroth, W.K., 1996.Ecosystem responses to changes in plant functional typecomposition: an example from the Patagonian steppe. J. Vegetat.Sci. 7, 318–390.
Allison, G.B., Barnes, C.J., Hughes, M.W., 1983. The distributionof deuterium and18O in dry soils 2. Exp. J. Hydrol. 64, 377–379.
Barrett, D.J., Hatton, T.J., Nash, J.E., Ball, M.C., 1995. Evaluationof the heat pulse velocity technique for measurement of sapflow in rainforest and eucalypt forest species of southeasternAustralia. Plant Cell Environ. 18, 463–469.
Boulet, G., Chehbouni, A., Braud, I., Vauclin, M., Haverkamp, R.,Zimmit, C., 2000. A simple water and energy balance modeldesigned for regionalization and remote sensing data utilization.Agric. Forest Meteorol. 105, 117–132.
Braud, I., Dantas-Antonino, A.C., Vauclin, M., Thony, J.L.,Ruelle, P., 1995. A simple soil-plant-atmosphere transfer model(SiSPAT) development and field verification. J. Hydrol. 166,213–250.
Burgess, S.S.O., Adams, M.A., Turner, N.C., Beverly, C.R., Ong,C.K., Khan, A.A.H., Bleby, T.M., 2001. An improved heat pulsemethod to measure slow and reverse flow in woody plants. TreePhysiol. 21, 589–598.
Burgess, S.S.O., Adams, M.A., Turner, N.C., Ong, C.K., 1998.The redistribution of soil water by tree root systems. Oecologia115, 306–311.
Craig, H., Gordon, L.I., 1965. Deuterium and oxygen-18 variationsin the ocean and marine atmosphere. In: Tongiorgi, E.(Ed.) Proceedings of the conference on stable isotopes inoceanographic studies and paleotemperatures, Laboratory ofGeology and Nuclear Science, Pisa, pp. 9–130.
Dawson, T.E., Ehleringer, J.R., 1991. Streamside trees that do notuse stream water. Nature 350, 335–337.
Ehleringer, J.R., Osmond, C.B., 1989. Stable isotopes. In: Pearcy,R.W., Ehleringer, J., Mooney, H.A., Rundel, P.W. (Eds.), PlantPhysiological Ecology: Field Methods and Instrumentation.Chapman & Hall, London, pp. 281–300.
Evans, D.D., Sammis, T.W., Cable, D.R., 1981. Actualevapotranspiration under desert conditions. In: Evans, D.D.,Thames, J.L. (Eds.), Water in Desert Ecosytems. Dowden,Hutchinson and Ross, Stroudsburg, PA, pp. 195–218.
Fernández, J.E., Palomo, M.J., Dıaz-Espejo, A., Clothier, B.E.,Green, S.R., Girón, I.F., Moreno, F., 2001. Heat-pulsemeasurements of sap flow in olives for automating irrigation:tests, root flow and diagnostics of water stress. Agric. WaterManage. 51, 99–123.
Ferretti, D.F., Pendall, E., Morgan, J.A., Nelson, J.A., LeCain, D.,Mosier, A.R., 2003. Partitioning evapotranspiration fluxes froma Colorado grassland using stable isotopes: seasonal variations
and ecosystem implications of elevated atmospheric CO2. PlantSoil 254, 291–303.
Flanagan, L.B., Comstock, J.P., Ehleringer, J.R., 1991. Comparisonof modeled and observed environmental influences on the stableoxygen and hydrogen isotope composition of leaf water inPhaseolus vulgarisL. Plant Physiol. 96, 588–596.
Goldstein, G., Andrade, J.L., Meinzer, F.C., Holbrook, N.M.,Cavelier, J., Jackson, P., Celis, A., 1998. Stem water storageand diurnal patterns of water use in tropical forest canopy trees.Plant Cell Environ. 21, 397–406.
Harwood, K.G., Gillon, J.S., Roberts, A., Griffiths, H., 1999.Determinants of isotopic coupling of CO2 and water vapourwithin a Quercus petraeaforest canopy. Oecologia 119, 109–119.
Helliker, B.R., Roden, J.S., Cook, C., Ehleringer, J.R., 2002.A rapid and precise method for sampling and determiningthe oxygen isotope ratio of atmospheric water vapor. RapidCommun. Mass Spectrom. 16, 929–932.
Horst, T.W., 1999. The footprint for estimation of atmosphere-surface exchange fluxes by profile techniques. Boundary-LayerMeteorol. 90, 171–188.
Horst, T.W., Weil, J.C., 1992. Footprint estimation for scalar fluxmeasurements in the atmospheric surface layer. Boundary-LayerMeteorol. 59, 279–296.
Horst, T.W., Weil, J.C., 1994. How far is far enough? The fetchrequirements for micrometeorological measurement of surfacefluxes. J. Atmos. Ocean. Tech. 11, 1018–1025.
Hultine, K.H., Williams, D.G., Burgess, S.S.O., Keefer, T.O., 2003.Contrasting patterns of hydraulic redistribution in three desertphreatophytes. Oecologia 135, 167–175.
Hutley, L.B., O’Grady, A.P., Eamus, D., 2001. Monsoonalinfluences on evapotranspiration of savanna vegetation ofnorthern Australia. Oecologia 126, 434–443.
Huxman, T.E., Cable, J.M., Ignace, D.D., Eilts, J.A., English, N.B.,Weltzin, J., Williams, D.G., 2004. Response of whole-ecosystemand component CO2 and H2O exchange to an irrigationpulse in a semi-arid grassland: contrasting geomorphic surfacesand native/non-native species communities, Oecologia doi:10.1007/S00442-03-1389Y.
Keeling, C.D., 1958. The concentration and isotopic abundanceof atmospheric carbon dioxide in rural areas. Geochim.Cosmochim. Acta 13, 322–334.
Kemp, P.R., Reynolds, J.F., Pachepsky, Y., Chen, J., 1997. Acomparative modeling study of soil water dynamics in a desertecosystem. Water Resources Res. 33, 73–90.
Law, B.E., Falge, E., Gu, L., Baldocchi, D.D., Bakwin, P.,Berbigier, P., Davis, K., Dolman, A.J., Falk, M., Fuentes,J.D., Goldstein, A., Granier, A., Grelle, A., Hollinger, D.,Janssens, I.A., Jarvis, P., Jensen, N.O., Katul, G., Mahli, Y.,Matteucci, G., Meyers, T., Monson, R., Munger, W., Oechel,W., Olson, R., Pilegaard, K., Paw U, K.T., Thorgeirsson, H.,Valentini, R., Verma, S., Vesala, T., Wilson, K., Wofsy, S., 2002.Environmental controls over carbon dioxide and water vaporexchange of terrestrial vegetation. Agric. Forest Meteorol. 113,97–120.
MacMahon, J.A., Schimpf, D.J., 1981. Water as a factor in thebiology of North American desert plants. In: Evans, D.D.,
258 D.G. Williams et al. / Agricultural and Forest Meteorology 125 (2004) 241–258
Thames, J.L. (Eds.), Water in Desert Ecosytems. Dowden,Hutchinson and Ross, Stroudsburg, PA, pp. 114–171.
Mackay, D.S., Ahl, D.E., Ewers, B.E., Gower, S.T., Burrows,S.N., Samanta, S., Davis, K.J., 2002. Effects of aggregatedclassifications of forest composition on estimates ofevapotranspiration in a northern Wisconsin forest. GlobalChange Biol. 8, 1253–1265.
Majoube, M., 1971. Fractionnement en oxygene-18 et en deuteriumentre l’eau et sa vapaeur. J. Chim. Phys. 68, 1423–1436.
Merlivat, L., 1978. Molecular diffusivities of H218O in gases. J.Chem. Phys. 69, 2864–2871.
Meijninger, W.M.L., Hartogensis, O.K., Kohsiek, W., Hoedjes,J.C.B., Zuurbier, R.M., De Bruin, H.A.R., 2002. Determinationof area-averaged sensible heat fluxes with a large aperturescintillometer over a heterogeneous surface–flevoland fieldexperiment. Boundary-Layer Meteorol. 105, 37–62.
Moncrieff, J.B., Jarvis, P.G., Valentini, R., 2000. Canopy fluxes.In: Sala, O.E., Jackson, R.B., Mooney, H.A., Howarth, R.W.(Eds.), Methods in Ecosystem Science. Springer-Verlag, NewYork, pp. 161–180.
Moreira, M.Z., Sternberg, L.daS.L., Martinelli, L.A., Victoria,R.L., Barbosa, E.M., Bonates, L.C.M., Nepstad, D.C., 1997.Contribution of transpiration to forest ambient vapour based onisotopic measurements. Global Change Biol. 3, 439–450.
Nelson, S.T., Dettman, D., 2001. Improving hydrogen isotope ratiomeasurements for on-line chromium reduction systems. RapidCommun. Mass Spectrom. 15, 2301–2306.
Noy-Meir, I., 1973. Desert ecosystems: environment and producers.Annu. Rev. Ecol. Syst. 4, 51–58.
Paruelo, J.M., Sala, O.E., 1995. Water losses in the Patagoniansteppe: a modelling approach. Ecology 76, 510–520.
Phillips, D.L., Gregg, J.W., 2001. Uncertainty in source partitioningusing stable isotopes. Oecologia 127, 171–179.
Prince, S.D., Brown de Colstoun, E., Kravitz, L.L., 1998. Evidencefrom rain-use efficiencies does not indicate extensive Saheliandesertification. Global Change Biol. 4, 359–374.
Rannik, Ü., Aubinet, M., Kurbanmuradov, O., Sabelfeld, K.K.,Markkanen, T., Vesala, T., 2000. Footprint analysis formeasurements over a heterogeneous forest. Boundary-LayerMeteorol. 97, 137–166.
Reynolds, J.F., Kemp, P.R., Tenhunen, J.D., 2000. Effects oflong-term rainfall variability on evapotranspiration and soilwater distribution in the Chihuahuan desert: a modelinganalysis. Plant Ecol. 150, 145–159.
Ritchie, J.T., 1972. Model for predicting evaporation from a rowcrop with incomplete cover. Water Resources Res. 8, 1204–1213.
Sammis, T.W., Gay, L.Y., 1979. Evapotranspiration from an aridzone plant community. J. Arid Environ. 2, 313–321.
Scott, R.L., Watts, C., Garatuza, J., Edwards, E., Goodrich, D.C.,Williams, D.G., Shuttleworth, W.J., 2003. The understory andoverstory partitioning of energy and water fluxes in a semi-aridwoodland ecosystem. Agric. Forest Meteorol. 114, 127–139.
Schaeffer, S.M., Williams, D.G., Goodrich, D.C., 2000.Transpiration in cottonwood/willow forest patches estimatedfrom sap flux. Agric. Forest Meteorol. 105, 257–270.
Schmid, H.P., 1994. Source areas for scalars and scalar fluxes.Boundary-Layer Meteorol. 67, 293–318.
Smith, S.D., Herr, C.A., Leary, K.L., Piorkowsky, J.M., 1995.Soil-plant water relations in a Mojave desert mixed shrubcommunity: a comparison of three geomorphic surfaces. J. AridEnviron. 29, 339–351.
Sperry, J.S., 2000. Hydraulic limits on plant gas exchange. Agric.Forest Meteorol. 104, 13–23.
Swanson, R.H., 1994. Significant historical developments inthermal methods for measuring sap flow in trees. Agric. ForestMeteorol. 72, 113–132.
Swanson, R.H., Whitfield, D.W.A., 1981. A numerical analysisof heat pulse velocity and theory. J. Exp. Bot. 32, 221–239.
Thornburn, P.J., Walker, G.R., Brunel, J.-P., 1993. Extraction ofwater from eucalyptus trees for analysis of deuterium andoxygen-18: laboratory and field techniques. Plant Cell Environ.16, 269–277.
Wang, X.F., Yakir, D., 1995. Temporal and spatial variations inoxygen-18 content of leaf water in different plant species. PlantCell Environ. 18, 1377–1385.
Wang, X.F., Yakir, D., 2000. Using stable isotopes of water inevaporation studies. Hydrol. Process. 14, 1407–1421.
Webb, E.K., Pearman, G.I., Leuning, R., 1980. Correction of fluxmeasurements for density effects due to heat and water vaportransfer. Q. J. R. Meteor. Soc. 106, 85–100.
Williams, D.G., Ehleringer, J.R., 2000. Intra- and interspecificvariation for summer precipitation use in pinyon-juniperwoodlands. Ecol. Monogr. 70, 517–537.
Wilson, K.B., Hanson, P.J., Mulholland, P.J., Baldocchi, D.D.,Wullschleger, S.D., 2001. A comparison of methods fordetermining forest evapotranspiration and its components:sap-flow, soil water budget, eddy covariance and catchmentwater balance. Agric. Forest Meteorol. 106, 153–168.
Yakir, D., Sternberg, L. da S.L., 2000. The use of stableisotopes to study ecosystem gas exchange. Oecologia 123, 297–311.
Yepez, E.A., Williams, D.G., Scott, R., Lin, G., 2003. Partitioningoverstory and understory evapotranspiration in a semi-aridsavanna ecosystem from the isotopic composition of watervapor. Agric. Forest Meteorol. 119, 53–68.