Embed Size (px)
Citation preview
1
Electronic Supplementary Information
A general salt-resistant hydrophilic/hydrophobic nanoporous
double layer design for efficient and stable solar water
evaporation distillation
Yawei Yang,a Hongyang Zhao,b Zongyou Yin,d Jianqiu Zhao,a Xingtian Yin,a Na Li,b
Dandan Yin,b Yannan Li,b Bo Lei,b Yaping Du*bc and Wenxiu Que*a
a Electronic Materials Research Laboratory, Key Laboratory of the Ministry of
Education, International Center for Dielectric Research, and Shaanxi Engineering
Research Center of Advanced Energy Materials and Devices, School of Electronic &
Information Engineering, Xi’an Jiaotong University, Xi’an 710049, Shaanxi, China.
b Frontier Institute of Science and Technology, Xi’an Jiaotong University, Xi’an
710054, Shaanxi, China.
c School of Materials Science and Engineering, National Institute for Advanced
Materials, Center for Rare Earth and Inorganic Functional Materials, Nankai
University, Tianjin 300350, Tianjin, China.
d Research School of Chemistry, The Australian National University, Canberra,
Australian Capital Territory 2601, Australia.
*Email: [email protected] (W. Que) [email protected] (Y. Du)
Electronic Supplementary Material (ESI) for Materials Horizons.This journal is © The Royal Society of Chemistry 2018
2
Methods
Materials. Cu(OAc)2·H2O (98.0%), Zn(OAc)2·2H2O (99.0%), SnCl2·2H2O (98.0%),
cyclohexane (99.5%) and ethanol (99.7%) were purchased from Sinopharm. Cu(Acac)2
(98.0%) and SeO2 (99.4%) were purchased from Alfa-Aesar. Oleylamine (OLA, 70%)
and Hexadecylamine (HDA, 90%) were purchased from Aldrich. All chemicals were
used as received without further purification.
Synthesis of CZTSe and CTSe hierarchical nanospheres. For the synthesis of
CZTSe nanospheres, 2 mmol Cu(Acac)2, 1 mmol Zn(OAc)2·2H2O, 1 mmol
SnCl2·2H2O, and 4 mmol SeO2 (dissolved in 4 mL ethanol) were added into 40 mL
OLA in a 100 mL three-neck flask on a Schlenk line. The mixture was degassed at 110
°C for 1 h, purged with N2 for 30 min, and then heated to 280 °C for 1 h. The products
were purified and washed with cyclohexane and ethanol through centrifugation at 8000
rpm for 5 min. The OLA-capped hydrophobic black powders were collected and dried
at 60 °C under vacuum overnight. For the synthesis of CTSe nanospheres, 2 mmol
Cu(OAc)2·H2O, 1 mmol SnCl2·2H2O, and 3 mmol SeO2 (dissolved in 3 mL ethanol)
were added into 30 mL OLA and 10 g HDA in a 100 mL three-neck flask. The
reaction was kept at 185 °C for 2 h. The remaining procedures were similar to those of
CZTSe.
Characterizations. Crystalline properties of the samples were analyzed by a powder
X-ray diffractometer (XRD, SmartLab, Rigaku, Japan) using Cu Kα radiation (40 kV,
3
30 mA), and a Raman spectrometer (Inviareflex, Renishaw, UK) equipped with a 514
nm laser. The morphologies of the samples were observed by a field emission scanning
electron microscopy (SEM, Quatan 250FEG, FEI, USA), and a transmission electron
microscopy (TEM, JEM-2100, JEOL., Japan). UV-Vis-NIR absorption spectra of the
samples were measured by an ultraviolet/visble/near-infrared (UV/Vis/NIR)
spectrometer (V-570, Jasco, Japan). Composition identification of the samples was
performed by X-ray photoelectron spectroscopy (XPS, AXIS Ultrabld, Kratos, UK)
using monochromatic Al Kα radiation (150 W, 15 kV, 1486.6 eV). All the binding
energies of the samples were referenced to the C 1s peak (284.8 eV). The surface
modification of the samples was characterized by the Fourier transform infrared
spectroscopy (FTIR, Nicolet 6700, Thermo Scientific, USA) and contact angle meter
(SL200KB, KINO Industry, USA).
First-principles calculations. The electronic structure and optical property were
calculated within the density functional theory (DFT) as implemented in the CASTEP
code. The projector augmented-wave (PAW) pseudopotentials were used with an
energy cutoff of 400 eV for the plane-wave basis functions. The Brillouin zone
integration was carried out using 4×4×2 (for CZTSe) and 4×2×4 (for CTSe)
Monkhorst-Pack k-point meshes. The exchange-correlation functional, generalized
gradient approximation (GGA) of Perdew-Burke-Ernzerhof (PBE) was used for initial
structural relaxations, and the hybrid nonlocal exchange-correlation functional
4
(HSE06) was used to do the final structural relaxations and calculate the electronic
structure and optical property.
Fabrication of solar evaporation device. Vacuum assisted filtration method was used
to fabricate hierarchical nanospheres thin membranes with different loading mass.
Briefly, CTSe or CZTSe cyclohexane dispersion containing known mass of
hierarchical nanospheres (0.2, 0.4, 0.8, and 1.2 mg/cm2) was filtrated through a
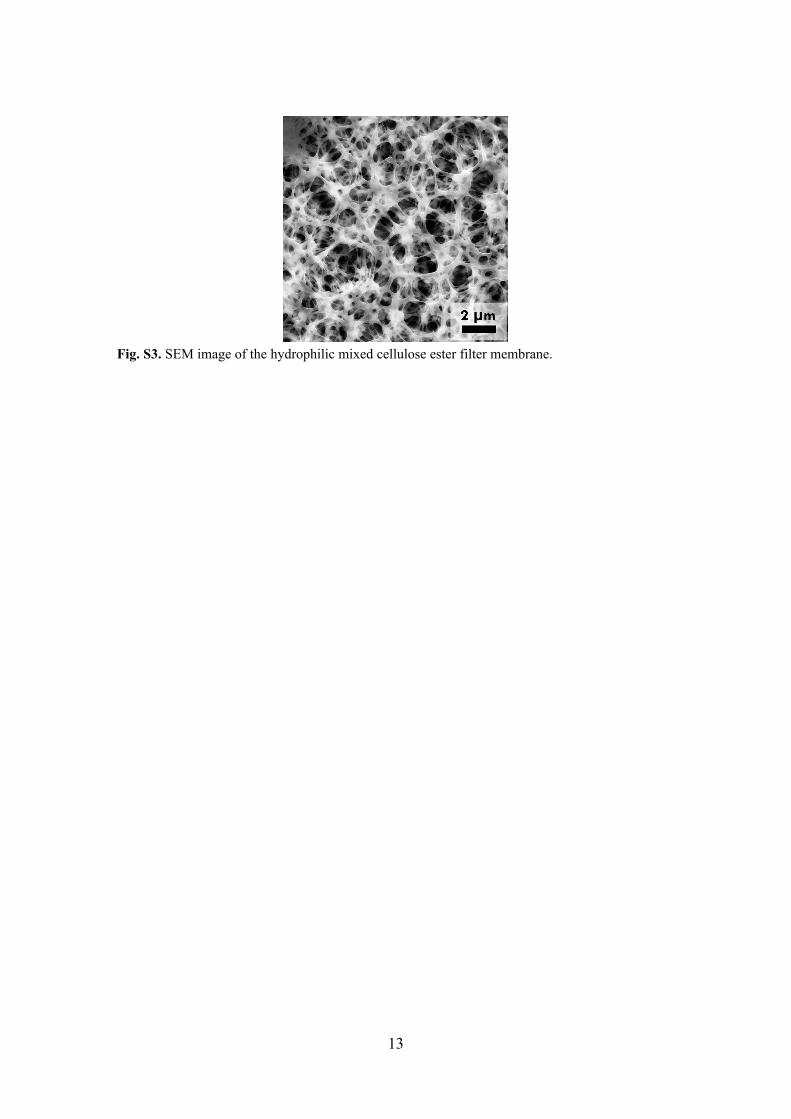
commercial hydrophilic mixed cellulose ester filter membrane (0.22 μm in pore size, 5
cm in diameter, Shanghai Xinya Purification Equipment Co., China) by using Buchner
funnel with sand core (4 cm in diameter). A thin black layer was stacked on top of the
membrane, resulting in a hydrophilic/hydrophobic double layer. The commercial
polystyrene foam and nonwoven fabrics were used as thermal insulating layer and
water uptake path, respectively. The design and assembly process of the solar
evaporation device are shown in Fig. 1a and Fig. S1, respectively. The hydrophilic
layer of the double layer membrane was completely clinged to the nonwoven fabrics.
To demonstrating the unique of the hierarchical nanospheres morphology, the CTSe
nanoplates were also prepared and filtered on the membrane as the light absorber layer.
Water evaporation performance under one Sun. The hydrophilic/hydrophobic
nanoporous double layer membrane was cut to 2×2 cm2 for solar evaporation test.
The as-fabricated solar evaporation device was allowed to float on the water surface in
a teflon container under the irradiation of a 300 W Xe lamp (PLS-SXE300UV, Beijing
5
Perfectlight) equipped with a AM 1.5G filter (100 mW/cm2) under an ambient
temperature of 25~27 °C and a humidity of 30~40%. The temperatures of the vapor
and upper bulk water were recorded by two thermocouples (placed on the top surface
of the membrane and on the water, respectively). The temperature of the membrane
was measured using an IR camera (VT04A, Fluke). The water weight change through
evaporation was monitored by electronic analytical scale (BSA224S, Sartorius, 0.1 mg
in accuracy), and then used to determine the evaporation rate and photothermal
efficiency.
The solar thermal conversion efficiency (η) is estimated by
η = mhLV/I (S1)
where η is solar thermal conversion efficiency, m is the evaporation rate (the
evaporation rate in dark field 0.276 kg/m2 h should be subtracted to eliminate the
effect of natural water evaporation), hLV is the total enthalpy of sensible heat (Q, J/g)
and phase change of liquid to water (Lv, J/g), and I is the solar illumination density (1
kW/m2).
hLV = Q + Lv
Lv = 1.91846 × 10³ [Ti/(Ti - 33.91)]2 J/g
Q = c (Ts – Ti) J/g c = 4.2 J/g K
Lv is dependent on the temperature (Ti) of the water/air interface where the
vaporization occurs.1 Q is calculated from the specific heat of water and the
temperature difference between the source water (Ts) and water/air interface (Ti).
Therefore, the temperature of the water/air interface (Ti) affects the values of both Lv
6
and Q, and further affects the calculation of η.2 In our case, we take hLV = Lv + Q =
2256 J/g. This value of hLV was found in multiple resources3-8 which is why we used it
in order to make our data comparable.
References1. B. Henderson-Sellers, Quart. J. R. Met. Soc., 1984, 110, 1186-1190.2. Y. Shi, R. Li, Y. Jin, S. Zhuo, L. Shi, J. Chang, S. Hong, K. Ng, and P. Wang,
Joule, 2018, 2, 1-16.3. Y. Yang, X. Yang, L. Fu, M. Zou, A. Cao, Y. Du, Q Yuan and C. Yan, ACS
Energy Lett., 2018, 3, 1165-1171.4. R. Li, L. Zhang, L. Shi and P. Wang, ACS Nano, 2017, 11, 3752-3759.5. P. Zhang, J. Li, L. Lv, Y. Zhao and L. Qu, ACS Nano, 2017, 11, 5087-5093.6. X. Yang, Y. Yang, L. Fu, M. Zou, Z. Li, A. Cao and Q. Yuan, Adv. Funct. Mater.,
2018, 28, 1704505.7. L. Zhang, B. Tang, J. Wu, R. Li and P. Wang, Adv. Mater., 2015, 27, 4889-4894.8. X. Gao, H. Ren, J. Zhou, R. Du, C. Yin, R. Liu, H. Peng, L. Tong, Z. Liu and J.
Zhang, Chem. Mater., 2017, 29, 5777-5781.
The analysis of heat loss.
The heat loss of the solar evaporation device consists of three parts: (a) radiation, (b)
convection, and (c) conduction.
a. Radiation:
The radiation loss can be calculated by the Stefan-Boltzmann equation.
Qrad = εAσ(T14-T2
4) (S2)
Where Qrad denotes heat flux, ε is the emissivity (It is assumed that the absorber has a
maximum emissivity of 0.97), A is the surface area (4 cm2), σ is the Stefan-Boltzmann
constant (5.67×10⁻⁸ W m-2 K-4), T1 is the average surface temperature (≈41 °C) of
absorber at steady state condition, and T2 is the ambient temperature (≈35 °C) upward
7
the absorber under the illumination of 1 Sun solar flux. According to equation (S2), the
radiation heat loss is calculated to be ~4.0%.
b. Convection:
The convective heat loss is defined by Newton' law of cooling.
Qconv = hA(T1-T2) (S3)
Where Qconv represents the heat energy, and h is the convection heat transfer
coefficient (set as 5 W m-2 K)1-6. According to equation (S3), the connection heat loss
is calculated to be ~3.0%.
c. Conduction:
Qcond = CmΔT (S4)
Where Qcond is the heat energy, C is the specific heat capacity of water (4.2 kJ oC-1 kg-
1), m is the water weight (8 g), and ΔT is the average increased bulk water temperature
after 1 h illumination of 1 Sun solar flux (≈1 oC). According to equation (S4), the
conduction heat loss is calculated to be ~2.3%.
References1. P. Zhang, Q. Liao, T. Zhang, H. Cheng, Y. Huang, C. Yang, C. Li, L. Jiang and L.
Qu, Nano Energy, 2018, 46, 415-422.2. Y. Yang, R. Zhao, T. Zhang, K. Zhao, P. Xiao, Y. Ma, P. M. Ajayan, G. Shi and Y.
Chen, ACS Nano, 2018, 12, 829-835.3. X. Yang, Y. Yang, L. Fu, M. Zou, Z. Li, A. Cao and Q. Yuan, Adv. Funct. Mater.,
2018, 28, 1704505.4. N. Xu, X. Hu, W. Xu, X. Li, L. Zhou, S. Zhu and J. Zhu, Adv. Mater., 2017, 29,
1606762.5. X. Li, R. Lin, G. Ni, N. Xu, X. Hu, B. Zhu, G. Lv, J. Li, S. Zhu and J. Zhu, Natl.
Sci. Rev., 2017, 0, 1-8.6. Y. Yang, X. Yang, L. Fu, M. Zou, A. Cao, Y. Du, Q Yuan and C. Yan, ACS
Energy Lett., 2018, 3, 1165-1171.
8
Solar seawater desalination and water remediation. The seawater desalination and
water remediation applications of the solar evaporation device were demonstrated by
using real seawater (Bohai Sea, salinity ~2.75%; Qinghai Lake, salinity ~2.30%; and
Caka Salt Lake, salinity ~32.2%) and simulated wastewater (organic dye aqueous
solution: 10 mg/L Rhodamine B (RhB), 20 mg/L methyl orange (MO) and 20 mg/L
methyl blue (MB); heavy metal aqueous solution: 1.0 mM FeCl3, 0.1 M CuCl2 and 0.5
mM K2Cr2O7; bacterial culture suspension: 106 Escherichia coli and Staphylococcus
aureus). The salinities (Na+, K+, Mg2+ and Ca2+) of water before and after solar
desalination were collected and tracked by inductively coupled plasma spectroscopy
(ICP-OES, Optima 8000, PerkinElmer Instruments, 0.01 mg/L in accuracy). The
decoloration efficiency of organic dyes and colored heavy metals before and after solar
evaporation were collected and monitored by the UV/Vis/NIR spectrometer. The anti-
bacteria efficiency was tested by culturing the water collected before and after solar
evaporation.
For illustrating the salt (solute) blocking function and high stability of the hydrophobic
surface, the hydrophobic ligands of hierarchical nanospheres were removed. Then the
hydrophobic and hydrophilic samples were conducted the solar seawater (Bohai Sea)
desalination for 10 hours.
Freshwater evaporation and collection under natural sunlight. An all-in-one solar
distillation set-up (Fig. 5k) was designed and fabricated by polymethyl methacrylate
(PMMA). The PMMA was treated with O2-plasma to obtain the hydrophilic surface
9
for condensed water collection. 4 pieces of CTSe hydrophilic/hydrophobic nanoporous
double layer membranes (4 cm in diameter) were used to distill freshwater from
seawater (Bohai Sea) under natural sunlight for 8 h (9:00-17:00, June 27th, 2017, in
Xi’an, China).
Vapor pressure and chemical potential decrease with the increase of the solutes
concentration in water.
In equilibrium solution, the total vapor pressure of the solution can be determined by
combining extended Raoult's law1,2 and Dalton's law3 by:
𝑃 = � γ𝑖𝑃𝑖𝑥𝑖𝑖
� 𝑥𝑖 = 1𝑖
Where P is the total vapor pressure of the solution, γi is the activity coefficient of the
pure component i, Pi is the vapor pressure of the pure component i, xi is the mole
fraction of the component i in the solution. If a non-volatile salt (extremely low Pi) is
dissolved into a solvent to form a solution, the P of the final solution will be lower
than that of the solvent. Therefore, the vapor pressure as well as evaporation rate
decreases with the increase of salt concentration xi and decrease of the activity
coefficient γi. In ideal solution, the activity coefficient γ = 1. Seawater is not an ideal
solution, the activity coefficient of main salts in seawater γNaCl ≈ 0.66, γNa2SO4 ≈ 0.35,
γMgCl2 ≈ 0.46, γCaCl2 ≈ 0.45, γMg2SO4 ≈ 0.15, γCa2SO4 ≈ 0.14, γNaHCO3 ≈ 0.62, γNa2CO3 ≈ 0.35,
γMgCO3 ≈ 0.15 and γCaCO3 ≈ 0.14 were calculated by using Pitzer model and Monte
Carlo simulations at 25 °C and salinity 35.4 They are indeed far from unity. In fact, the
vapor pressure of salty water is lower than that of pure water.
10
The chemical potential is given by:
μi = μi° + RT*ln γixi
where μi° is the chemical potential of pure component i, γi is the activity coefficient of
the pure component i, and xi is the mole fraction of the component i in the solution.
Therefore, the chemical potential of water decreases with the increase of solutes
concentration xi.
References1. F. M. Raoult, Loi générale des tensions de vapeur des dissolvants (General law of
vapor pressures of solvents), Comptes rendus, 1887, 104, 1430-1433.2. J. M. Smith, H. C. Van Ness and M. M. Abbott, Introduction to Chemical
Engineering Thermodynamics (seventh ed.), New York: McGraw-Hill, 2005, 545.3. J. Dalton, "Essay IV. On the expansion of elastic fluids by heat," Memoirs of the
Literary and Philosophical Society of Manchester, 1802, 5, 595-602.4. A. Ulfsbo, Z. Abbas and D. R. Turner, Mar. Chem., 2015, 171, 78-86.
11
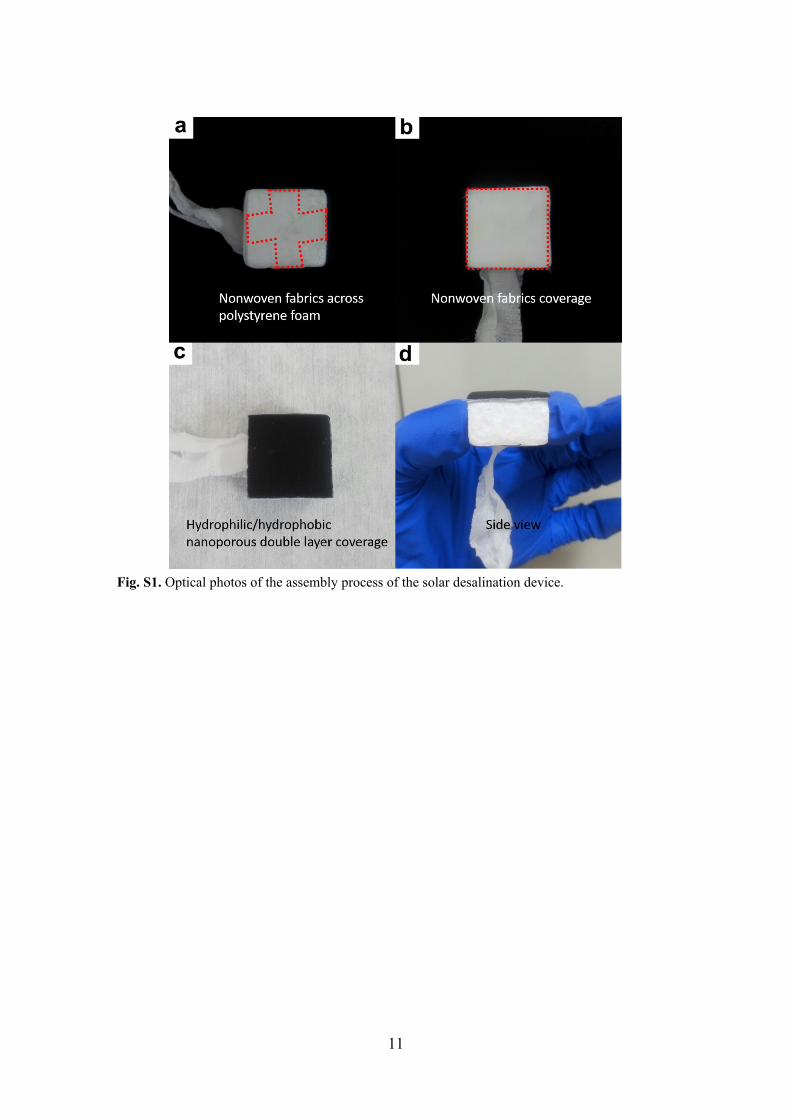
Fig. S1. Optical photos of the assembly process of the solar desalination device.
12
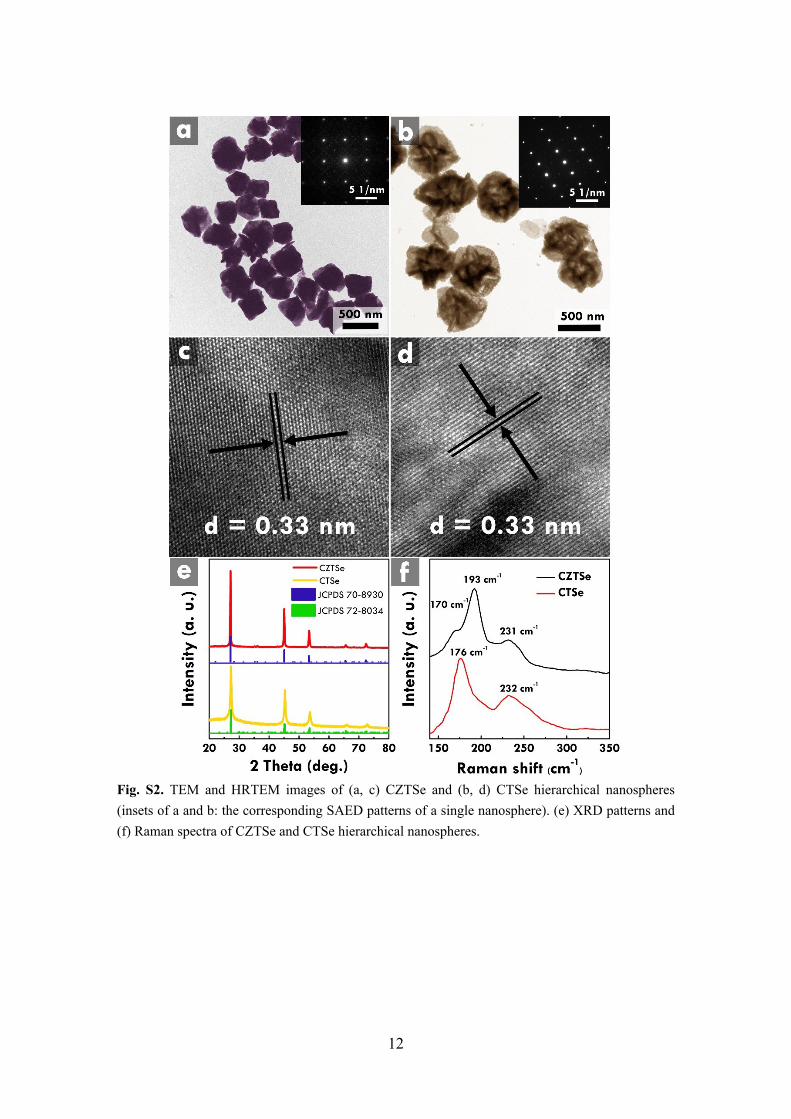
Fig. S2. TEM and HRTEM images of (a, c) CZTSe and (b, d) CTSe hierarchical nanospheres (insets of a and b: the corresponding SAED patterns of a single nanosphere). (e) XRD patterns and (f) Raman spectra of CZTSe and CTSe hierarchical nanospheres.
13
Fig. S3. SEM image of the hydrophilic mixed cellulose ester filter membrane.
14
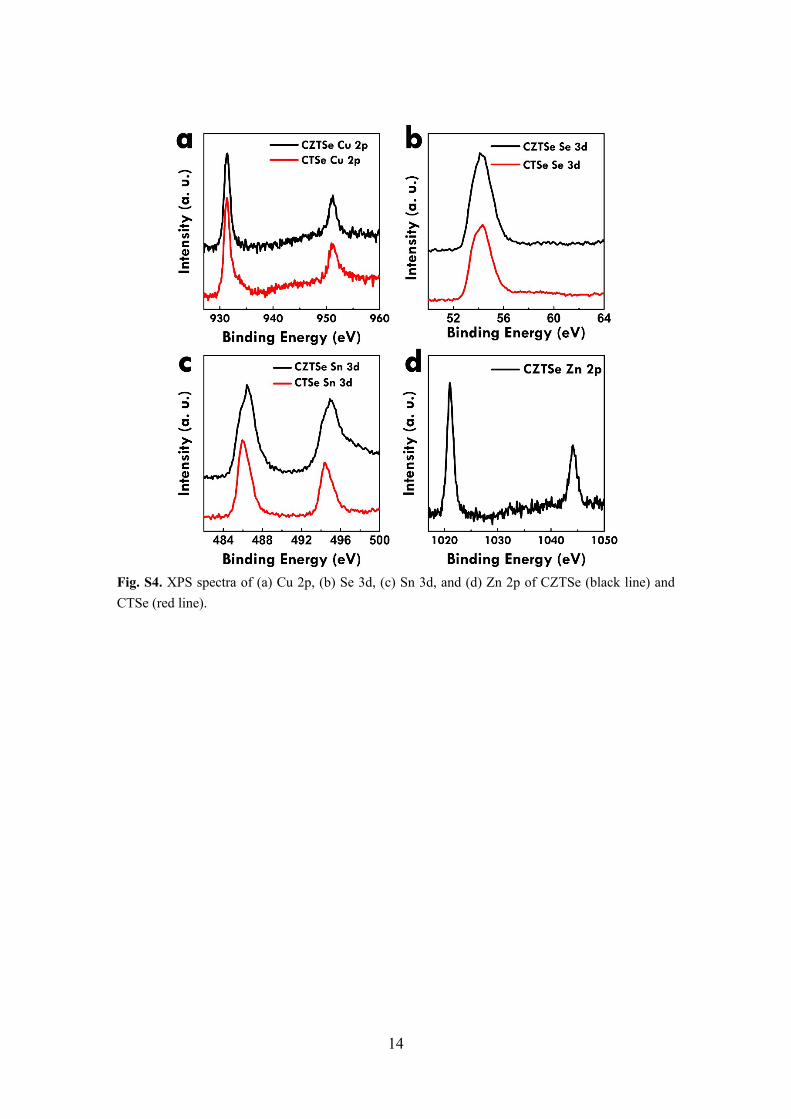
Fig. S4. XPS spectra of (a) Cu 2p, (b) Se 3d, (c) Sn 3d, and (d) Zn 2p of CZTSe (black line) and CTSe (red line).
15
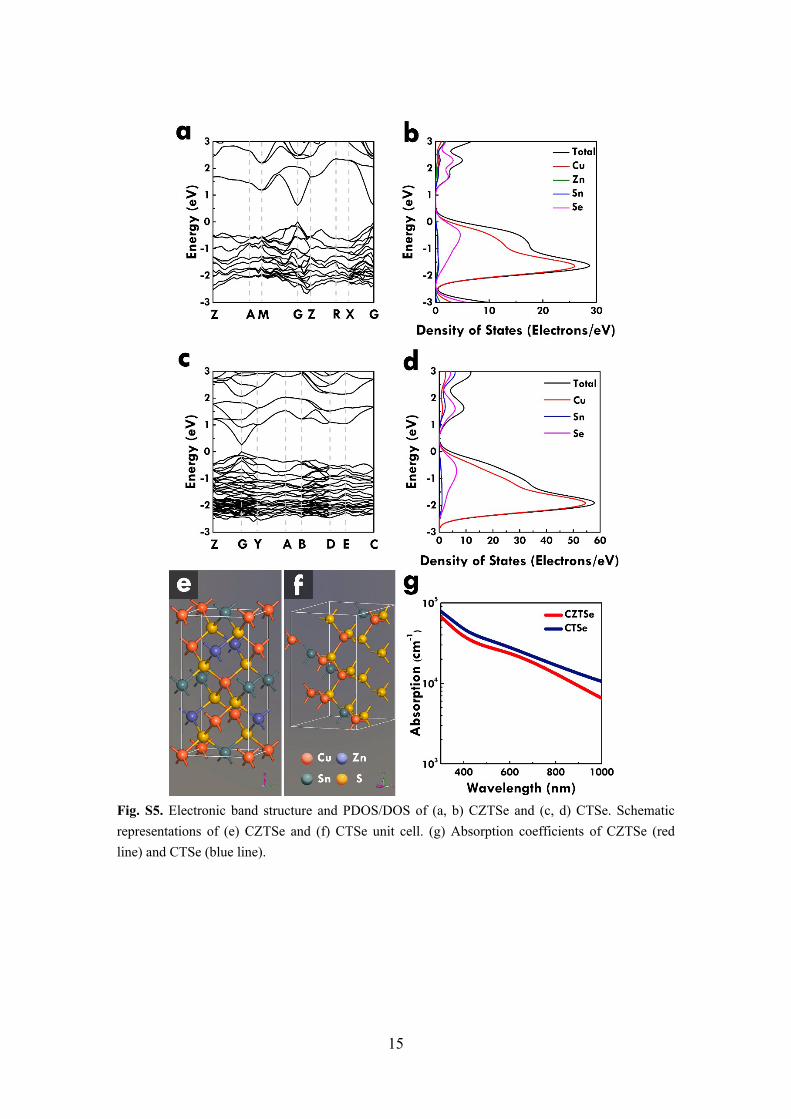
Fig. S5. Electronic band structure and PDOS/DOS of (a, b) CZTSe and (c, d) CTSe. Schematic representations of (e) CZTSe and (f) CTSe unit cell. (g) Absorption coefficients of CZTSe (red line) and CTSe (blue line).
16
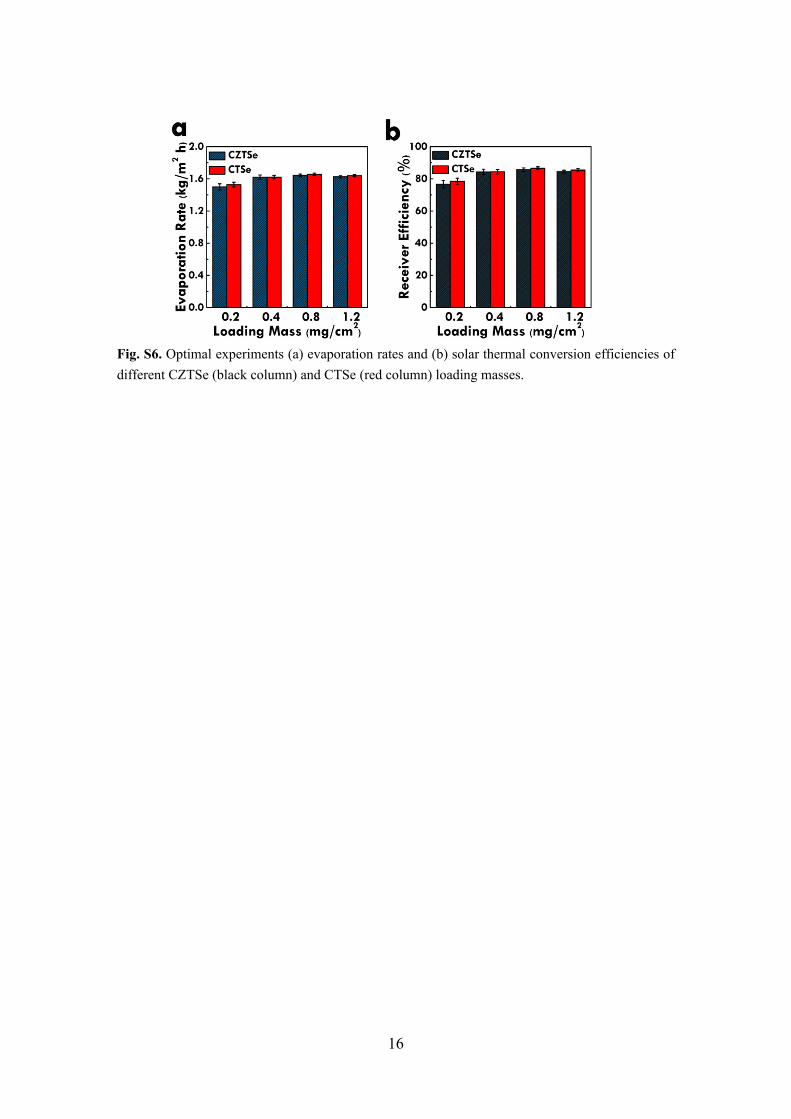
Fig. S6. Optimal experiments (a) evaporation rates and (b) solar thermal conversion efficiencies of different CZTSe (black column) and CTSe (red column) loading masses.
17
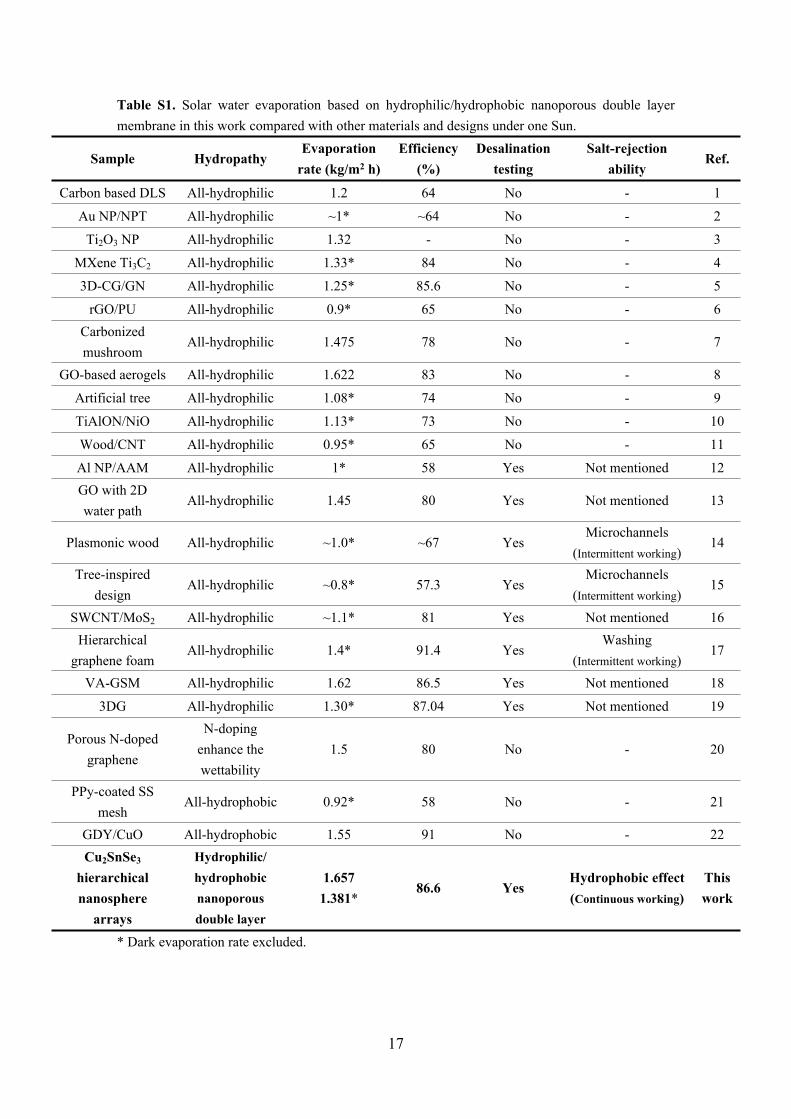
Table S1. Solar water evaporation based on hydrophilic/hydrophobic nanoporous double layer membrane in this work compared with other materials and designs under one Sun.
Sample HydropathyEvaporation
rate (kg/m2 h)Efficiency
(%)Desalination
testingSalt-rejection
abilityRef.
Carbon based DLS All-hydrophilic 1.2 64 No - 1
Au NP/NPT All-hydrophilic ~1* ~64 No - 2
Ti2O3 NP All-hydrophilic 1.32 - No - 3
MXene Ti3C2 All-hydrophilic 1.33* 84 No - 4
3D-CG/GN All-hydrophilic 1.25* 85.6 No - 5
rGO/PU All-hydrophilic 0.9* 65 No - 6Carbonized mushroom
All-hydrophilic 1.475 78 No - 7
GO-based aerogels All-hydrophilic 1.622 83 No - 8
Artificial tree All-hydrophilic 1.08* 74 No - 9
TiAlON/NiO All-hydrophilic 1.13* 73 No - 10
Wood/CNT All-hydrophilic 0.95* 65 No - 11
Al NP/AAM All-hydrophilic 1* 58 Yes Not mentioned 12GO with 2Dwater path
All-hydrophilic 1.45 80 Yes Not mentioned 13
Plasmonic wood All-hydrophilic ~1.0* ~67 YesMicrochannels
(Intermittent working)14
Tree-inspired design
All-hydrophilic ~0.8* 57.3 YesMicrochannels
(Intermittent working)15
SWCNT/MoS2 All-hydrophilic ~1.1* 81 Yes Not mentioned 16Hierarchical
graphene foamAll-hydrophilic 1.4* 91.4 Yes
Washing(Intermittent working)
17
VA-GSM All-hydrophilic 1.62 86.5 Yes Not mentioned 18
3DG All-hydrophilic 1.30* 87.04 Yes Not mentioned 19
Porous N-doped graphene
N-doping enhance the wettability
1.5 80 No - 20
PPy-coated SS mesh
All-hydrophobic 0.92* 58 No - 21
GDY/CuO All-hydrophobic 1.55 91 No - 22Cu2SnSe3
hierarchical nanosphere
arrays
Hydrophilic/hydrophobic nanoporous double layer
1.6571.381*
86.6 YesHydrophobic effect (Continuous working)
This work
* Dark evaporation rate excluded.
18
References1. H. Ghasemi, G. Ni, A. M. Marconnet, J. Loomis, S. Yerci, N. Miljkovic and G. Chen, Nat.
Commun., 2014, 5, 4449.2. L. Zhou, Y. Tan, D. Ji, B. Zhu, P. Zhang, J. Xu, Q. Gan, Z. Yu and J. Zhu, Sci. Adv., 2016, 2,
e1501227.3. J. Wang, Y. Li, L. Deng, N. Wei, Y. Weng, S. Dong, D. Qi, J. Qiu, X. Chen and T. Wu, Adv.
Mater., 2017, 29, 1603730.4. R. Li, L. Zhang, L. Shi and P. Wang, ACS Nano, 2017, 11, 3752-3759.5. Y. Li, T. Gao, Z. Yang, C. Chen, W. Luo, J. Song, E. Hitz, C. Jia, Y. Zhou, B. Liu, B. Yang
and L. Hu, Adv. Mater., 2017, 29, 1700981.6. G. Wang, Y. Fu, A. Guo, T. Mei, J. Wang, J. Li and X. Wang, Chem. Mater., 2017, 29, 5629-
5635.7. N. Xu, X. Hu, W. Xu, X. Li, L. Zhou, S. Zhu and J. Zhu, Adv. Mater., 2017, 29, 1606762.8. X. Hu, W. Xu, L. Zhou, Y. Tan, Y. Wang, S. Zhu and J. Zhu, Adv. Mater., 2017, 29, 1604031.9. H. Liu, C. Chen, G. Chen, Y. Kuang, X. Zhao, J. Song, C. Jia, X. Xu, E. Hitz, H. Xie, S.
Wang, F. Jiang, T. Li, Y. Li, A. Gong, R. Yang, S. Das and L. Hu, Adv. Energy Mater., 2018, 8, 1701616.
10. H. Liu, X. Zhang, Z. Hong, Z. Pu, Q. Yao, J. Shi, G. Yang, B. Mi, B. Yang, X. Liu, H. Jiang and X. Hu, Nano Energy, 2017, 42, 115-121.
11. C. Chen, Y. Li, J. Song, Z. Yang, Y. Kuang, E. Hitz, C. Jia, A. Gong, F. Jiang, J. Y. Zhu, B. Yang, J. Xie and L. Hu, Adv. Mater., 2017, 29, 1701756.
12. L. Zhou, Y. Tan, J. Wang, W. Xu, Y. Yuan, W. Cai, S. Zhu and J. Zhu, Nat. Photon., 2016, 10, 393-398.
13. X. Li, W. Xu, M. Tang, L. Zhou, B. Zhu, S. Zhu and J. Zhu, Proc. Natl. Acad. Sci., 2016, 113, 13953-13958.
14. M. Zhu, Y. Li, F. Chen, X. Zhu, J. Dai, Y. Li, Z. Yang, X. Yan, J. Song, Y. Wang, E. Hitz, W. Luo, M. Lu, B. Yang and L. Hu, Adv. Energy Mater., 2018, 8, 1701028.
15. M. Zhu, Y. Li, G. Chen, F. Jiang, Z. Yang, X. Luo, Y. Wang, S. D. Lacey, J. Dai, C. Wang, C. Jia, J. Wan, Y. Yao, A. Gong, B. Yang, Z. Yu, S. Das and L. Hu, Adv. Mater., 2017, 29, 1704107.
16. X. Yang, Y. Yang, L. Fu, M. Zou, Z. Li, A. Cao and Q. Yuan, Adv. Funct. Mater., 2018, 28, 1704505.
17. H. Ren, M. Tang, B. Guan, K. Wang, J. Yang, F. Wang, M. Wang, J. Shan, Z. Chen, D. Wei, H. Peng and Z. Liu, Adv. Mater., 2017, 29, 1702590.
18. P. Zhang, J. Li, L. Lv, Y. Zhao and L. Qu, ACS Nano, 2017, 11, 5087-5093.19. Y. Yang, R. Zhao, T. Zhang, K. Zhao, P. Xiao, Y. Ma, P. M. Ajayan, G. Shi and Y. Chen,
ACS Nano, 2018, 12, 829-835.20. Y. Ito, Y. Tanabe, J. Han, T. Fujita, K. Tanigaki and M. Chen, Adv. Mater., 2015, 27, 4302-
4307.21. L. Zhang, B. Tang, J. Wu, R. Li and P. Wang, Adv. Mater., 2015, 27, 4889-4894.22. X. Gao, H. Ren, J. Zhou, R. Du, C. Yin, R. Liu, H. Peng, L. Tong, Z. Liu and J. Zhang, Chem.
Mater., 2017, 29, 5777-5781.
19
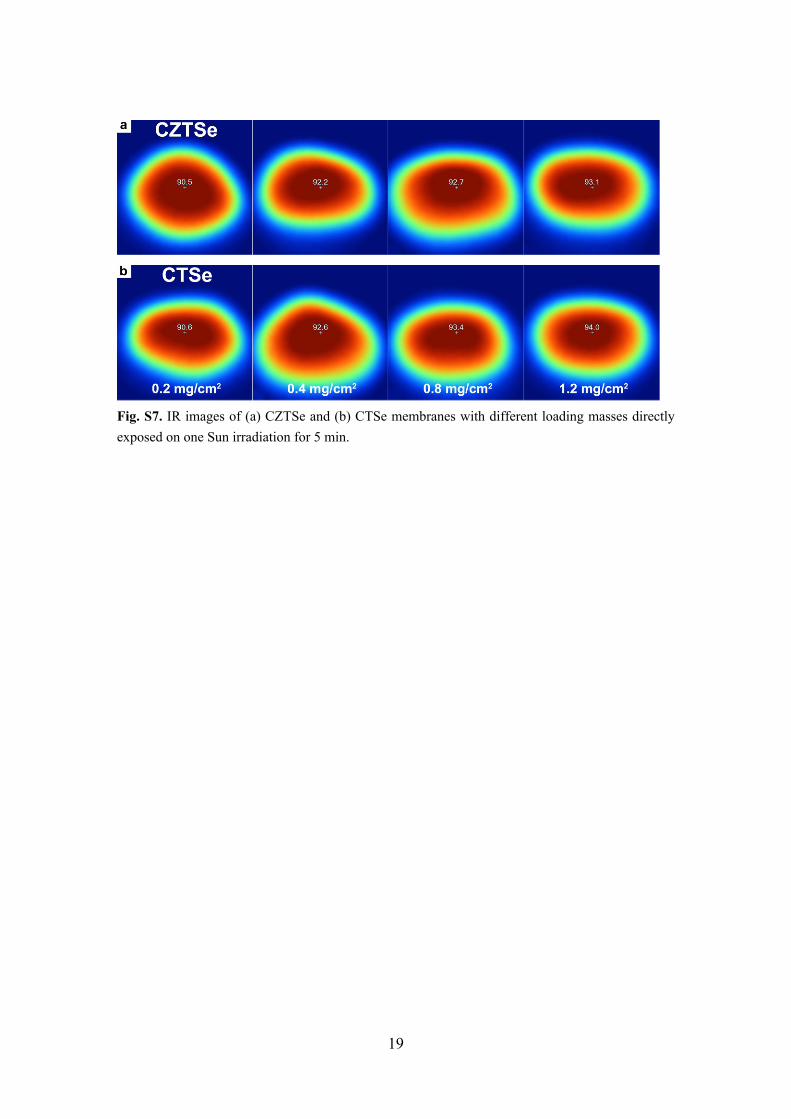
Fig. S7. IR images of (a) CZTSe and (b) CTSe membranes with different loading masses directly exposed on one Sun irradiation for 5 min.
20
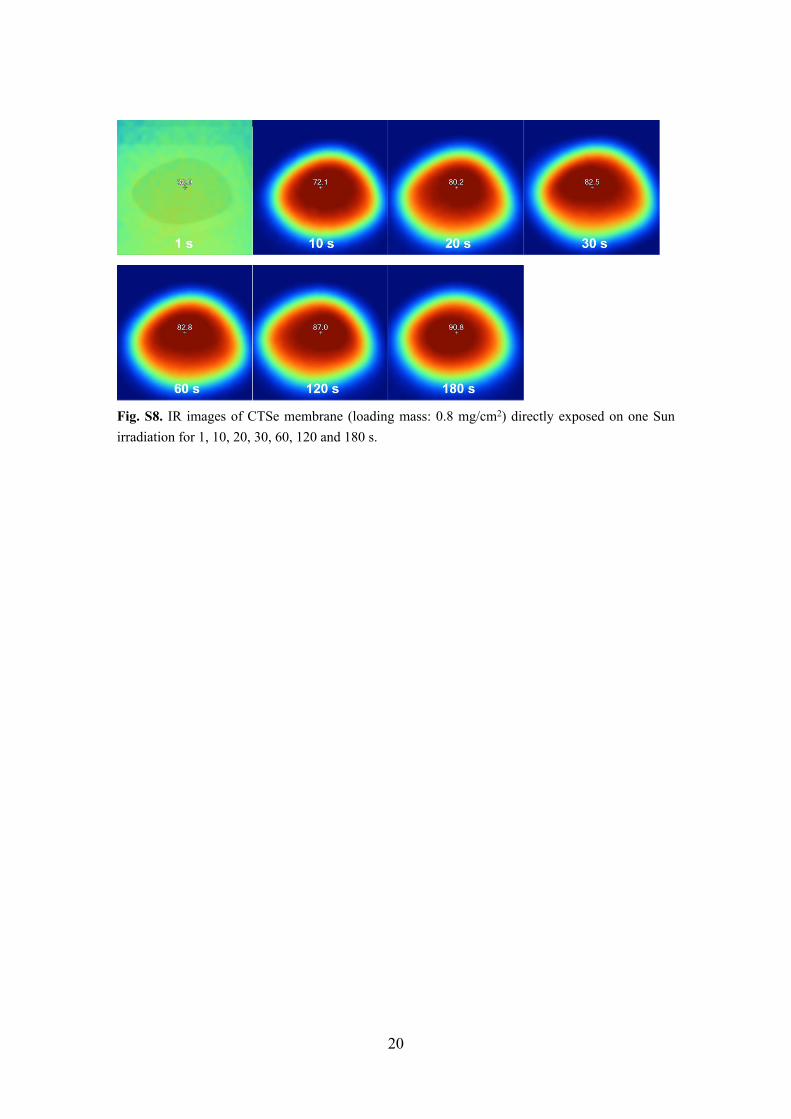
Fig. S8. IR images of CTSe membrane (loading mass: 0.8 mg/cm2) directly exposed on one Sun irradiation for 1, 10, 20, 30, 60, 120 and 180 s.
21
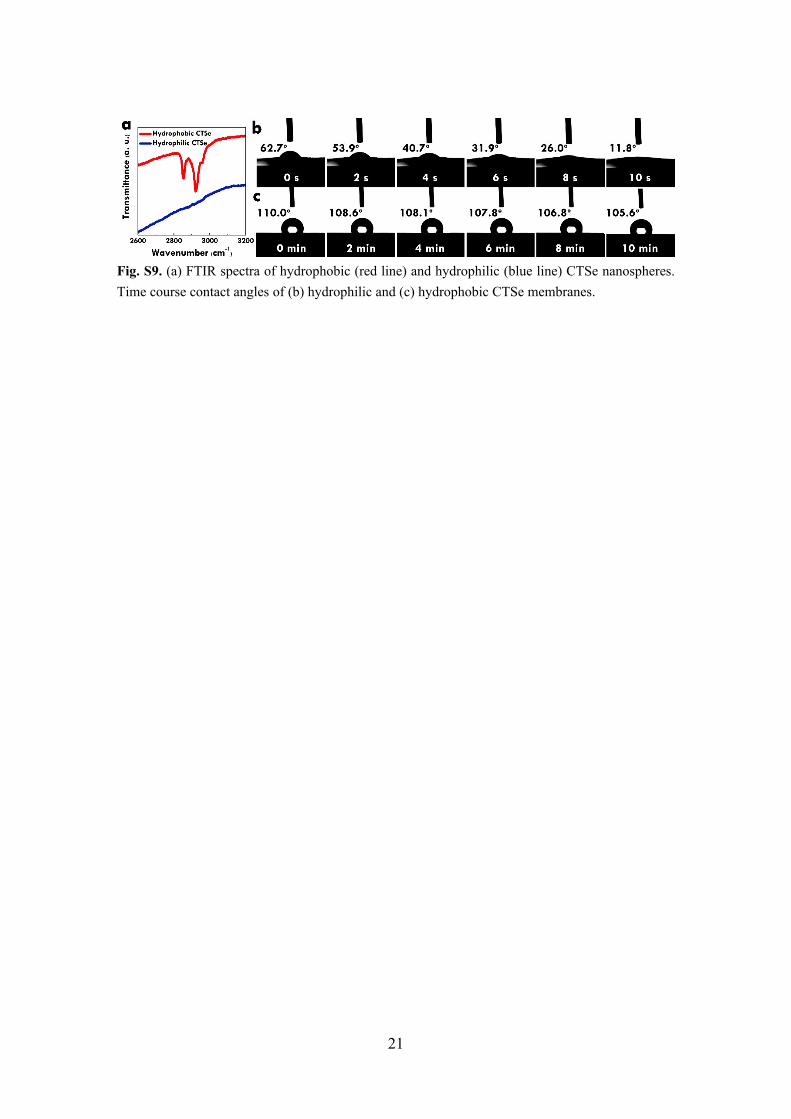
Fig. S9. (a) FTIR spectra of hydrophobic (red line) and hydrophilic (blue line) CTSe nanospheres. Time course contact angles of (b) hydrophilic and (c) hydrophobic CTSe membranes.
22
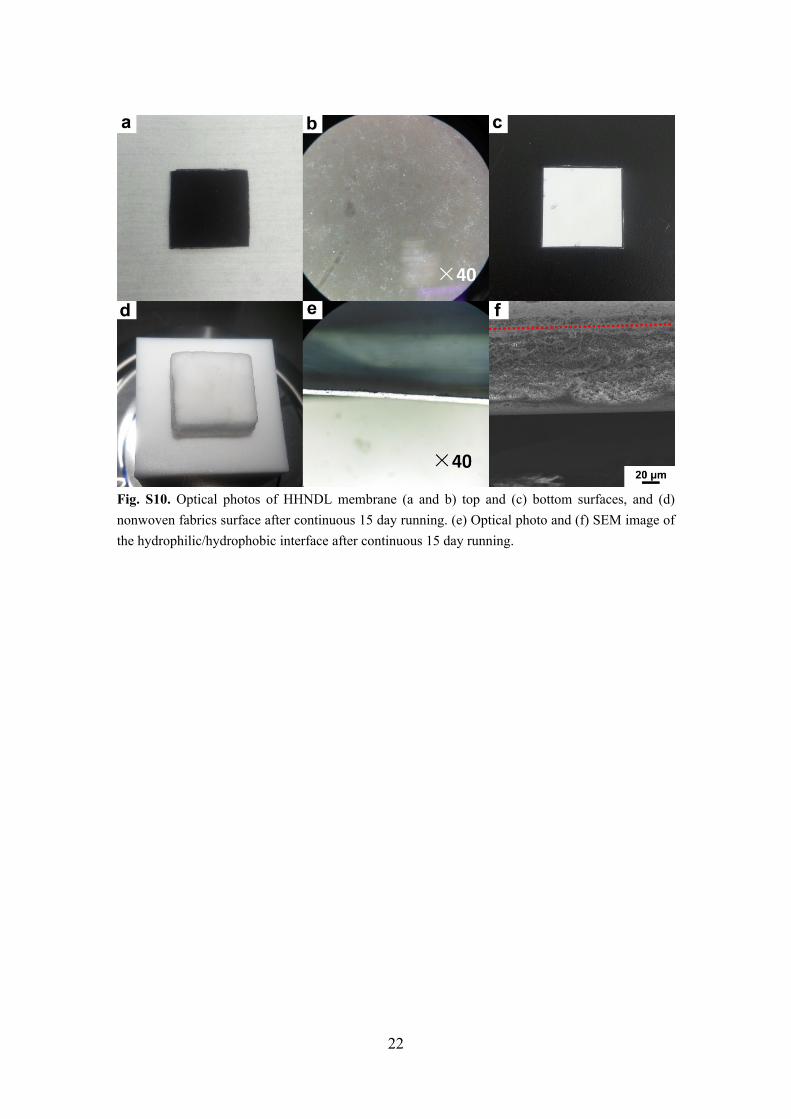
Fig. S10. Optical photos of HHNDL membrane (a and b) top and (c) bottom surfaces, and (d) nonwoven fabrics surface after continuous 15 day running. (e) Optical photo and (f) SEM image of the hydrophilic/hydrophobic interface after continuous 15 day running.
23
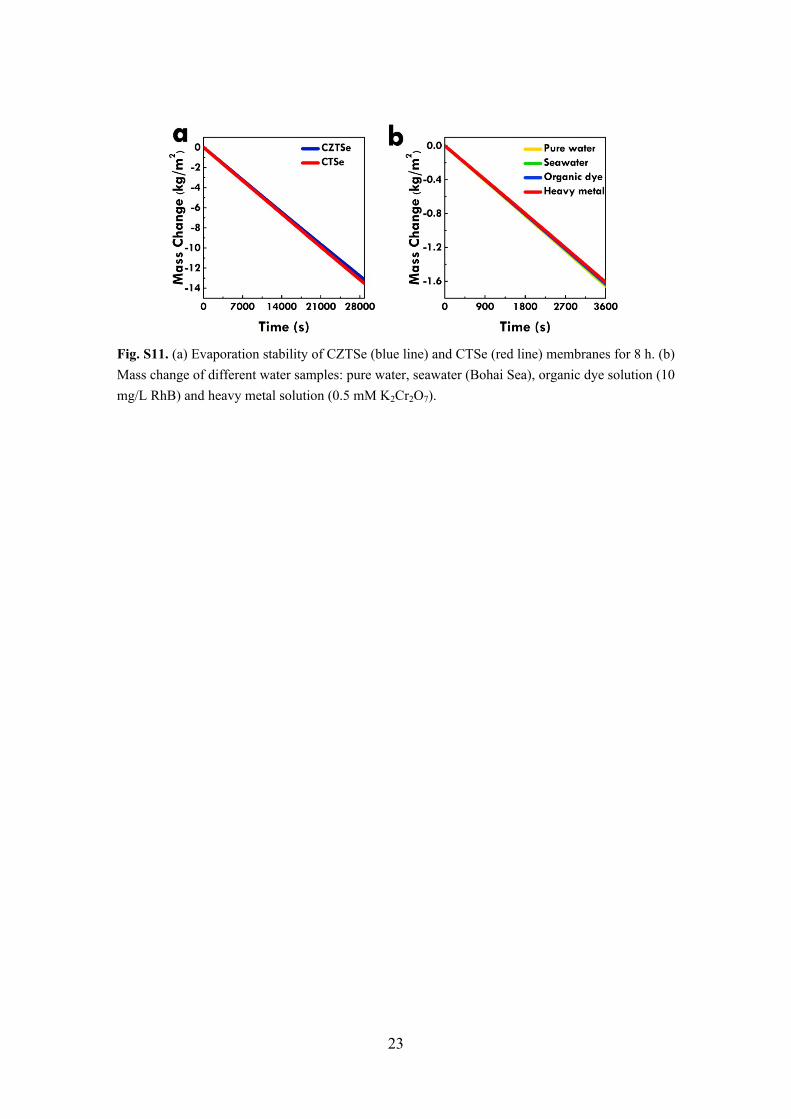
Fig. S11. (a) Evaporation stability of CZTSe (blue line) and CTSe (red line) membranes for 8 h. (b) Mass change of different water samples: pure water, seawater (Bohai Sea), organic dye solution (10 mg/L RhB) and heavy metal solution (0.5 mM K2Cr2O7).
24
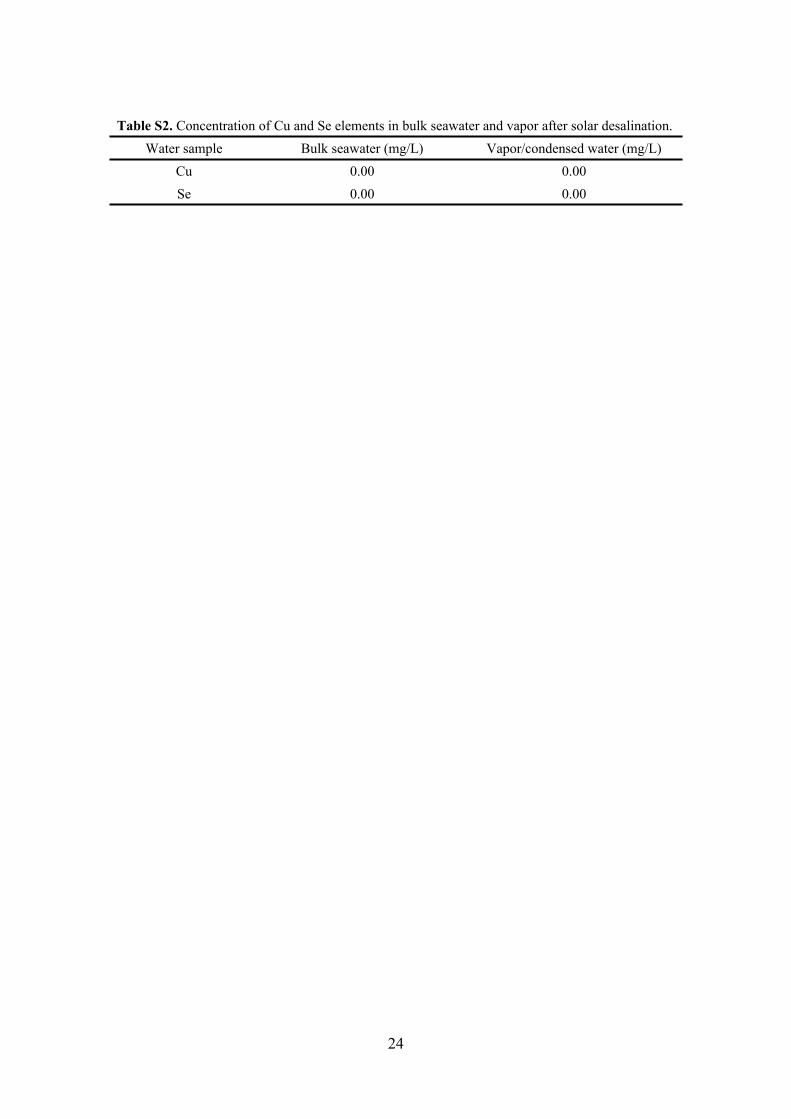
Table S2. Concentration of Cu and Se elements in bulk seawater and vapor after solar desalination.Water sample Bulk seawater (mg/L) Vapor/condensed water (mg/L)
Cu 0.00 0.00Se 0.00 0.00
25
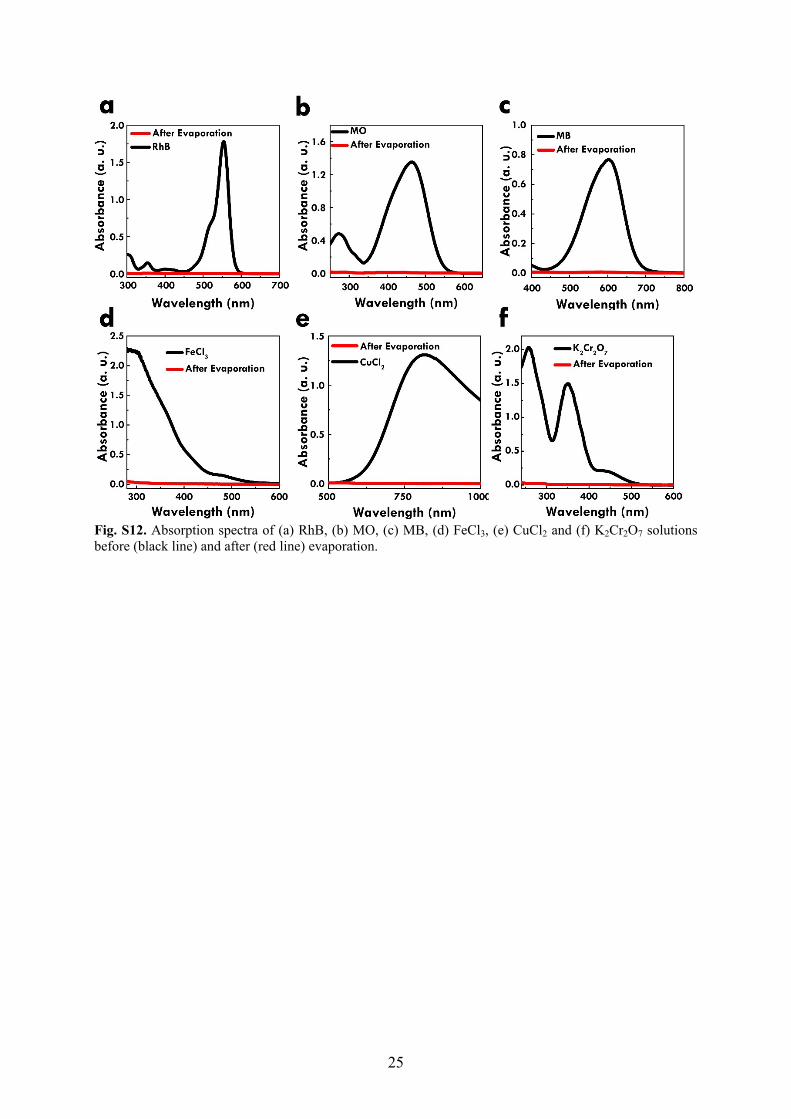
Fig. S12. Absorption spectra of (a) RhB, (b) MO, (c) MB, (d) FeCl3, (e) CuCl2 and (f) K2Cr2O7 solutions before (black line) and after (red line) evaporation.

26
Author contributionsY. Y. and H. Z. contributed equally to this work. W. Q. and Y. D. proposed the whole research direction and guided the project. Y. Y., H. Z., J. Z. and D. Y. designed and performed the fabrication and characterization experiments. Y. L. and B. L. conducted the anti-bacteria experiments. All authors analyzed the experimental results and drafted the manuscript.