Embed Size (px)
Citation preview
Evanescent interference patterns for fluorescence microscopy
James R. Abney,* Bethe A. Scalettar,* and Nancy L. Thompson'Departments of *Cell Biology & Anatomy and 'Chemistry, University of North Carolina, Chapel Hill, North Carolina 27599
ABSTRACT The increasing experimental use of total internal reflection/fluorescence photobleaching recovery has motivated atheoretical study of the spatial intensity profiles generated by two interfering evanescent waves. The interference patternsgenerated by evanescent waves differ considerably from those generated by plane waves in a homogenous medium becauseevanescent waves are not transverse and because the evanescent propagation number depends on the incidence angle of thetotally internally reflected light. The periodicity and contrast of the evanescent interference patterns under various conditions arecalculated; these parameters depend on the intensities, polarizations, and incidence angles of the two incident beams, as well asthe refractive indices of the two media that form the planar interface where total internal reflection occurs. The derived intensityprofiles are used to develop expressions for the shapes of fluorescence photobleaching recovery curves when evanescentinterference patterns are used for fluorescence excitation and bleaching. The calculations also suggest that colliding beamexperiments may confirm theoretically predicted evanescent field polarizations.
INTRODUCTION
Total internal reflection (TIR) fluorescence microscopyis a recently developed method for probing molecularand cellular phenomena at fluid/solid interfaces (1-3).In this technique, light is directed from a medium ofhigher refractive index n1 (e.g., fused quartz withnl = 1.5) onto a planar interface with a medium of lowerrefractive index n2 (usually buffered water with n2 = 1.3).For sufficiently oblique incidence angles, the incidentlight is totally internally reflected at the interface,thereby creating an evanescent electromagnetic fieldthat penetrates only a short distance ( < 1,000 A) intothe medium of lower refractive index. This evanescentfield selectively excites fluorescence only from thosemolecules in the medium of lower refractive index thatare within the field penetration depth, i.e., close to thesurface. It is the exclusion of signal from the bulk phaseand the unusual polarization properties of the evanes-cent field that make TIR fluorescence microscopy auseful probe of surface phenomena. Three recent appli-cations of TIR have been to the characterization ofcell-substrate contact regions (4, 5), surface bindingequilibria (6-11), and surface orientation distributions(12-15).
Evanescent illumination has also been combined withfluorescence photobleaching recovery to probe surface
Dr. Abney's present address is Cardiovascular Research Institute,University of California, San Francisco, CA 94143-0532.Dr. Scalettar's present address is Department of Biochemistry andBiophysics, University of California, San Francisco, CA 94143-0554.
diffusion coefficients and surface binding kinetic rates.At least two different optical geometries have been used.In one geometry (TIR/FPR), a laser beam with acircular Gaussian intensity profile is totally internallyreflected, creating an evanescent intensity profile thatvaries approximately as an elliptical Gaussian in theplane at which the laser beam totally internally reflects(16-20). Contributions to the fluorescence recovery thatarise from surface diffusion for this illumination patterndepend on the 1 /e2-widths of the elliptical Gaussianintensity profile. In another geometry (TIR/FPPR), twototally internally reflected laser beams collide to create aperiodic evanescent interference pattern (21-23). Herecontributions to fluorescence recovery that arise fromsurface diffusion depend on the spatial periodicity of theinterference pattern. This latter optical configuration isadvantageous because the characteristic length of theilluminated region may be more accurately controlled(by varying the collision angle) and because slowertranslational motions may be more easily monitored(since the characteristic distance of the illumination issmaller for interference patterns [0.2-5 p,m] than forfocused Gaussian beams [10-100 ,um]).
Despite the fact that TIR/FPPR has been exploitedexperimentally in several recent applications, the theo-retical foundation of the method has not yet been fullydeveloped. This paper describes the evanescent electricfield intensities created by two interfering evanescentwaves and applies the results to an analysis of TIR/FPPR. It is shown that evanescent interference patterns
542 0006-3495/91/02/542/11 $2 00 Biophys. J. c Biophysical SocietyVolume 61 February 1992 542-552
542 0006-3495/91/02/542/11 $2.00
have unique characteristics and differ substantially fromthe interference patterns created by freely propagatingplane waves. These unique characteristics are manifestin the derived forms for TIR/FPPR recovery curves andmay also provide a basis for experimentally confirmingprevious theoretical expressions for evanescent fieldpolarizations.
Plane-wave interference in ahomogeneous mediumIn this section, the interference patterns created by two colliding planewaves are reviewed. This case is considered because it more simplyreveals many of the salient features of the rather complicatedevanescent-wave calculation. In addition, the plane-wave resultsprovide a standard against which evanescent-wave interference pat-terns can be compared.The electric field of a single plane wave traveling along thex-axis and
polarized at an angle a from the z-axis may be written
E(r, t) = Re{AE0 exp [i(kx-t)]|, (1)
where i = (x, y, z) is the position, t is the time,A is the amplitude, Eo isa polarization vector of unit amplitude, k is the propagation number,and w is the angular frequency. The last three quantities are given bythe expressions
Eo = sin a9 + cos az
k = 27rn2/I0
W = 2irc/Xo,
interfering beams
incident beam
incidenceangle 0
z*.,/ >'.* |
(2a)
(2b)
(2c)
where a is the polar angle of the polarization vector, Xo is the vacuumwavelength, c is the vacuum speed of light, n2 is the refractive index ofthe medium in which the plane wave propagates, and y and 2 are unitvectors.
Interference phenomena arise from the superposition of twoelectric fields. The electric fields of two colliding plane waves (j = 1 or2) propagating in the x-y plane at angles +4 from the x-axis, withpropagation vectors k, and k2 and with polarization directions Foj(Fig. 1 a), are given by
Ej(ri, t) = Re{A Fo exp [i(k r - &t + b)]}, (3)
where
Fo0= -sin al sin 4A + sin a1ocos + Cos a z (4a)
F02 = sin a2 sin 4x + sin a2 cos 45 + cos a2Z (4b)
k1 = k,(cos 4A + sin 09) (4c)
k2= k2(cos x - sin 49). (4d)
Here x is a unit vector, the Ai are amplitudes, and the fj have beenintroduced as arbitrary phases. The above choice of propagationdirections facilitates subsequent calculations. Because plane waves are
transverse, F *.q = 0.
One last set of quantitites is introduced to facilitate later compari-son with evanescent-wave interference. The planes defined by thez-axis and the are analogues of incidence planes in reflection/
k
k2collision angle =2-
WATER (n2)
QUARTZ (n1)
reflected beam,,,l,,,, ""* k
evanescent field
WATER (n2)
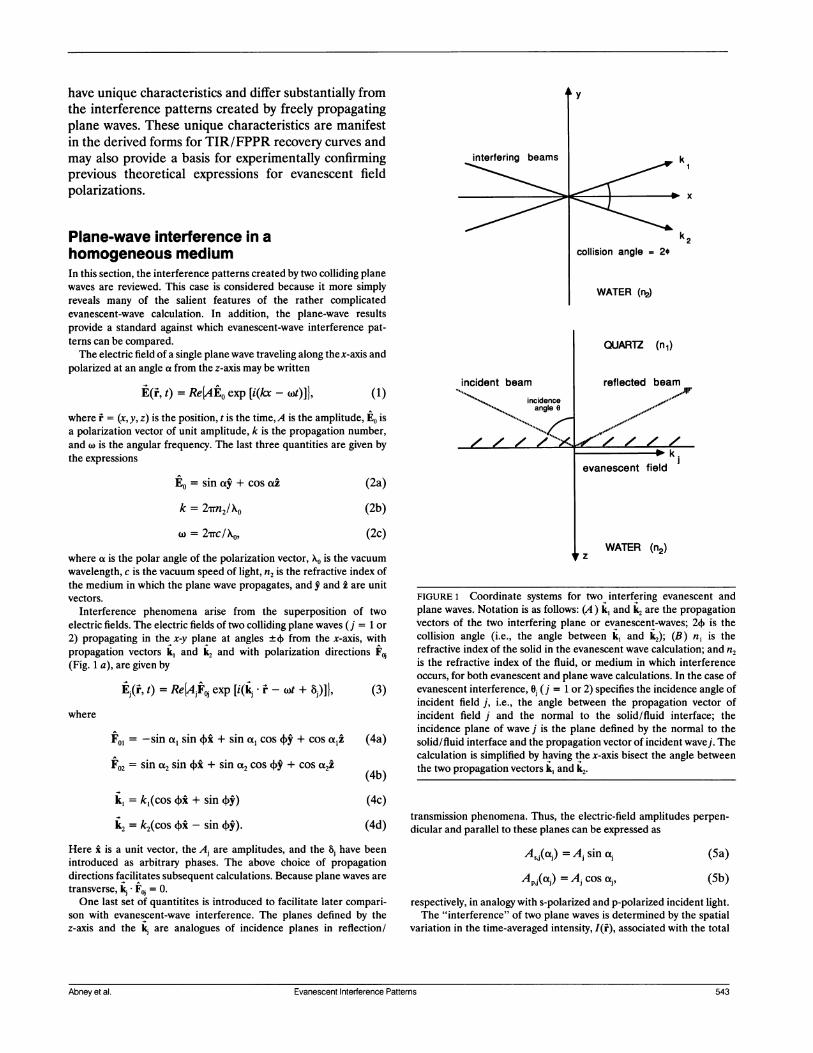
FIGURE 1 Coordinate systems for two interfering evanescent andplane waves. Notation is as follows: (A) k1 and k2 are the propagationvectors of the two interfering plane or evanescent-waves; 2+ is thecollision angle (i.e., the angle between k1 and k2); (B) n1 is therefractive index of the solid in the evanescent wave calculation; and n2is the refractive index of the fluid, or medium in which interferenceoccurs, for both evanescent and plane wave calculations. In the case ofevanescent interference, Oj (j = 1 or 2) specifies the incidence angle ofincident field j, i.e., the angle between the propagation vector ofincident field j and the normal to the solid/fluid interface; theincidence plane of wave j is the plane defined by the normal to thesolid/fluid interface and the propagation vector of incident wavej. Thecalculation is simplified by having the x-axis bisect the angle betweenthe two propagation vectors k1 and k2.
transmission phenomena. Thus, the electric-field amplitudes perpen-
dicular and parallel to these planes can be expressed as
Asj(ao) = Aj sin aj (5a)
Api(aj) = Aj cos aj, (5b)
respectively, in analogy with s-polarized and p-polarized incident light.The "interference" of two plane waves is determined by the spatial
variation in the time-averaged intensity, I(i), associated with the total
Abney et al. Evanescent Interterence Patterns 543
i ---w
- - - -1
AN
,pe", / I/ I/ /
Abney et al. Evanescent Interference Patterns 543
electric field'
E,ot(r, t) = E,(r-, t) + E2(r, t).
Thus, the goal is to calculate
I(r) = (E,2tort) (7)
where () denotes a time average (24). The absorptivity of a randomlyoriented sample is proportional to this intensity.The calculation of I(i) proceeds by inserting Eq. 3 into Eq. 7 and
invoking Eqs. 4 and 5, and the fact that
(exp (2iwt)) = (exp (-2ict)) = 0 (8)
for averaging times much longer than 2rr/w (24). The time-averagedintensity is found to be
refractive index. If the interface between the two media is defined asthe x-y plane and the incidence plane as the x-z plane, the evanescent
(6) electric field created by an incident beam of amplitude A that ispolarized at an angle a from the incidence plane is (1)
E(r-, t) = Re{AEO(0, a) exp [i(k(H)x - wt)]|* exp {-zI[2d(O)]], (13)
where
Eox(O, a) = ax(H) cos a exp {-i[bp(O) + nr/2]1Eoy(O, a) = a,(O) sin a exp [-ib,(O)]
Eo(o,a) = a,(O) cos a exp [-i&p(O)]
ax,(0) = 2 cos OX'(O)[(sin20 -n2)"2, sin 0]
(14a)
(14b)
(14c)
(14d)
Ir) =2(A2 +AA2 +A2 +A s2
+ (Ap,,Ap,2 + As,,As,2 cos 2(+) cos (/\k * -r + AS8), (9)
a,(O) = 2 cos 0/(1 - n2)1/2
X(o) = (n4 COS 2 0 + sin2 0 - n2)1/2
SIP(0) = tan-' {(sin2 0 - n2)"2/([l, n2] cos 0)j
d(o) = XO/[4r(n 2 sin 0 - n2 1/2jk(H) = 2,in, sin 0/AX
n = n2In,.
Eq. 9 is the conventional plane-wave interference pattern (24).Under typical experimental conditions, Eq. 9 may be simplified.
When the amplitudes of the two incident beams are equal and the twobeams are either both s-polarized (A, - A,,, = A,2 and A,,1 = Ap,2 = 0)or both p-polarized (AP= AP,, = Ap,2 and A,, =A,,2 = 0), the intensi-ties equal
I,(r-) = A2[1 + cos 24) cos (/k *r + A8)] (lla)
Ip(ri) = Ap[l + cos (Ak * r + Aa)]. (llb)
Evanescent-wave interference atplanar dielectric interfacesIn a TIR experiment, a plane wave is directed from a medium (labeled1) of higher refractive index onto a planar dielectric interface with a
medium (labeled 2) of lower refractive index. This wave is totallyinternally reflected back into the medium of higher refractive index byfixing its incidence angle 0 (measured with respect to the interfacenormal) to be greater than the critical angle Oc defined by
oC = sin-1 (n2/n,). (12)
Concomitantly, an evanescent field is created in the medium of lower
'The absorptivity of a randomly oriented sample is proportional to thesquare of the electric field. For plane waves, this quantity is propor-tional to the energy density given by the Poynting vector. However, forevanescent waves, this proportionality no longer holds because thewaves are not transverse (1, 24).
One noteworthy feature of the evanescent field is that it is nottransverse, i.e., E,, has a component along the propagation direction(x). However, this component is proportional to ax, which is muchsmaller than ay and a. for many incidence angles and relative refractiveindices. It is also worth noting that the evanescent-wave propagationnumber (Eq. 14i) depends on the incidence angle; Eq. 14i reduces toEq.2bonly as0-3.
The analysis of evanescent-wave interference parallels the analysisof plane-wave interference in the previous section. The electric fieldsof two colliding evanescent waves (j = 1 or 2) created by beams withamplitudes A,, polarization angles a,, and incidence angles 0, incidentin planes at angles ±+ from the x-axis (Fig. 1 b) can be written
E,(r-, t) = ReAjFo (0j, otj) exp [i{kj(0j) * r - wt + bj}]}*exp I-z/[2d(0j)]}, (15)
where
Fol(Ol a,) = [Eox(0l, a,) cos - Eo,(01, a,) sin 4]x)
+ [E,(H0, al) sin + Eo,(0,, a,) cos 40]' + E0Z(07 a,)2 (16a)
F02(02, a2) = [EO,(02, a2) cos 4) + E(02, a) sin 44x
+ [-Eox(02a12) sin + Eoy(02 a2) cos (4]' + Eo0(02, a2)£ (16b)
kl(0,) = k(0l)(cos 4)x + sin +4)
k2(02) = k(02)(cos +x) - sin +4).
(16c)
(16d)
Here k(0,), E,,(0,, a,) and d(0j) are given by Eq. 14 evaluated at 0, and aj.Using Eqs. 13-16 in Eqs. 6 and 7, together with the relationships in Eq.8, gives the following general expression for the time-averaged
544 Biophysical Journal Volume 61 February 1992
where
Ak = k, -k2
k, =k2 =k
(lOa)
As = 81 - 82-
(14e)
(140
(lOb)
(lOc)
(14g)
(14h)
(14i)
(14j)
544 Biophysical Journal Volume 61 February 1992
intensity of the evanescent interference pattern'
I(r) = ½{2p,,[a'(O,) + a'(O,)] +A 2la 2(0,) exp (-zid,) = x
+ '/21Apax(02) + az(02)] + As,ay(02)} exp (-z/d2) 6.50- Uy = [2w n /X0] y
+ {AP,Ap2[ax(0j)ax(02) cos 24) + az(O,)az(02)]* cos (Ak + 8p(02) - 8p(0,) + AB)
+ ASo 4s,2ay 2) 4.90-cos (Ak r + 8S(O2) - MO(O,) + A8)
+ AS 1Ap,2aY(0j)a.(02) sin 24)
* sin (Ak - r + 8p(02) - bs(Ol) + A8)+ AP,As2ax(0)ay(02) sin 24)
3.30
* sin (Ak r + 8S(02) - 8p(0l) + A8)} exp (-zld,2),
where Ak and AS are given by Eqs. lOa and lOc, respectively, and
dj = d(Oj) (18a) *70
d.2 = 2did2/(d, + d2). (18b) + = 280
Again, the interference pattern simplifies considerably under typical 0 = 75
experimental conditions. In particular, when the amplitudes and 092-
incidence angles of the two incident beams are equal and the twobeams are either both s-polarized or both p-polarized, the intensitiesequal uX= 0 Ux =280
Ih(r) = A2a2[1 + cos 24) cos (Ak * r + A8)] exp (-zid) (19a) uy 0 Uy 0
Ip(i) = A2[(a2 + a2)+ (ax cos 24) + a2) cos (Ak r + A8)] exp (-zid), (19b) ux = [2WlnX0] x
6. 13 y 2 r/)ywhere d = d, = d26
Characteristics of interferencepatterns 47-
Eqs. 9 and 17 are general expressions for the interfer-
ence patterns generated by two plane waves and twoevanescent waves, respectively; typical patterns are illus-
trated in Fig. 2. In general, the formulae (Eqs. 9 and 17) 3.30Yare rather complex, but four properties of the interfer-ence patterns (their periods, visibilities, spatial shapes,
and spatially averaged intensities) may be examined to
highlight their important features.Periodicity. Both the plane-wave and evanescent-wave
interference patterns are periodic and consist of a seriesof fringes of higher and lower relative intensity. The x = 0
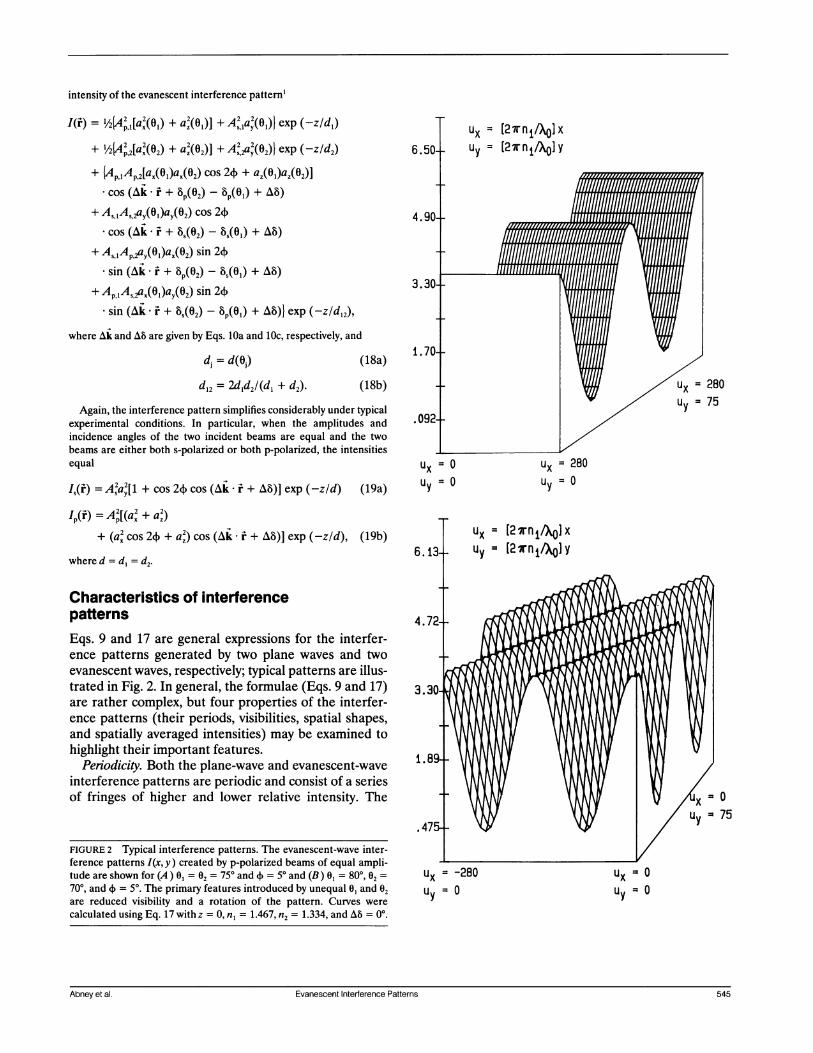
.475 - \-/ yFIGURE 2 Typical interference patterns. The evanescent-wave inter-ference patterns I(x, y) created by p-polarized beams of equal ampli-tude are shown for (A)0, = 02 = 75° and + = 5° and (B)0 = 800, 02 = UX= 20 X700, and 4 = 5°. The primary features introduced by unequal 0, and 02 Uy = 0 Uy = 0
are reduced visibility and a rotation of the pattern. Curves were
calculated using Eq. 17 with z = 0, n, = 1.467, n2 = 1.334, and AfS = 00.
Abney et al Evanescent Interterence Patterns 545
Abney et al. Evanescent Interference Patterns 545
vector period P specifies the distance and direction over
which the patterns repeat themselves. The period P can
be determined from the expression
Ak P = 2'rr (20)
as described below.For interfering plane waves, k, = k, = k, and so it
follows (Eqs. 2b, 4cd, and lOb) that
Ak = (4'rrn2/Xo) sin 49.
-4c
O ,=11.
X
J~
(21)
The interference pattern is therefore periodic along they-axis, or perpendicular to the bisector of k1 and k2.Specifically,
Ppw = (X0/n2)/(2 sin 4)), (22)
where X0/n2 is the wavelength of light in a medium withrefractive index n2.
For interfering evanescent waves, the propagationnumbers k(01) and k(02) are not necessarily equal (Eq.14i). Thus (Eqs. lOa and 16c,d),
Ak = [k(01) - k(02)] cos 0x + [k(0,) + k(02)] sin 4)y (23)
and the evanescent-wave interference pattern is ingeneral periodic along a direction, Ak, that is notparallel to 9. The magnitude of the evanescent-waveperiod Pew may be obtained by noting that Pew is parallelto Ak and then inserting Eqs. 23 and 14i into Eq. 20. Theresult is
Pew = (Xo/n1)/(sin2 01 + sin2 02- 2 sin 0, sin 02 cos 24))1/2 (24a)
Collision Angle
a)
cm--
4-acc
Pew = (0I/n1)/(2 sin 0 sin 4) for 0 = 01 = 02 (24b)
where A0/n, is the wavelength of light in medium 1.The plane-wave and evanescent-wave periods are
compared in Fig. 3. A rather subtle difference betweenthe two periods is that their magnitudes (Eqs. 22 and24b) are not in general equal (Fig. 3 a). Even if the twoevanescent waves are created by beams with equalincidence angles, Pew is smaller than P, by a factor ofsin Oc/sin 0 (Eq. 12). Nevertheless, for a fixed collisionangle, the magnitudes of the periods generally will differby at most 10% (for a quartz/water interface) and will beequal when 0 = Oc (i.e., when the evanescent waves are
transverse). <A more striking difference between the periods Pew
and PPW is that the former lies along a direction that isrotated about the z-axis by an angle given by
sin 4) (sin 01 + sin 02)1Cos
(i 01 + sin2 02- 2 sin 0, sin 02cos 24) 1/2]*
This rotation arises because the evanescent-wave propa-
gation numbers are functions of the incidence angles
Collision Angle q5
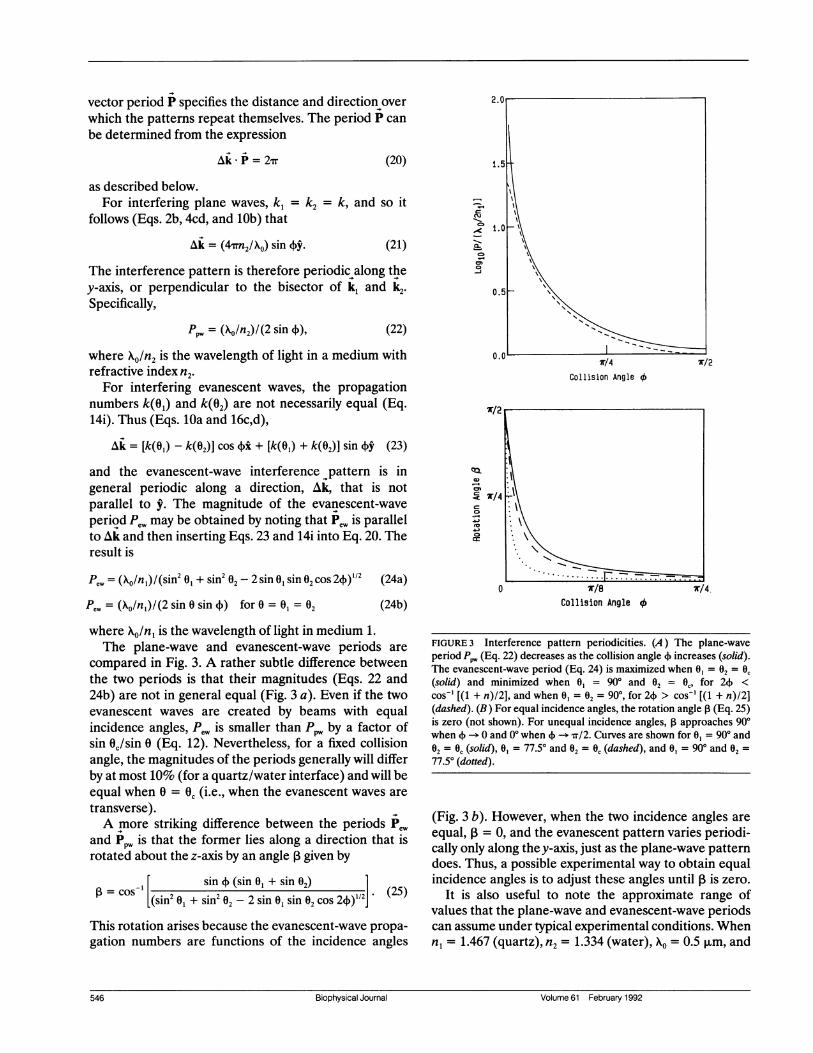
FIGURE 3 Interference pattern periodicities. (A) The plane-waveperiod Pp,,, (Eq. 22) decreases as the collision angle + increases (solid).The evanescent-wave period (Eq. 24) is maximized when 01 = 02 = Oc(solid) and minimized when 0, = 900 and 02 = Oc, for 2+ <cos-' [(1 + n)/2], and when 0, = 02 = 90°, for 24 > cos' [(1 + n)/2](dashed). (B) For equal incidence angles, the rotation angle a (Eq. 25)is zero (not shown). For unequal incidence angles, ,3 approaches 90°when +O-0 and 00 when 4 -+* n/2. Curves are shown for 01 = 900 and02 = Oc (solid), 0, = 77.5° and 02 = OC (dashed), and 0, = 900 and 02 =77.50 (dotted).
(Fig. 3 b). However, when the two incidence angles are
equal, = 0, and the evanescent pattern varies periodi-cally only along they-axis, just as the plane-wave patterndoes. Thus, a possible experimental way to obtain equalincidence angles is to adjust these angles until 13 is zero.
It is also useful to note the approximate range ofvalues that the plane-wave and evanescent-wave periodscan assume under typical experimental conditions. Whenn, = 1.467 (quartz), n2 = 1.334 (water), Xe = 0.5 jum, and
546 Biophysical Journal Volume 61 February 1992546 Biophysical Journal Volume 61 February 1992
01 = 02 = 750, PP ranges from 0.187 jm (4) = 900) to 5.37,um (4 = 20) and Pew ranges from 0.176 ,um (4 = 90°) to5.06 ,um (4) = 20).
Finally, the expressions for the periods obtained herediffer from those used in previous analyses of evanescent-wave interference experiments. In the past, evanescent-wave interference has been modeled as simple p-polar-ized plane-wave interference (21-23). Because thisapproximation is not rigorously correct, it is not surpris-ing that the expressions derived here differ somewhatfrom those published previously. Nevertheless, the plane-wave approximation will give fairly accurate answersunder many experimental conditions.
Visibility. Both interference patterns consist of fringesthat alternate spatially between higher and lower rela-tive intensities. The contrast or distinctness of thefringes can be described by the visibility, V, defined as
V Iax -IminIm. +1min
(26)
where Im. and Imj. are the maximum and minimumintensities (24). The visibility ranges between one andzero and assumes these extreme values when the con-trast is maximal (Imi. = 0, V = 1) or minimal (Ima. =IminW V = 0), respectively.The plane-wave visibility can be determined from Eqs.
26 and 9. Because in general V is a rather complicatedfunction of polarizations, amplitudes, etc., here it isanalyzed only for two important special cases. In the firstcase, both plane waves are s-polarized (i.e., a, = 90°);the intensity is then given by Eq. lla. The maxima andminima of this function, Imax and min, for a fixed value of4), are attained when the second cosine term in Eq. 1 laassumes the values + 1 and -1, respectively. Thus, thevisibility of the plane-wave interference pattern fors-polarization is given by the relatively simple expression
Z4s,lAs21cos 2(+Vs =
A 2 + A 2
Vs= Icos24)I forAs, =As2'
tudes, and the two refractive indices. Also, if theincidence angles are not equal, the visibility depends onthe distance from the interface (z). However, the expres-sion for V simplifies considerably if the incident beamsare either both s-polarized or both p-polarized. If bothincident waves are s-polarized, the visibility V, is
2A4s,As,21cos 2+41cos 01 cos 02 exp (-z1d,2)As1 cos2 01 exp (-zId,) + As2 cos2 02 exp (-z/d2)
Vs= Icos2+1 for 0, = 02 and As, =As,2
(29a)
(29b)
If both incident waves are p-polarized, the visibility is
Tv
2X(0I)X(02)Ap,,Ap,2 cos 01 cos 02{[(sin2 0, - n2)* (sin2 02 - n2)]1"2 cos 2+ + sin 0, sin 021 exp (-zld,2)
V -,p Ap,X2(02) COS2 0,(2 sin2 01 - n2) exp (-zId,)+ Ap2X2(0I) cos2 02(2 sin2 02 - n2) exp (-zId2)
(30a)
(sin' 0 - n2) cos 2(> + sin2 0VP =
2 sin2 0-n2for 0, = 02 and Ap', =Ap,2. (30b)
The plane-wave and evanescent-wave visibilities arecompared in Fig. 4 for the special cases in which the twoincident beams are both s-polarized or both p-polarizedand the amplitudes and incidence angles are equal. Ifboth beams are s-polarized, the plane-wave and evanes-
1.0
4-a
.0
(27a) c,,0.5
(27b)
In the second case, both plane waves are p-polarized(i.e., ao = 00). The visibility is then given by
_2Ap,lAp,2VPA2+A2 2Ap,l Ap,2
0.00
(28a)
7r/4Collision Angle q5
065.50680720770900
7/2
Vp = 1 forAp1, =AP2 (28b)
Eqs. 27 and 28 show that both visibilities are maximalwhen the amplitudesA, andAp are equal.The evanescent-wave visibility can be determined
from Eqs. 26 and 17 and is a fairly complicated functionof the beam polarizations, incidence angles and ampli-
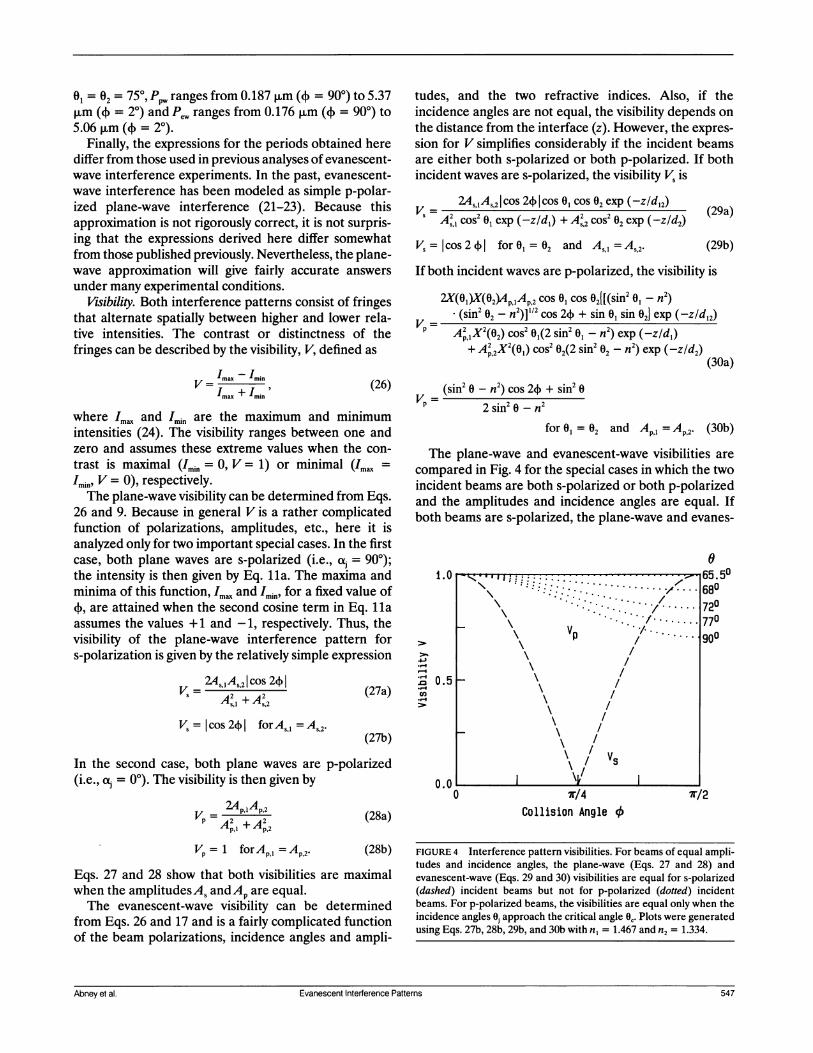
FIGURE 4 Interference pattern visibilities. For beams of equal ampli-tudes and incidence angles, the plane-wave (Eqs. 27 and 28) andevanescent-wave (Eqs. 29 and 30) visibilities are equal for s-polarized(dashed) incident beams but not for p-polarized (dotted) incidentbeams. For p-polarized beams, the visibilities are equal only when theincidence angles Oi approach the critical angle O. Plots were generatedusing Eqs. 27b, 28b, 29b, and 30b with n1 = 1.467 and n2 = 1.334.
Abe ta.Eaecn4
I *I !j ; .w . j:W,i . ....-\ *1/
/~~~~~~
\\ ,/ Vs
l \j,/l
Abney et al. Evanescent Interference Patterns 547
cent-wave visibilities are equal (Eqs. 27b and 29b). Inthis case, the visibility varies as Icos 241 and thereforedecreases with increasing collision angle (up to = rl
4). In contrast, if both beams are p-polarized, theplane-wave and evanescent-wave visibilities differ, even
if the incidence angles are equal (Eqs. 28b and 30b). Theplane-wave visibility equals one for all collision angles,whereas the evanescent-wave visibility is a function ofthe collision angle and assumes values smaller than one.
However, as the incidence angles approach the criticalangle Oc (i.e., as the evanescent waves become trans-verse), the plane-wave and evanescent-wave visibilitiesbecome identical even if the light is p-polarized.
It is also useful to note the magnitude of the plane-wave and evanescent-wave visibilities under typical exper-imental conditions. When 4) = 100, 0 = 750, and n =
1.334/1.467, the plane-wave visibilities are Vs = 0.94 andVp = 1, and the evanescent-wave visibilities are V, = 0.94and Vp = 0.99.
Finally, the largest visibilities typically define the mostdesirable experimental conditions. For s-polarized inci-dent beams and a fixed value of 4), the largest visibility isobtained for equal incidence amplitudes and incidenceangles. For p-polarized incident beams and a fixed valueof 4), the largest visibility is obtained for equal incidenceamplitudes and both incidence angles equal to Oc.
Shapes of interference patterns. Although plane-waveinterference patterns always vary spatially as a singlecosine term (Eq. 9), evanescent-wave interference pat-terns generally depend on a superposition of severalphase-shifted cosine terms (Eq. 17). However, for manyexperimental conditions, the evanescent-wave patternsalso vary as a single cosine. For example, if both beamsare either s-polarized or p-polarized, three of the lastfour terms in Eq. 17 equal zero, and the functional formfor the evanescent intensity reduces to a constant plus a
cosine term. Also, for many incidence angles and rela-tive refractive indices, ax << ay az, and the last twoterms in Eq. 17 are therefore negligible. When theseterms are small, t;he evanescent intensity varies as twocosine terms whose difference in phase, [8s(02) -
8s0l)] - [8p(02) - SP(0)], is zero when 01 = 02 and is < 3°(Eq. 14g) under almost all other experimental conditions.
Spatially averaged intensity. The spatially averagedintensities ja are given by the spatially independentterms in Eq. 9 and 17, because the spatially dependentterms average to zero. The general expressions forplane-wave (Eq. 31a) and evanescent-wave (Eq. 31b, atz = 0) interference are
P-'/2(A21 +A21 +A 2 +A 2) (31a)
l '/2A2 lj[a2(O1) + a2(0l)] + A2la2(01)}
+ /2AP,2[aX(02) + az'(02)] +As,a (02)}. (31b)
For a quartz/water interface, the factors [a '(0) + a'(0)]and a'(0) range between 5 and 0 for 0, < 0 < 90° (1);thus the average evanescent intensity at the interface(z = 0) may be several-fold higher than the sum of theintensities of the incident beams.
Application to TIR/FPPRIn recent experimental work, interfering evanescentfields and fluorescence pattern photobleaching recoveryhave been combined into the technique TIR/FPPR(21-23). In this technique, fluorescent molecules ad-sorbed to a liquid/solid interface are bleached andprobed with an evanescent interference pattern. Fluores-cence recovery then occurs as bleached molecules ex-
change with unbleached molecules by diffusing along thesurface or by associating and dissociating from thesurface. In this section, the theoretical foundation ofTIR/FPPR is developed.
If the surface affinity and site density are high enough,the dominant signal in a TIR/FPPR experiment arisesfrom molecules that are bound to the surface rather thanthose in solution near the surface (6, 7). In this case, themeasured fluorescence will be related to the evanescentintensity at the interface (z = 0). For interfering beamswith equal incidence angles, amplitudes, and polariza-tions, this intensity may be written in the form
I(y) = IP[1 + Vcos (2'rry/Pew + As)]) (32)
where Pa is the spatially averaged intensity (Eq. 31b), Visthe visibility (Eqs. 29b and 30b), and Pew is the period(Eq. 24b).The time-dependent fluorescence recovery F(t) follow-
ing photobleaching is approximately equal to
F(t) = Q fo I(y)C(y, t) dy, (33)
where Q is a proportionality constant and C(y, t) is thesurface concentration of unbleached fluorescent mole-cules at time t and position y. Eq. 33 assumes that thefluorophore absorption dipoles are isotropically ori-ented and homogeneously distributed. The equationalso neglects the (often small) effects of the nearbyplanar dielectric interface on the angular dependence ofthe fluorescence emission and the influence of themicroscope collection optics on the fluorescence collec-tion efficiency.
C(y, t) is given by the solution of the appropriatediffusion equation (see below), subject to the initialconcentration distribution (25)
C(y, 0) = C exp [- KIb(y)]
C(y, 0) = C [1 - KIb(y)] for KIa << 1,
(34a)
(34b)
548 Biophysical Journal Volume 61 February 1992
548 Biophysical Journal Volume 61 February 1992
where Ib(y) is the bleaching beam intensity profile,which is assumed to be proportional to Eq. 32. In Eq. 34,K is a parameter proportional to the bleaching durationand efficiency, and C is the total surface density ofbleached and unbleached fluorescent molecules. Theapproximation given in Eq. 34b is valid for low bleachingdepths. The prebleach fluorescence F(-) is obtainedfrom Eq. 33 when C(y, t) = C.
Lateral diffusion. In some samples, fluorescent mole-cules remain bound to the surface, and the fluorescencerecovery results only from lateral diffusion along theinterface. Solving the diffusion equation for C(y, t)subject to the initial condition given in Eq. 34a (assum-ing that mobile and immobile molecules are bleachedwith equal efficiencies) and inserting C(y, t) into Eq. 33yields the following normalized fluorescence recovery
F(t)IF(-) = exp (-ii){Io(inV) - V11('V)
+ -yV!QqV)[1 - exp (-(2ir/Pe,)2D5t)]1 (35a)
F(t)IF(-) = (1 - q - 1/2V2-)
+ 1/2V%jy{1 - exp [-(2rr/PeW)2D,t]I for X << 1, (35b)
where y is the fraction of the fluorescent molecules thatare mobile, Ds is the lateral diffusion coefficient ofadsorbed molecules, IO and I, are modified Besselfunctions, and
= KIb. (36)
When V = 1 and -y = 1, Eq. 35a reduces to a previouslypublished expression obtained for epi-illumination pat-tern photobleaching with interference fringes (26); whenV = 1, Eq. 35b reduces to a previously publishedexpression obtained assuming the p-polarized plane-wave approximation for the evanescent-interferenceillumination pattern (21, 22).The fractional fluorescence recovery R associated
with Eq. 35 is given by
[F(oo) - F(O)][F(-)- F(O)]
ye exp (- i) V
1 - exp (--n)[Io(-qV) - V71(-nV)](37a)
R =,yV2/(2 + V2) fori << 1. (37b)
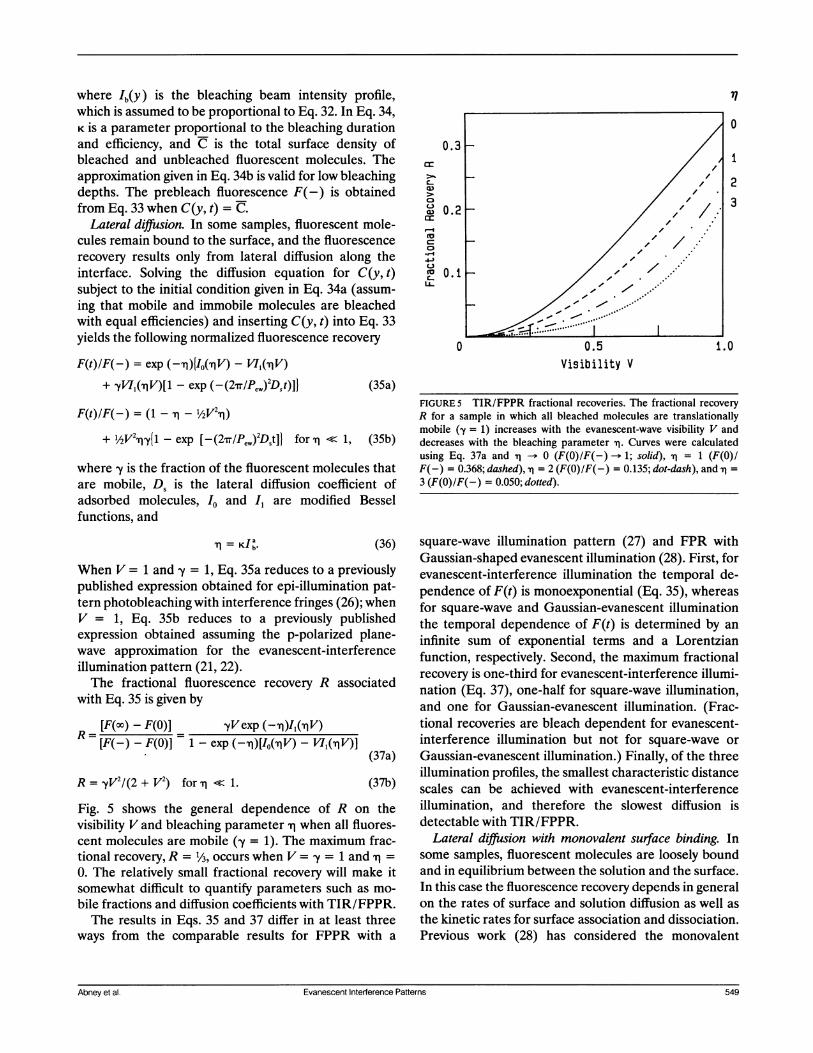
Fig. 5 shows the general dependence of R on thevisibility V and bleaching parameter X when all fluores-cent molecules are mobile (y = 1). The maximum frac-tional recovery, R = 1/3, occurs when V = y = 1 and Xi =0. The relatively small fractional recovery will make itsomewhat difficult to quantify parameters such as mo-
bile fractions and diffusion coefficients with TIR/FPPR.The results in Eqs. 35 and 37 differ in at least three
ways from the comparable results for FPPR with a
0.3a:
>
X 0.2
cctoa
.1-
X 0.1C-
0
/ 0
,'1/I
2
3
1.00.5Visibility V
FIGURE 5 TIR/FPPR fractional recoveries. The fractional recoveryR for a sample in which all bleached molecules are translationallymobile (y = 1) increases with the evanescent-wave visibility V anddecreases with the bleaching parameter -q. Curves were calculatedusing Eq. 37a and q -- 0 (F(O)IF(-) -+ 1; solid), -i = 1 (F(O)IF(-) = 0.368; dashed), q = 2 (F(O)IF(-) = 0.135; dot-dash), and q =3 (F(O)/F(-) = 0.050; dotted).
square-wave illumination pattern (27) and FPR withGaussian-shaped evanescent illumination (28). First, forevanescent-interference illumination the temporal de-pendence of F(t) is monoexponential (Eq. 35), whereasfor square-wave and Gaussian-evanescent illuminationthe temporal dependence of F(t) is determined by an
infinite sum of exponential terms and a Lorentzianfunction, respectively. Second, the maximum fractionalrecovery is one-third for evanescent-interference illumi-nation (Eq. 37), one-half for square-wave illumination,and one for Gaussian-evanescent illumination. (Frac-tional recoveries are bleach dependent for evanescent-interference illumination but not for square-wave or
Gaussian-evanescent illumination.) Finally, of the threeillumination profiles, the smallest characteristic distancescales can be achieved with evanescent-interferenceillumination, and therefore the slowest diffusion isdetectable with TIR/FPPR.
Lateral diffusion with monovalent surface binding. Insome samples, fluorescent molecules are loosely boundand in equilibrium between the solution and the surface.In this case the fluorescence recovery depends in generalon the rates of surface and solution diffusion as well as
the kinetic rates for surface association and dissociation.Previous work (28) has considered the monovalent
Abney et al. Evanescent Interference PatternsAbney et al. Evanescent Interference Patterns 549
surface reaction
konA+B-C. (38)
kfl
For this binding mechanism, and in the limit of lowbleaching, the shape of the fluorescence recovery isdescribed by
F(t) = F(-) + [F(O) - F(-)]g(t) (39a)
1I(q) IS(q, t) d2qg(t) = (39b)
I I(-) I1d2q(c) d2q
where the integrals are over all two-dimensional space,
I(q) is the Fourier transform of I(r), and S(q, t) is a
rather complicated (but analytically known) functionthat depends on ko., k.ff, A, D, the total surface sitedensity, the solution diffusion coefficient, and the spatialparameters of I(r'). The function g(t) ranges from one (att = 0) tozero (as t-oo).
The ability to evaluate Eq. 39b analytically is criticallydependent upon the functional form for the illuminationpattern. For the spatial intensity profile generated by a
totally internally reflected Gaussian-shaped laser beam(an elliptical Gaussian), the complexity of the functionalform for S(q, t) dictates that the integral in Eq. 39b beevaluated numerically. This lack of a closed-form solu-tion significantly hinders curve-fitting in the analysis ofexperimental data. However, for the spatial intensityprofile generated by interfering evanescent waves (seeEq. 32)
II(4) 12 C 8(q) + V2[8(4 + 2 1IPew) + 8(q 2iTy/Pew)]/4 (40)
where the 8( ) are Dirac delta functions. Therefore, inthis latter case, the integral in Eq. 39b can be evaluatedanalytically, yielding
S(0, t) + 1/2V2S(2,r/Pew, t)
g(t) 1 + I/2V2 (41)
When bleached molecules do not exchange with thesolution (kon >> kff), S(q, t) reduces to the exponentialfactor in Eq. 35b (see reference 28).
Application to experimentalverification of evanescent fieldpolarizationsEvanescent waves are predicted to have unusual polar-ization properties (Eqs. 14). These polarization proper-ties allow measurement of unique characteristics of theorientation distributions of adsorbed fluorescent mole-cules (10-14) and may be useful for investigating aniso-
tropic rotational motions of adsorbed fluorescent mole-cules (11). Although such measurements require a
quantitative understanding of the evanescent field polar-ization, the theoretical polarization expressions (Eqs.14) are not readily verified experimentally. In thissection, the interference results are used to design twopossible experimental tests of the predicted polarizationproperties of evanescent fields.One method of confirming the theoretically predicted
evanescent field polarizations might be measurement ofthe spatially averaged intensity of an evanescent interfer-ence pattern generated by fluorescent molecules at z = 0whose spatial distribution and orientation are random.Specifically, assume that two beams of equal amplitudesand incidence angles are incident on such a sample.Then if one incident beam is either s-polarized (a, = 900)or p-polarized (al = 00), and the polarization angle oa2 ofthe other is rotated through all possible values, thespatially averaged intensity will vary with oa2 as (Eqs. 3 lb)
(42)
where
a2(0) - a2(0) + a2(0)a2(0) + a2(o) + a2(0)
a2(0) - a2(O) + a2(o)
Pr~(0) 2[ax(0) + az(O)]
(43a)
(43b)
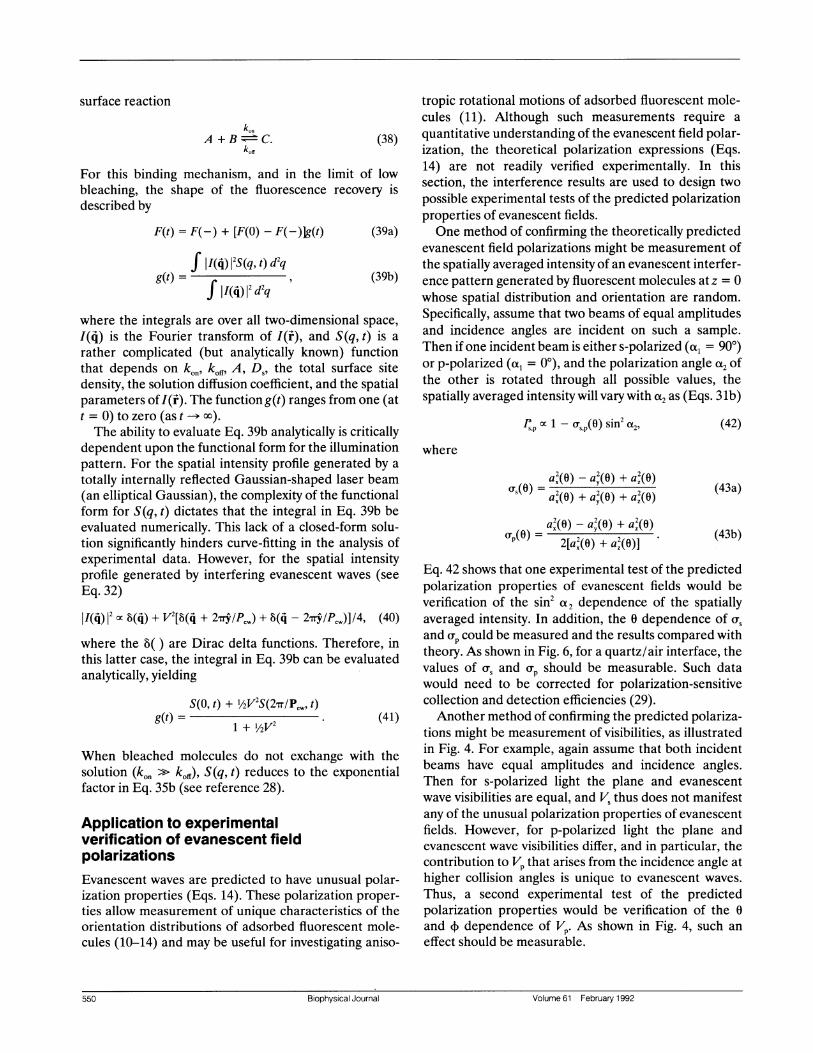
Eq. 42 shows that one experimental test of the predictedpolarization properties of evanescent fields would beverification of the sin2 (X2 dependence of the spatiallyaveraged intensity. In addition, the 0 dependence of asand op could be measured and the results compared withtheory. As shown in Fig. 6, for a quartz/air interface, thevalues of as and up should be measurable. Such datawould need to be corrected for polarization-sensitivecollection and detection efficiencies (29).Another method of confirming the predicted polariza-
tions might be measurement of visibilities, as illustratedin Fig. 4. For example, again assume that both incidentbeams have equal amplitudes and incidence angles.Then for s-polarized light the plane and evanescentwave visibilities are equal, and Vs thus does not manifestany of the unusual polarization properties of evanescentfields. However, for p-polarized light the plane andevanescent wave visibilities differ, and in particular, thecontribution to Vp that arises from the incidence angle athigher collision angles is unique to evanescent waves.
Thus, a second experimental test of the predictedpolarization properties would be verification of the 0and + dependence of Vp. As shown in Fig. 4, such an
effect should be measurable.
55 ipyia oraeray19
S,poc 1 u,,P(O) sin' %,
Volume 61 February 1992550 Biophysical Journal
0.4
a 0.3
c-0 . 2 _n--__________a)2
E
C-1e 0.1e. n_______ - 1. 334
0.0 I40 50 60 70 80 90
Incidence Angle 0 (degrees)
FIGURE 6 Dependence of the parameters a, and up on the incidenceangle 0. Plots are for incident beams of equal amplitudes andincidence angles 0. The variations cr, (solid) and cp (dashed) in theaverage intensity of an evanescent interference pattern depend on 0and the polarization of the other beam (s, p). Curves were calculatedfrom Eqs. 43 and 14 d-f using n, = 1.467 and n2 = 1 (air, top), and n2 =1.334 (water, bottom).
SUMMARY
Previous experimental work has demonstrated that spa-tially periodic intensity patterns are generated by inter-fering evanescent fields. In this paper, a general theoret-ical description of the shapes of evanescent interferencepatterns has been developed. The theory provides abasis for experimentally optimizing the TIR/FPPR tech-nique and for quantitatively analyzing TIR/FPPR data.Experiments in which the characteristics of evanescentinterference patterns might be used to confirm previoustheoretical predictions for evanescent field polarizationshave also been described. The theoretical results forevanescent interference patterns obtained here may alsobe applicable in spectral regions other than the visible.
We thank Daniel Axelrod of the University of Michigan for helpfulcomments.
This work was supported by National Institutes of Health grantGM-37145 to Dr. Thompson and by a Camille and Henry DreyfusFoundation Teacher-Scholar Award also to Dr. Thompson.
Received for publication 13 May 1991 and in final form 10October 1991.
REFERENCES
1. Axelrod, D., T. P. Burghardt, and N. L. Thompson. 1984. Totalinternal reflection fluorescence. Annu. Rev. Biophys. Bioeng. 13:247-268.
2. Mahan, A. I., and C. V. Bitterli. 1978. Total internal reflection: adeeper look. Applied Optics. 17:509-519.
3. Hellen, E. H., R. M. Fulbright, and D. Axelrod. 1988. Totalinternal reflection fluorescence: theory and applications atbiosurfaces. In Spectroscopic Membrane Probes. L. M. Loew,editor, CRC Press, Boca Raton, FL. 47-79.
4. Axelrod, D. 1981. Cell-substrate contacts illuminated by totalinternal reflection fluorescence. J. Cell. Bio. 89:141-145.
5. Lanni, F., A. S. Waggoner, and D. L. Taylor. 1985. Structuralorganization of interphase 3T3 fibroblasts studied by totalinternal reflection fluorescence microscopy. J. Cell. Bio. 100:1091-1102.
6. Pisarchick, M. L., and N. L. Thompson. 1990. Binding of amonoclonal antibody and its Fab fragment to supported phospho-lipid monolayers measured by total internal reflection fluores-cence microscopy. Biophys. J. 58:1235-1249.
7. Poglitsch, C. L., M. T. Sumner, and N. L. Thompson. 1991.Binding of IgG to moFc-yRII purified and reconstituted intosupported planar membranes as measured by total internalreflection fluorescence microscopy. Biochemistry. 30:6662-6671.
8. Kalb, E., J. Engel, and L. K. Tamm. 1990. Binding of proteins tospecific target sites in membranes measured by total internalreflection microscopy. Biochemistry. 29:1607-1613.
9. Sui, S., T. Uromow, and E. Sackmann. 1988. Interaction of insulinreceptors with lipid bilayers and specific and nonspecific bindingof insulin to supported membranes. Biochemistry. 27:7463-7469.
10. Hlady, V., J. Rickel, and J. D. Andrade. 1988/1989. Fluorescenceof adsorbed protein layers. II. Adsorption of human lipoproteinsstudied by total internal reflection intrinsic fluorescence. Col-loids Surfaces. 34:171-183.
11. Darst, S. A., C. R. Robertson, and J. A. Berzofsky. 1988.Adsorption of the protein antigen myoglobin affects the bindingof conformation-specific monoclonal antibodies. Biophys. J.53:533-539.
12. Thompson, N. L., H. M. McConnell, and T. P. Burghardt. 1984.Order in supported phospholipid monolayers detected by thedichroism of fluorescence excited with polarized evanescentillumination. Biophys. J. 46:739-747.
13. Timbs, M. M., and N. L. Thompson. 1990. Slow rotationalmobilities of antibodies and lipids associated with substrate-supported phospholipid monolayers as measured by polarizedfluorescence photobleaching recovery. Biophys. J. 58:413-428.
14. Fraaije, J. G. E. M., J. M. Lleijn, M. Van der Graaf, and J. C. Dijt.1990. Orientation of adsorbed cytochrome c as a function of theelectrical potential of the interface studied by total internalreflection fluorescence. Biophys. J. 57:965-975.
15. Burghardt, T. P., and D. Axelrod. 1983. Total internal reflectionfluorescence study of energy transfer in surface-adsorbed anddissolved bovine serum albumin. Biochemistry. 22:979-985.
16. Burghardt, T. P., and D. Axelrod. 1981. Total internal reflection/fluorescence photobleaching recovery study of serum albuminadsorption dynamics. Biophys. J. 33:455-467.
17. Burghardt, T. P., and N. L. Thompson. 1984. Evanescent intensityof a focused Gaussian light beam undergoing total internalreflection in a prism. Opt. Eng. 23:62-67.
18. Axelrod, D., R. M. Fulbright, and E. H. Hellen. 1986. Adsorptionkinetics on biological membranes: measurement by total inter-nal reflection fluorescence. In Applications of Fluorescence inthe Biomedical Sciences. D. L. Taylor, A. S. Waggoner, F.Lanni, R. F. Murphy, and R. Birge, editors. Alan R. Liss, NewYork. 461-476.
Abney et al. Evanescent Interference Patterns 551
19. Zimmerman, R. M., C. F. Schmidt, and H. E. Gaub. 1990.Absolute quantities and equilibrium kinetics of macromolecularadsorption measured by fluorescence photobleaching in totalinternal reflection. J. Colloid Interface Sci. 139:268-280.
20. Schmidt, C. F., R. M. Zimmerman, and H. E. Gaub. 1990.Multilayer adsorption of lysozyme on a hydrophobic substrate.Biophys. J. 57:577-588.
21. Tilton, R. D., A. P. Gast, and C. R. Robertson. 1990. Surfacediffusion of interacting proteins: effect of concentration on thelateral mobility of adsorbed bovine serum albumin. Biophys. J.58:1321-1326.
22. Tilton, R. D., C. R. Robertson, and A. P. Gast. 1990. Lateraldiffusion of bovine serum albumin adsorbed at the solid-liquidinterface. J. Colloid Interface Sci. 137:192-203.
23. Weis, R. M., K. Balakrishnan, B. A. Smith, and H. M. McConnell.1982. Stimulation of fluorescence in a small contact regionbetween rat basophil leukemia cells and planar lipid membranetargets by coherent evanescent radiation. J. Bio. Chem. 257:6440-6445.
24. Born, M., and E. Wolf. 1980. Principles of Optics, 6th ed.Pergamon, New York. 808 pp.
25. Axelrod, D., D. E. Koppel, J. Schlessinger, E. Elson, and W. W.Webb. 1976. Mobility measurement by analysis of fluorescencephotobleaching recovery kinetics. Biophys. J. 16:1055-1069.
26. Davoust, J., P. F. Devaux, and L. Leger. 1982. Fringe patternphotobleaching, a new method for the measurement of trans-port coefficients of biological macromolecules. EMBO (Eur.Mol. Bio. Organ.) J. 1:1233-1238.
27. Smith, B. A., and H. M. McConnell. 1978. Determination ofmolecular motion in membranes using periodic pattern photo-bleaching. Proc. Natl. Acad. Sci. USA. 75:2759-2763.
28. Thompson, N. L., T. P. Burghardt, and D. Axelrod. 1981.Measuring surface dynamics of biomolecules by total internalreflection fluorescence with photobleaching recovery or correla-tion spectroscopy. Biophys. J. 33:435-454.
29. Axelrod, D. 1989. Fluorescence polarization microscopy. MethodsCell Biol. 30:333-352.
552 Biophysical Journal Volume 61 February 1992